Indirect Effects Alter Coral Community...
63
Indirect Effects Alter Coral Community Composition Jada-Simone S. WHITE 3 March 2009 Pacific Science Intercongress, Tahiti
Transcript of Indirect Effects Alter Coral Community...
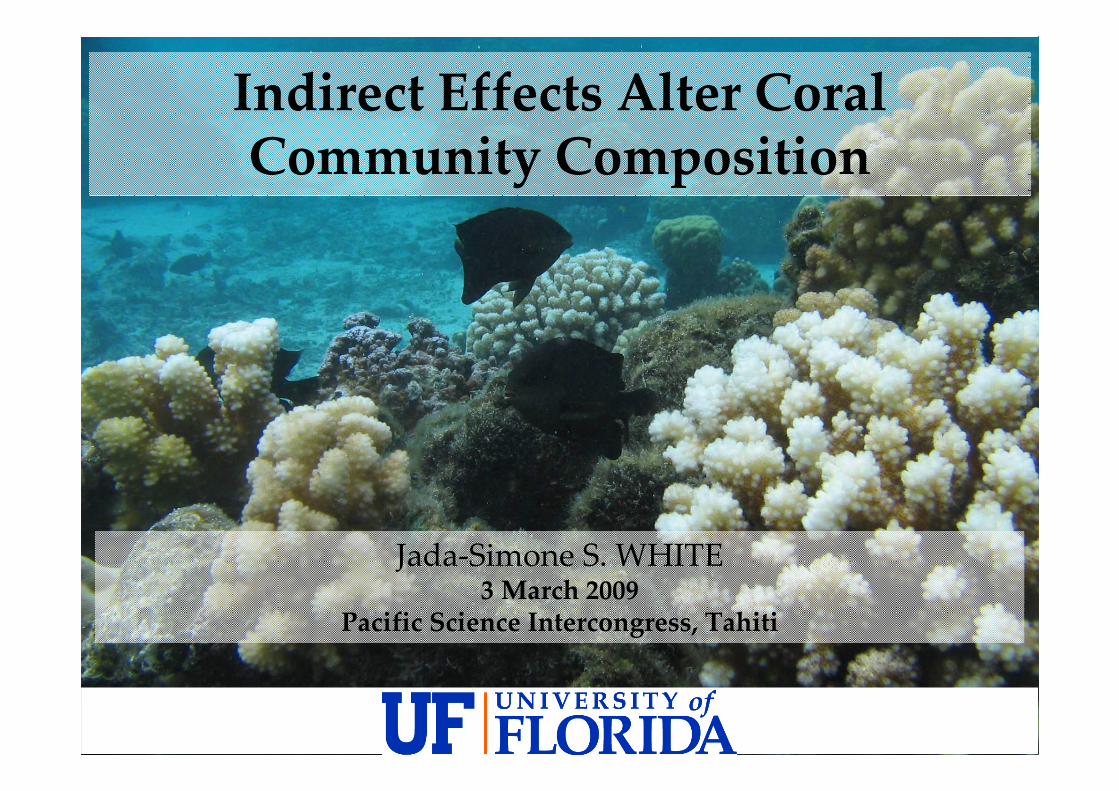
Indirect Effects Alter Coral Community Composition
Jada-Simone S. WHITE3 March 2009
Pacific Science Intercongress, Tahiti
SEMINAR FORMAT
I. Introduction
II. Experimental Test of Mechanisms
III. Demographic Context
IV. Implications
Introduction Mechanisms Demographics Implications

Ecosystem engineers create, modify, or maintain habitats. (Jones et al. 1994)
Stegastes nigricans
Dusky Farmerfish
Introduction Mechanisms Demographics Implications
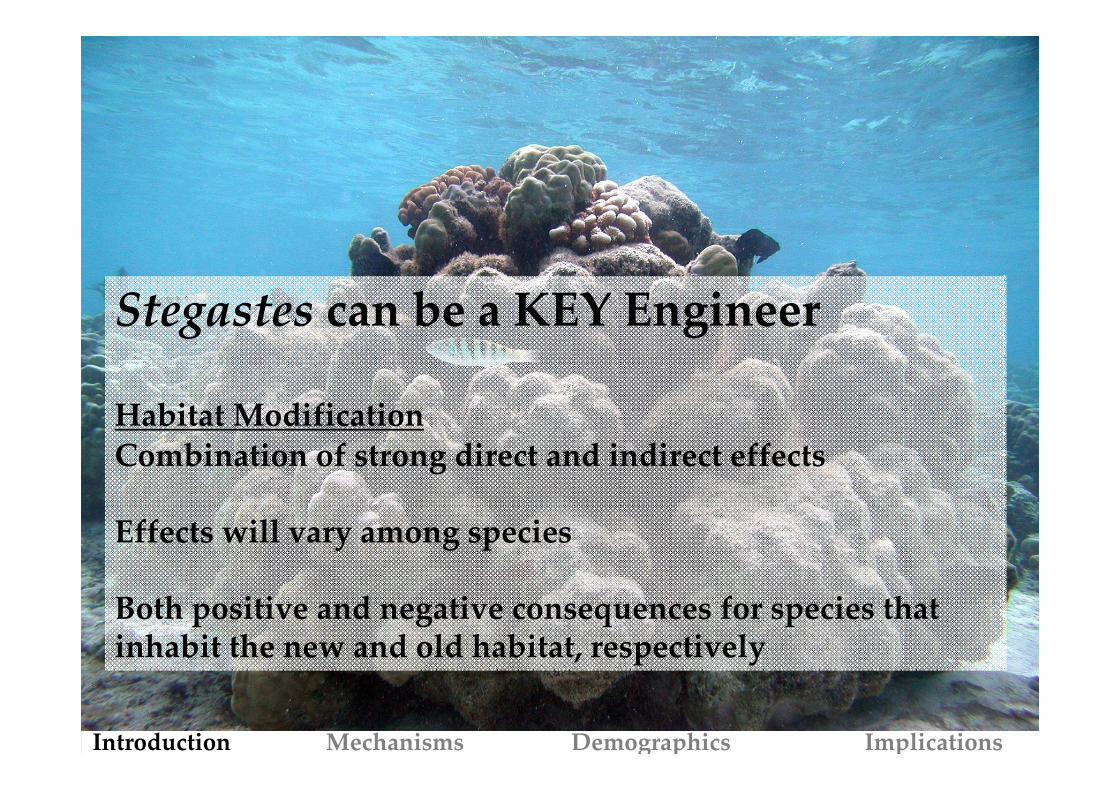
Stegastes can be a KEY Engineer
Habitat Modification
Combination of strong direct and indirect effects
Effects will vary among species
Both positive and negative consequences for species that inhabit the new and old habitat, respectively
Introduction Mechanisms Demographics Implications

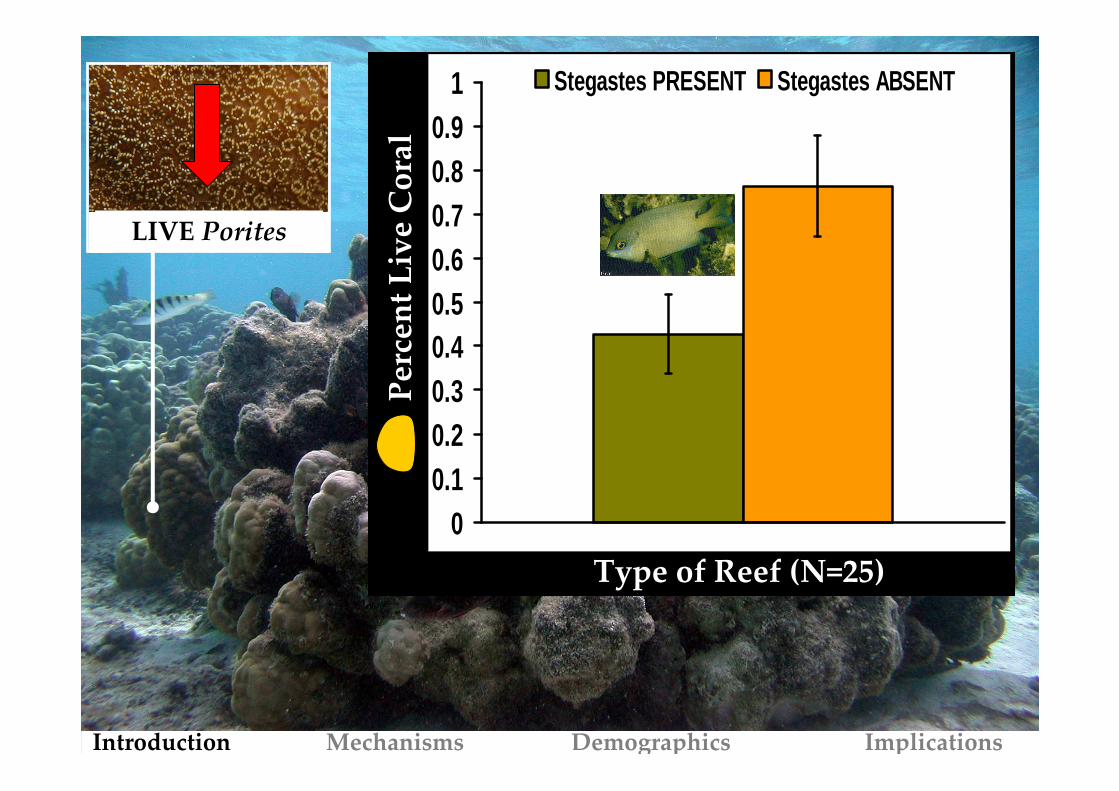
How can Stegastes modify coral composition?
Introduction Mechanisms Demographics Implications
Per
cen
t L
ive
Co
ral
00.10.20.30.40.50.60.70.80.9
1 Stegastes PRESENT Stegastes ABSENT
Type of Reef (N=25)
LIVE Porites
Introduction Mechanisms Demographics Implications

ALGAL TURF
Per
cen
t A
lgal
Tu
rf
0
0.2
0.4
0.6
0.8
1 Stegastes PRESENT Stegastes ABSENT
Type of Reef (N=25)
Introduction Mechanisms Demographics Implications
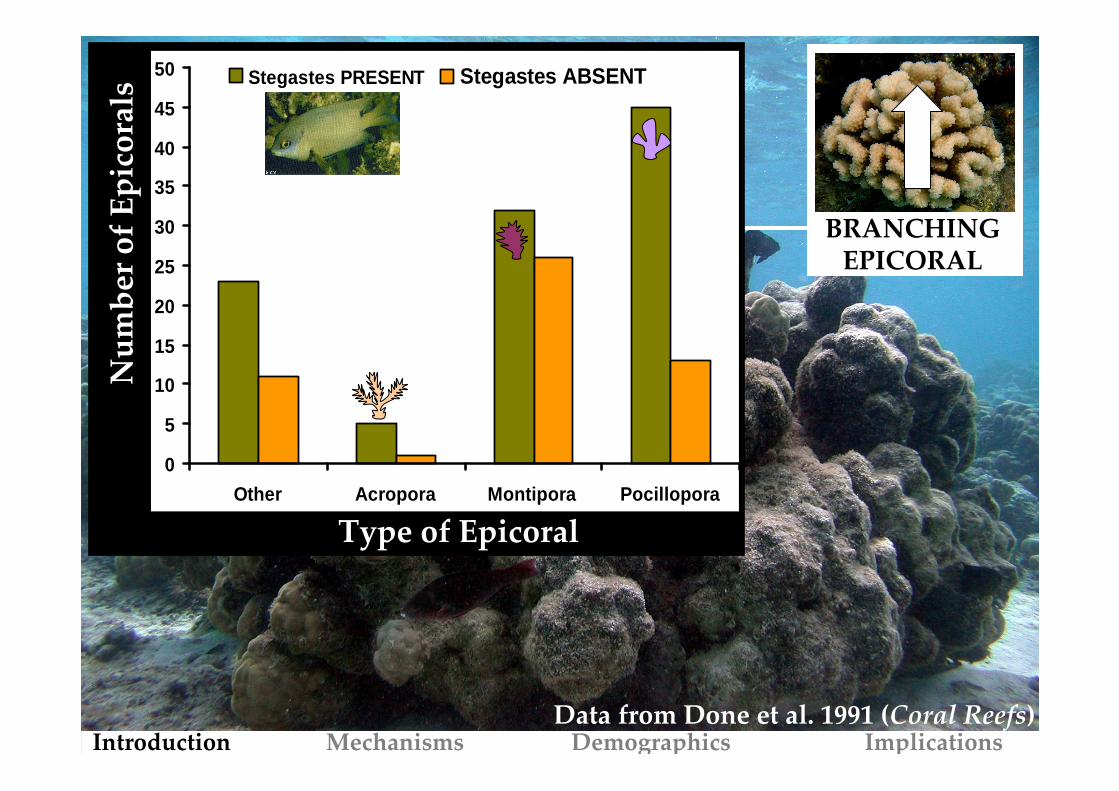
BRANCHINGEPICORAL
0
5
10
15
20
25
30
35
40
45
50
Other Acropora Montipora Pocillopora
Stegastes PRESENT Stegastes ABSENT
Nu
mb
er o
f E
pic
ora
ls
Type of Epicoral
Data from Done et al. 1991 (Coral Reefs)Introduction Mechanisms Demographics Implications
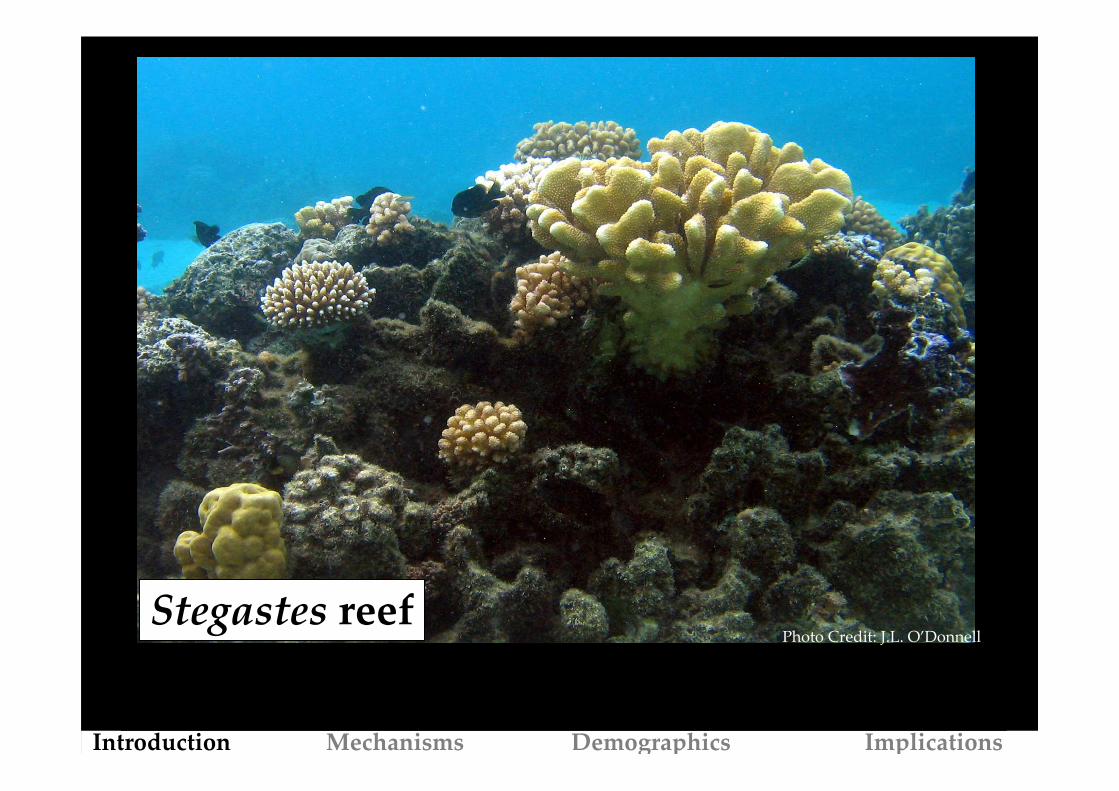
Stegastes reefPhoto Credit: J.L. O’Donnell
Introduction Mechanisms Demographics Implications

SIMPLE LAGOON COMMUNITY
StegastesStegastesStegastesStegastes Coral PredatorsCoral PredatorsCoral PredatorsCoral Predators
CoralsCoralsCoralsCoralsTurfTurfTurfTurf
HerbivoresHerbivoresHerbivoresHerbivores
Introduction Mechanisms Demographics Implications
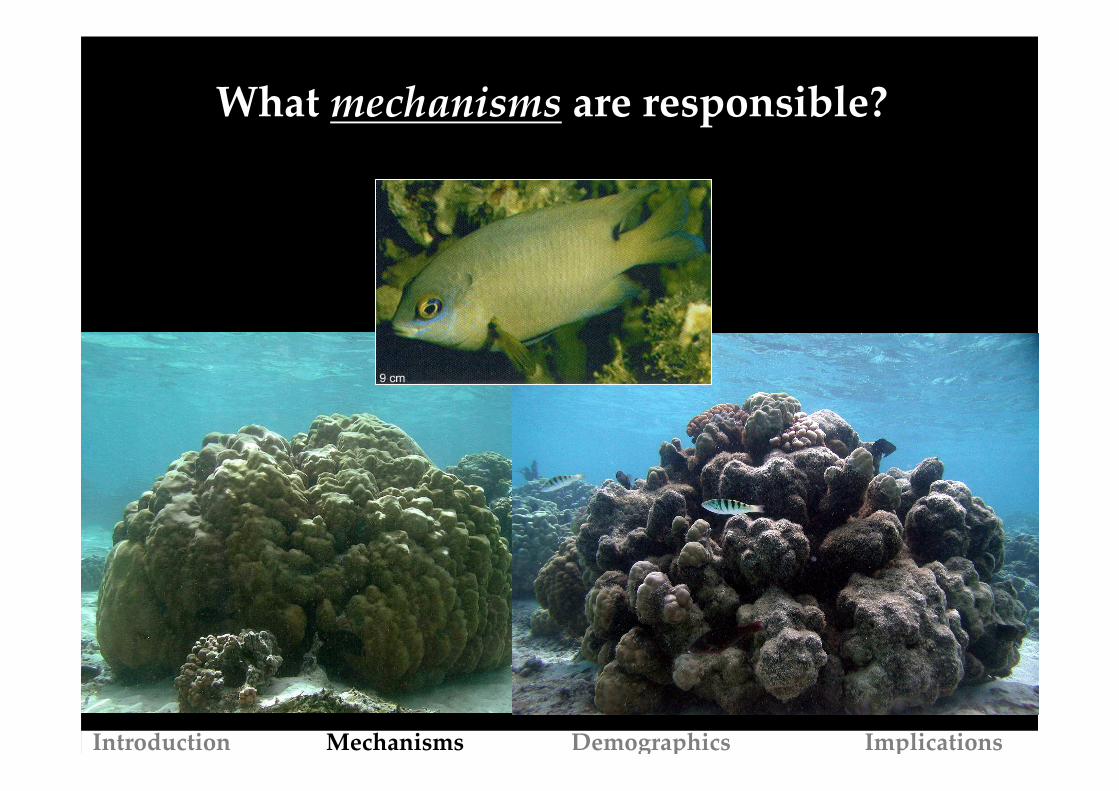
What mechanisms are responsible?
Introduction Mechanisms Demographics Implications
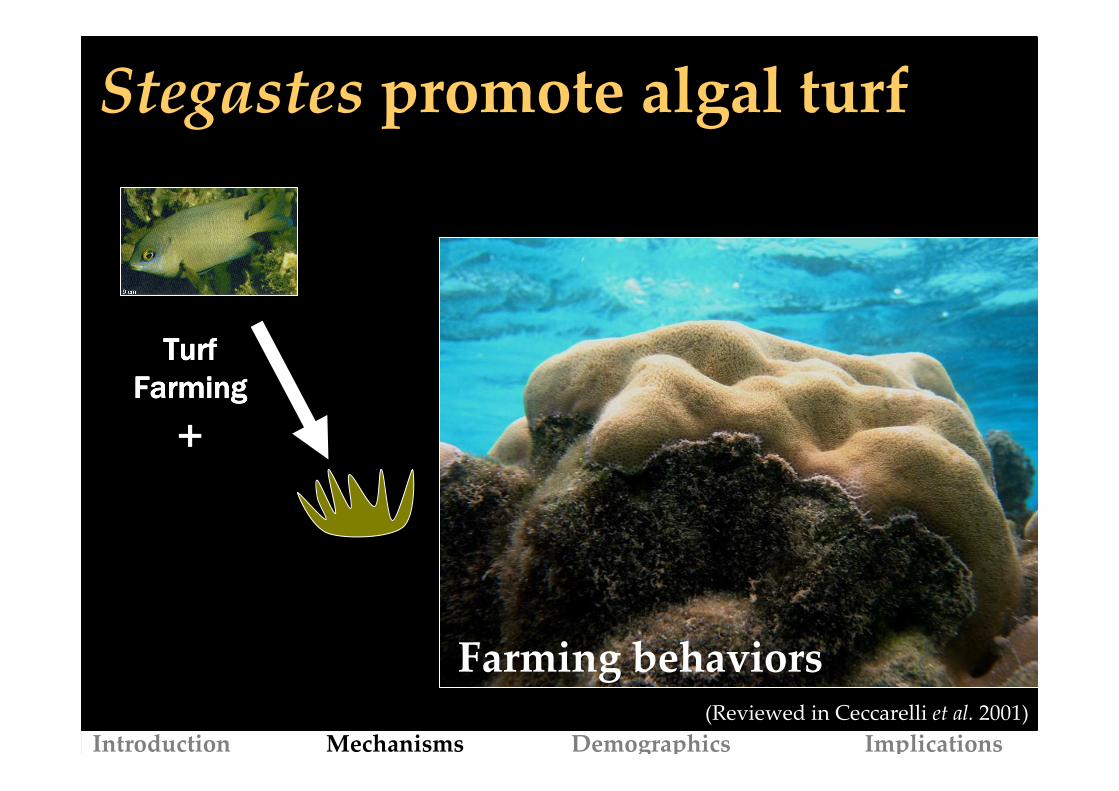
TurfTurfTurfTurfFarmingFarmingFarmingFarming
+
Stegastes promote algal turf
Farming behaviors(Reviewed in Ceccarelli et al. 2001)
Introduction Mechanisms Demographics Implications

CompetitionCompetitionCompetitionCompetition
–
Prediction 1:Competition with
farmed turf REDUCES coral growth &
survival
TurfTurfTurfTurfFarmingFarmingFarmingFarming
+
(Reviewed in McCook et al. 2001)
Introduction Mechanisms Demographics Implications

CorallivoresCorallivoresCorallivoresCorallivores
TerritorialityTerritorialityTerritorialityTerritoriality
–
(Galzin 1985; Letourneur 2000; White, unpubl. data)
Stegastes communally defend
TerritorialityTerritorialityTerritorialityTerritoriality
–
Photos : M
yers 1999
HerbivoresHerbivoresHerbivoresHerbivores
Egg PredatorsEgg PredatorsEgg PredatorsEgg Predators
(Gleason 1996, Letourneur 2000)
Introduction Mechanisms Demographics Implications

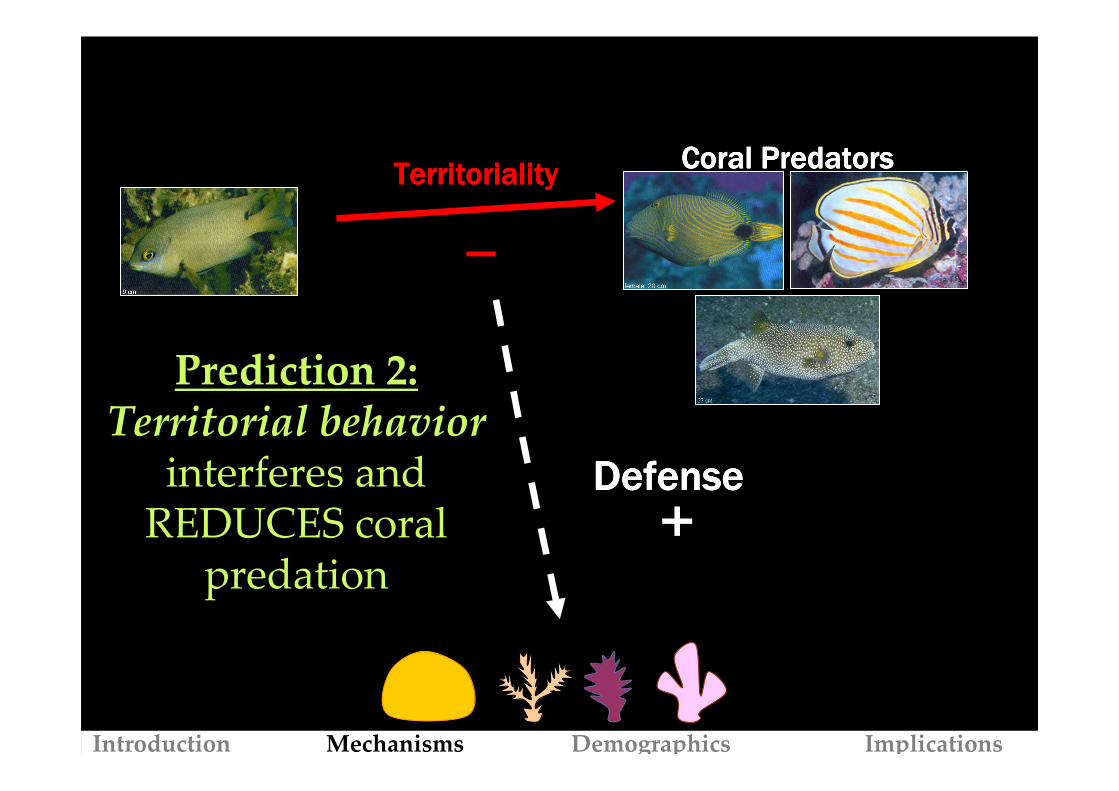
Coral PredatorsCoral PredatorsCoral PredatorsCoral PredatorsTerritorialityTerritorialityTerritorialityTerritoriality
–
PredationPredationPredationPredation–
(Reviewed in Rotjan and Lewis 2008)
Introduction Mechanisms Demographics Implications
Coral PredatorsCoral PredatorsCoral PredatorsCoral PredatorsTerritorialityTerritorialityTerritorialityTerritoriality
–
Prediction 2: Territorial behavior
interferes and REDUCES coral
predation
DefenseDefenseDefenseDefense+
TerritorialityTerritorialityTerritorialityTerritoriality
–
Introduction Mechanisms Demographics Implications

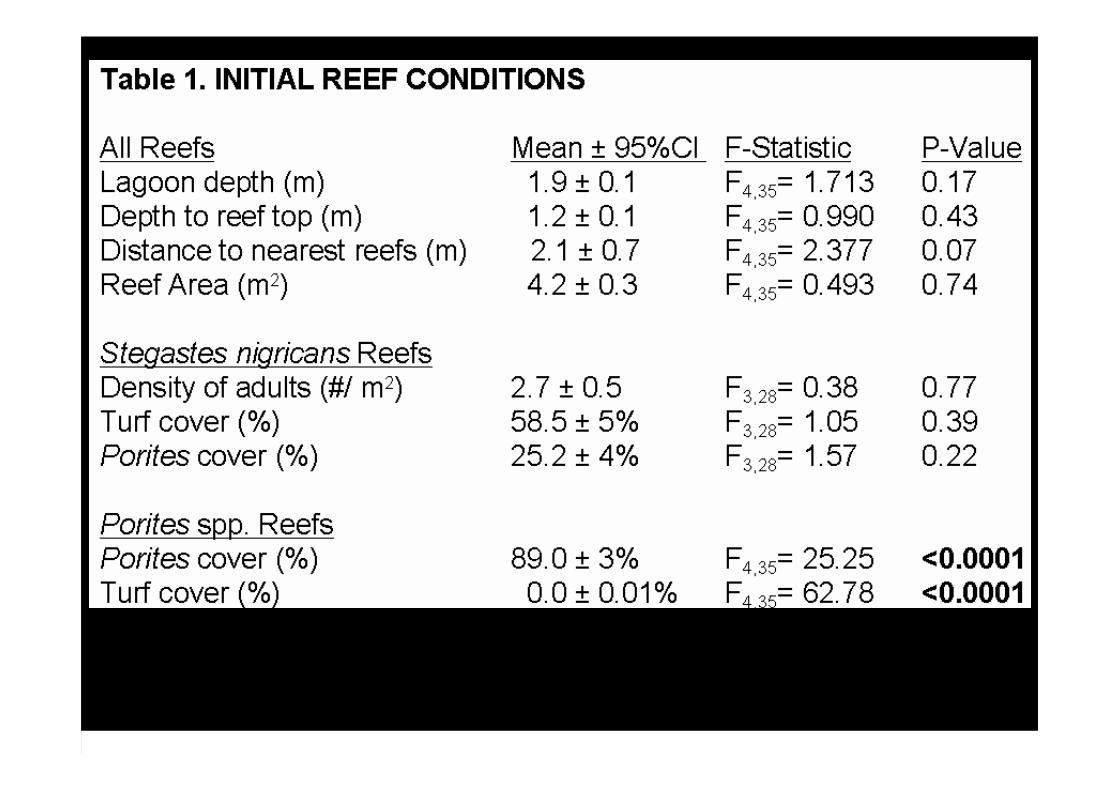
EXPERIMENTAL DESIGN
Turf
REMOVED
Turf
PRESENTTREATMENT
Stegastes
REMOVED
Stegastes
PRESENT
Turf
ABSENTTREATMENT
StegastesABSENT 0
Stegastes ABSENT reefs served as a control
32 Stegastes Reefs
8 Non-Stegastes Reefs
(White and O’Donnell, in prep.)
Introduction Mechanisms Demographics Implications
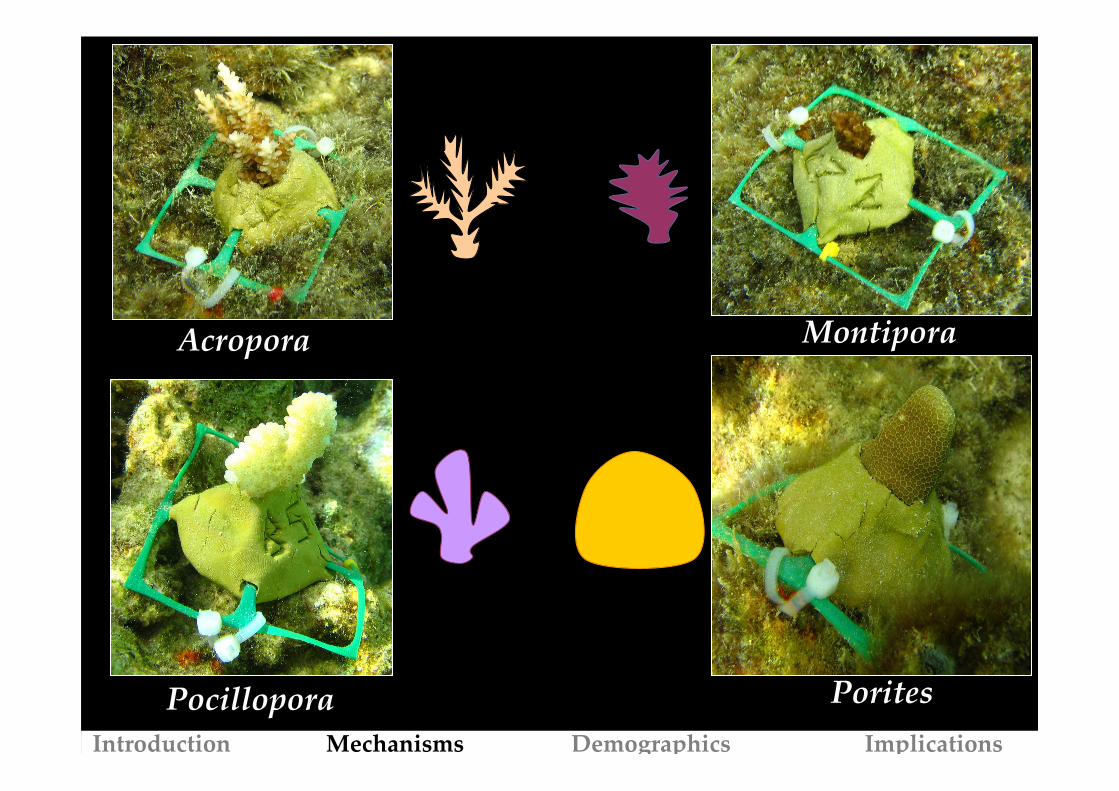
Acropora
PoritesPocillopora
Montipora
Introduction Mechanisms Demographics Implications

Within each reef, 3 transplants of each
coral species randomly assigned:
3 Sub-treatments
Cage
Cage control
Open
Introduction Mechanisms Demographics Implications

EXPOSEDCAGED
Introduction Mechanisms Demographics Implications
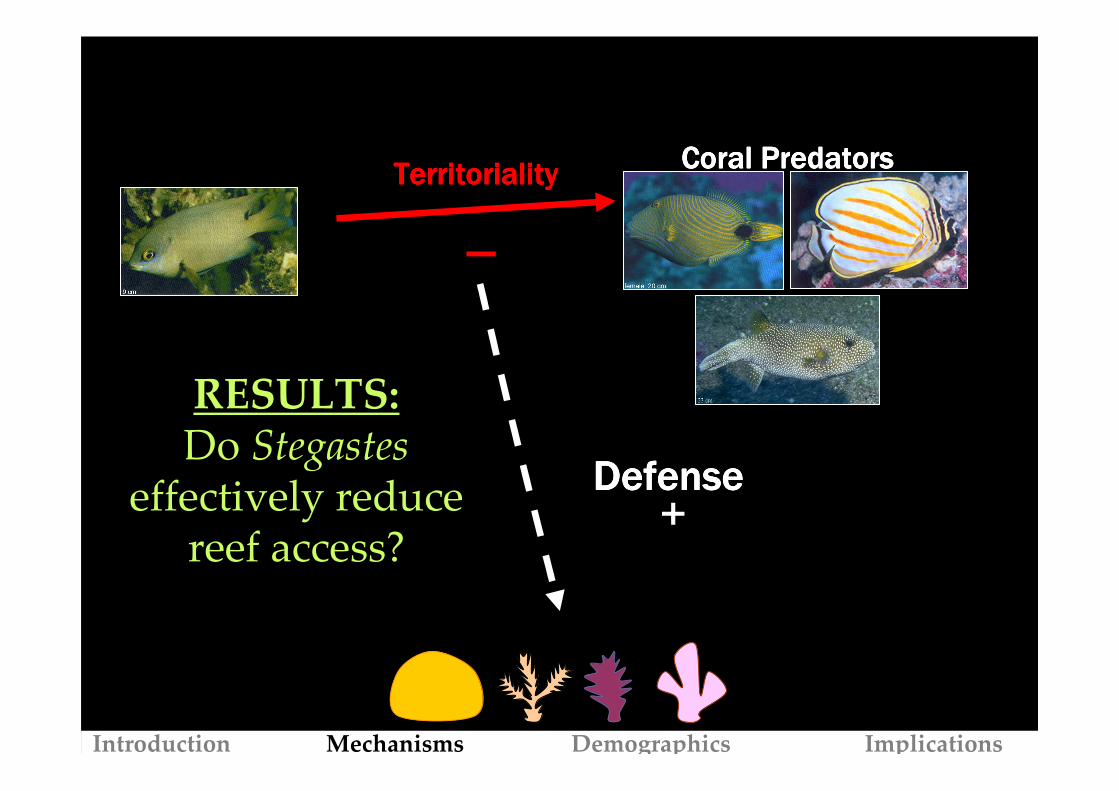
Coral PredatorsCoral PredatorsCoral PredatorsCoral PredatorsTerritorialityTerritorialityTerritorialityTerritoriality
–
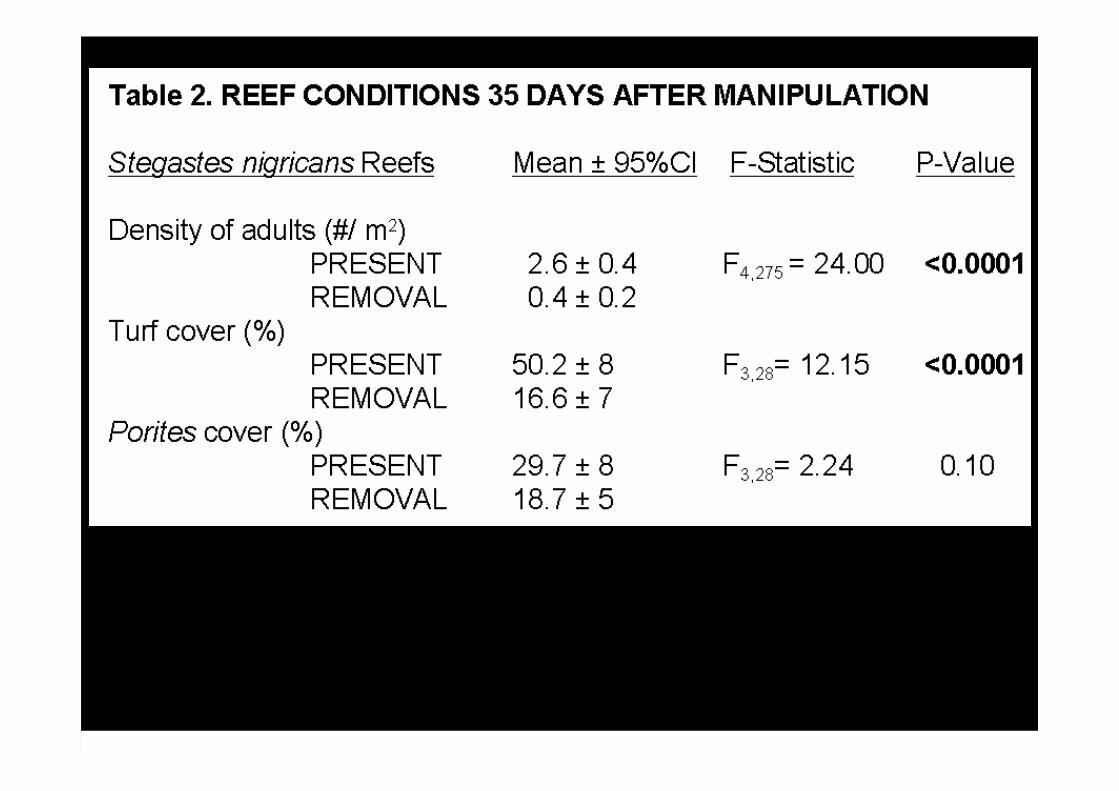
RESULTS: Do Stegastes
effectively reduce reef access?
DefenseDefenseDefenseDefense+
TerritorialityTerritorialityTerritorialityTerritoriality
–
Introduction Mechanisms Demographics Implications

0
0.1
0.2
0.3
0.4
0.5
0.6
0.7
0.8
0.9
1
Butterflyfishes Surgeonfishes Parrotfishes
Present Removed Absent
EFFECT OF TERRITORIALITYM
ean
Fo
rag
ing
Fre
qu
ency
(White and O’Donnell, in prep.)
a b ab a b a a b ab
* * *
*Tukey’s HSD: P<0.05
Introduction Mechanisms Demographics Implications

Coral PredatorsCoral PredatorsCoral PredatorsCoral PredatorsTerritorialityTerritorialityTerritorialityTerritoriality
–
RESULTS: Does territorial behavior reduce coral predation?
DefenseDefenseDefenseDefense+
TerritorialityTerritorialityTerritorialityTerritoriality
–
Introduction Mechanisms Demographics Implications
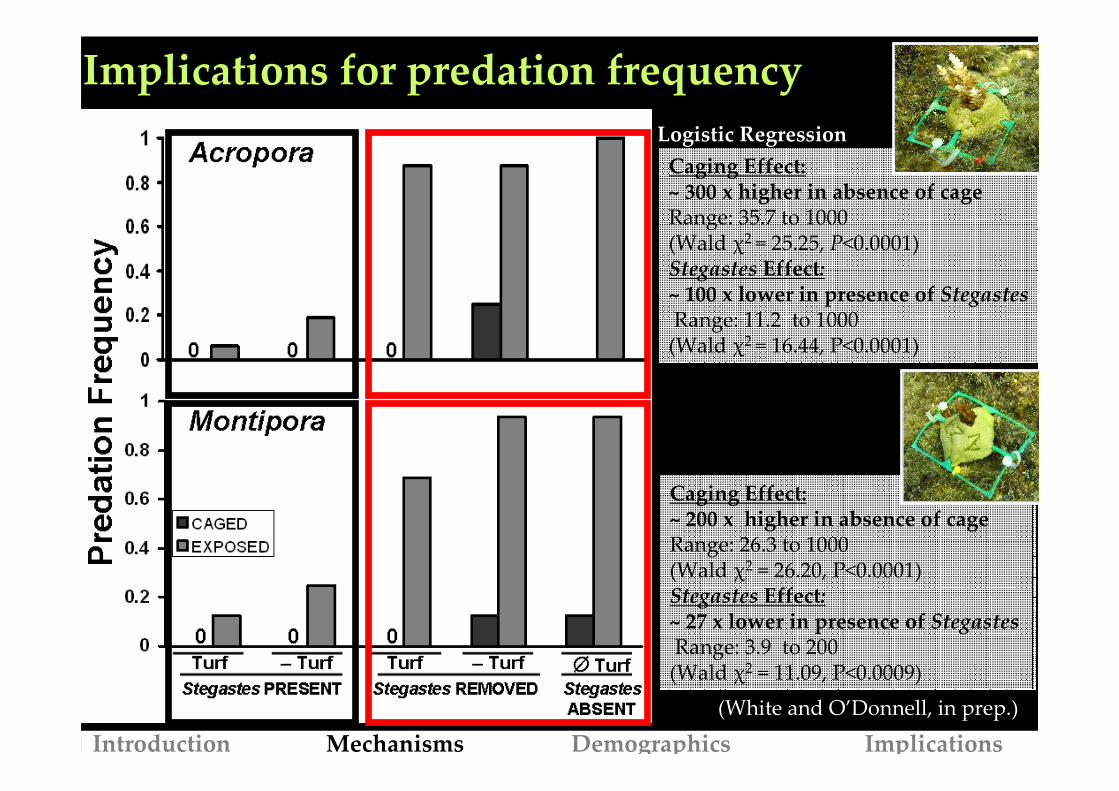
Implications for predation frequency
Caging Effect:~ 300 x higher in absence of cageRange: 35.7 to 1000(Wald χ2 = 25.25, P<0.0001)Stegastes Effect:~ 100 x lower in presence of StegastesRange: 11.2 to 1000(Wald χ2 = 16.44, P<0.0001)
Caging Effect:~ 200 x higher in absence of cage Range: 26.3 to 1000(Wald χ2 = 26.20, P<0.0001)Stegastes Effect:~ 27 x lower in presence of StegastesRange: 3.9 to 200(Wald χ2 = 11.09, P<0.0009)
Logistic Regression
(White and O’Donnell, in prep.)
Introduction Mechanisms Demographics Implications

Av
erag
e C
han
ge
in D
aily
Mas
s (m
g*d
-1)
Skeletal loss due to predation
Acropora
Montipora
(White and O’Donnell, in prep.)Introduction Mechanisms Demographics Implications

TerritorialityTerritorialityTerritorialityTerritoriality
–
Coral PredatorsCoral PredatorsCoral PredatorsCoral PredatorsTerritorialityTerritorialityTerritorialityTerritoriality
–
Stegastes territoriality REDUCES predation for Acroporids (Acropora and Montipora)
DefenseDefenseDefenseDefense+
Introduction Mechanisms Demographics Implications

CompetitionCompetitionCompetitionCompetition
–
RESULTS:Does farmed turf reduce
coral growth & survival?
TurfTurfTurfTurfFarmingFarmingFarmingFarming
+
Introduction Mechanisms Demographics Implications

Turf Effect:3.4 x more likely in presence of turfRange: 1.4 to 8.4(Wald χ2 = 7.41, P = 0.007)
Stegastes Effect:11.3 x higher in presence of StegastesRange: 1.3 to 101.3(Wald χ2 = 4.65, P=0.03)Caging Effect:3.4 x higher in absence of cageRange: 1.0 to 11.4(Wald χ2 = 3.90, P=0.05)
Turf Effect:7.1 x more likely in presence of turfRange: 1.4 to 36(Wald χ2 = 5.48, P=0.02)
Logistic Regression
Introduction Mechanisms Demographics Implications

Porites
Algal abundance predicted significant amount of variation in overgrowth for Porites (Linear Reg., F1,13=31.2, P<0.0001) and Acropora (F1,13=17.9, P=0.001),
…but not Montipora or Pocillopora
Introduction Mechanisms Demographics Implications

CompetitionCompetitionCompetitionCompetition
–
TurfTurfTurfTurfFarmingFarmingFarmingFarming
+
Yes. Farmed turf REDUCES coral survivalfor Porites and Acropora
Introduction Mechanisms Demographics Implications
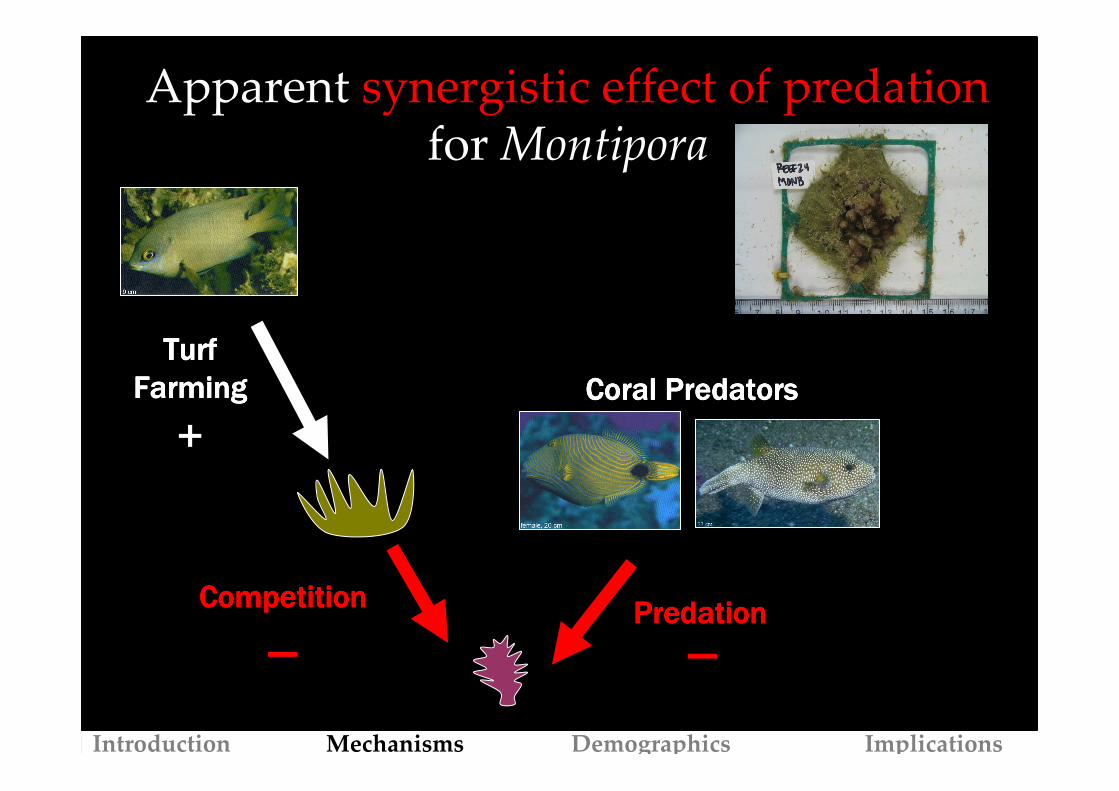
CompetitionCompetitionCompetitionCompetition
–
TurfTurfTurfTurfFarmingFarmingFarmingFarming
+
Apparent synergistic effect of predationfor Montipora
–
Coral PredatorsCoral PredatorsCoral PredatorsCoral Predators
PredationPredationPredationPredation
Introduction Mechanisms Demographics Implications

How does Stegastes alter the rate of predation for in situ Acropora and Pocillopora?
Introduction Mechanisms Demographics Implications

June 2006:Tagged 16 Stegastes reefsAcropora (N=106)Pocillopora (N=234) June 2006
Re-sampling/ tagging recruits:March 2007July 2007 - REMOVALSMay 2008
Methods: Before-After-Paired-Design
Introduction Mechanisms Demographics Implications
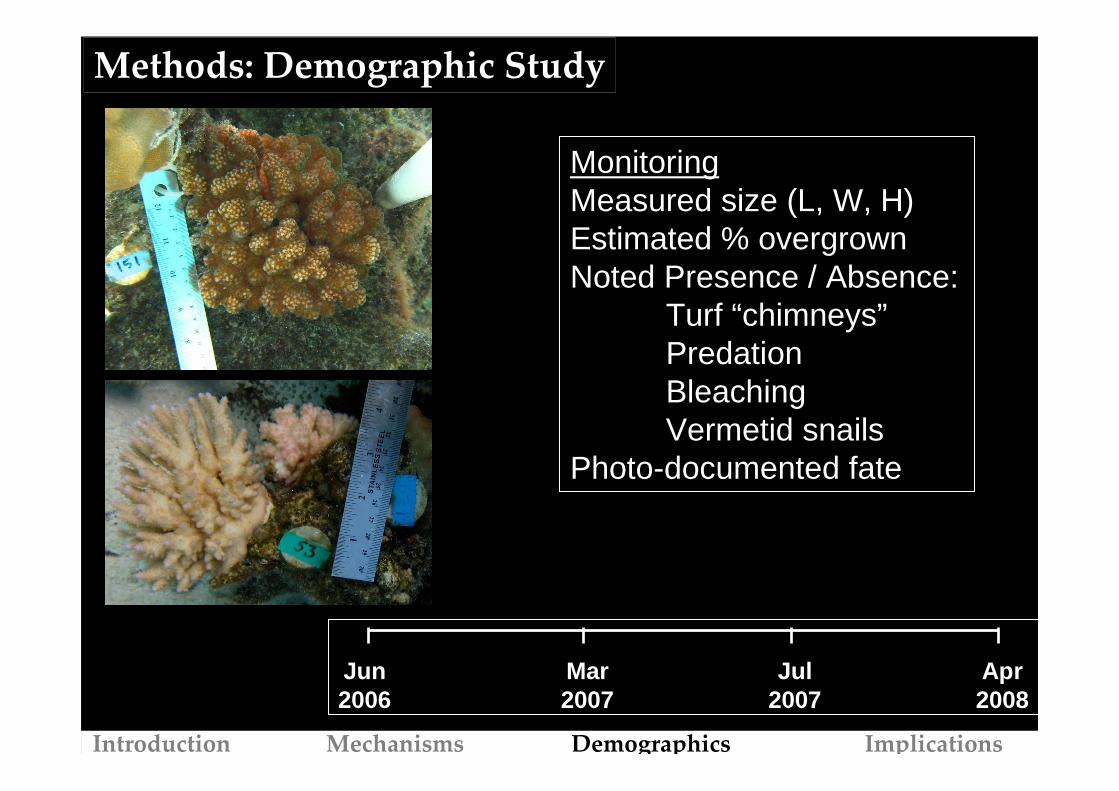
MonitoringMeasured size (L, W, H)Estimated % overgrownNoted Presence / Absence:
Turf “chimneys”PredationBleachingVermetid snails
Photo-documented fate
Methods: Demographic Study
Jun2006
Mar2007
Jul2007
Apr2008
Introduction Mechanisms Demographics Implications
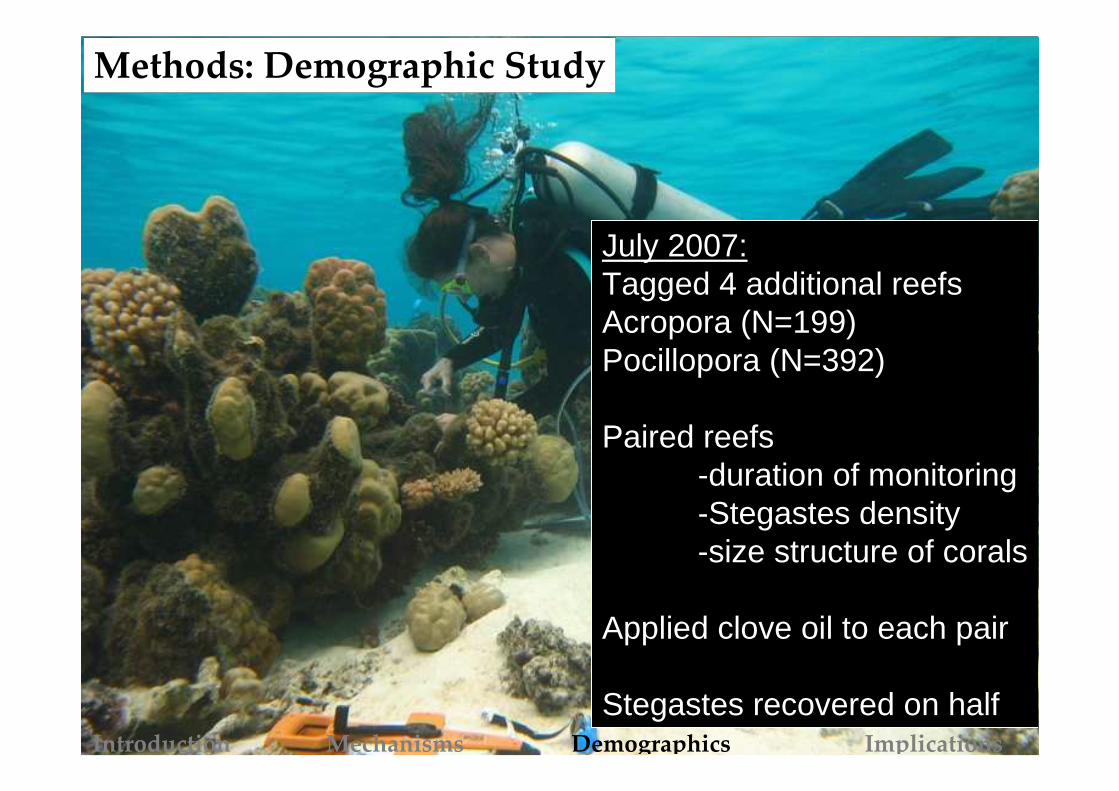
July 2007:Tagged 4 additional reefsAcropora (N=199)Pocillopora (N=392)
Paired reefs-duration of monitoring-Stegastes density-size structure of corals
Applied clove oil to each pair
Stegastes recovered on half
Methods: Demographic Study
Introduction Mechanisms Demographics Implications

RESULTS: Does Stegastes alter the rate of predation for Acropora and Pocillopora?
Introduction Mechanisms Demographics Implications

Before – After in situ Farmerfish Removals: PocilloporaBefore Removals
5-5917.81076REMOVED4-3513.3806PRESENT
RANGEMEANNUM
COLONIES
NUM REEFS
2006-07
Pre-Removal Present
Introduction Mechanisms Demographics Implications

Before – After in situ Farmerfish Removals: PocilloporaBefore Removals After Removals
5-5917.81076REMOVED4-3513.3806PRESENT
RANGEMEANNUM
COLONIES
NUM REEFS
2006-07
7-2718.41478REMOVED3-2714.91198PRESENT
RANGEMEANNUM
COLONIES
NUM REEFS
2007-08
Pre-Removal Present Post-Removal Present
Introduction Mechanisms Demographics Implications

Before - After in situ Farmerfish Removals: AcroporaBefore Removals After Removals
3-83.8236REMOVED1-114.7286PRESENT
RANGEMEANNUM
COLONIES
NUM REEFS
2006-07
3-187.5608REMOVED1-168.4678PRESENT
RANGEMEANNUM
COLONIES
NUM REEFS
2007-08
Pre-Removal Present Post-Removal Present
Introduction Mechanisms Demographics Implications

Results: AcroporaBEFORE Removals AFTER Removals
Introduction Mechanisms Demographics Implications

Results: Partial MortalityBEFORE Removals
AFTER Removals
BEFORE Removals
AFTER Removals
Pocillopora Acropora
Introduction Mechanisms Demographics Implications

Summary:
Stegastes indirectly enhances survival of branching corals
Enhanced recovery of Acroporids and Pocilloporids-suggests corallivores / grazers constraining recovery
Photo C
redit: S. G
eange
Introduction Mechanisms Demographics Implications

Implications
Intraspecific variation in response
Dominant massive Porites are vulnerable to overgrowth, thereby increasing available substrate
High foraging pressure inhibits recovery of Acropora and Pocillopora outside farmerfish territories
May represent changes in foraging populations
Introduction Mechanisms Demographics Implications
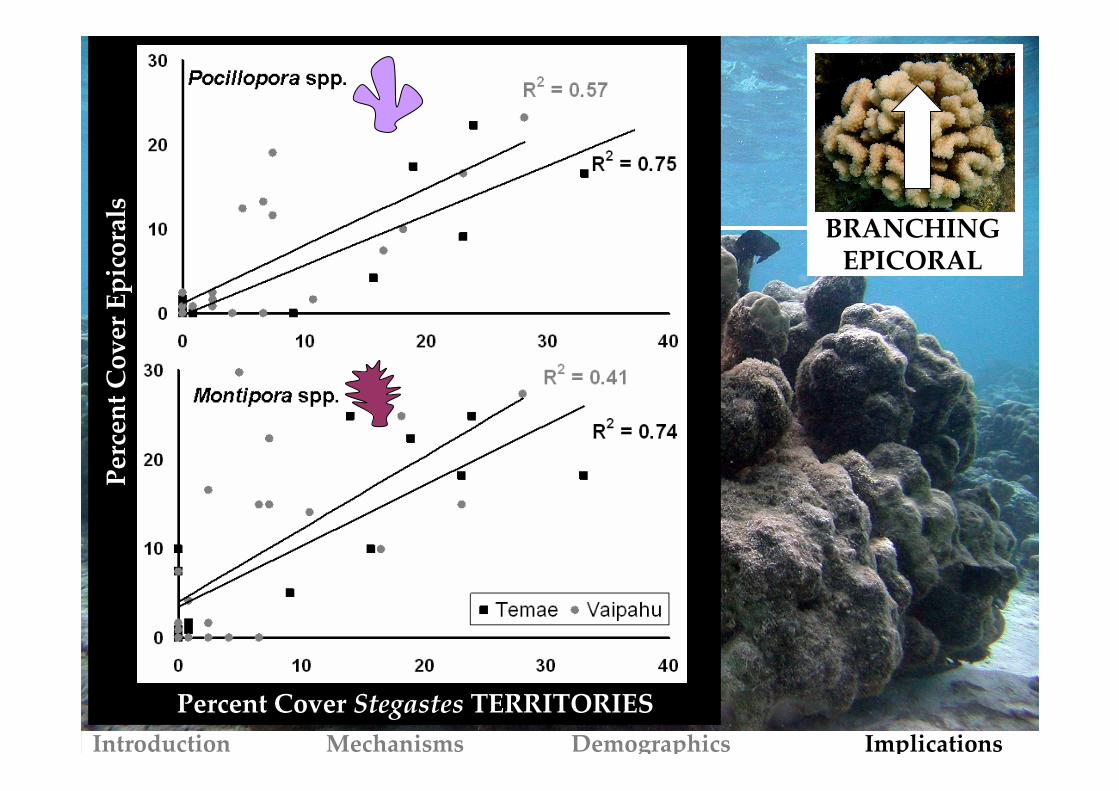
BRANCHINGEPICORAL
Per
cen
t C
ov
er E
pic
ora
ls
Percent Cover Stegastes TERRITORIES
Introduction Mechanisms Demographics Implications
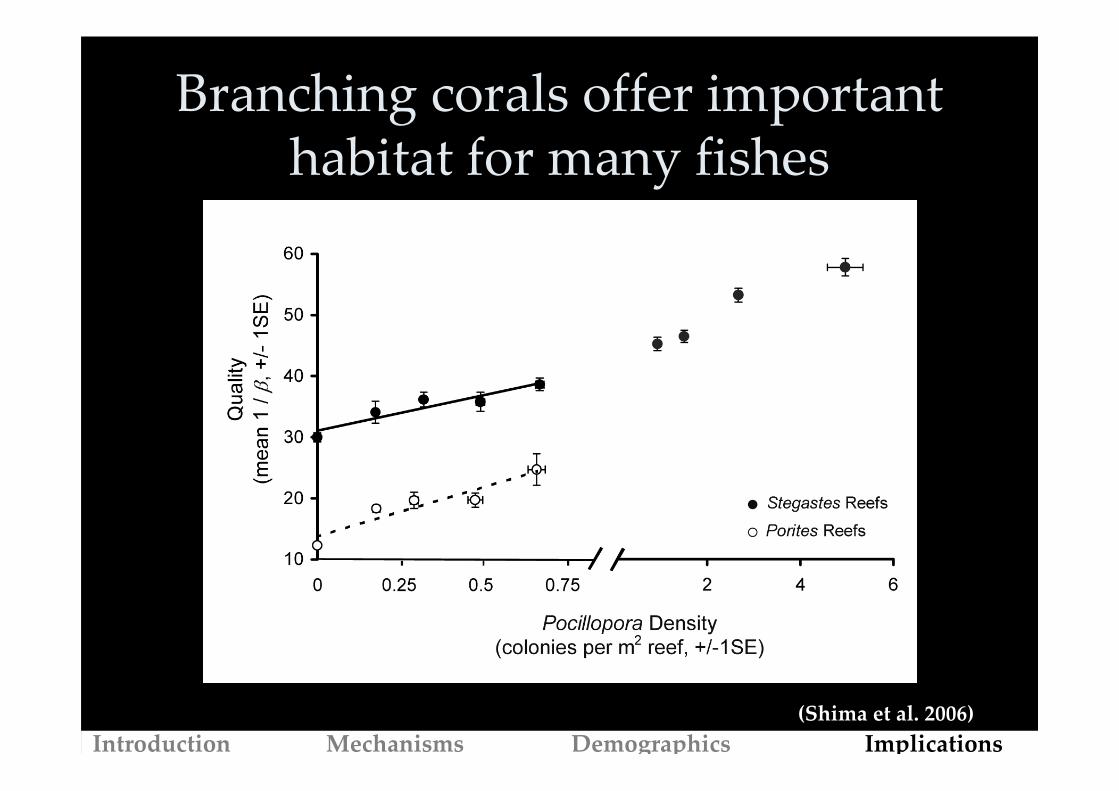
Branching corals offer important habitat for many fishes
(Shima et al. 2006)
Introduction Mechanisms Demographics Implications

Future DirectionsUse population models to pinpoint vulnerable size
classes (e.g., Crouse et al. 1987)
Identify predictors of mortality using Generalized Linear
Mixed Models (GLMM) (Bolker et al. 2009)
Pinpoint responsible taxa using video / removals
Analyze historical and larger scale changes in fish and coral communities
(with Renè Galzin and Thierry Lison de Loma)

AcknowledgementsAcademic AdvisorsBen Bolker (PhD)
Gustav Paulay (PhD)
Craig Osenberg (MS)
Committee MembersColette St. Mary
Karen Bjorndal
Bill Lindberg
Brian Silliman
Field SupportJosh Idjadi Mai Maheighan
Jimmy O’Donnell Shelby Boyer
Nicole Price Lindsey Carr
Michael Way Melissa Schmitt
Shane Geange Adrian Stier
Adrien Delval Emily Vuxton
Idea ExchangeRene Galzin Thierry Lison de Loma
Serge Planes Yannick Chancerelle
Pete Edmunds Mehdi Adjeroud
Sally Holbrook Russ Schmitt
Funding Support
ISRS / OC Graduate Research Fellowship
American Museum of Natural History
American Society of Ichthyologists and Herpetologists Moorea BIOCODE
Merci ~ Mauruuru ~ Thank you

TiahuraBarrier
CORALLIVORES`
TiahuraBarrier
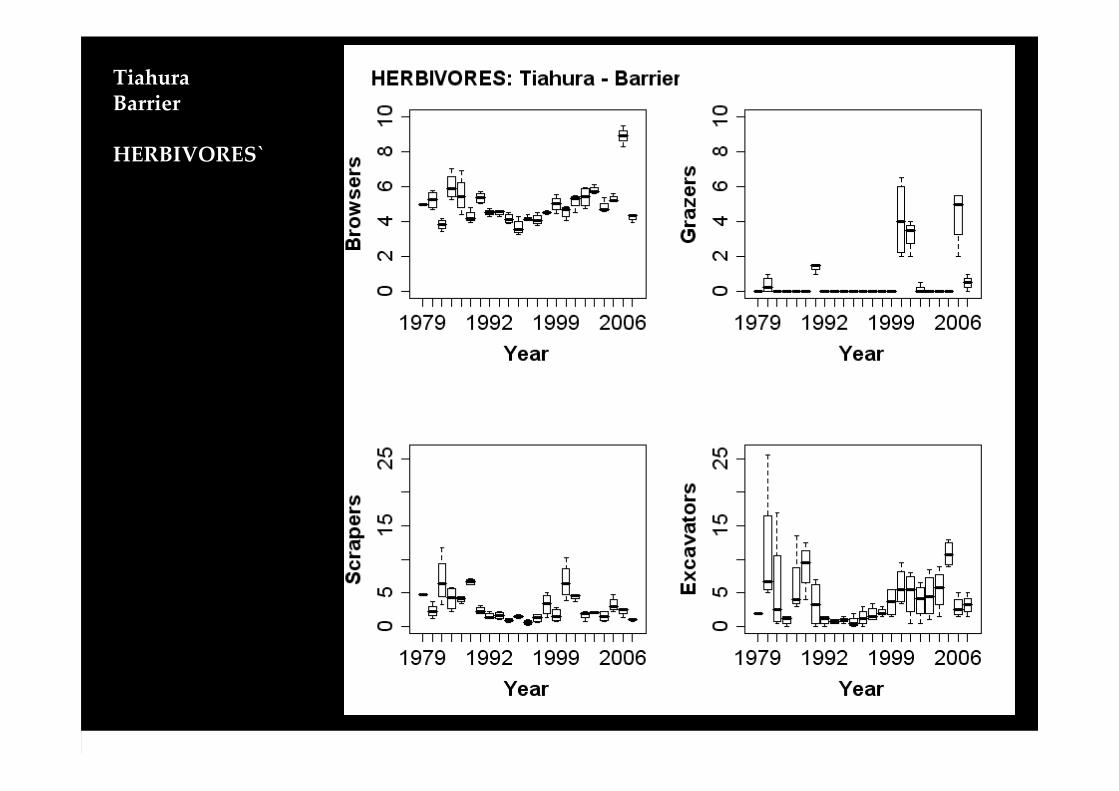
HERBIVORES`

TiahuraBarrier
CARNIVORES`

Effects of eugenol on coral health and growth
Tested five concentrations (solvent):
Control (seawater)7% Eugenol (seawater)
14% Eugenol (seawater)14% Eugenol (Ethanol)28% Eugenol (seawater)
Three species of coral:
Acropora striataPocillopora verrucosaPorites australiensis
Treatments applied weekly for 5 weeks

Schematic of Experimental Design

Effects of eugenol on coral growth
33% (± 7%)28% (seawater)
37% (± 6%)14% (Ethanol)
25% (± 9%)14% (seawater)
12% (± 13%)7% (seawater)
% GROWTH REDUCTION RELATIVE TO CONTROL
(±95% CI)
TREATMENT
(SOLVENT)
0
2
4
6
8
10
12
0%(Seawater)
7%(Seawater)
14%(Seawater)
14% (Ethanol)
28%(Seawater)
PE
RC
EN
T C
HA
NG
E IN
GR
OW
TH
Acropora striata
Pocillopora verrucosa
Porites australiensis
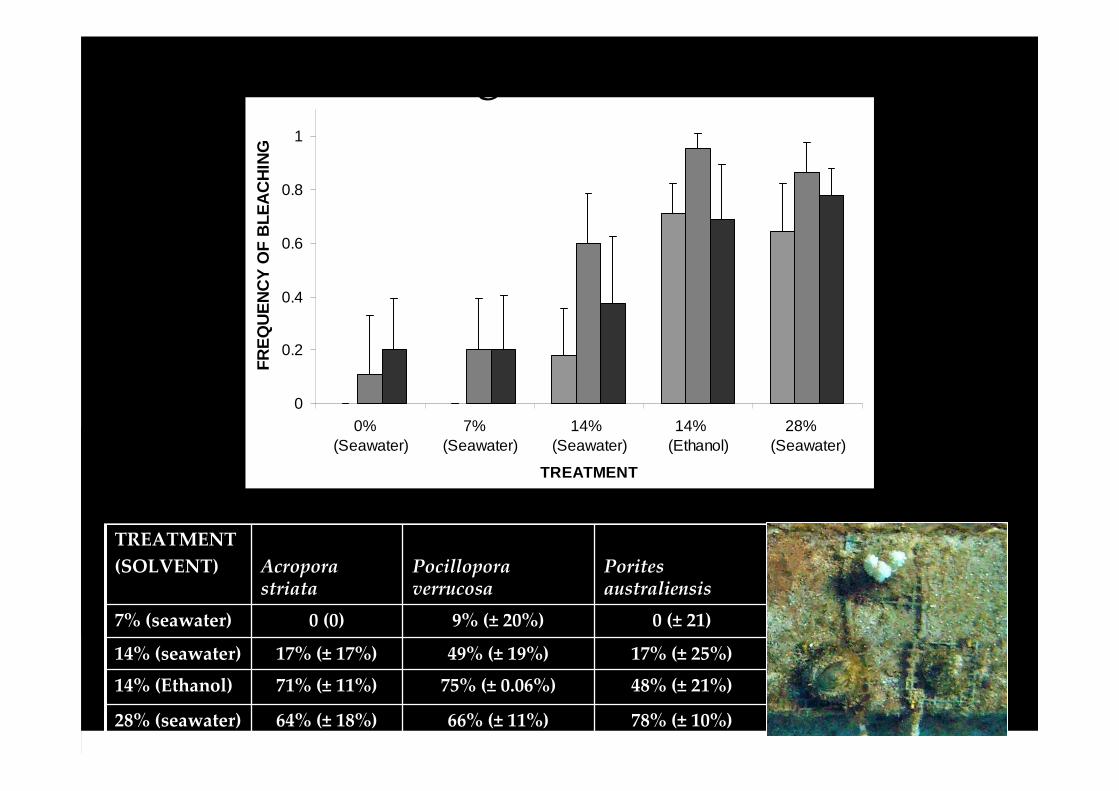
66% (± 11%)
75% (± 0.06%)
49% (± 19%)
9% (± 20%)
Pocillopora verrucosa
64% (± 18%)
71% (± 11%)
17% (± 17%)
0 (0)
Acropora striata
78% (± 10%)28% (seawater)
48% (± 21%)14% (Ethanol)
17% (± 25%)14% (seawater)
0 (± 21)7% (seawater)
Porites australiensis
TREATMENT
(SOLVENT)
Average % Increase in bleaching frequency relative to control (± 95% CI)
0 00
0.2
0.4
0.6
0.8
1
0% (Seawater)
7% (Seawater)
14% (Seawater)
14% (Ethanol)
28% (Seawater)
TREATMENT
FRE
QU
EN
CY
OF
BLE
AC
HIN
G
Effects of eugenol on coral health

Take home –
7% Eugenol in seawater relatively safe
Apply to both “Present” and “Removal” reefs
- let Stegastes recover on half
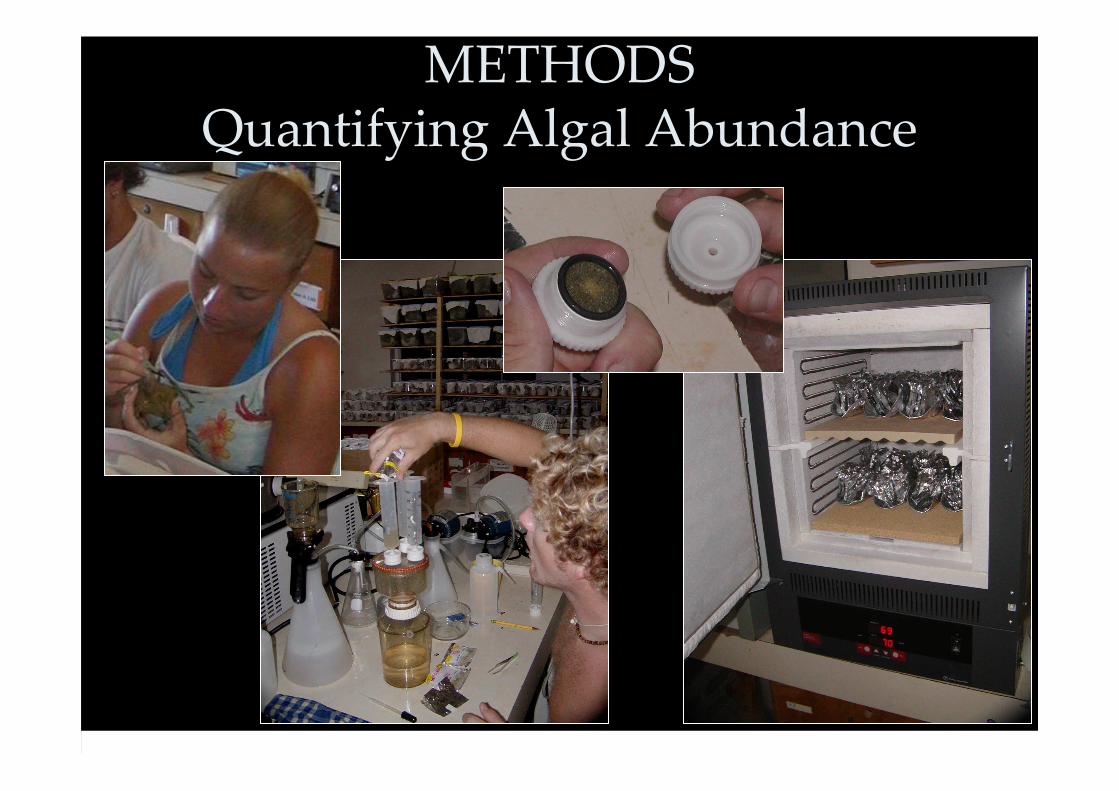
METHODSQuantifying Algal Abundance

0.17 (0.33)0.17 (0.33)0.25 (0.20)Absent
0.57 (0.19)0.45 (0.14)0.53 (0.21)Removed
0.75 (0.49)00.07 (0.08)PresentSiganidae
0.42 (0.18)0.09 (0.06)2.27 (0.84)Absent
0.57 (0.10)0.53 (0.08)3.31 (0.55)Removed
0.17 (0.09)0.18 (0.08)2.09 (0.66)PresentScaridae
0.17 (0.09)0.26 (0.07)5.25 (0.58)Absent
0.40 (0.09)0.44 (0.05)4.98 (0.47)Removed
0.17 (0.07) 0.14 (0.05)4.24 (0.52)PresentAcanthuridaeHerbivore
0.36 (0.30)0.26 (0.07)0.42 (0.23Absent
0.55 (0.14)0.52 (0.11)0.95 (0.27)Removed
0.23 (0.13)0.23 (0.11)0.83 (0.23)PresentChaetodontidae
00.29 (0.36)0.15 (0.10)Absent
00.50 (0.20)0.27 (0.11)Removed
0.03 (0.07)0.09 (0.10)0.32 (0.10)PresentBalistidaeCorallivore / Omnivore
0.14 (0.05)0.30 (0.05)1.83 (0.27)Absent
0.29 (0.04)0.45 (0.03)3.14 (0.39)Removed
0.12 (0.03)0.19 (0.03)2.10 (0.29)PresentOVERALL
MEAN FORAGING FREQUENCY
MEAN FREQUENCY ON
REEF
MEAN DENSITY
Stegastes nigricans
FAMILYTROPHIC STATUS
Table 1. Summary of densities, reef access, and foraging frequency for corallivorous and herbivorous fish families encountered during regular (every 5 d) surveys.
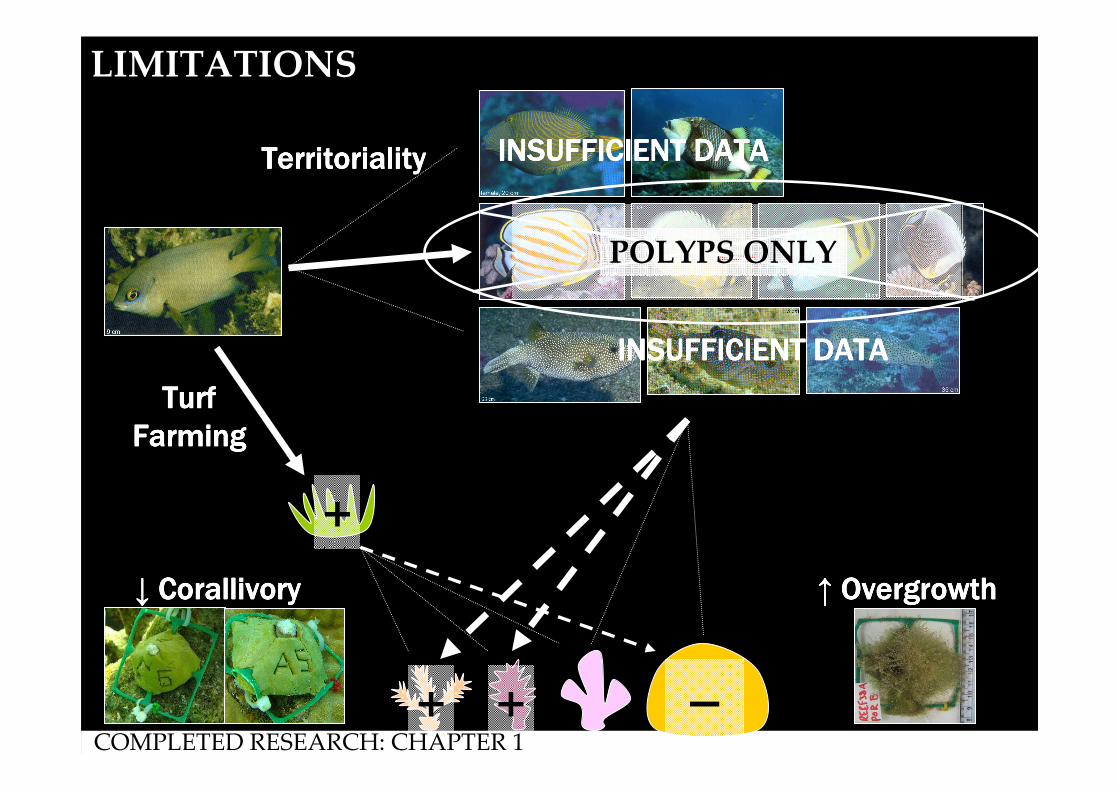
TerritorialityTerritorialityTerritorialityTerritoriality
↑↑↑↑ OvergrowthOvergrowthOvergrowthOvergrowth
TurfTurfTurfTurfFarmingFarmingFarmingFarming
INSUFFICIENT DATAINSUFFICIENT DATAINSUFFICIENT DATAINSUFFICIENT DATA
INSUFFICIENT DATAINSUFFICIENT DATAINSUFFICIENT DATAINSUFFICIENT DATA
↓↓↓↓ CorallivoryCorallivoryCorallivoryCorallivory
LIMITATIONS
+ +
–POLYPS ONLY
+
–COMPLETED RESEARCH: CHAPTER 1
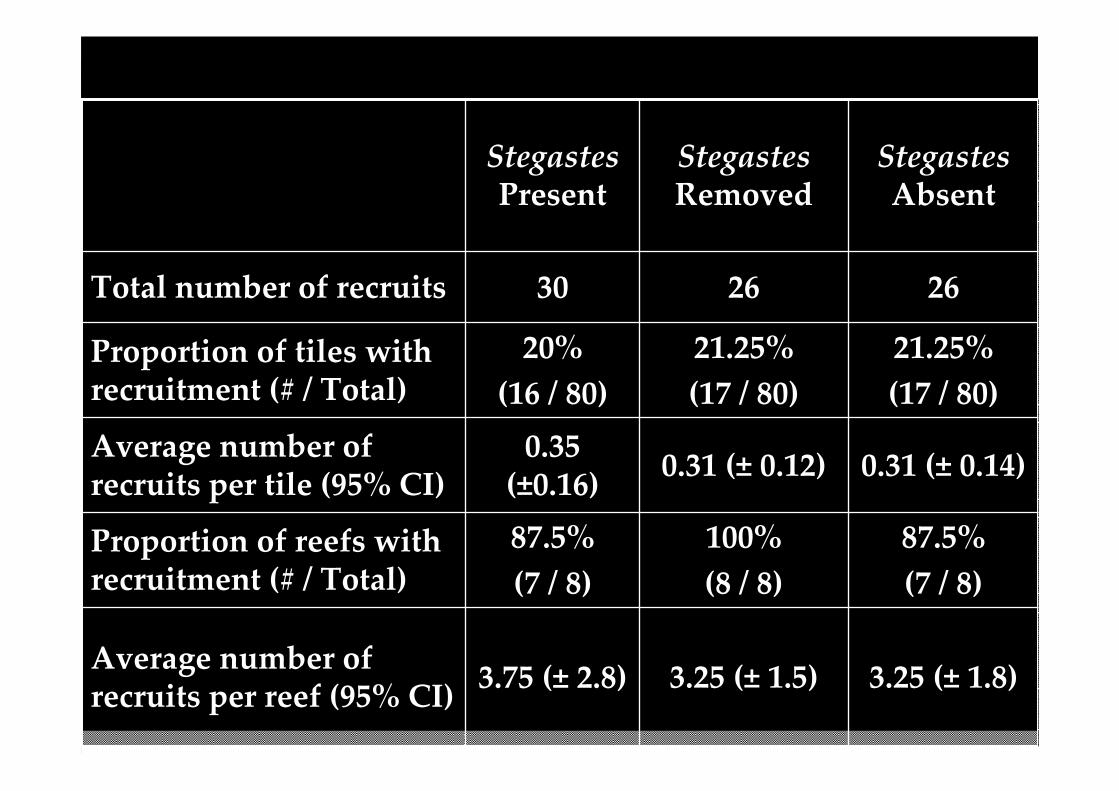
Overall pattern of recruitment across reef types (Jan - Aug 2006)
0.31 (± 0.14)0.31 (± 0.12)0.35
(±0.16)Average number of recruits per tile (95% CI)
3.25 (± 1.8)
87.5%
(7 / 8)
21.25%
(17 / 80)
26
Stegastes Absent
3.25 (± 1.5)3.75 (± 2.8)Average number of recruits per reef (95% CI)
100%
(8 / 8)
87.5%
(7 / 8)
Proportion of reefs with recruitment (# / Total)
21.25%
(17 / 80)
20%
(16 / 80)
Proportion of tiles with recruitment (# / Total)
2630Total number of recruits
Stegastes Removed
Stegastes Present

0
0.1
0.2
0.3
0.4
0.5
0.6
0.7
0.8
0.9
1
PRESENT REMOVED ABSENT
Pro
po
rtio
n o
f T
ota
l R
ecr
uit
me
nt
UNID
Porites
Pocillopora
Montipora
Acropora
0.32
(8 / 26)
0.15
(4 / 26)
0.10
(3 / 30)
UNID
0.04
(2 / 26)
0.32
(8 / 26)
0
(0 / 26)
0.32
(8 / 26)
ABSENT
0.08
(2 / 26)
0.23
(6 / 26)
0.15
(4 / 26)
0.39
(10 / 26)
REMOVED
0.03
(1 / 30)
0.13
(4 / 30)
0.26
(8 / 30)
0.46
(14 / 30)
PRESENT
PoritesPocilloporaMontiporaAcropora