Indigenous Socioeconomic Change 1971-2001: A Historical ...
60
Indigenous Socioeconomic Change 1971-2001: A Historical Perspective J.C. Altman. N. Biddle, and B. Hunter DISCUSSION PAPER No. 266/2004 ISSN 1036 1774 ISBN 0 7315 5641 0 CENTRE FOR ABORIGINAL ECONOMIC POLICY RESEARCH
Transcript of Indigenous Socioeconomic Change 1971-2001: A Historical ...
Indigenous Socioeconomic Change 1971-2001: A Historical PerspectiveJ.C. Altman. N. Biddle, and B. Hunter
DISCUSSION PAPER No. 266/2004ISSN 1036 1774
ISBN 0 7315 5641 0
CENTRE FOR
ABORIGINAL ECONOMICPOLICY RESEARCH

Series NoteThe Centre for Aboriginal Economic Policy Research (CAEPR) was fi rst established in March
1990 under an agreement between The Australian National University (ANU) and the
Aboriginal and Torres Strait Islander Commission (ATSIC). Since 1 January 1999, CAEPR has
operated as a University Centre and is currently funded from a variety of sources including
the ANU, Australian Research Council, Department of Immigration, Multicultural and
Indigenous Affairs, and Department of Family and Community Services. CAEPR’s principal
objective is to undertake high-quality, independent research that will assist in furthering
the social and economic development and empowerment of Aboriginal and Torres Strait
Islander people.
CAEPR’s aim is to be a world-class centre undertaking research on Indigenous economic
development issues that combines academic excellence with policy relevance and
realism. In Australia, CAEPR is currently the only dedicated research centre focusing on
Indigenous economic policy issues from a national perspective. The Centre’s publications,
which include the CAEPR Discussion Paper series fi rst established in 1991, aim to examine
government policy, infl uence policy formulation, and inform public debate.
CAEPR Discussion Papers are intended as one forum for the rapid dissemination of peer-
reviewed papers by Centre staff on relevant research topics. These papers are produced for
widespread discussion and comment. Copies of most publications are available for free
electronic download from CAEPR’s website
<www.anu.edu.au/caepr/>
Printed copies can be purchased through the website or from:
The Centre for Aboriginal Economic Policy Research
Hanna Neumann Building #21
The Australian National University
Canberra ACT 0200
Telephone 02–6125 8211
Facsimile 02–6125 9730
As with all CAEPR publications, the views expressed in this Discussion Paper
are those of the author(s) and do not refl ect any offi cial CAEPR position.
Professor Jon AltmanDirector, CAEPR
The Australian National UniversityNovember 2004
Cover page images courtesy of the Australian Institute of Aboriginal and
Torres Strait Islander Studies and CAEPR staff members.
The Australian National University – CRICOS Provider #00120C

INDIGENOUS SOCIOECONOMIC CHANGE 1971–2001: A HISTORICAL PERSPECTIVE
J.C. ALTMAN, N. BIDDLE, AND B.H. HUNTER
Jon Altman is Director of the Centre for Aboriginal Economic Policy Research, The Australian National
University. Nicholas Biddle and Boyd Hunter are also at the Centre; the former as a PhD scholar and the
latter as a Fellow.
No. 266/2004
ISSN 1036 1774
ISBN 0 7315 5641 0

CENTRE FOR ABORIGINAL ECONOMIC POLICY RESEARCH
DISCUSSION PAPER N0. 266 iii
CENTRE FOR ABORIGINAL ECONOMIC POLICY RESEARCH
DISCUSSION PAPER N0. 266 iii
CONTENTS
Tables and Figures ........................................................................................................................................................................ iv
Abbreviations and Acronyms......................................................................................................................................................v
Abstract .......................................................................................................................................................................................... vi
Acknowledgments........................................................................................................................................................................ vi
Introduction .................................................................................................................................................................................... 1
Economic history and policy context of Indigenous socioeconomic change since the 1970s ....................... 1
The scope of this paper.......................................................................................................................................................... 2
Data sources, difficulties and caveats..................................................................................................................................... 3
The rise of the Community Development Employment Projects (CDEP) scheme and Indigenous
Labour force status ..................................................................................................................................................... 6
Choice of indicators...................................................................................................................................................................... 8
Employment............................................................................................................................................................................... 8
Income......................................................................................................................................................................................... 9
Housing ....................................................................................................................................................................................... 9
Education ................................................................................................................................................................................. 10
Health ........................................................................................................................................................................................ 10
Analysis........................................................................................................................................................................................... 10
Conclusion .....................................................................................................................................................................................18
Notes ...............................................................................................................................................................................................20
Appendix A: Constructing comparable variables for respective censuses ................................................................22
Appendix B. Calculus-based method for calculating medians .....................................................................................44
References .....................................................................................................................................................................................50

iv ALTMAN, BIDDLE & HUNTER
CENTRE FOR ABORIGINAL ECONOMIC POLICY RESEARCH CENTRE FOR ABORIGINAL ECONOMIC POLICY RESEARCH
DISCUSSION PAPER N0. 266 v
TABLES
Table 1. Socioeconomic outcomes for Indigenous Australians, 1971–2001............................................................. 11
Table 2. Socioeconomic outcomes for non-Indigenous Australians, 1971–2001 ................................................... 11
Table 3. Ratio of Indigenous to non-Indigenous outcomes, 1971–2001...................................................................15
Table A1. Constructing comparable variables for respective censuses ......................................................................22
FIGURES
Fig. 1. Growth of the CDEP scheme employment ............................................................................................................... 7
Fig. B1. Defining preliminaries for median calculations .................................................................................................44
Fig. B2. Height of the pdf .........................................................................................................................................................46
Fig. B3. Relative position of the category mid-point and the median ......................................................................47

iv ALTMAN, BIDDLE & HUNTER
CENTRE FOR ABORIGINAL ECONOMIC POLICY RESEARCH CENTRE FOR ABORIGINAL ECONOMIC POLICY RESEARCH
DISCUSSION PAPER N0. 266 v
ABBREVIATIONS AND ACRONYMS
ABS Australian Bureau of Statistics
AGPS Australian Government Publishing Service
ANU The Australian National University
ATSIC Aboriginal and Torres Strait Islander Commission
CAEPR Centre for Aboriginal Economic Policy Research
CD Collection District
CDEP Community Development Employment Projects
cdf cumulative density function
erp estimated resident population
pdf probability density function
NCVER National Centre for Vocational and Educational Research
SIF Special Indigenous Form

vi ALTMAN, BIDDLE & HUNTER
CENTRE FOR ABORIGINAL ECONOMIC POLICY RESEARCH CENTRE FOR ABORIGINAL ECONOMIC POLICY RESEARCH
DISCUSSION PAPER N0. 266 1
ABSTRACT
This paper examines trends across a number of socioeconomic outcomes for Indigenous Australians from the
1967 referendum to the present, using four Censuses of Population and Housing carried out by the Australian
Bureau of Statistics in 1971, 1981, 1991 and 2001. It reports on outcomes for Indigenous Australians, non-
Indigenous Australians and the ratios between the two.
There are a number of difficulties involved in comparing censuses through time. These we label as practical,
methodological, compositional and conceptual. Despite these difficulties, we are confident that our results
are not only as consistent as any that have been produced to date in the analysis of Indigenous socioeconomic
outcomes, but are also robust enough for broad conclusions to be drawn. Overall, we conclude that there
has been steady, although not spectacular improvement in outcomes over time. These improvements are
especially marked for education, although other areas have also seen some gains. This finding is somewhat
at odds with the common perception of the ‘failure’ of Indigenous policy.
This paper also makes two additional contributions to empirical and methodological work in the field.
Firstly, we give a comprehensive presentation of census questions over the period and detail the way in
which we have attempted to construct a consistent series of data. Secondly, we outline a new technique for
calculating medians when grouped data are all that is available. This technique may be particularly relevant
when working with skewed distributions such as that found for the Indigenous population.
ACKNOWLEDGMENTS
This paper had its origins in a conference paper ‘Indigenous labour force status in perspective: 1971–2001’
authored by Jon Altman and Boyd Hunter and presented to the 5th National Conference on Unemployment,
held at the Centre of Full Employment and Equity, University of Newcastle, in December 2003. As we have
worked further on developing a robust comparative data set on which to base our analysis, we have found
that this statistical exercise—which we had initially thought to be fairly straightforward—was extraordinarily
methodologically fraught, and so we approached Nicholas Biddle to join us as a co-author to work on
the statistical backtracking. His contribution to this paper is part of the Australian Bureau of Statistics’
(ABS) contribution to an Australian Research Council linkage project, ‘Pathways to Improved Educational
Attainment for Indigenous Australians: Social and Institutional Factors Underlying School Participation’
(LP0348733). While the support of the ABS is greatly appreciated, this paper should in no way be attributed
to the ABS. The authors are sincerely grateful to Bob Breunig, Bruce Chapman, Mike Dillon, Matthew Gray,
Will Sanders, and John Taylor for their constructive criticism on an earlier version of this paper. Thanks are
also due to Hilary Bek and Frances Morphy for editorial assistance, and to John Hughes for layout.

vi ALTMAN, BIDDLE & HUNTER
CENTRE FOR ABORIGINAL ECONOMIC POLICY RESEARCH CENTRE FOR ABORIGINAL ECONOMIC POLICY RESEARCH
DISCUSSION PAPER N0. 266 1
INTRODUCTION
Current debate in Indigenous affairs often involves the assertion that the last 30 years has been a period
of policy failure (Godwell 2003). The most recent manifestation of this perceived failure is the recent
competition between the major political parties to radically restructure the process of Indigenous policy
formulation, particularly in the abolition of the Aboriginal and Torres Strait Islander Commission (ATSIC).
This paper seeks to provide a historical perspective on how Indigenous people have fared by analysing the
changes in socioeconomic outcomes between the 1971 and 2001 censuses. While we need to provide some
relevant economic history and comment on broad policy settings to give a context to our analysis, it should
be noted that this is not an exercise in the evaluation of policy. Indeed, it would be impossible to evaluate
the recent history of Indigenous affairs policy solely by using socioeconomic trends as these are inevitably
conflated with general trends in both the wider economy and society. We briefly document the relevant
background material in the next section, before conducting the main analysis. That analysis is based on
statistics at the national level developed especially for this paper.
ECONOMIC HISTORY AND POLICY CONTEXT OF INDIGENOUS SOCIOECONOMIC CHANGE SINCE THE 1970S
In 1971, before the oil shocks of 1973 and the early 1980s, the Australian economy was operating at full
employment.1 By 1981, national unemployment rates were the highest they had been since before World
War II. In the 1980s, the floating of the Australian dollar, financial market deregulation and labour market
reforms (which continue to this day) laid the platform for establishing an internationally competitive
economy. Despite the recession of the early 1990s, these reforms have established the platform for long-
term national economic growth, which has been reasonably strong since the 1981 Census. The substantial
fluctuations in domestic economic conditions since 1971 lead us to give less weight in our analysis to
absolute indicators and more weight to relative indicators of Indigenous socioeconomic outcomes (i.e.
relative as measured against the rest of the Australian population).
The 30-year period examined in this paper coincides with two major events in Indigenous policy. The first is
the potential to access statistical information about Indigenous Australians that only became possible from
the time of the 1971 census, following amendments to the Australian constitution in the 1967 referendum.
The second is the broad policy approach of self-determination that was introduced in 1972, replacing the
earlier policy frameworks of assimilation and integration.
The modern policy approach in Indigenous affairs had as its immediate precursor the constitutional
amendment referendum of 1967 that was supported by all major parties and over 90 per cent of Australians.2
The referendum opened the way for Indigenous people to be fully counted and identified in the five-yearly
census (effectively from 1971) and for the Commonwealth to take a more active role in Indigenous affairs

2 ALTMAN, BIDDLE & HUNTER
CENTRE FOR ABORIGINAL ECONOMIC POLICY RESEARCH CENTRE FOR ABORIGINAL ECONOMIC POLICY RESEARCH
DISCUSSION PAPER N0. 266 3
nation-wide. In the late 1960s and early 1970s, Coalition governments responded by making special purpose
payments to the States to fund Indigenous assistance programs.
While Indigenous policy had been slowly evolving in new directions since 1967, there was a identifiable
sea change in policy with the Whitlam government’s establishment of a Commonwealth Department
of Aboriginal Affairs, and the introduction of ‘self-determination’ as the key term of Indigenous affairs
policy (Pratt & Bennett 2004). Recognising that there was widespread exclusion of Indigenous people from
mainstream services, especially in rural and remote regions, the new policy encouraged the incorporation
of Indigenous community organisations to deliver their own services. It has been argued before that one
of the most notable aspects of Commonwealth Indigenous affairs, at least until to the 1990s, was the high
degree of similarity between the approaches of Labor and Coalition governments (Altman & Sanders 1992).
For example, the principle of self-determination underlay Commonwealth Indigenous affairs policy until
the advent of the Howard government (though the Fraser government preferred to use the term ‘self-
management’, see Bennett 1999; Pratt & Bennett 2004).
Altman and Hunter (2003) analysed changes in socioeconomic outcomes over the ‘reconciliation decade’,
1991 to 2001. They found no statistical evidence from census data that Australian government policies and
programs between 1996 and 2001 delivered better (or indeed worse) outcomes for Indigenous Australians,
at the national level, than those of their political predecessors. This intractability is worrying in part because
it was evident during a time when the Australian economy was growing rapidly—in theory allowing more
resources to be devoted to improving both the absolute and relative situation of disadvantaged groups
within Australia. This suggests, in turn, that problems are deeply entrenched—it is not just a matter of
governments choosing between ‘practical’ and ‘symbolic’ reconciliation. The distinction between forms of
reconciliation seems to be artificial and rhetorical, rather than substantive.
THE SCOPE OF THIS PAPER
This paper attempts to take a longer term perspective than was possible in Altman and Hunter (2003)
by analysing the trends in Indigenous and non-Indigenous socioeconomic status, as measured by social
indicators, since 1971. We build on that paper by constructing an analogous set of variables that are
comparable back to 1971. While many of the variables in the following analysis are the same as those used
by Altman and Hunter (2003), some have been changed because there are no suitable comparable data
available for earlier censuses. Also, a few variables have been changed because further research has allowed
methodological improvements to be made in the last 12 months.
The major contribution of this paper is that data and variables have been constructed and reconstructed
in as comparable a manner as possible. In the process of writing this paper it became apparent to us that
merely collecting existing statistics in an ad hoc manner was a fraught process because research and official
publications that used 1971 and 1981 census data often provided inconsistent and incomplete results. A
major issue that emerged is that earlier research and official documents often failed to describe how the ‘not

2 ALTMAN, BIDDLE & HUNTER
CENTRE FOR ABORIGINAL ECONOMIC POLICY RESEARCH CENTRE FOR ABORIGINAL ECONOMIC POLICY RESEARCH
DISCUSSION PAPER N0. 266 3
stated’ and ‘inadequately described’ categories were treated when constructing social indicators (e.g. Miller
1985). After several attempts at reconciling published census data, it became apparent that we needed to
return to the original Australian Bureau of Statistics (ABS) data to generate specific cross-tabulations that
permitted valid comparisons over the 30-year period we were examining.
Appendix A provides a detailed description of how we combined census questions and categories when
constructing our indicators, and describes our key assumptions. This Appendix should be a valuable resource
for other researchers trying to conduct inter-temporal comparisons using census data, and provides some of
the detail that we found missing when we looked back at the existing analysis of earlier censuses.
Before attempting our analysis we need to understand some of the problems and shortcomings inevitably
faced when using census data to measure trends in Indigenous outcomes. The next section documents the
necessary qualifications that need to be recognised when analysing trends in census data and introduces the
indicators used. We will return to these caveats in the concluding section when providing an assessment of
the history of changes in Indigenous socioeconomic status since 1971—at the national level and according
to the only available official statistics.
DATA SOURCES, DIFFICULTIES AND CAVEATS
Using the census has a number of shortcomings. It is a blunt instrument that has the counting of the
national population as its primary goal and it is not designed to track changes in socioeconomic status
over time. The five-yearly census generates social statistics about Indigenous people only as a by-product
of the introduction, in 1971, of a question which asked whether people identify themselves as Indigenous.
Subsequently, census-generated comparative data have become the main instrument for assessing broad
policy impacts in Indigenous affairs because there is little choice: there is no other statistical collection
which can provide comparable data over an extended period.
There are four broad difficulties inherent in using census information to track changes in absolute
and relative Indigenous socioeconomic status. These can be characterised as practical, methodological,
compositional and conceptual.
There are practical problems in defining the size of the Indigenous population and who is Indigenous. Over
the relatively short period being examined here, the census counts indicated that the Indigenous population
increased from 116,000 in 1971 to 410,000 in 2001.3 This represents a reasonably high growth rate of 4.3 per
cent per annum over the whole period, and the growth is higher in the later inter-censual periods (Kinfu
& Taylor 2002; Ross 1999). It is now well recognised by demographers that such population growth cannot
be based only on fertility and mortality rates; it has two additional components, changed identification
and inter-marriage, with offspring of ethnically-mixed couples being highly likely to identify as Indigenous
(Taylor 1997).
4 ALTMAN, BIDDLE & HUNTER
CENTRE FOR ABORIGINAL ECONOMIC POLICY RESEARCH CENTRE FOR ABORIGINAL ECONOMIC POLICY RESEARCH
DISCUSSION PAPER N0. 266 5
That is, over recent censuses the Indigenous population has grown at a faster rate than can be explained by
available information on Indigenous births and deaths. Consequently, we need to address the possibility that
compositional change arising from this ‘non-demographic’ growth is affecting our analysis. Hunter (1998)
explicitly assesses the validity of inter-censual comparisons for Indigenous people between 1986 and 1996.
He presents formal statistical tests which allow the possibility to be discounted that compositional change is
affecting the inter-temporal analysis. Since this was a period of sustained and substantial non-demographic
growth this enhances our confidence that the historical trends presented in this paper are reasonably
accurate. While we do not dismiss the problems arising from non-demographic growth, we still stand by the
broad inter-censual comparisons. Hunter’s (1998) evidence indicates that the Indigenous respondents to the
respective censuses are drawn from the same underlying population even though some chose not to identify
as Indigenous in earlier censuses.4
Methodological problems stem from the fact that under the current ABS Indigenous Enumeration Strategy
methodology there are two distinct Indigenous populations: those who complete their own census forms
and those, mainly in rural and remote regions, who have Special Indigenous Forms (SIFs) filled out on their
behalf (Martin et al. 2002). In 1996, it was estimated that 20 per cent of the Indigenous population fell
into the latter category (Altman & Gray 2000). Furthermore, over time, the ABS’s enumeration strategy has
become more sophisticated and presumably will have led not just to better coverage, but to better quality
statistics in more recent censuses. Given that we are mainly interested in long-term trends in Indigenous
outcomes, it is better to focus on every second census to avoid excessive focus on short term inter-censual
fluctuations arising from random variations in the reliability of results. As an economy measure only one-
half of the full 1976 census data were analysed by the then Fraser government. This had a considerable
impact on robustness for the Indigenous count, and so we are more than happy to exclude the data from
that year from our analysis.
The related issue of family and household composition is also important. There is growing evidence that a
significant proportion of Indigenous people in couple relationships have a partner who is non-Indigenous.
As noted above, this is a partial explanator of fast Indigenous population growth because offspring of
such mixed ethnicity couples are often identified by parents (and then later self-identify) as Indigenous.
In measuring changes in socioeconomic indicators, the high proportion of mixed couples creates some
conceptual difficulties that have been noted in the literature (see e.g. O’Reilly 1994). This can generate
some disjuncture between lived social reality of Indigenous households and statistical evidence focused on
Indigenous/non-Indigenous difference, especially in places where such mixed households are common.
There are conceptual difficulties in adopting normative criteria like social indicators from the census in
cross-cultural situations. This is an issue that has been alluded to since census data were first used for
comparing Indigenous and non-Indigenous socioeconomic status (Altman & Nieuwenhuysen 1979). There is
now also a general recognition of the cultural heterogeneity of the Indigenous population across Australia.
In some situations, standard social indicators have meaning, in others they are close to meaningless (Morphy

4 ALTMAN, BIDDLE & HUNTER
CENTRE FOR ABORIGINAL ECONOMIC POLICY RESEARCH CENTRE FOR ABORIGINAL ECONOMIC POLICY RESEARCH
DISCUSSION PAPER N0. 266 5
2002). Social indicators reflect the values and practices of the dominant society that in some situations can
be contested or even rejected outright by Indigenous people (Altman 2001).
The net effect of these data issues on the measured trends in socioeconomic status and their interpretation
is unclear. The changing composition of Indigenous households to include people who previously identified
as non-Indigenous is likely to result in an apparent improvement in outcomes. Similarly, the increasing
incidence of mixed households will probably improve indicators, especially for those outcomes measured at
the household level.
However, such effects must be weighed against the possible effect of ABS refinements in the Indigenous
enumeration strategy. That is, by incorporating previously excluded groups with a greater propensity to
having poor outcomes (e.g. in remote Australia), the results may be counter-balanced by negative trends,
especially in the ten years between 1971 and 1981 when the attempted full enumeration of the Indigenous
population by the ABS was relatively new.
Choi and Gray (1985) describe how the census counts of the Indigenous population changed between 1971
and 1981. For example, the 1971 census created Collection Districts (CDs) in remote areas to cover most
missions, settlements and pastoral properties known to contain Aboriginal populations. However, there may
have been many other CDs where emerging ABS census intelligence was unaware of Indigenous populations.
This issue is important because it reflects on the ‘representativeness’ of the 1971 census.
After the 1971 census, there is reason to believe that census collections improved the representativeness
of the Indigenous population. For example, in 1981 the ABS consulted Aboriginal organisations on field
procedures and ABS officers visited the main discrete communities to meet with Aboriginal councils and
staff to obtain their advice and enlist their aid on ways to improve enumeration procedures (Choi & Gray
1985: 9). As a result of these consultations, the 1981 census introduced a schedule for use in interviewing
Aboriginals where there were language or literacy problems.5 Choi and Gray (1985: 29) provide eight reasons
why the 1981 enumeration of the Indigenous population was an improvement on earlier counts. We would
argue that 1981 Census provided more reliable and representative data on Indigenous population than the
two previous censuses.
If the 1971 census missed a substantial number of Indigenous people in remote and rural areas, then the
socioeconomic indicators will be biased towards those of disproportionately enumerated urban populations.
In the context of this paper, the important observation is that this will mean that, all else being equal, one
would expect a negative change in social indicators between 1971 and 1981. Of course it is impossible to
predict the net effect of such issues a priori; we will return to these issues later in the paper.

6 ALTMAN, BIDDLE & HUNTER
CENTRE FOR ABORIGINAL ECONOMIC POLICY RESEARCH CENTRE FOR ABORIGINAL ECONOMIC POLICY RESEARCH
DISCUSSION PAPER N0. 266 7
THE RISE OF THE COMMUNITY DEVELOPMENT EMPLOYMENT PROJECTS (CDEP) SCHEME AND INDIGENOUS LABOUR FORCE STATUS
The conventional indicators of Indigenous labour force status, such as unemployment rates, need to be
subject to additional caveats. The ongoing low labour market status of Indigenous Australians is due to a
variety of interdependent factors that can be summarised as historical, locational and cultural. The history
of Indigenous Australians differs markedly from other Australians, especially with respect to their exclusion
from the mainstream provisions of the Australian state until the late 1960s. About a third of Indigenous
Australians live in remote Australia where the lack of a developed labour market and the limited availability
of services reduce the opportunities for employment. Cultural factors are also a major determinant of labour
force status. Indigenous people in remote areas are often unwilling to migrate for employment because they
have other important location-specific priorities and lack the requisite skills for labour market recruitment.
On the demand-side, there is also the distinct possibility, though it is under-researched, that employer
discrimination results in labour market distortions (Hunter 2004).
Government policy has attempted to ameliorate and then reverse past employment disadvantage, but in so
doing may have created a situation that circumscribes future options for economic equality. One example
of such unintended consequences may result from the CDEP scheme that allows Indigenous people to work
for the dole on a continuing basis;6 unlike in other work-for-the-dole schemes, they are defined for official
purposes as employed rather than unemployed. In most situations only part-time low paid employment is
available under the scheme. It has been argued that increasing prominence of the scheme may interact with
the incentive to improve educational attainment (Hunter 2002a).7 Consequently, it is important to provide a
brief history of the scheme so that we can more accurately interpret changes in labour force outcomes.
The CDEP scheme was introduced by the Fraser government in 1977 in response to the spread of
Unemployment Benefit payments into remote Indigenous communities (Sanders 1997). In the early 1980s,
some ‘teething’ problems with the scheme were addressed and the scheme began expanding quite rapidly
(see Fig. 1).8 Administrative data from around the time of the 2001 census indicated that there were then
30,474 Indigenous CDEP participants.
In comparison with other Australians the existence of the CDEP scheme creates a fundamental difference
in the relationship of Indigenous people to the labour market and this complicates any comparative
analysis. From an analytical perspective, it is a confounding factor that needs to be examined separately.
Unfortunately, it is not possible to do this thoroughly using the census because information on the CDEP
scheme is only collected in SIF areas. Given that the CDEP scheme is now active in many areas where the SIF
form was not used, the coverage of CDEP data in the census is therefore incomplete. Fortunately the effect
of the scheme can be neutralised by using other census data and criteria to assess comparative labour force
status.

6 ALTMAN, BIDDLE & HUNTER
CENTRE FOR ABORIGINAL ECONOMIC POLICY RESEARCH CENTRE FOR ABORIGINAL ECONOMIC POLICY RESEARCH
DISCUSSION PAPER N0. 266 7
Fig. 1 shows that from 1977, the CDEP scheme grew slowly at first, before expanding rapidly in the 1986–91
intercensual period (Sanders 1997). Overall, the number of participants in the scheme increased by a factor
of eight between 1981 and 1991. A second phase of expansion occurred as a result of the Spicer Review
(Spicer 1997). This second ‘growth’ phase has been characterised as an ‘internal expansion’ whereby scheme
participants were increasingly expected to work for their benefit entitlement (rather than just use the
scheme as a source of income support) and hence were increasingly re-classified as workers (Altman, Gray
& Sanders 2000).
The expansion of the CDEP scheme has been uneven throughout Australia, with urban areas having relatively
few participants until recently. Hunter (2002a, 2002b) uses the differential growth of the CDEP scheme in
certain areas to isolate its effect on labour force status. Obviously such an approach is not possible when
examining national statistics that conflate the influence of the scheme with other labour market factors.
Following Hunter (2004) we focus much of our analysis on private sector employment and full-time
employment because these variables are less affected by the rise of the CDEP scheme.9 Notwithstanding
the possible distorting effect of the CDEP scheme on usual labour force outcomes such as unemployment
Fig. 1. Growth of the CDEP scheme employment
% o
f po
pula
tion
age
d 15
+ em
ploy
ed in
CDE
P
Notes: The number of CDEP employed is estimated as a proportion of the CDEP participants (see Hunter & Taylor 2004). The assumption was increased to 100 per cent following the recommendations of the Spicer Review (1997).
Source: Hunter (2004).
8 ALTMAN, BIDDLE & HUNTER
CENTRE FOR ABORIGINAL ECONOMIC POLICY RESEARCH CENTRE FOR ABORIGINAL ECONOMIC POLICY RESEARCH
DISCUSSION PAPER N0. 266 9
rates, and even participation rates (Hunter 2002b), this paper also reports standard indicators to illustrate
the effect of ignoring changes in CDEP scheme participation. The next section provides the rationale for our
choice of other indicators of socioeconomic status.
CHOICE OF INDICATORS
Altman & Nieuwenhuysen (1979) provide an early overview of the economic status of Indigenous Australians
at the time of the 1971 census. However, since this paper attempts to document trends over a 30-year period
we need to pay close attention to ensuring inter-temporal consistency in the indicators. Accordingly, the
chosen indicators attempt, as much as possible, to account for changes in the relevant census questions and
in the associated non-response rates (i.e. the proportion of ‘not stated’ in each case).
Altman and Hunter (2003) provide a useful starting point for the choice of indicators as they had to
address explicitly the issue of inter-censal comparability. Following Altman and Hunter, we focus on five
sets of variables commonly associated with normative measures of socioeconomic outcomes: employment,
income, housing, education and health. In choosing these variables, we make no comment about their
inter-relationships, although obviously in most situations they are either directly or indirectly linked to one
another. We do not attempt to combine them into any index of socioeconomic disadvantage because this
would not only lead to a loss of information, but would also require certain assumptions about the relative
importance of the measures.
Most census questions have changed to varying degrees since 1971. Even where there were only small
changes in the question asked, the sequencing of the census questionnaire and the ABS coding can vary in
potentially significant ways. Interested readers are referred to Appendix A to view the relevant changes to
the census questions, and to see how we responded to the challenges of making the data comparable over
time.
The remainder of this section outlines the variables chosen within each of the five socioeconomic areas of
interest.
EMPLOYMENT
We have chosen five variables to measure employment outcomes, including the unemployment rate, the
employment to population ratio and the labour force participation rate; all these are standard measures of
employment status. As indicated above, two extra variables were included to control for the influence of
the CDEP scheme: the proportion of adults who are in private sector jobs and those in full-time jobs. Both
variables effectively exclude the influence of the scheme.

8 ALTMAN, BIDDLE & HUNTER
CENTRE FOR ABORIGINAL ECONOMIC POLICY RESEARCH CENTRE FOR ABORIGINAL ECONOMIC POLICY RESEARCH
DISCUSSION PAPER N0. 266 9
INCOME
To measure income status, we have selected two census-based variables: median individual adult income and
median household income. Income has several shortcomings as a measure of access to resources, especially
as the usual focus is on cash income, and non-cash components that may include returns from customary
(non-market) economic activity, employer superannuation contributions, and other non-pecuniary benefits
available to wage and salary earners are not taken into account. There is also evidence that in remote
regions census collectors do not fully enumerate income from non-standard sources like royalty payments
or cash earned from sale of art (Morphy 2002). Income is sensitive to changes in the consumer price index
so all dollars for the period 1981–2001 are expressed in constant 2001 terms. Unlike previous estimates of
Indigenous median income, this paper uses basic techniques from integral calculus and information about
the distribution of income to accurately estimate changes over time (see Appendix 2 for details).10
One potential weakness of the household income measure used in this paper is that equivalence scales were
not used to control for the different costs of living in families of different size and composition (Hunter,
Kennedy & Smith 2003). It was difficult to combine all the information required, especially from the earlier
censuses. However, the choice of equivalence scale could arguably introduce error into the estimated
relativities of household income in the Indigenous and non-Indigenous populations because it is not clear
that there is one equivalence scale that is appropriate for all Australians (Hunter, Kennedy & Biddle 2002).
HOUSING
The two variables that are used to measure housing status are whether the home is owned or being
purchased and the number of persons in the household. Home ownership is important in Australia because
in the absence of any official statistical collections on wealth, it is an important proxy of accumulated
savings and command over resources. In the Indigenous context there is a problem with home ownership as
a proxy: many Indigenous people reside in public housing and, moreover, on Indigenous-owned land there
is often no real-estate market and individual home ownership (in a commercial sense) is often not legally
possible. Similarly, the size of household is generally taken as a measure of overcrowding and poverty, but
large household size can also reflect a cultural preference for co-residence within large extended families.
It should be noted that the measure of home ownership in this paper is different from previous estimates,
including those in Altman and Hunter (2003). Previous estimates report the proportion of Indigenous
households who either own or are purchasing their homes. As a consequence, the increasing incidence of
mixed families may disproportionately affect the measured rate of home ownership. This paper focuses on
the household characteristics of Indigenous people as distinct from other Australians; that is, the unit of
analysis is the person rather than the household. Another rationale for using this indicator is that it more
accurately reflects the welfare of Indigenous people, at least to the extent that home ownership can be said
to affect well-being through wealth or through the security of tenure.11

10 ALTMAN, BIDDLE & HUNTER
CENTRE FOR ABORIGINAL ECONOMIC POLICY RESEARCH CENTRE FOR ABORIGINAL ECONOMIC POLICY RESEARCH
DISCUSSION PAPER N0. 266 11
EDUCATION
Educational status is measured by three variables. One—‘never attended school’—captures a negative
measure of the historical legacy of disadvantage; and two—‘proportion of youth attending an educational
institution’ and ‘holding a post-school qualification’—reflect positive measures. Educational status is clearly
influenced by location of residence, since in many rural and remote situations there are neither secondary
schools nor tertiary education institutions. Education is a very important determinant of employment
outcomes except in remote contexts where labour markets may be small or non-existent and where full-
employment may be impossible.
The estimate of the proportion of youth who are attending or attended post-school educational institution(s)
differ from the analogous outcomes reported in Altman and Hunter (2003) in two important ways. First, the
following estimates exclude students who are currently attending secondary school from the base population
in the denominator. Second, the definition of educational attendance is expanded to include attendance at
any post-secondary institution. The first change was a refinement of method that takes into account that
secondary students do not effectively have a choice as to whether they attend a post-secondary institution.
The second change was rendered necessary by the changing definition of educational institutions, which
made the category of tertiary education harder to compare.
HEALTH
There was no reliable measure of life expectancy at birth calculated for Indigenous and other Australians
from the 1971 and 1981 census data. Consequently, health status is only measured by a rough proxy, the
proportion of the population aged over 55 years. A problem with this variable is its focus on mortality
rather than morbidity. The latter is equally important but historic comparative data, at a national level, are
unavailable. Unfortunately, the proportion of elderly is a very imperfect measure of health because it is also
affected by the fertility rate, which determines the total population numbers in the denominator. However,
an increase in the proportion of the population who are elderly is positive if it represents either a decline
in fertility or a reduction in adult mortality. If fertility is the driving factor, then Indigenous households will
benefit from a long-term reduction in age-related dependency rates, which ultimately reduce the demands
on household financial and infrastructural resources.
ANALYSIS
The broad historical trends in socioeconomic outcomes are reported in three tables to facilitate the
distinction between the absolute and relative levels of indicators from the four censuses examined. Tables 1
and 2 present the absolute indicators for Indigenous and non-Indigenous Australians respectively, with the
comparisons between the censuses illustrating the absolute levels of indicators. Table 3 shows the relative
outcomes by dividing the Indigenous indicator by the analogous result for non-Indigenous people.

10 ALTMAN, BIDDLE & HUNTER
CENTRE FOR ABORIGINAL ECONOMIC POLICY RESEARCH CENTRE FOR ABORIGINAL ECONOMIC POLICY RESEARCH
DISCUSSION PAPER N0. 266 11
Variable 1971 1981 1991 2001
Unemployment rate (% labour force) 9.0 24.6 30.8 20.0
Employment to population ratio (% adults) 42.0 35.7 37.1 41.7
Labour force participation rate (% adults) 46.1 47.3 53.5 52.1
Full-time employment (% adults) 32.9 19.5 21.9 21.6
Private-sector employment (% adults) 29.7 17.2 20.5 22.9
Median income in $2001 – individual n.a. 187.5 211.0 212.6
Median income in $2001 – household n.a. 676.5 653.1 787.1
Home owner or purchasing (% population) 26.1 19.7 19.1 26.8
Household size 4.6 4.1 4.0 3.4
Never attended school (% adults) 22.7 10.7 5.1 3.215–24 year olds attending educational institution (% of non-secondary students) n.a. 6.8 16.0 25.9
Post-school qualification (% adults) 3.2 5.0 9.5 18.2
Population aged over 55 years (%) 7.3 6.4 6.2 6.7
Table 1. Socioeconomic outcomes for Indigenous Australians, 1971–2001
Note: ‘n.a.’ means that the data was not available in that year.
Source: 1971, 1981, 1991, and 2001 censuses.
Variable 1971 1981 1991 2001
Unemployment rate (% labour force) 1.6 5.8 11.4 7.2
Employment to population ratio (% adults) 57.8 58.2 56.3 58.9
Labour force participation rate (% adults) 58.8 61.8 63.6 63.4
Full-time employment (% adults) 48.7 44.3 38.9 38.1
Private-sector employment (% adults) 45.6 41.0 40.6 48.0
Median income in $2001 – individual n.a. 341.0 342.0 379.7
Median income in $2001 – household n.a. 937.7 853.6 1009.8
Home owner or purchasing (% population) 70.5 73.4 70.2 72.9
Household size 3.4 3.1 2.9 2.6
Never attended school (% adults) 0.6 0.7 1.0 1.015–24 year olds attending educational institution (% of non-secondary students) n.a. 17.9 46.2 59.9
Post-school qualification (% adults) 23.7 27.7 32.3 41.6
Population aged over 55 years (%) 17.1 18.6 19.6 22.0
Table 2. Socioeconomic outcomes for non-Indigenous Australians, 1971–2001
Note: ‘n.a.’ means that the data was not available in that year.
Source: 1971, 1981, 1991, and 2001 censuses.

12 ALTMAN, BIDDLE & HUNTER
CENTRE FOR ABORIGINAL ECONOMIC POLICY RESEARCH CENTRE FOR ABORIGINAL ECONOMIC POLICY RESEARCH
DISCUSSION PAPER N0. 266 13
Given that the analysis mixes negative and positive social indicators we need to be aware that a fall in an
indicator could constitute either an improvement or a deterioration in Indigenous well-being. One would
look for improvement to be reflected in a downward trend in the ‘negative measures’ (e.g. unemployment
rates) and an upward trend in the ‘positive measures’ (e.g. employment–population ratios). Socioeconomic
improvement requires negative measures expressed in ratios (relative terms) to shift from >1 towards 1 and
positive measure ratios to shift from <1 towards 1.
Table 1 shows that Indigenous unemployment increased steadily between 1971 and 1991, but then fell
substantially between 1991 and 2001. As noted above, growth in CDEP scheme participation increased
measured Indigenous employment and reduced Indigenous unemployment rates. The trend in Indigenous
unemployment indicates that this CDEP effect did not seem to dominate other changes, at least until after
1991. One reason for this is that overall Indigenous labour force participation rates increased steadily
between 1971 and 1991, but were relatively stable for the last 10-year period up to 2001. However, there
was a demonstrable improvement in the Indigenous employment to population ratio resulting from the
expansion of the CDEP scheme, especially since the 1981 Census (see Fig. 1). Notwithstanding that over 10
per cent of the Indigenous adult population is now employed in the scheme, there was only a six percentage
point improvement in the employment to population ratio between 1981 and 1991. That is, non-CDEP
scheme employment may have fallen in this period.
The two indicators of non-CDEP scheme employment examined were full-time employment and private
sector employment, both of which were reasonably stable or improving slowly after the initial slump in
Indigenous employment between 1971 and 1981. After 1981 private sector employment increased slightly
in each of the censuses examined, while full-time employment increased by around two percentage
points between 1981 and 1991, but then remained relatively stable at just under 22 per cent of the adult
population to 2001.
While the individual income was not available for the 1971 Census, the underlying trend in real income is
consistent with the apparent pattern in non-CDEP scheme employment since 1981. That is, there was a small
steady improvement in the median income for Indigenous adults between 1981 and 1991 and between 1991
and 2001.
In contrast, there was a small decrease in household income associated with Indigenous people in the 10
years to 1991 but a substantial improvement in the median household income between 1991 and 2001.
The apparent anomaly between 1981 and 1991 may be explained by the change in household size and
composition. For example, Harding (1997: 347) shows that there was a fall in household income in the 1980s
for the Australian population as a whole. That finding was reversed when equivalised income was used to
account for the higher costs of maintaining larger households and differential cost structures associated
with looking after children of various ages. We will return to this point later.

12 ALTMAN, BIDDLE & HUNTER
CENTRE FOR ABORIGINAL ECONOMIC POLICY RESEARCH CENTRE FOR ABORIGINAL ECONOMIC POLICY RESEARCH
DISCUSSION PAPER N0. 266 13
The rate of home ownership among Indigenous people fell substantially between 1971 and 1981 from 26.1
per cent to 19.7 per cent. Home ownership was relatively stable in the 1980s before increasing in 2001 to
just over the level it was in 1971.
Household size has declined in each census examined with the largest falls in the first decade and the third
decade. The recent decline in Indigenous fertility identified in Kinfu and Taylor (2002) appears to have been
reflected in smaller household size.
Unlike the other socioeconomic areas of interest, the long-term trend in formal Indigenous education
has been a clear unequivocal improvement. The proportion of Indigenous adults who have never been to
school fell in every decade with a dramatic overall reduction from 22.7 per cent (in 1971) to 3.2 per cent (in
2001).
The proportion of Indigenous youth attending a tertiary educational institution increased steadily in each
of the two decades where data were available. Attendance almost quadrupled between 1981 and 2001 from
6.8 per cent to 25.9 per cent. The incidence of the post-school qualification among Indigenous adults also
increased in each decade examined with an apparent acceleration in the increase between 1981 and 2001
when the proportion with qualifications increased from 5.0 per cent to 18.2 per cent (from 3.2% in 1971).
Unfortunately, there was no reliable data on the quality or type of educational qualification for the period
being examined.
Unlike the long-term trend in the rest of the developed world, the proportion of the Indigenous population
who had reached old age (i.e. aged 55+) declined in the two decades between 1971 and 1991 (from 7.3% to
6.2%). It did, however, increase marginally between 1991 and 2001 (to 6.7%). Given that there is evidence
that high Indigenous fertility rates are beginning to fall and converge towards those in the rest of the
Australian community, at least in the last inter-censual period (Kinfu & Taylor 2002), some of the recent
improvement in this indicator may be due to declining Indigenous birth rates. While the trend to 1991 is
clearly of concern, there are likely to be long lags in the effectiveness of health policy on mortality and
fertility rates.
Table 2 documents the analogous trends for non-Indigenous Australians. The trend in non-Indigenous
unemployment rates was similar to that observed for the Indigenous population—the notable exception
was that the Indigenous unemployment rate increased from a much higher base in 1971 than the non-
Indigenous rate.
Non-Indigenous employment was quite stable between 1971 and 2001, hovering around 58 per cent. In
contrast, the Indigenous employment to population ratio has increased at a reasonable rate since 1981—a
fact that is consistent with the increasing importance of the CDEP scheme since 1977.
Non-Indigenous labour force participation grew between 1971 and 1991 (58.8% and 63.6%), and then fell
marginally to 2001 (63.4%). This pattern was almost identical to that observed for Indigenous Australians.
However, non-Indigenous participation was coming from a higher base than Indigenous participation and

14 ALTMAN, BIDDLE & HUNTER
CENTRE FOR ABORIGINAL ECONOMIC POLICY RESEARCH CENTRE FOR ABORIGINAL ECONOMIC POLICY RESEARCH
DISCUSSION PAPER N0. 266 15
hence there was less scope for increasing total labour force participation among non-Indigenous people.
Consequently, between 1971 and 2001 the increase in participation rates for Indigenous and non-Indigenous
adults were 6.0 percentage points and 4.6 percentage points respectively.
The rate of full-time employment among non-Indigenous adults declined substantially between 1971 and
2001, with most of the fall being concentrated in the first two decades. While the overall decline in full-time
employment in the three decades was even more pronounced among Indigenous adults, the decline was
entirely concentrated between 1971 and 1981. That is, the improvement in full-time employment among
Indigenous adults since 1981 is particularly noteworthy since this is going against the trend in the rest of
Australian society.
Non-Indigenous employment in the private sector improved over the long run, although it was somewhat
depressed at the time of the 1981 and 1991 censuses. While Indigenous private sector employment grew
steadily between 1981 and 2001, the decline between 1971 and 1981 outweighed the later steady increases
with the net result that the long-term trend was negative.
Median individual income for the non-Indigenous population decreased slightly between 1981 and 1991
before increasing substantially up to 2001. A similar trend was evident in household income although the
fall in the median income in the first decade was proportionately greater for households compared to
individuals. As indicated above, Harding (1997: 347) points to the fall in household income during the 1980s
being as a result of changes in household size and composition.
Home ownership was relatively stable between 1971 and 2001. The rate of home ownership among the non-
Indigenous population did vary between the various censuses, but the variation is rather random, moving
between 70 and 73 per cent. While the pattern of change in home ownership rates was different to that
in the Indigenous population, the seemingly random pattern may be an indication that this indicator is
somewhat sensitive to living arrangements or that the census questions have changed erratically through
time.
The long–term Australian trend towards living in smaller households is clearly evident in Table 2. Non-
Indigenous household size fell very steadily from 3.4 people per house in 1971 to 2.6 people per house in
2001.
In terms of education, non-Indigenous Australians fared better in formal education than Indigenous
people in all the periods examined. The proportion of non-Indigenous adults who never went to school was
exceptionally low in 1971 at 0.6 per cent. While the change in this outcome was small in the following three
decades, it did appear to increase marginally to 1.0 per cent, although this probably says more about the
inaccuracy of early census data rather than indicating any actual trend.
A clear trend is evident for the other education outcomes for non-Indigenous people. The proportion of
non-Indigenous youth attending tertiary institutions increased dramatically between 1981 and 2001 (from
17.9% to 59.9%). However, in contrast to Indigenous outcomes which saw a relatively steady improvement

14 ALTMAN, BIDDLE & HUNTER
CENTRE FOR ABORIGINAL ECONOMIC POLICY RESEARCH CENTRE FOR ABORIGINAL ECONOMIC POLICY RESEARCH
DISCUSSION PAPER N0. 266 15
in attendance, the bulk of the change for non-Indigenous youth occurred in the decade between 1981 and
1991 (when it increased by 28.3 percentage points).
The proportion of non-Indigenous adults with post-school qualifications increased in each of the three
decades between 1971 and 2001 (from 23.7% to 41.6%). While the largest increase in the incidence of
qualification occurred in the 1990s, there was some evidence of acceleration in the rate at which non-
Indigenous people were securing qualifications in the 1980s.
In contrast to the Indigenous population, the proportion of non-Indigenous people aged 55 and over increased
steadily between 1971 and 2001. As indicated above this is consistent with the general phenomenon of the
aging of the Australian population (Commonwealth of Australia 2002).
In terms of closing the gaps in relative well-being, the ratio of Indigenous to non-Indigenous outcomes
provides crucial information (Table 3). As indicated above, for relative improvements in outcomes to occur,
the ratios should track downwards over time towards 1 for negative indicators like the unemployment rate;
and upwards towards 1 for positive indicators like employment to population ratios.
The relative unemployment rate improved substantially between 1971 and 2001. One reason for the
coincidence between the trends in the absolute and relative outcomes for unemployment rates is that the
CDEP scheme has been increasing Indigenous employment since the 1981 census. The substantial fall in
Variable 1971 1981 1991 2001
Unemployment rate (% labour force) 5.44 4.22 2.7 2.79
Employment to population ratio (% adults) 0.73 0.61 0.66 0.71
Labour force participation rate (% adults) 0.78 0.77 0.84 0.82
Full-time employment (% adults) 0.68 0.44 0.56 0.57
Private-sector employment (% adults) 0.65 0.42 0.50 0.48
Median income in $2001 – Individual n.a. 0.55 0.62 0.56
Median income in $2001 – Household n.a. 0.72 0.77 0.78
Home owner or purchasing (% population) 0.37 0.27 0.27 0.37
Household size 1.33 1.32 1.38 1.31
Never attended school (% adults) 39.32 14.42 5.21 3.1415–24 year olds attending educational institution (% of non-secondary students) n.a. 0.38 0.35 0.43
Post-school qualification (% adults) 0.13 0.18 0.30 0.44
Population aged over 55 years (%) 0.43 0.34 0.31 0.31
Table 3. Ratio of Indigenous to non-Indigenous outcomes, 1971–2001
Note: ‘n.a.’ means that the data was not available in that year.
Source: Ratio of the outcomes in tables 1 and 2.

16 ALTMAN, BIDDLE & HUNTER
CENTRE FOR ABORIGINAL ECONOMIC POLICY RESEARCH CENTRE FOR ABORIGINAL ECONOMIC POLICY RESEARCH
DISCUSSION PAPER N0. 266 17
relative employment outcomes leading up to 1981 may either be a reflection of the deterioration in the
labour market situation facing Indigenous people at that time or a result of the increased enumeration of
remote Indigenous Australians mentioned earlier. However, the relative improvement since 1981 is largely
due to increased CDEP scheme employment.
In relative terms, Indigenous labour force participation has been trending upwards with all the relative
improvement occurring between 1981 and 1991 (when the relativities increased from 0.77 to 0.84).
The decline in Indigenous employment outcomes between 1971 and 1981 was confirmed by the change in
the ratios of Indigenous to non-Indigenous outcomes in full-time and private sector employment. For both
sorts of jobs the ratios fell by over 23 percentage points in this period. However, since that time there has
been a substantial recovery in Indigenous involvement in full-time and private sector employment vis-à-
vis other Australians—although neither types of employment returned to the relative outcomes evident in
1971.
The relative trends in individual and household incomes were generally positive for the period for which data
was available. Most of the relative improvement in incomes occurred between 1981 and 1991. Indeed, the
ratio of median individual incomes declined substantially between 1991 and 2001, although the ratio was
still higher at the last census than it was for the 1981 Census.
Given that this paper uses a different technique to estimate the median income it is worth reflecting briefly
on the effect of the methodology on income trends. The use of our new calculus-based technique had little
or no effect on the ratio of household median incomes calculated using the conventional (proportional
allocation) technique. This is comforting in the sense that the proportional allocation technique is only a
rough approximation because it does not use any information about the overall distribution of income.
However, trends in individual income were altered somewhat by using the more sophisticated technique.
While there was no difference in relative incomes when alternative techniques were used on 1981 data, the
conventional technique overestimates the relative outcomes in the later censuses vis-à-vis our technique.
For example, in 2001 the ratio of medians for the conventional technique was 0.59, rather than the 0.56
estimated using our technique. That is, the relative improvement in individual incomes in the 1980s and
1990s tends to be overstated unless one uses all the information available in census data. Consequently, it is
advisable that a calculus-based technique be used for future calculations (see Appendix 2).
The seemingly random fluctuations in home ownership for various household types are reflected in the
large changes in relative home ownership rates. Taken at face value, relative outcomes in home ownership
declined substantively between 1971 and 1981, before recovering to their 1971 levels by the time of the
2001 Census.
One possible explanation is that the types of Indigenous households covered by the 1971 census were
different to later censuses. As indicated above, the 1971 census may have been more likely to collect
information from stable households—for example, those living in homes that were either owned or being

16 ALTMAN, BIDDLE & HUNTER
CENTRE FOR ABORIGINAL ECONOMIC POLICY RESEARCH CENTRE FOR ABORIGINAL ECONOMIC POLICY RESEARCH
DISCUSSION PAPER N0. 266 17
purchased. The subsequent development of the Indigenous enumeration strategy would enable a more
representative picture of Indigenous Australians, including homeless and more mobile populations. Therefore
if one discounts the 1971 data, then relative outcomes for home ownership have been improving since 1981.
Taken at face value, there has been a substantial increase in the relative access of Indigenous people to
finance, and by implication wealth, since the 1981 census.
While the fall in non-Indigenous household size was large, it was substantially smaller than that observed
for Indigenous households. However, this is almost entirely due to the fact that Indigenous households were
much larger than other households in 1971. Indeed, there was little change in relative outcomes between
1971 and 2001.
Table 3 shows that the improvements in Indigenous educational outcomes since 1971 have been evident in
relative as well as absolute indicators. The largest improvement was for ‘never attended school’ for which the
ratio declined from just under 40 in 1971 to around three by 2001. The relative disadvantage for Indigenous
people has declined dramatically as Indigenous people are now far more likely to have engaged with the
formal education system in some way.
Relative attendance of Indigenous youth at tertiary institutions also improved, although the improvement
was far less dramatic than for the ‘never attended school’ variable. Indeed the ratio of Indigenous to other
Australian outcomes only improved between 1991 and 2001 (when it increased from 0.35 to 0.43). Post-
school qualification also improved in relative terms, with the rate of change being relatively constant in the
three decades between 1971 and 2001.
Notwithstanding the evidence of relative improvement in Indigenous education, the inability to take into
account the quality of education raises concern. For example, Altman and Hunter (2003) find that most of
the growth in educational participation of Indigenous youth in the 1990s has been outside the university
sector. Consequently, the failure to keep up with the non-Indigenous population in terms of the quality of
education may limit the effectiveness of the apparent growth in Indigenous education for translating into
better employment outcomes—where jobs are available.
Finally, in terms of the proportion of the population who were aged 55 years, the relative situation for
Indigenous people got worse between 1971 and 1991. After 1991, the relative Indigenous outcome stayed
stable at around 0.31 of the non-Indigenous situation. Irrespective of the interpretation of this indicator (i.e.
whether it reflects fertility or adult mortality), there is a lot of ground to make up to return the demographic
profile to its 1971 levels.

18 ALTMAN, BIDDLE & HUNTER
CENTRE FOR ABORIGINAL ECONOMIC POLICY RESEARCH CENTRE FOR ABORIGINAL ECONOMIC POLICY RESEARCH
DISCUSSION PAPER N0. 266 19
CONCLUSION
This paper set out to track broad statistical trends in socioeconomic status of Indigenous and other
Australians over the 30 years between 1971 and 2001. This allows us to assess the extent to which the goal of
‘closing the gaps’ between Indigenous and other Australians has been achieved. The paper has been written
at a time when federal Indigenous affairs policy is in a phase of rapid change, in which there is considerable
partisan contestation over policy direction (Altman 2004). In such circumstances, it is appropriate to look
for some historical depth and trends in outcomes to avoid focusing too much on sort-term analysis that can
sometimes be little more than anecdotal.
Our analysis of Indigenous socioeconomic status reflects back over the past 30 years to examine social
indicators from the 1971, 1981, 1991 and 2001 censuses. This approach has strengths. First, the length of
coverage makes it relatively apolitical because there have been attempts by many Australian governments to
address Indigenous disadvantage over this 30-year period. Second, using official statistics and social indicators
from the census means that change, both in absolute terms for the enumerated Indigenous population over
time, and in comparative terms between Indigenous and other Australians, can be assessed.
This approach also has weaknesses. As attempts to fully enumerate and identify the Indigenous component
of the Australian population only began at the time of the 1971 census, it is clear that there were early
teething problems in gaining complete coverage of this population. And in subsequent censuses, as the
Indigenous population has increased rapidly, it has become clear that there has been a growing propensity
for Indigenous people to identify in the census and for children of marriages of mixed ethnicity to be
identified as Indigenous. However, statistical tests used by Hunter (1998) demonstrate the validity of inter-
censual comparisons for Indigenous people between 1986 and 1996—a period when there was substantial
growth in the Indigenous population that could not be explained by biological factors alone.
The social indicators used in this analysis are limited to the national level only. Much other research
undertaken over the last 25 years from Altman and Nieuwenhuysen (1979) to Altman (1991) to Taylor
(1993) to ABS (2003) and Hunter (2004) has highlighted that there are significant variations in Indigenous
socioeconomic status at sub-national, State, section-of-State, and regional levels. This is not an issue
of which we are unaware or that we seek to ignore; it is just a statistical reality that reconstruction of
social indicators back to 1971 at anything but the national level would be too methodologically fraught
to contemplate. While the national perspective of this paper ignores regional and individual community
variations in outcomes, the trends in aggregate data are of interest in their own right.
To briefly summarise our findings, we have shown that Indigenous outcomes have improved since 1971.
However, improvements have been slow. In absolute terms, most indicators show improvement since 1981,
with two exceptions. First, the unemployment rate has gone up absolutely, but not in relative terms. Second,
and more worrying, the proportion of the population aged over 55 years has not altered, suggesting that
Indigenous health status remains intractably low compared to other Australians. While this variable has

18 ALTMAN, BIDDLE & HUNTER
CENTRE FOR ABORIGINAL ECONOMIC POLICY RESEARCH CENTRE FOR ABORIGINAL ECONOMIC POLICY RESEARCH
DISCUSSION PAPER N0. 266 19
distinct limitations as a measure of health status, it is the best available in the census and for the time period
we are examining. If nothing else, the analysis of this variable highlights the fact that the crucial factors
underlying the demographics of the Indigenous population are slow to change over time.
Our analysis is replete with information for further debate and research. In conclusion we will focus here on
only four final issues. First, we have been surprised at just how difficult it is to garner comparable statistical
information about the socioeconomic status of the Indigenous population over time.12 We note that great
care is needed to ensure that the same question has been asked and the same variable measured over time;
and we readily acknowledge, somewhat reflexively, that this caution needs to be heeded in our own previous
research that has sometimes incorporated statistical data from secondary sources a little uncritically. The
emergence of new comparative sources of official information about Indigenous socioeconomic status, as
in the recently completed National Aboriginal and Torres Strait Islander Social Survey 2002 (ABS 2004) is
important and must be supported and maintained.
Second, our long-term analysis of official statistics at the national level indicates that in most areas
social indicators are showing slow improvement. This is counter to the view—that has some currency—
that Indigenous policy and outcomes have been an unmitigated failure. It might be arguable whether
improvements have occurred quickly enough or if they have been equitably spread across the Indigenous
population, but these are issues of a different order from the overarching observation that using comparable
indicators Indigenous socioeconomic status, as measured by normative criteria, has improved over the last
30 years to 2001.
Third, while this paper has sought to avoid drawing links between particular policy approaches and social
indicator outcomes, the slow improvements over time are more indicative of broad policy settings being
correct than of policy failure. This in turn provides a cautionary note from our analysis, that any radical
change in policy approach at the national level might jeopardise a slow process of improvement that history
suggests is under way. This though is not to suggest that policy refinement might not be needed at the sub-
national level, for a focus on averages inherent in broad brush statistical analysis will inevitably overlook the
extremes and outliers. Clearly, statistical analysis for particular localities or regions would provide different
results.
Ultimately, as has been noted in the past, the whole notion of ‘statistical equality’, as favoured by the Hawke
government in the 1980s, or of ‘practical reconciliation’ and ‘closing the gaps’ as favoured by the current
Howard government is potentially fraught if based on social indicators. As noted over a decade ago by
Sanders (1991), such approaches are ‘destined to fail’. This is primarily because similar statistical outcomes
can only result from similar resource endowments, histories, legacies, aspirations and location of residence.
And clearly, long-term equality would need, as a first step, to ensure that existing shortfalls are completely
addressed. Viewing Indigenous socioeconomic progress as a process that is seeking equality, in some simple
statistical sense, with mainstream Australian norms is problematic and contestable. Nevertheless, this goal

20 ALTMAN, BIDDLE & HUNTER
CENTRE FOR ABORIGINAL ECONOMIC POLICY RESEARCH CENTRE FOR ABORIGINAL ECONOMIC POLICY RESEARCH
DISCUSSION PAPER N0. 266 21
has remained at the core of Indigenous affairs policy since benchmarks were first established, and it is a goal
that is now deeply embedded in Australian public policy approaches.
In accepting this, it is incumbent on all parties to strengthen frameworks for measuring outcomes, to ensure
that adequate and accurate assessment is undertaken more frequently.
NOTES
1. Note that while Wells (2003) shows there is no consensus on the ‘natural rate’ of unemployment in Australia, unemployment rates in the early 1970s were at historically low levels.
2. See Taylor (2002: 4–5) for a more nuanced and detailed description of the statistical consequences of the 1967 referendum.
3. A more accurate picture of the population is provided by the estimated resident population (erp), which is higher in all censuses. While the Indigenous erp is estimated to be 460,000 for the 2001 census there is no analogous calculation for 1971.
4. Note there have been changes in the way in which questions about Indigenous status have been asked in successive censuses (see Ross 1999 for details).
5. The use of interviews in selected areas was pioneered in the Northern Territory in 1976, and was extended to South Australia and Western Australia in 1981 (Choi & Gray 1985: 13). The ABS also devolved central national control of enumeration procedures to the State level so that local conditions could be fully considered (Choi & Gray 1985: 9).
6. In practice, some CDEP scheme projects may not always operate in this way. For example, it is possible to top up unemployment benefit entitlements with income from producing art for sale, an activity sponsored by many CDEP organisations. Also, some CDEP organisations do not compel everyone to formally work for the equivalent of their benefit entitlement—e.g. participation in the customary economy can be the basis of receiving CDEP income.
7. Note that this question is still open to debate. Misko (2004) criticises Hunter’s argument that the success of the CDEP scheme may encourage students to leave school early and not complete the educational qualifications essential for entry in the mainstream labour market. According to Misko, this does not seem to be true for 15- to 17-year-olds because only 8.7 per cent of this age group are employed in the scheme, with well over a third of the group (43.5%) having already left school. While these are interesting facts, Misko’s argument fails to engage with the substance of Hunter’s argument—that the incentives to pursue formal education are blunted in that a ‘career’ in the CDEP scheme does not require attendance at school. The incentive issue may effect educational participation well before a person’s 15th birthday.
8. The CDEP scheme proved immediately popular, but was initially beset by a number of budgetary and administrative problems, which inhibited its expansion.
9. While such measures may be driven by the preferences for part-time and private sector employment, taken together they provide an indication of what would happen in the absence of the CDEP scheme.

20 ALTMAN, BIDDLE & HUNTER
CENTRE FOR ABORIGINAL ECONOMIC POLICY RESEARCH CENTRE FOR ABORIGINAL ECONOMIC POLICY RESEARCH
DISCUSSION PAPER N0. 266 21
10. Median incomes for Indigenous Australians have previously been estimated using a proportional allocation of respondents within the relevant income ranges (within which the 50th percentile resides). However, this fails to take into account distributional information contained in the other income categories. This is probably not that important when only examining Indigenous medians, although it will tend to impart a predictable bias on the results (i.e. there is a tendency to overstate the true median). However, it may be a crucial issue when comparing Indigenous and non-Indigenous medians as the income distributions for the respective populations are very different. Indigenous incomes are more skewed to the left and hence the empirical probability density function (pdf) has a discernible negative slope around the median. That is, the proportional allocation of the income range may not be valid for Indigenous distributions. The empirical pdf for the non-Indigenous population tends to be flatter around the median and hence the conventional proportional allocation of the median income range may be a reasonable approximation. Whatever the distributional properties, the information on the slope of the empirical pdf between category mid-points can be used to estimate the cumulative density function (cdf) for respective income values. As with all cdf calculations, it is estimated by estimating the area under the curve of the pdf between the respective midpoints on income ranges (i.e. using calculus). In this way, it is possible to accurately estimate the median as being the income at which 50 per cent of the respective populations have lower incomes. While there are some theoretical concerns that make it important to control for the different distributions of Indigenous and non-Indigenous income when estimating median over time, this calculation allows us to demonstrate the empirical significance of the issue. By comparing the method of proportional allocation of income ranges with our more technically correct technique that involves a rudimentary application of calculus, we can validate the accuracy of changes in income indicators over time. The mechanics of our technique are provided in Appendix 2.
11. The alternative measure of home ownership that focuses directly on Indigenous and other households, rather than people within households, has the strength that it captures the shortfalls in the housing stock. However, such measures are difficult to use as a welfare indicator since they take the household composition as a given.
12. This should not been seen as a criticism of the ABS or its collection strategy. While in hindsight it could be said that greater consistency in questions and Indigenous enumeration strategy would have been highly desirable, it is of course recognised that this is always more easily said than done, and furthermore, doing so might come into conflict with other aims of the census.

22 ALTMAN, BIDDLE & HUNTER
CENTRE FOR ABORIGINAL ECONOMIC POLICY RESEARCH CENTRE FOR ABORIGINAL ECONOMIC POLICY RESEARCH
DISCUSSION PAPER N0. 266 23
Table A1: Constructing comparable variables for respective censuses
Question and census year Coding and other information used in variable construction
Indigenous Status – 1971(5) What is this person’s racial origin?
(If of mixed origin indicate the one to which he considers himself to belong)
1 ¨European origin
2 ¨Aboriginal origin
3 ¨Torres Strait Islander origin
4 ¨Other origin (give one only)
Indigenous = Aboriginal origin (5)
or Torres Strait Islander origin (5)
Non-Indigenous = European origin (5)
or Other origin (5)
Not stated - excluded
Indigenous Status – 1981(16) Is the person Aboriginal or Torres Strait Islander
(For persons of mixed origin, indicate the one to which they consider themselves to belong)
1 ¨No
2 ¨Yes, Aboriginal
3 ¨Yes, Torres Strait Islander
Indigenous = Yes, Aboriginal (16)
or Yes, Torres Strait Islander (16)
Non-Indigenous = No (16)
Not stated - excluded
Indigenous Status – 1991(13) Is the person of Aboriginal or Torres Strait Islander origin
(For persons of mixed origin, indicate the one to which they consider themselves to belong)
1 ¨No
2 ¨Yes, Aboriginal
3 ¨Yes, Torres Strait Islander
Indigenous = Yes, Aboriginal (13)
or Yes, Torres Strait Islander (13)
Non-Indigenous = No (13)
Not stated - excluded
Indigenous Status – 2001(17) Is the person of Aboriginal or Torres Strait Islander origin
(For persons of both Aboriginal and Torres Strait Islander origin, mark both “Yes” boxes)
1 ¨No
2 ¨Yes, Aboriginal
3 ¨Yes, Torres Strait Islander
Indigenous = Yes, Aboriginal (17)
or Yes, Torres Strait Islander (17)
Non-Indigenous = No (17)
Not stated - excluded
APPENDIX A. CONSTRUCTING COMPARABLE VARIABLES FOR RESPECTIVE CENSUSES

22 ALTMAN, BIDDLE & HUNTER
CENTRE FOR ABORIGINAL ECONOMIC POLICY RESEARCH CENTRE FOR ABORIGINAL ECONOMIC POLICY RESEARCH
DISCUSSION PAPER N0. 266 23
Question and census year Coding and other information used in variable construction
Age – 1971(Part 1) Age
(in years and completed months)
¨ Years ¨ Months
Aged 55 years and over =
Age – 1981(3) AgeIn years and completed monthsIf age is less than one year, write “0” years and the number of completed months ¨ Years ¨ Months
Aged 55 years and over =
Age – 1991
(4) Mark each person’s age last birthday
If age is less than one year, mark box (0)
Mark one box for each person
<A series of age boxes from 0 to 89 was given. Those over 90 were asked to write in their age.>
Aged 55 years and over =
Age – 2001
(4) What was the person’s age last birthday?
If age is less than one year, write ‘0’
<People were asked to write their age up until 99. Those 100 years or more were asked to tick a box indicating so.>
Aged 55 years and over =
APPENDIX TABLE A1 CONTINUED
Aged 55 years and over
Total Population
Aged 55 years and over
Total Population
Aged 55 years and over
Total Population
Aged 55 years and over
Total Population

24 ALTMAN, BIDDLE & HUNTER
CENTRE FOR ABORIGINAL ECONOMIC POLICY RESEARCH CENTRE FOR ABORIGINAL ECONOMIC POLICY RESEARCH
DISCUSSION PAPER N0. 266 25
Question and census year Coding and other information used in variable construction
Employment – 1971
(14) (a) Did this person have a full or part-time job, or business or farm of any kind last week?
Tick ‘yes’ even if this person was temporarily absent from a job because of sickness, holidays, industrial dispute, etc.
Tick ‘no’ if this person did not have a job or did only unpaid housework
Yes ¨ No ¨(b) Did this person do any work at all last week for payment or profit?
Tick ‘yes’ even if this person was working only part-time or helping without pay in a family business
Tick ‘no’ if this person did not work or did only unpaid housework
Yes ¨ No ¨(c) Was this person temporarily laid off by his employer without pay for the WHOLE of last week?
Yes ¨ No ¨(d) Did this person look for work last week?
Looking for work means being registered with the Commonwealth Employment Service, or approaching a prospective employer, or placing or answering advertisements, or writing letters of application, or awaiting the results of recent applications
¨ Yes, looking for first job
¨ Yes, but not for first job
¨ No
(15) How many hours per week does this person usually work in the job or jobs held last week?
Main job _____ hours
Other job(s) _____ hours
(17) (c) What is the full address of the Division, or Branch, or Section (if any) or business at which he works
(Persons with no fixed place of work last week, e.g. taxi-drivers, airline pilots, etc., write ‘N.A.’)
(d) What kind of industry, business, or service is carried out at this address? (Use two or more words.)
Unemployed = Yes (14d)
Employed = Yes (14a)
or Yes (14b)
In the labour force = Unemployed or employed
Unemployment rate =
Employment to population ratio =
Labour force participation rate =
Full-time employment =
Private-sector employment =
* Does not include those who did not state their employment status
APPENDIX TABLE A1 CONTINUED
Employed
Total population 15 plus*
Unemployed
In the labour force
In the labour force
Total population 15 plus*
Works 35 hours or more (15)
Total population 15 plus*
Private sector (17a & 17d)
Total population 15 plus*
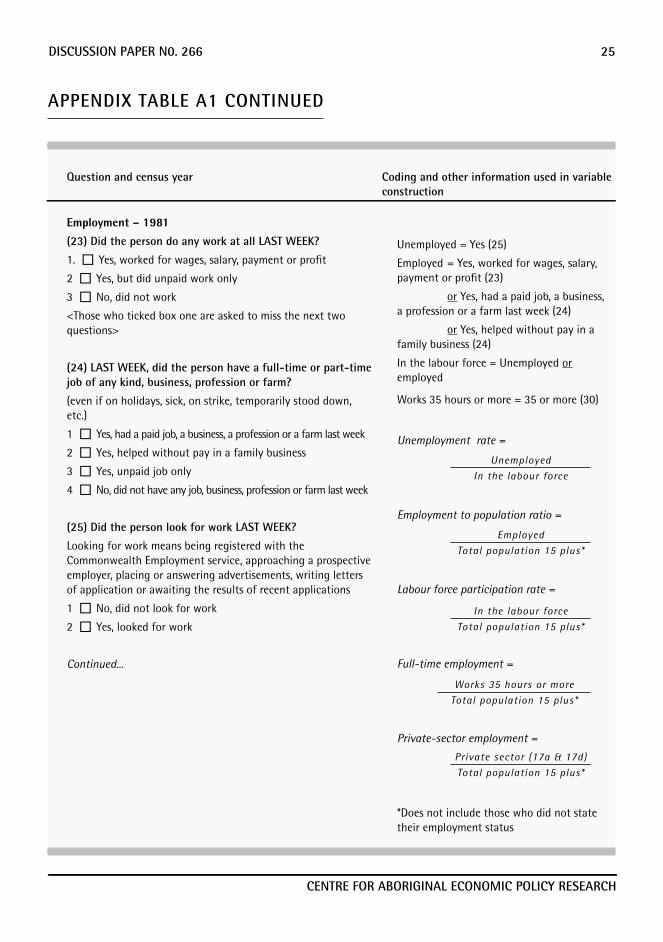
24 ALTMAN, BIDDLE & HUNTER
CENTRE FOR ABORIGINAL ECONOMIC POLICY RESEARCH CENTRE FOR ABORIGINAL ECONOMIC POLICY RESEARCH
DISCUSSION PAPER N0. 266 25
Question and census year Coding and other information used in variable construction
Employment – 1981
(23) Did the person do any work at all LAST WEEK?
1. ¨ Yes, worked for wages, salary, payment or profit
2 ¨ Yes, but did unpaid work only
3 ¨ No, did not work
<Those who ticked box one are asked to miss the next two questions>
(24) LAST WEEK, did the person have a full-time or part-time job of any kind, business, profession or farm?
(even if on holidays, sick, on strike, temporarily stood down, etc.)
1 ¨ Yes, had a paid job, a business, a profession or a farm last week
2 ¨ Yes, helped without pay in a family business
3 ¨ Yes, unpaid job only
4 ¨ No, did not have any job, business, profession or farm last week
(25) Did the person look for work LAST WEEK?
Looking for work means being registered with the Commonwealth Employment service, approaching a prospective employer, placing or answering advertisements, writing letters of application or awaiting the results of recent applications
1 ¨ No, did not look for work
2 ¨ Yes, looked for work
Continued...
Unemployed = Yes (25)
Employed = Yes, worked for wages, salary, payment or profit (23)
or Yes, had a paid job, a business, a profession or a farm last week (24)
or Yes, helped without pay in a family business (24)
In the labour force = Unemployed or employed
Works 35 hours or more = 35 or more (30)
Unemployment rate =
Employment to population ratio =
Labour force participation rate =
Full-time employment =
Private-sector employment =
*Does not include those who did not state their employment status
APPENDIX TABLE A1 CONTINUED
Employed
Total population 15 plus*
Unemployed
In the labour force
In the labour force
Total population 15 plus*
Works 35 hours or more
Total population 15 plus*
Private sector (17a & 17d)
Total population 15 plus*
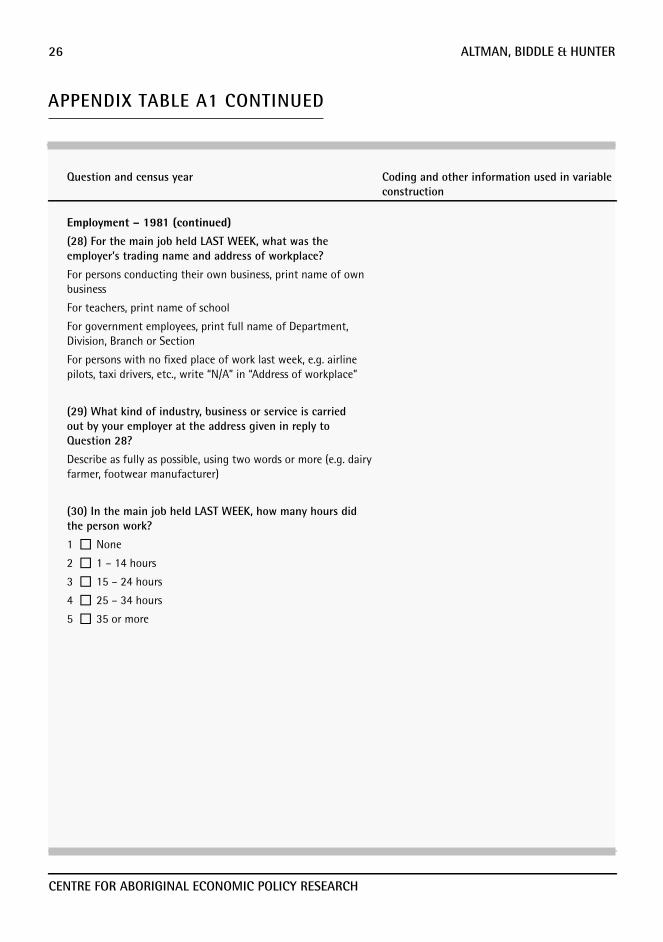
26 ALTMAN, BIDDLE & HUNTER
CENTRE FOR ABORIGINAL ECONOMIC POLICY RESEARCH CENTRE FOR ABORIGINAL ECONOMIC POLICY RESEARCH
DISCUSSION PAPER N0. 266 27
Question and census year Coding and other information used in variable construction
Employment – 1981 (continued)
(28) For the main job held LAST WEEK, what was the employer’s trading name and address of workplace?
For persons conducting their own business, print name of own business
For teachers, print name of school
For government employees, print full name of Department, Division, Branch or Section
For persons with no fixed place of work last week, e.g. airline pilots, taxi drivers, etc., write “N/A” in “Address of workplace”
(29) What kind of industry, business or service is carried out by your employer at the address given in reply to Question 28?
Describe as fully as possible, using two words or more (e.g. dairy farmer, footwear manufacturer)
(30) In the main job held LAST WEEK, how many hours did the person work?
1 ¨ None
2 ¨ 1 – 14 hours
3 ¨ 15 – 24 hours
4 ¨ 25 – 34 hours
5 ¨ 35 or more
APPENDIX TABLE A1 CONTINUED

26 ALTMAN, BIDDLE & HUNTER
CENTRE FOR ABORIGINAL ECONOMIC POLICY RESEARCH CENTRE FOR ABORIGINAL ECONOMIC POLICY RESEARCH
DISCUSSION PAPER N0. 266 27
Question and census year Coding and other information used in variable construction
Employment – 1991
(30) Last Week, did the person have a full-time or part-time job of any kind?
¨ Yes, worked for payment or profit. Now go to 32
¨ Yes, but absent on holidays, on sick leave, on strike or temporarily stood down. Now go to 32
¨ Yes, unpaid work in a family business. Now go to 32
¨ Yes, other unpaid work
¨ No, did not have job
(31) Did the person actively look for work at any time in the last 4 weeks?
Actively looking for work means checking or being registered with the Commonwealth Employment Service; writing, telephoning or applying in person to an employer for work; or advertising for work
¨ No, did not look for work. Now go to 40
¨ Yes, looked for full-time work. Now go to 40
¨ Yes, looked for part-time work. Now go to 40
(33) In the main job held last week, how many hours did the person work
Subtract any time off, add any overtime or extra time worked
¨ None
¨ 1 – 15 hours
¨ 16 – 24 hours
¨ 25 – 34 hours
¨ 35 – 39 hours
¨ 40 hours
¨ 41 – 48 hours
¨ 49 hours or more
Continued...
Unemployed = Yes, looked for full-time work (31)
or Yes, looked for part-time work (31)
Employed = Yes, worked for payment or profit (30)
or Yes, but absent on holidays, on sick leave, on strike or temporarily stood down (30)
or Yes, unpaid work in a family business (30)
In the labour force
= Unemployed
or employed
Works 35 hours or more
= 35–39 hours (33)
or 40 hours (33)
or 41–48 hours (33)
or 49 hours or more (33)
APPENDIX TABLE A1 CONTINUED

28 ALTMAN, BIDDLE & HUNTER
CENTRE FOR ABORIGINAL ECONOMIC POLICY RESEARCH CENTRE FOR ABORIGINAL ECONOMIC POLICY RESEARCH
DISCUSSION PAPER N0. 266 29
Question and census year Coding and other information used in variable construction
Employment – 1991 (Continued)
(37) For the main job held last week, what was the employer’s workplace address?
For persons with no fixed place of work, provide address of depot or office
(38) What kind of industry, business or service is carried out by the employer at that address?
Describe as fully as possible, using two words or more, for example, dairy farming, footwear manufacturing
Unemployment rate =
Employment to population ratio =
Labour force participation rate =
Full-time employment =
Private-sector employment =
*Does not include those who did not state their employment status
APPENDIX TABLE A1 CONTINUED
Employed
Total population 15 plus*
Unemployed
In the labour force
In the labour force
Total population 15 plus*
Works 35 hours or more
Total population 15 plus*
Private sector (37 & 38)
Total population 15 plus*

28 ALTMAN, BIDDLE & HUNTER
CENTRE FOR ABORIGINAL ECONOMIC POLICY RESEARCH CENTRE FOR ABORIGINAL ECONOMIC POLICY RESEARCH
DISCUSSION PAPER N0. 266 29
Question and census year Coding and other information used in variable construction
Employment – 2001
(32) Last week, did the person have a full-time or part-time job of any kind? Mark one box only
A ‘job’ means any type of work including casual or temporary work or part-time work, if it was for one hour or more.
See page 11 of the census guide for more information
¨ Yes, worked for payment or profit.
¨ Yes, but absent on holidays, on sick leave, on strike or temporarily stood down.
¨ Yes, unpaid work in a family business.
¨ Yes, other unpaid work. Go to 42
¨ No, did not have job. Go to 42
(37) For the main job held last week, what was the person’s workplace address?
For persons who usually worked from home, provide home address.
For persons with no fixed place of work;
if the person usually travels to a depot to start work, provide depot address;
otherwise write ‘no fixed address.’
This information is used to calculate daytime populations and to plan transport activities.
Unemployed
= [Yes, looked for full-time work (42)
or Yes, looked for part-time work (42)]
and Yes, could have started work last week (43)
Employed
= Yes, worked for payment or profit (32)
or Yes, but absent on holidays, on sick leave, on strike or temporarily stood down (32)
or Yes, unpaid work in a family business (32)
In the labour force = Unemployed or employed
(38) Which best describes the business of the employer?
Mark one box only.
If ‘Other’ is marked, please specify (e.g. Agriculture, Transport, Insurance, Education).
¨ Manufacturing
¨ Wholesaling
¨ Retailing (incl. Take-aways)
¨ Accommodation, Cafes & Restaurants
¨ Community & Health Services
¨ Other (please specify)
Continued...
APPENDIX TABLE A1 CONTINUED

30 ALTMAN, BIDDLE & HUNTER
CENTRE FOR ABORIGINAL ECONOMIC POLICY RESEARCH CENTRE FOR ABORIGINAL ECONOMIC POLICY RESEARCH
DISCUSSION PAPER N0. 266 31
Question and census year Coding and other information used in variable construction
Employment – 2001 (Continued)
(39) What are the main goods produced or main services provided by the employer’s business?
Describe as fully as possible, using two words or more.
For example, wheat and sheep, bus charter, health insurance, primary school education, civil engineering consultancy service, house building, steel pipes.
(40) Last week, how many hours did the person work in all jobs?
Subtract any time off, add any overtime or extra time worked.
¨ None
¨ Hours worked
(42) Did the person actively look for work at any time in the last four weeks?
Examples of actively looking for work include: being registered with Centrelink as a job seeker; checking or registering with any other employment agency: writing, telephoning or applying in person to an employer for work; or advertising for work.
¨ No, did not look for work. Go to 44
¨ Yes, looked for full-time work.
¨ Yes, looked for part-time work.
(43) If the person had found a job, could the person have stared work last week?
¨ Yes, could have started work last week
¨ No, already had a job to go to
¨ No, temporarily ill or injured
¨ No, other reason
Unemployment rate =
Employment to population ratio =
Labour force participation rate =
Full-time employment =
Private-sector employment =
*Does not include those who did not state their employment status
APPENDIX TABLE A1 CONTINUED
Employed
Total population 15 plus*
Unemployed
In the labour force
In the labour force
Total population 15 plus*
Works 35 hours or more (40)
Total population 15 plus*
Private sector (38 & 39)
Total population 15 plus*

30 ALTMAN, BIDDLE & HUNTER
CENTRE FOR ABORIGINAL ECONOMIC POLICY RESEARCH CENTRE FOR ABORIGINAL ECONOMIC POLICY RESEARCH
DISCUSSION PAPER N0. 266 31
Question and census year Coding and other information used in variable construction
Income – 1981
(20) What is the gross income (including pensions and/or allowances) that each person usually receives each week from all sources?
If unable to estimate income on a weekly basis, tick the appropriate box to show present income on an annual basis
Count all income, wages, salary, overtime, family allowance (child endowment), pensions, superannuation, tips and gratuities, business or farm income (less expenses of operation), unemployment benefits, etc.
Do not deduct tax, superannuation, health insurance, etc..
1 ¨ No income
2 ¨ Less than $19 per week (Less than $1000 p.a.)
3 ¨ $19 to $38 per week ($1000 to $2000 p.a.)
4 ¨ $39 to $58 per week ($2001 to $3000 p.a.)
5 ¨ $59 to $77 per week ($3001 to $4000 p.a.)
6 ¨ $78 to $115 per week ($4001 to $6000 p.a.)
7 ¨ $116 to $154 per week ($6001 to $8000 p.a.)
8 ¨ $155 to $192 per week ($8001 to $10000 p.a.)
9 ¨ $193 to $231 per week.$10001 to $12000 p.a.)
10 ̈ $232 to $288 per week ($12001 to $15000 p.a.)
11 ¨ $289 to $346 per week (($15001 to $18000 p.a.)
12 ̈ $347 to $423 per week (($18001 to $22000 p.a.)
13 ̈ $424 to $500 per week ($22001 to $26000 p.a.)
14 ̈ More than $500 per week (More than $26000 p.a.)
Inflation factor of 2.676
Personal income:
For median calculations see Appendix 2
Household income:
Midpoints assigned for all but last income group
Last income group assigned $615 per week ($32 000 p.a.)
APPENDIX TABLE A1 CONTINUED

32 ALTMAN, BIDDLE & HUNTER
CENTRE FOR ABORIGINAL ECONOMIC POLICY RESEARCH CENTRE FOR ABORIGINAL ECONOMIC POLICY RESEARCH
DISCUSSION PAPER N0. 266 33
Question and census year Coding and other information used in variable construction
Income – 1991
(29) What is the gross income (including pensions and allowances) that the person usually receives each week from all sources?
Count all incomes including: family allowance; family allowance supplement pensions; unemployment benefits; student allowance; maintenance (child support); worker’s compensation; superannuation; wages; salary; overtime; dividends; rents received; business or farm income (less expense of operation); interest received.
Do not deduct: tax; superannuation; health insurance.
¨ Less than $58 per week (Less than $3,001 p.a.)
¨ $58 to $96 per week ($3,001 to $5,000 p.a.)
¨ $97 to $154 per week ($5,001 to $8,000 p.a.)
¨ $155 to $230 per week ($8,001 to $12,000 p.a.)
¨ $231 to $308 per week ($12,001 to $16,000 p.a.)
¨ $309 to $385 per week ($16,001 to $20,000 p.a.)
¨ $386 to $481 per week ($20,001 to $25,000 p.a.)
¨ $482 to $577 per week ($25,001 to $30,000 p.a.)
¨ $578 to $673 per week ($30,001 to $35,000 p.a.)
¨ $674 to $769 per week ($35,001 to $40,000 p.a.)
¨ $770 to $961 per week ($40,001 to $50,000 p.a.)
¨ $962 to $1,154 per week ($50,001 to $60,000 p.a.)
¨ $1,155 to $1,346 per week ($60,001 to $70,000 p.a.)
¨ More than $1,346 per week (More than $70,001 p.a.)
Inflation factor of 1.2623
Personal income:
For median calculations see Appendix 2
Household income:
Midpoints assigned for all but first and last income group
First income group assigned $8 per week ($416 p.a.)
Last income group assigned $2057 per week ($106 964 p.a.)
APPENDIX TABLE A1 CONTINUED

32 ALTMAN, BIDDLE & HUNTER
CENTRE FOR ABORIGINAL ECONOMIC POLICY RESEARCH CENTRE FOR ABORIGINAL ECONOMIC POLICY RESEARCH
DISCUSSION PAPER N0. 266 33
Question and census year Coding and other information used in variable construction
Income – 2001
(30) What is the gross income (including pensions and allowances) that the person usually receives each week from all sources?
Mark one box only
Count all income for each person including: family allowance, parenting payment, unemployment benefits, rental assistance, pensions, student allowance, maintenance (child support), workers’ compensation, superannuation, wages, salary, overtime, commissions and bonuses, interest received, dividends, rents received (less expenses of operation), business or farm income (less expenses of operation)
Do not deduct: tax, superannuation, health insurance
¨ $1,500 or more per week ($78,000 or more p.a.)
¨ $1,000 to $1,499 per week ($52,000 to $77,999 p.a.)
¨ $800 to $999 per week ($41,600 to $51,999 p.a.)
¨ $700 to $799 per week ($36,400 to $41,599 p.a.)
¨ $600 to $699 per week ($31,200 to $36,399 p.a.)
¨ $500 to $599 per week ($26,000 to $31,199 p.a.)
¨ $400 to $499 per week ($20,800 to $25,999 p.a.)
¨ $300 to $399 per week ($15,600 to $20,799 p.a.)
¨ $200 to $299 per week ($10,400 to $15,599 p.a.)
¨ $160 to $199 per week ($8,320 to $10,399 p.a.)
¨ $120 to $159 per week ($6,240 to $8,319 p.a.)
¨ $80 to $119 per week ($4,160 to $6,239 p.a.)
¨ $40 to $79 per week ($2,080 to $4,159 p.a.)
¨ $1 to $39 per week ($1 to $2,079 p.a.)
¨ Nil income
¨ Negative income
Personal income:
For median calculations see Appendix 2
Household income:
Midpoints assigned for all but last income group
Last income group assigned $2335 per week ($121 417 p.a.)
APPENDIX TABLE A1 CONTINUED

34 ALTMAN, BIDDLE & HUNTER
CENTRE FOR ABORIGINAL ECONOMIC POLICY RESEARCH CENTRE FOR ABORIGINAL ECONOMIC POLICY RESEARCH
DISCUSSION PAPER N0. 266 35
Question and census year Coding and other information used in variable construction
Home owner or purchasing – 1971
(D10) Is this dwelling owned (or being purchased) by you or any usual member of your household?
Yes ¨ No ¨
<If the person marked yes, they are asked to skip the next question>
(D11) (a) Do you or any usual member of your household pay rent for this dwelling?
Yes ¨ No ¨
<If the person marked no, they are asked to skip the next question>
(b) To whom is this rent paid?
1 ¨ Department of the Interior*
2 ¨ Employer
3 ¨ Other landlord
* varied appropriately on the schedule for each state and territory
<Respondents were then asked about the weekly rent paid>
Home owner or purchaser = Yes (D10)
Home owner or purchaser (%) =
* Total population includes those who enumerated at a non-private dwelling but does not include those ‘not-stated’
APPENDIX TABLE A1 CONTINUED
Home owner or purchaser
Total population

34 ALTMAN, BIDDLE & HUNTER
CENTRE FOR ABORIGINAL ECONOMIC POLICY RESEARCH CENTRE FOR ABORIGINAL ECONOMIC POLICY RESEARCH
DISCUSSION PAPER N0. 266 35
Question and census year Coding and other information used in variable construction
Home owner or purchasing – 1981
(D10) Is this dwelling owned (or being purchased) by you or any usual member of your household?
No ¨ ⇒Go to question H3
Yes ¨
Is there a mortgage (or contract of sale) on this dwelling?
No ¨ Yes ¨
(H3) Do you or any usual member of your household pay rent for this dwelling?
No ¨ ⇒Go to question H4
Yes ¨
<If the person marked no, they are asked to skip the next question>
To whom is this rent paid?
1 ¨ State Housing Commission
2 ¨ Other Government Agencies
3 ¨ Other
<Respondents were then asked about the weekly rent paid>
Home owner or purchaser = Yes (H12)
Home owner or purchaser (%) =
* Total population includes those who enumerated at a non-private dwelling but does not include those ‘not-stated’
APPENDIX TABLE A1 CONTINUED
Home owner or purchaser
Total population

36 ALTMAN, BIDDLE & HUNTER
CENTRE FOR ABORIGINAL ECONOMIC POLICY RESEARCH CENTRE FOR ABORIGINAL ECONOMIC POLICY RESEARCH
DISCUSSION PAPER N0. 266 37
Question and census year Coding and other information used in variable construction
Home owner or purchasing – 1991
<These questions were posed via a flow diagram. The sequences have been replicated as best as possible>
(42) Is this dwelling rented by you or any usual member of this household?
¨ No <directed to ownership questions>
¨ Yes <directed to rental questions>
To whom is rent paid?
¨ NSW Department of Housing*
¨ Other government agency
¨ Other
<Respondents were then asked about the weekly rent paid>
Is the dwelling owned (or being bought) by you or any usual member of this household
¨ Yes, owned (paid off) Now go to 43
¨ Yes, being bought <directed to monthly payment question>
¨ No, Now go to 43
* varied appropriately for each state and territory
Home owner or purchaser
= Yes, owned (paid off) (42)
or Yes, being bought
Home owner or purchaser (%) =
* Total population includes those who
enumerated at a non-private dwelling but
does not include those ‘not-stated’. As those
in the ‘other’ category could not be
separated from the ‘not-stated’ category in
1991, the relative proportions of these two
categories in 1981 was used to estimate the
relative size of the ‘not-stated’ category in
1991. This was done separately for
Indigenous and non-Indigenous individuals.
APPENDIX TABLE A1 CONTINUED
Home owner or purchaser
Total population

36 ALTMAN, BIDDLE & HUNTER
CENTRE FOR ABORIGINAL ECONOMIC POLICY RESEARCH CENTRE FOR ABORIGINAL ECONOMIC POLICY RESEARCH
DISCUSSION PAPER N0. 266 37
Question and census year Coding and other information used in variable construction
Home owner or purchasing – 2001
(47) Mark the box which best describes this dwelling
Include owners of caravans, manufactured homes or houseboats regardless of whether or not the site is owned
¨ Fully owned – Go to 50
¨ Being purchased
¨ Being purchased under a rent/buy scheme
¨ Being rented
¨ Being occupied rent-free – Go to 49
¨ Being occupied under a life tenure scheme
¨ Other
(49) If this dwelling is being rented, who is it rented from?
¨ ACT Housing*
¨ Private landlord not in the same household
¨ Real estate agent
¨ Community or co-operative housing group
¨ Employer – Government
¨ Employer - Private
* varied appropriately on the schedule for each state and territory
Home owner or purchaser
= Fully owned (47)
or Being purchased (47)
or Being purchased under a rent/buy scheme
Home owner or purchaser (%) =
* Total population includes those who
enumerated at a non-private dwelling but
does not include those ‘not-stated’.
APPENDIX TABLE A1 CONTINUED
Home owner or purchaser
Total population
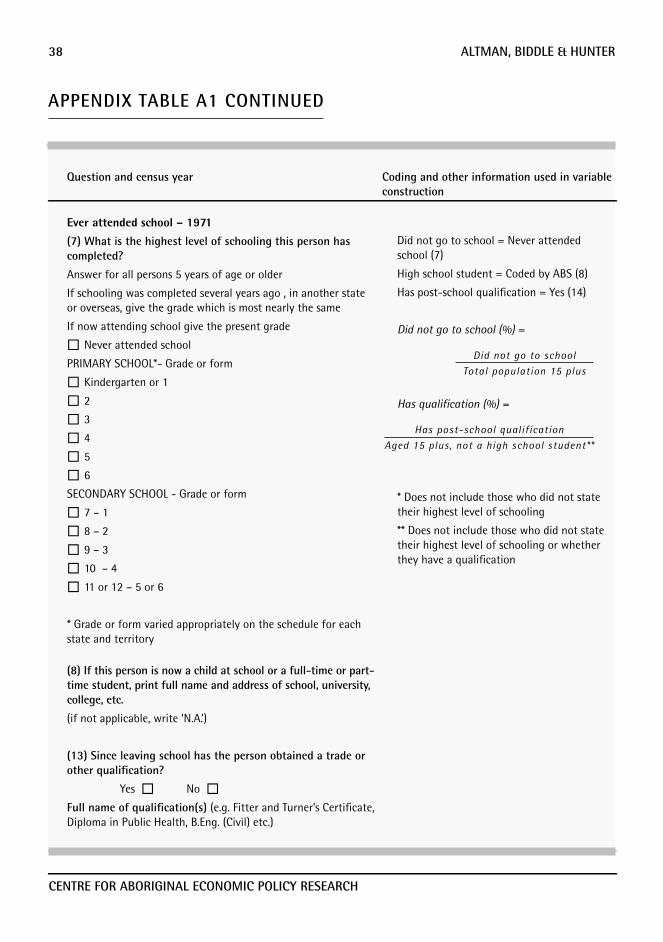
38 ALTMAN, BIDDLE & HUNTER
CENTRE FOR ABORIGINAL ECONOMIC POLICY RESEARCH CENTRE FOR ABORIGINAL ECONOMIC POLICY RESEARCH
DISCUSSION PAPER N0. 266 39
Question and census year Coding and other information used in variable construction
Ever attended school – 1971
(7) What is the highest level of schooling this person has completed?
Answer for all persons 5 years of age or older
If schooling was completed several years ago , in another state or overseas, give the grade which is most nearly the same
If now attending school give the present grade
¨ Never attended school
PRIMARY SCHOOL*- Grade or form
¨ Kindergarten or 1
¨ 2
¨ 3
¨ 4
¨ 5
¨ 6
SECONDARY SCHOOL - Grade or form
¨ 7 – 1
¨ 8 – 2
¨ 9 – 3
¨ 10 – 4
¨ 11 or 12 – 5 or 6
* Grade or form varied appropriately on the schedule for each state and territory
Did not go to school = Never attended school (7)
High school student = Coded by ABS (8)
Has post-school qualification = Yes (14)
Did not go to school (%) =
Has qualification (%) =
* Does not include those who did not state their highest level of schooling
** Does not include those who did not state their highest level of schooling or whether they have a qualification
(8) If this person is now a child at school or a full-time or part-time student, print full name and address of school, university, college, etc.
(if not applicable, write ‘N.A.’)
(13) Since leaving school has the person obtained a trade or other qualification?
Yes ¨ No ¨
Full name of qualification(s) (e.g. Fitter and Turner’s Certificate, Diploma in Public Health, B.Eng. (Civil) etc.)
APPENDIX TABLE A1 CONTINUED
Did not go to school
Total population 15 plus
Has post-school qualification
Aged 15 plus, not a high school student**

38 ALTMAN, BIDDLE & HUNTER
CENTRE FOR ABORIGINAL ECONOMIC POLICY RESEARCH CENTRE FOR ABORIGINAL ECONOMIC POLICY RESEARCH
DISCUSSION PAPER N0. 266 39
Question and census year Coding and other information used in variable construction
Education – 1981
(18) How old was each person when they left school?
For persons who are full-time primary or secondary school students, tick box 1
For persons who did not go to school, tick box 2
Age left school ……….. years
1 ¨ Still at primary or secondary school
2 ¨ Did not go to school
(19) Is the person attending a school or any other educational institution?
For persons who are external or correspondence students, indicate whether full-time or part-time
1 ¨ No
2 ¨ Yes, full-time
3 ¨ Yes, part-time
(20) Has the person obtained a trade or any other qualification since leaving school?
1 ¨ No
2 ¨ Still at primary or secondary school
3 ¨ Yes
<If the person answered yes, they were then asked to print details of the highest qualification obtained>
Did not go to school = Did not go to school (18)
School student = Still at primary or secondary school (18)
Has post-school qualification = Yes (20)
Obtaining or obtained qualifications
= [Has post-school qualification
or Yes, full-time (19)
or Yes, part-time (19)]
not School student
Did not go to school (%) =
Has qualification (%) =
Attending institution (%) =
* Does not include those who did not state their highest level of schooling
** Does not include those who did not state their highest level of schooling or whether they have a qualification
*** Does not include those who did not state their highest level of schooling, whether they have a qualification or whether they are attending an institution
APPENDIX TABLE A1 CONTINUED
Did not go to school
Total population 15 plus
Has post-school qualification
Aged 15 plus, not a school student**
Obtained or obtaining qualifications
Aged 15-24, not a school student***
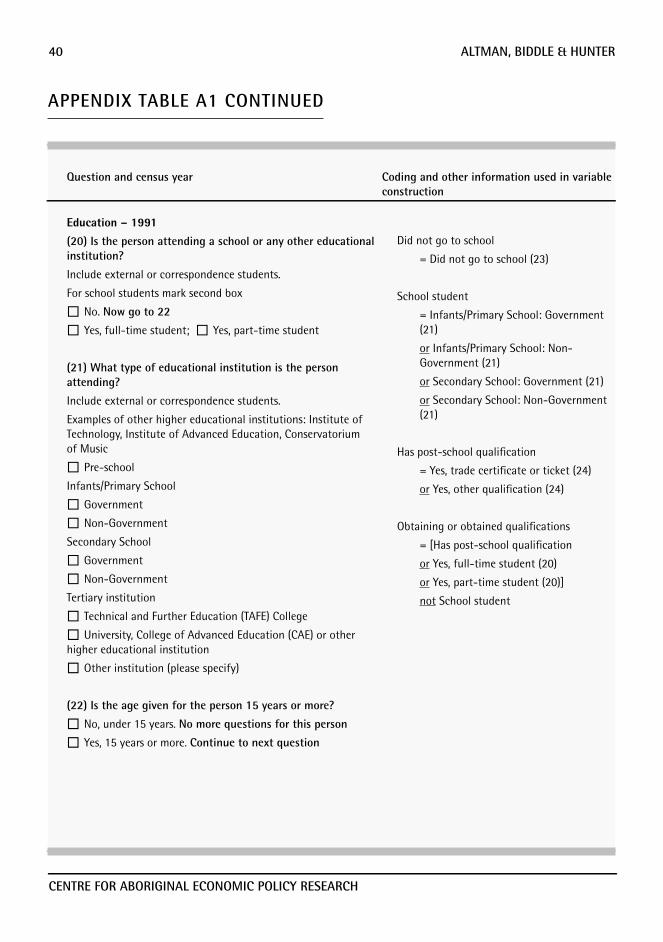
40 ALTMAN, BIDDLE & HUNTER
CENTRE FOR ABORIGINAL ECONOMIC POLICY RESEARCH CENTRE FOR ABORIGINAL ECONOMIC POLICY RESEARCH
DISCUSSION PAPER N0. 266 41
Question and census year Coding and other information used in variable construction
Education – 1991
(20) Is the person attending a school or any other educational institution?
Include external or correspondence students.
For school students mark second box
¨ No. Now go to 22
¨ Yes, full-time student; ¨ Yes, part-time student
(21) What type of educational institution is the person attending?
Include external or correspondence students.
Examples of other higher educational institutions: Institute of Technology, Institute of Advanced Education, Conservatorium of Music
¨ Pre-school
Infants/Primary School
¨ Government
¨ Non-Government
Secondary School
¨ Government
¨ Non-Government
Tertiary institution
¨ Technical and Further Education (TAFE) College
¨ University, College of Advanced Education (CAE) or other higher educational institution
¨ Other institution (please specify)
(22) Is the age given for the person 15 years or more?
¨ No, under 15 years. No more questions for this person
¨ Yes, 15 years or more. Continue to next question
Did not go to school
= Did not go to school (23)
School student
= Infants/Primary School: Government (21)
or Infants/Primary School: Non-Government (21)
or Secondary School: Government (21)
or Secondary School: Non-Government (21)
Has post-school qualification
= Yes, trade certificate or ticket (24)
or Yes, other qualification (24)
Obtaining or obtained qualifications
= [Has post-school qualification
or Yes, full-time student (20)
or Yes, part-time student (20)]
not School student
APPENDIX TABLE A1 CONTINUED
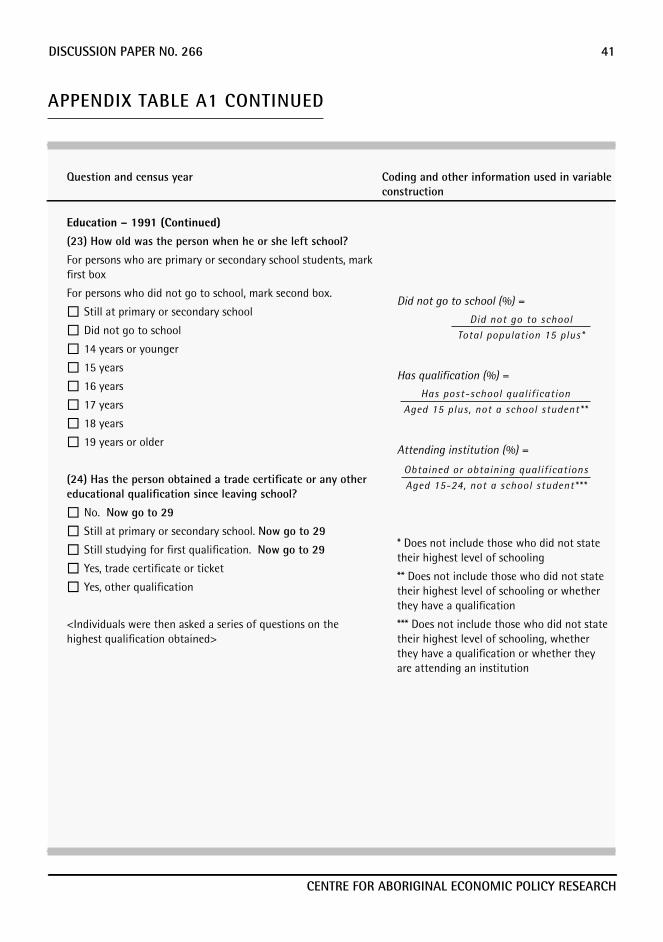
40 ALTMAN, BIDDLE & HUNTER
CENTRE FOR ABORIGINAL ECONOMIC POLICY RESEARCH CENTRE FOR ABORIGINAL ECONOMIC POLICY RESEARCH
DISCUSSION PAPER N0. 266 41
Question and census year Coding and other information used in variable construction
Education – 1991 (Continued)
(23) How old was the person when he or she left school?
For persons who are primary or secondary school students, mark first box
For persons who did not go to school, mark second box.
¨ Still at primary or secondary school
¨ Did not go to school
¨ 14 years or younger
¨ 15 years
¨ 16 years
¨ 17 years
¨ 18 years
¨ 19 years or older
(24) Has the person obtained a trade certificate or any other educational qualification since leaving school?
¨ No. Now go to 29
¨ Still at primary or secondary school. Now go to 29
¨ Still studying for first qualification. Now go to 29
¨ Yes, trade certificate or ticket
¨ Yes, other qualification
<Individuals were then asked a series of questions on the highest qualification obtained>
Did not go to school (%) =
Has qualification (%) =
Attending institution (%) =
* Does not include those who did not state their highest level of schooling
** Does not include those who did not state their highest level of schooling or whether they have a qualification
*** Does not include those who did not state their highest level of schooling, whether they have a qualification or whether they are attending an institution
APPENDIX TABLE A1 CONTINUED
Did not go to school
Total population 15 plus*
Has post-school qualification
Aged 15 plus, not a school student**
Obtained or obtaining qualifications
Aged 15-24, not a school student***
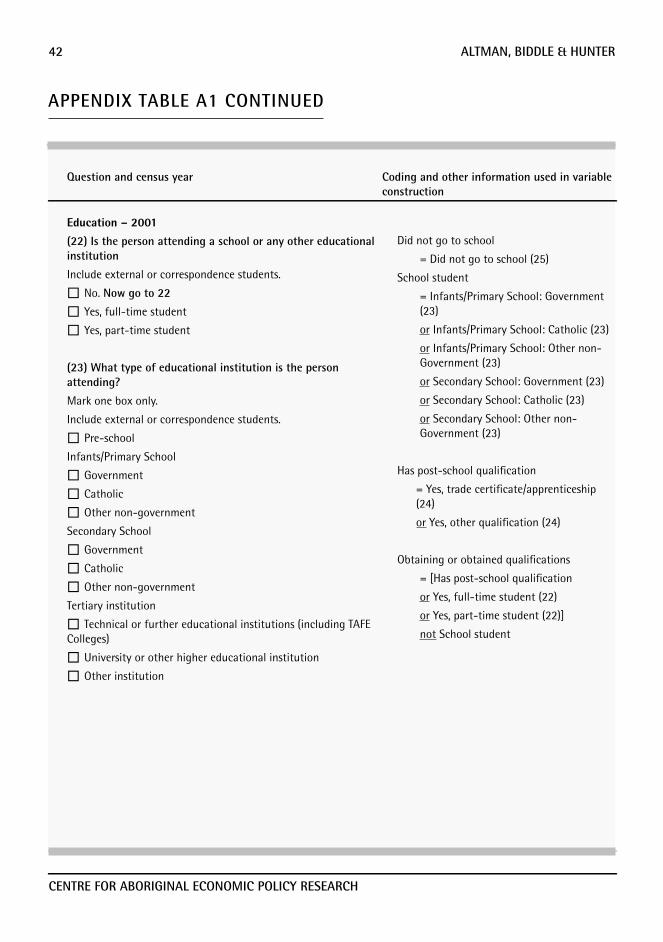
42 ALTMAN, BIDDLE & HUNTER
CENTRE FOR ABORIGINAL ECONOMIC POLICY RESEARCH CENTRE FOR ABORIGINAL ECONOMIC POLICY RESEARCH
DISCUSSION PAPER N0. 266 43
Question and census year Coding and other information used in variable construction
Education – 2001
(22) Is the person attending a school or any other educational institution
Include external or correspondence students.
¨ No. Now go to 22
¨ Yes, full-time student
¨ Yes, part-time student
(23) What type of educational institution is the person attending?
Mark one box only.
Include external or correspondence students.
¨ Pre-school
Infants/Primary School
¨ Government
¨ Catholic
¨ Other non-government
Secondary School
¨ Government
¨ Catholic
¨ Other non-government
Tertiary institution
¨ Technical or further educational institutions (including TAFE Colleges)
¨ University or other higher educational institution
¨ Other institution
Did not go to school
= Did not go to school (25)
School student
= Infants/Primary School: Government (23)
or Infants/Primary School: Catholic (23)
or Infants/Primary School: Other non-Government (23)
or Secondary School: Government (23)
or Secondary School: Catholic (23)
or Secondary School: Other non-Government (23)
Has post-school qualification
= Yes, trade certificate/apprenticeship (24)
or Yes, other qualification (24)
Obtaining or obtained qualifications
= [Has post-school qualification
or Yes, full-time student (22)
or Yes, part-time student (22)]
not School student
APPENDIX TABLE A1 CONTINUED

42 ALTMAN, BIDDLE & HUNTER
CENTRE FOR ABORIGINAL ECONOMIC POLICY RESEARCH CENTRE FOR ABORIGINAL ECONOMIC POLICY RESEARCH
DISCUSSION PAPER N0. 266 43
Question and census year Coding and other information used in variable construction
Education – 2001 (Continued)
(25) What is the highest level of primary or secondary school the person has completed?
Mark one box only
For persons who returned after a break to complete their schooling, mark the level completed when they last left.
¨ Still at school
¨ Did not go to school
¨ Year 8 or below
¨ Year 9 or equivalent
¨ Year 10 or equivalent
¨ Year 11 or equivalent
¨ Year 12 or equivalent
(26) Has the person completed a trade certificate or any other educational qualification?
Mark one box only
¨ No. Go to 31
¨ No, still studying for first qualification. Go to 29
¨ Yes, trade certificate/apprenticeship
¨ Yes, other qualification
<respondents were directed to the census guide for questions (25) and (26)>
Did not go to school (%) =
Has qualification (%) =
Attending institution (%) =
* Does not include those who did not state their highest level of schooling
** Does not include those who did not state their highest level of schooling or whether they have a qualification
*** Does not include those who did not state their highest level of schooling, whether they have a qualification or whether they are attending an institution
APPENDIX TABLE A1 CONTINUED
Did not go to school
Total population 15 plus*
Has post-school qualification
Aged 15 plus, not a school student**
Obtained or obtaining qualifications
Aged 15-24, not a school student***

44 ALTMAN, BIDDLE & HUNTER
CENTRE FOR ABORIGINAL ECONOMIC POLICY RESEARCH CENTRE FOR ABORIGINAL ECONOMIC POLICY RESEARCH
DISCUSSION PAPER N0. 266 45
APPENDIX B. CALCULUS-BASED METHOD FOR CALCULATING MEDIANS
The conventional ABS method for calculating medians where income data is collected in ranges is the
proportional allocation of people within the relevant income ranges. That is, the median is usually
calculated using a uniform random distributional assumption within income ranges within which we
know the median should reside (see ABS 2001). This Appendix explores the possibility of using different
distributional assumptions to derive a methodology that is consistent with our theoretical expectations.
While the uniform allocation method is likely to provide a reasonable estimate when the median is in a flat
part of the income distribution, it will provide a biased estimate when the income distribution is highly
skewed. For example, Indigenous population and other groups that include many welfare recipients are likely
to be heavily skewed to the left and hence the median may reside in portion of the income distribution
with a significant negative slope. Consequently, the medians based on the proportional allocation of income
ranges will tend to overestimate median incomes for Indigenous and other disadvantaged groups. It is
particularly important to take into account the shape of the income distributions when comparing very
different groups such as Indigenous and non-Indigenous populations.
The shape of the income distribution is measured by the probability density function (pdf), a standardised
measure of the income distribution (i.e. representing the probability (Y=y) where y is the particular values
Fig. B1. Defining preliminaries for median calculations

44 ALTMAN, BIDDLE & HUNTER
CENTRE FOR ABORIGINAL ECONOMIC POLICY RESEARCH CENTRE FOR ABORIGINAL ECONOMIC POLICY RESEARCH
DISCUSSION PAPER N0. 266 45
of income being analysed). The probability of having an income less than or equal to a particular income, y,
is provided by the cumulative density function (cdf), which measures the area under the pdf curve up to y.
The census income is provided in income ranges so we only have information on the cdf at the boundaries
of the income ranges (Y1, Y3, Y5 and Y7 in Fig. 1). In the absence of more accurate information, it seems
reasonable to assume that the true pdf will pass through the midpoint of the income ranges, so we estimate
the slope of the true pdf as connecting the estimated probability densities measured at the mid-points
for various income ranges with a straight line. That is, we approximate the empirical pdf as a piecewise
linear function that passed through the mid-points of the various income ranges. This is obviously a rough
approximation of the true pdf, which in all likelihood would be a smooth function of income. The cdf can
then be estimated using integral calculus as the area under the pdf. This appendix provides an easy to follow
geometric explanation of the calculus-based technique so that it can be easily applied by policy makers
using standard spreadsheet packages.
Step 1: Shape of the pdfThe first step is to estimate the shape of the distribution. This paper assumes that the slope of the pdf is
determined by the empirical pdfs on either side of the category where the median is known to lie. To do this,
we initially assume that the height of the pdf at the midpoint of each of the three categories (H1, H2 and H3)
is the empirical probability of being in each respective group, divided by the number of units in that group
(i.e. the estimated probability per dollar unit). That is:
Using these heights at the midpoints, the gradient of the pdf between Y3 and Y4 (g1) and the gradient of the
pdf between and Y4 and Y5 (g2) can be calculated as follows:
Given the median usually lies to the right of the mean, these gradients are likely to be negative. However, it is
important to note that gradients around the true median could also be positive (e.g. if the income followed
a bi-modal distribution).
� �� �
� �� �
� �� �
1 31
3 1
3 52
5 3
5 73
5 7
P Y Y YH
Y Y
P Y Y YH
Y Y
P Y Y YH
Y Y
� ��
�
� ��
�
� ��
�
2 11
4 2
3 22
6 4
H HgY YH HgY Y
������
(1)
(2)

46 ALTMAN, BIDDLE & HUNTER
CENTRE FOR ABORIGINAL ECONOMIC POLICY RESEARCH CENTRE FOR ABORIGINAL ECONOMIC POLICY RESEARCH
DISCUSSION PAPER N0. 266 47
Step 2: Height of the pdf
Now that we have an estimate of the gradient for the pdf within the median group, the next step is to find
the height of the pdf. Given we are assuming a linear pdf with a constant and known gradient, it is sufficient
to know the height of the pdf at the lower and upper bounds of the category (and hence the height at the
midpoint). To find the heights at these two bounds, we exploit the fact that we know the actual probability
of being in that group or, in terms of geometry, the area under the curve. We label this known probability P.
Given that the probability of being in that group is equal to the area under the pdf, we also know that the
probability is equal to the area to the left of the midpoint, plus the area to the right.
Letting Δ equal the distance between the midpoint and both the upper and the lower bound of the category
(Y4-Y3), we now have the following equation:
Now because we know the gradient between H1 and Hmid is g1, and the gradient between Hu and Hmid is g2,
we can also set up the following two equations:
Fig. B2. Height of the pdf
� � � � � � � �1 12 2mid l mid u m uP H H H H H H� � � � � � � � � �
1
2
l mid
u mid
H H gH H g
� � �� � �
(3)
(4)

46 ALTMAN, BIDDLE & HUNTER
CENTRE FOR ABORIGINAL ECONOMIC POLICY RESEARCH CENTRE FOR ABORIGINAL ECONOMIC POLICY RESEARCH
DISCUSSION PAPER N0. 266 47
� �21 22
4mid
P g gH
� � ��
�
Putting Equation (4) into Equation (3) gives the following:
Which can be solved to give:
or
That is:
Equation (5) can then be put back into Equation (4) to get values for H1 and Hu.
Step 3: Is the median to the left or the right of the midpoint?
Now that we have an estimate for the pdf, the next step in calculating the median is establishing whether it
is to the left or the right of the midpoint of the income group. To do so, we estimate the cdf at the midpoint
(which is the area under our estimate for the pdf) and see whether it is greater or less than 0.50.
Fig. B3. Relative position of the category mid-point and the median
� � � � � � � �1 2 21 12 2mid mid mid mid m midP H H g H H g H H g� � � � � � � � � � � � � � � �
(5)

48 ALTMAN, BIDDLE & HUNTER
CENTRE FOR ABORIGINAL ECONOMIC POLICY RESEARCH CENTRE FOR ABORIGINAL ECONOMIC POLICY RESEARCH
DISCUSSION PAPER N0. 266 49
The cdf of the midpoint, Cmid, is given by the following formula:
where C1 is the cdf up to but not including the income group that the median is in. So if Cmid > 0.5 then we
know that the median is to the left of the midpoint, whereas if Cmid < 0.5, we know that it is to the right.
Step 4: Estimating the median
Now that we know at what part of the income group the median will be estimated to lie, we can now
estimate where exactly the median is, based on our estimated pdf. As mentioned previously, this median is
estimated differently if it is to the left of the midpoint as opposed to the right. This can be shown by the
following diagram:
Figure B3 shows the different ways in which the median is calculated.
Where we know the median is to the left of the midpoint, we know that the median is that value of income
where the lightly shaded area in Figure 2 is equal to the difference between 0.5 and the cdf at the lower
bound. Letting: Ymed equal the estimated median; δ the difference between the estimated median and Y3;
and Hmed the height of the pdf at the median, we know that:
We also know that:
As such:
or
Solving this quadratic gives:
Similarly, if the median is to the right of the midpoint, we have:
� �12mid l mid l midC C H H H� � � � � �
� �1 0.52l med l medC H H H� �� � � � (7)
1med lH H g �� �
� � � �1 110.52l l l lC H g H H g� � � �� � � � � �
� �21 2 2 0.5 0l lg H C� �� � � �
� �21
1
2 0.5l l lH H g Cg
�� � � �
� (8)
� �22
2
2 0.5med med medH H g Cg
�� � � �
� (9)

48 ALTMAN, BIDDLE & HUNTER
CENTRE FOR ABORIGINAL ECONOMIC POLICY RESEARCH CENTRE FOR ABORIGINAL ECONOMIC POLICY RESEARCH
DISCUSSION PAPER N0. 266 49
Where the difference is that in Equation (9) we use the height and estimated cdf at the midpoint (Hmed, Cmed)
rather than at the lower bound and we use the second gradient (g2) rather than the first.
Our estimated median is therefore either:
or
Whether we use Equation (10) or Equation (11) depends of course on whether we are to the right or the left
of the midpoint. Note that the technique remains the same if the gradient around the relevant portion of
the income range is positive (e.g. in bimodal distributions)
This paper illustrates that there are important differences in the median incomes estimated using proportional
allocation and calculus-based techniques. The differences are particularly pronounced when comparing
incomes for Indigenous and non-Indigenous individuals over time. In contrast, there were few differences in
the medians estimated for Indigenous and other Australian households. The likely reason for this is that we
are estimating gross income for household and no attempt is made to control for different household size
and composition (i.e. equivalence scales were not used—see Hunter, Kennedy & Biddle 2002). That is, larger
Indigenous households mean that measured household incomes are closer to the non-Indigenous norms
which tend to have relatively flat pdfs around the medians.
3medY Y �� � (10)
med midY Y �� � (11)

50 ALTMAN, BIDDLE & HUNTER
CENTRE FOR ABORIGINAL ECONOMIC POLICY RESEARCH CENTRE FOR ABORIGINAL ECONOMIC POLICY RESEARCH
DISCUSSION PAPER N0. 266 51
REFERENCES
Altman, J.C. 1991 (ed.). Aboriginal Employment Equity by the Year 2000, CAEPR Research Monograph No.
2, CAEPR, ANU, Canberra.
—— 2001. ‘The economic status of Indigenous Australians’, in J. Jupp (ed.), The Australian People: An
Encyclopedia of the Nation, Its People and Their Origins, Cambridge University Press, Cambridge.
—— 2004. ‘Practical reconciliation and the new mainstreaming: will it make a difference to Indigenous
Australians?’ Dialogue, 23 (2): 35–46.
—— and Gray, M.C. 2000. ‘The effects of the CDEP scheme on the economic status of Indigenous
Australians: some analyses using the 1996 census’, CAEPR Discussion Paper No. 195, CAEPR,
ANU, Canberra.
——, —— and Sanders, W. 2000. ‘Indigenous Australians working for welfare: what difference does it
make?’ Australian Economic Review, 33 (4): 355–62.
—— and Hunter, B.H. 2003. ‘Monitoring practical reconciliation: evidence from the 2001 Census’, CAEPR
Discussion Paper No. 254, CAEPR, ANU, Canberra.
—— and Nieuwenhuysen, J. 1979. The Economic Status of Australian Aborigines, Cambridge University
Press, Cambridge.
—— and Sanders, W. 1992. ‘Aboriginal and Torres Strait Islander Affairs’, in P. Vintila, J. Phillimore and
P. Newman (eds), Markets, Morals and Manifestos: Fightback! and the Politics of Economic
Rationalism in the 1990s, Institute for Science and Technology Policy, Murdoch University, Perth.
Australian Bureau of Statistics (ABS) 2001. 2001 Census Dictionary, Cat. no. 2901.0, ABS, Canberra.
—— 2003. Population Characteristics, Aboriginal and Torres Strait Islander Australians, 2001, Cat. no.
4713.0, ABS, Canberra.
—— 2004. National Aboriginal and Torres Strait Islander Social Survey 2002, Cat. no.4714.0, ABS,
Canberra.
Bennett, S. 1999. White Politics and Black Australians, Allen & Unwin, Sydney.
Choi, C. and Gray, A. 1985. ‘An evaluation of census counts of the Aboriginal population, 1971, 1976 and
1981’, Occasional Paper No. 2, ABS, Canberra.
Commonwealth of Australia 2002. 2002–03 Budget Paper No. 5: Intergenerational Report, 2002–03,
Treasury, Canberra.
Godwell, D. 2003. ‘Give white patronising the heave-ho’, The Australian, 27 June 2003.

50 ALTMAN, BIDDLE & HUNTER
CENTRE FOR ABORIGINAL ECONOMIC POLICY RESEARCH CENTRE FOR ABORIGINAL ECONOMIC POLICY RESEARCH
DISCUSSION PAPER N0. 266 51
Harding, A. 1997. ‘The suffering middle: trends in income inequality in Australia’, The Australian Economic
Review, 30 (4): 341–58.
Hunter, B.H. 1998. ‘Assessing the validity of intercensal comparisons of Indigenous Australians, 1986–96’,
Journal of the Australian Population Association, 15 (1): 51–67.
—— 2002a. ‘The rise of the CDEP scheme and changing factors underlying Indigenous employment’, CAEPR
Working Paper No. 13, CAEPR, ANU, Canberra, available online at <http://www.anu.edu.au/caepr/>.
—— 2002b. ‘Some inter-relationships between the CDEP scheme and Indigenous labour supply’, CAEPR
Working Paper No. 14, CAEPR, ANU, Canberra, available online at <http://www.anu.edu.au/caepr/>.
—— 2004. Indigenous Australians in the Contemporary Labour Market, Cat. no. 2052.0, ABS, Canberra.
——, Kennedy, S. and Biddle, N. 2002. ‘One size fits all? The effect of equivalence scales on Indigenous and
other Australian poverty’, CAEPR Working Paper No. 19, CAEPR, ANU, Canberra, available online at
<http://www.anu.edu.au/caepr/>.
——, —— and Smith, D. 2003. ‘Household composition, equivalence scales and the reliability of income
distributions: some evidence for Indigenous and other Australians’, Economic Record, 79 (244):
70–83.
—— and Taylor, J. 2004. ‘Indigenous employment forecasts: implications for reconciliation’, Agenda: A
Journal of Policy Analysis and Reform, 11 (2): 179–92.
Kinfu, Y. and Taylor, J. 2002. ‘Estimating the components of Indigenous population change: 1996–2001’,
CAEPR Discussion Paper No. 240, CAEPR, ANU, Canberra.
Martin, D.F., Morphy, F., Sanders, W.G. and Taylor, J. 2002. Making Sense of the Census: Observations of
the 2001 Enumeration in Remote Aboriginal Australia, CAEPR Research Monograph No. 22, CAEPR,
ANU, Canberra.
Miller M. (Chairman) 1985. Report of the Committee of Review of Aboriginal Employment and Training
Programs, AGPS, Canberra.
Misko, J. 2004. The Role of Community Development Employment Projects in Rural and Remote
Communities, NCVER, Adelaide.
Morphy, F. 2002. ‘When systems collide: the 2001 census at a Northern Territory outstation’, in D.F. Martin,
F. Morphy, W.G. Sanders and J. Taylor, Making Sense of the Census: Observations of the 2001
Enumeration in Remote Aboriginal Australia, CAEPR Research Monograph No. 22, CAEPR, ANU,
Canberra.
O’Reilly, J.B. 1994. ‘Demographic implications of Aboriginal out-marriage’, Journal of the Australian
Population Association, 11 (2): 149–59.

52 ALTMAN, BIDDLE & HUNTER
CENTRE FOR ABORIGINAL ECONOMIC POLICY RESEARCH CENTRE FOR ABORIGINAL ECONOMIC POLICY RESEARCH
Pratt, A. and Bennett, S. 2004. ‘The end of ATSIC and the future administration of Indigenous Affairs’,
Current Issues Brief no. 4 2004–05, Parliamentary Library, Parliament House, Canberra.
Ross, K. 1999. Occasional Paper: Population Issues, Indigenous Australians, Cat. no. 4708.0, ABS, Canberra.
Sanders, W. 1991. ‘Destined to fail: the Hawke government’s pursuit of statistical equality in employment
and income status between Aborigines and other Australians by the year 2000 (or a cautionary tale
involving the new managerialism and social justice strategies)’, Australian Aboriginal Studies, 1991
(2): 13–18.
—— 1997. ‘Opportunities and problems astride the welfare/work divide: the CDEP scheme in Australian
social policy’, CAEPR Discussion Paper No. 141, CAEPR, ANU, Canberra.
Spicer, I. 1997. Independent Review of the Community Development Employment Projects (CDEP) Scheme,
Office of Public Affairs, ATSIC, Canberra.
Taylor, J. 1993. The Relative Economic Status of Indigenous Australians, 1986–91, CAEPR Research
Monograph No. 5, CAEPR, ANU, Canberra.
—— 1997. ‘The contemporary demography of Indigenous Australians’, Journal of the Australian Population
Association, 14 (1): 77–114.
—— 2002. ‘The context of observation’, in D. F. Martin, F. Morphy, W. G. Sanders and J. Taylor, Making
Sense of the Census: Observations of the 2001 Enumeration in Remote Aboriginal Australia, CAEPR
Research Monograph No. 22, CAEPR, ANU, Canberra.
Wells, G. 2003. ‘The macro economy’, in I. McAllister, S. Dowrick and R. Hassan (eds), The Cambridge
Handbook of Social Sciences in Australia, Cambridge University Press, Cambridge.