INDICES OF HOUSE PRICES AND RENT PRICES OF ... - · PDF fileINDICES OF HOUSE PRICES AND RENT...
55
INDICES OF HOUSE PRICES AND RENT PRICES OF RESIDENTIAL PROPERTY IN LONDON, 1895-1939 Luke Samy U N I V E R S I T Y O F O X F O R D Discussion Papers in Economic and Social History Number 134, April 2015
Transcript of INDICES OF HOUSE PRICES AND RENT PRICES OF ... - · PDF fileINDICES OF HOUSE PRICES AND RENT...

INDICES OF HOUSE PRICES AND RENT
PRICES OF RESIDENTIAL PROPERTY IN LONDON, 1895-1939
Luke Samy
U N I V E R S I T Y O F O X F O R D
Discussion Papers in Economic and Social History
Number 134, April 2015

INDICES OF HOUSE PRICES AND RENT PRICES OF RESIDENTIAL PROPERTY IN LONDON, 1895-1939
Luke Samy
Winton Institute for Monetary History University of Oxford
Abstract Data from two different primary sources were used to construct indices of house prices (HPI) and rents (RRPI) of residential property located in London and the Home Counties between 1895 and 1939. The indices were derived using the hedonics method of price index measurement, which extracts the variation in prices due to differences in the quality of dwellings that form the sample across different time periods. Both nominal and real HPIs and RRPIs are reported in the paper, as well as simple summary statistics on the levels of house prices and rental values, years purchase and returns on housing for a selected number of boroughs in London over time. Key words: housing, rents, inflation, building societies. ACKNOWLEDGEMENTS: I wish to thank participants in workshops at Queens University Belfast and the Winton Institute for Monetary History, Oxford for their constructive advice and feedback. Thanks are also due to Nick Mayhew and Avner Offer for their support. This research was made possible by funding provided by the John Fell Oxford University Press (OUP) Research Fund.

2
INDICES OF HOUSE PRICES AND RENT PRICES OF RESIDENTIAL PROPERTY IN LONDON, 1895-1939
I. Introduction This paper fills a gap in the stock of historical statistics for Britain by providing a
continuous index series of house prices and rental values (hereafter referred to as rents) of residential property to cover the period from 1895 to 1939. Until now, there has been a dearth of statistics on house prices and rents in Britain before the Second World War, despite its relevance to important aspects of the economic and social history of Britain during this period. Offer provides perhaps the most comprehensive analysis of house prices between 1892 and 1914, providing data on capital values, ground rents, annual rents and years purchase for various boroughs in London,1 but only at five-yearly intervals and stopping at 1914.2 One article which has emerged recently by Knoll et al presents indices based on land registry data from 1899-1920, and on estimated (rather than actual) house prices by Braae from 1920 to 1939, yet neither of these sources are based on actual house price data nor on samples that are representative of the housing stock.3 In terms of rents, an early though crude series was calculated by Bowley on the basis of tax returns, but later series by Feinstein and Clark improved upon Bowley’s estimates by employing more sophisticated techniques to adjust for quality differences in their sample over time. That said, these indices do not cover the interwar period, and are based on aggregate rather than house-level price data.4 The indices presented in this paper aim to improve upon these existing statistics by using a larger sample of properties based on private house sales data for Greater London, and by using the hedonics method to extract the variation in the indices due to inter-temporal compositional change.
That more attention has not been paid by economic historians to property values is surprising given the importance of the property market to the Victorian, Edwardian and interwar economies. For example, various scholars have studied the link between the housing and trade cycles and found a strong positive association.5 Housing was an important investment asset during this period, and the return it provided vis-à-vis the returns on other assets had wider implications for financial markets, international capital flows and the domestic business cycle. Testing such theses empirically however has been difficult in the absence of proper statistics.6
The housing market is also worthy of attention in its own right. The cost of housing consumed a large proportion of working-class and even middle-class incomes before the
1 Years purchase is defined as the ratio between the capital value and the annual rental value of a property. 2 Offer, Property and Politics, pp. 254-282. 3 Knoll et al., ‘No price like home: Global House Prices, 1870-2012’, CEPR Discussion Paper no. 10166, Available at www.cepr.org/pubs/dps/DP10166.php. 4 Feinstein’s index is based on landlords’ income tax (Schedule A) data, while Clark’s index is based on data contained in the Charity Commission Reports, which pertains to properties bought and sought by charitable organisations from 1859 to 1909 (Clark, ‘Housing rents, housing quality and living standards in England and Wales, 1640-1909’, pp. 1-2). 5 Parry Lewis, Building Cycles and Britain’s Growth, pp. 357-363. 6 Ibid., p. 3.

3
Wars, with working-class households spending anywhere between 20 to 50 per cent of their incomes on rents,7 the middle classes between 5 to 15 per cent.8 Yet, in both the pre-war and interwar periods, there were serious shortfalls in decent and affordable housing for the working-classes. The ‘housing problem’ was a serious economic and social issue that persisted (albeit in different forms) throughout the pre-war and interwar periods, leading to severe overcrowding and unsanitary living conditions for working-class families living in the inner city. In the pre-war period, this was mainly caused by the necessity for many workingmen to live close to their places of employment, causing a concentration of demand in the inner-city.9 Such a necessity rendered the expansion of cheap housing in the suburbs ineffective in relieving the housing problem until the provision of cheap and convenient transportation links to the suburbs was established.10 In the interwar period, the problem was due to the concentration of private building in the better-class of housing rather than the lower-class which was largely neglected.11 Writing in 1932, one contemporary stated that the supply of housing for higher-paid workers had increased by over 60 per cent since the end of the First World War, compared to the supply of housing for lower-paid workers which had increased by only 13 per cent.12 In general, the problem in the interwar years resulted from the decay of existing houses without proper provision being made for their replacement, as well as the lack of coordination between the demand and supply of such dwellings. 13 Many theories – both economic and non-economic – have been proposed by historians to explain the mis-match between supply and demand that gave rise to the housing problem. On the supply side, the declining fiscal position of landlords from the late nineteenth and early twentieth centuries and the inferior returns on housing vis-a-vis foreign investments have been cited as causes for the massive under-investment in housing. The general trend of the law to strengthen the tenure of tenants from the late nineteenth century, increased state involvement in both house building and regulation, and the imposition of rent controls from 1915 onwards all acted to constrain returns on housing and make investment in housing less attractive to landlords.14 This was particularly felt at the lower-end of the market, where the amount of rent that could be charged for property (and hence the rate of return on housing) was already constrained by the low and uncertain incomes of occupants.15 On the demand side, low incomes prevented those most affected by the dearth of decent housing to buy or build their own homes, even though the differential between the rental rate on housing and the lending rate on mortgages may well have been such as to make it advantageous for tenants to buy rather than rent their homes during this period. Having statistics on rents and capital values enables us to disentangle the separate impacts that these various factors had on the housing problem.
This paper presents a continuous index series of residential house prices (hereafter
7 The Royal Commission on the Housing of the Working Classes (1885) found that over 85 per cent of working-class households paid over 20 per cent of their income on rents, and almost 50 per cent paid between 25 to 50 per cent of incomes on rent (Wohl, ‘Housing the Working Classes in London c.1825-1914,’ p.26). 8 Offer, op. cit., p.268. 9 Wohl, ‘Housing the Working Classes in London c.1825-1914,’ p.16. 10 Ibid, p.31. 11 Richardson & Aldcroft, Building in the British Economy between the Wars, pp.194. 12 Mansbridge, Brick upon Brick, p.213. 13 Ibid.,, p.213. 14 Daunton, ‘Housing,’ p.229-234. 15 Wohl, op. cit., p.36.

4
abbreviated as HPIs) and rents (hereafter abbreviated as RRPIs) for residential property in London from 1895 to 1939. The London housing market is the focus of this study because of its primary importance to the British housing market,16 and because of the concentration of the properties forming our sample in London. The indices are based on two primary sources: (1) the annual year books of the London Auction Mart, which provide a list of all properties traded at the Mart throughout the year; and (2) the mortgage registers of the Co-operative Permanent Building Society, one of the largest building societies in Britain during the interwar period. The former are used to construct the indices spanning the years 1895 to 1922, while the latter are used for the interwar years 1919 to 1939. Separate indices for the pre-war and interwar period are produced here because of the heterogeneous parts of the market that each of these two primary sources cover, a feature that will be discussed in more detail later. The paper has five parts: Part II discusses the sources, data and methodology in more detail; Part III presents the indices themselves, along with a short commentary about the trends and the limitations in its precision and interpretation; Part IV concludes the paper by suggesting avenues for future research. The appendix of the paper provides detailed summary statistics on the key variables used in this analysis for completeness.
II. Primary Sources and Methods
I. Primary Sources Two primary sources were used in this study: (1) the year books of the London auction
mart; and (2) the mortgage registers of the Co-operative Permanent Building Society. The background histories of these two institutions indicate that each served very different niches of the London housing market during the period.
The London auction mart (hereafter referred to as ‘the Mart’) was established by the leading auctioneers of London to be an auction house of real estate, stocks and other assets of commercial value. From 1892 onwards, the Mart produced year books of all the assets exchanged on its trading floor each year, a large part of which included real estate properties in metropolitan London and in the provinces. According to Offer, a high proportion of properties exchanged in the London housing market were exchanged through the Mart (approx. 25 per cent), such that the sales activity at the Mart closely matches the overall trend in sales activity in the housing market.17 The year books therefore constitute a reliable and representative sample to form our indices for the pre-war period. A copious amount of detail about each property is available in the year books, such as the address of the property, the tenure type (freehold, leasehold or copyhold), the amount of ground rent, the annual rental amount etc., as well as the selling price and the date when it was sold. Given the kind of clientele that would have bought and sold property through the Mart, and given the fact that the overwhelming majority of houses in Britain were owned by landlords rather than occupiers before the Wars, it is not unreasonable to conclude that the properties traded at the
16 For example, the London housing market accounted for 21 per cent of the rent in England and Wales despite having only 14 per cent of the population (Source: Offer, op. cit., p.255). 17 See Offer, op. cit., p.256. Offer showed that the level of trading activity in the Mart was closely correlated with the aggregate figures for property transfers reported by HM Land Registry.

5
Mart were primarily for speculative and/or for rental purposes, rather than for owner-occupation. This is borne out in the geographical and price distribution of the properties in Figures 1 to 3 below.
The Co-operative Permanent Building Society (hereafter ‘the CPBS’) catered for a different clientele. Founded in 1884, the Co-operative Permanent Building Society was an offshoot of the Co-operative Movement, established at a meeting of the Guild of Co-operators in London by
ardent social reformers, and far sighted men and women, [who] were determined that as many working men and women as possible should own their own homes.18
Recent research has shown that the actions of the society matched its rhetoric, with over two thirds of its borrowers made up of unskilled, semi-skilled and skilled workers.19 As such, the Co-operative Permanent was one of the most progressive societies in the building society movement during the period, helping working-class households to achieve home ownership both before and after the First World War.
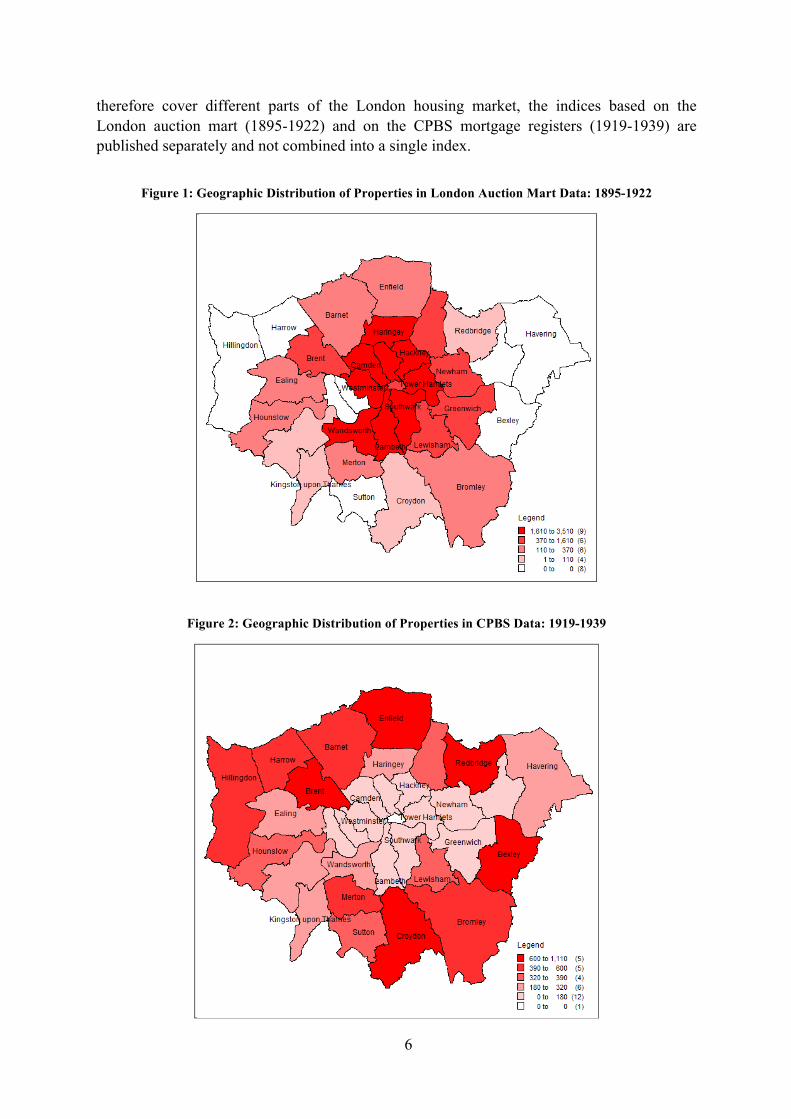
That these sources represent the buy-to-let and the owner-occupier markets respectively can be seen in the different geographical concentrations of the properties in these two samples, as well as the different distributions of capital and rent values. Figures 1 and 2 below contrast the geographic spread of the properties, showing a clear concentration of London auction mart properties in the inner boroughs of London (where properties were older and predominantly owned by property investors for speculation or letting), compared to the properties mortgaged to the CPBS which were concentrated in the outer boroughs (where new and more salubrious properties were being constructed for owner occupation). This reflects the fact that the London Auction mart in the pre-war period traded in old and existing dwellings in the inner-city, whereas the CPBS in the interwar period mainly lent money for the purchase of newly-constructed houses in the suburbs in the interwar period. As such, each sample is representative of the housing supply in its respective period, i.e. of old and existing dwellings which were the bulk of properties traded in the pre-war period, and of newly constructed dwellings in the suburbs which were the bulk of properties traded in the interwar period. This is further illustrated by Figure 3 which shows the different distribution of house prices for properties sold between 1919 and 1922 (i.e. when the two samples overlap), with the London Auction Mart properties in general being cheaper than those mortgaged to the CPBS. Two more reasons also lead us to conclude that the properties sold at the London auction mart were for letting. First, it is unlikely that the wealthy kind of individuals purchasing properties at the London Auction mart would have lived in the cheap properties that were exchanged, properties that were cheaper than the new properties being constructed in the outer boroughs of London for first-time owner-occupiers. Second, the scale of the rents in the London Auction mart data indicates that the properties were at the lower-end of the housing stock rented out to the working class. The average rent of these properties was £40, which according to research by Susannah Morris, was at the lower end of the market rate for 3-room working-class properties before the First World War.20 Because the two samples
18 Mansbridge, Brick upon Brick, p.34. 19 See Samy, ‘The Building Society Promise: The Accessibility, Risk and Efficiency of Building Societies in England, c.1880-1939’, Unpublished DPhil thesis (University of Oxford: 2010), pp. 84-128. 20 Morris, ‘Private profit and public interest,’ p.268.
6
therefore cover different parts of the London housing market, the indices based on the London auction mart (1895-1922) and on the CPBS mortgage registers (1919-1939) are published separately and not combined into a single index.
Figure 1: Geographic Distribution of Properties in London Auction Mart Data: 1895-1922
Figure 2: Geographic Distribution of Properties in CPBS Data: 1919-1939

7
Figure 3: House Price Distributions of London Auction mart properties vs. CPBS properties: 1919-1922
II. Sample Selection A. London Auction Mart data (1895-1922) The year books of the London auction mart provide a fair amount of detail about each of
the properties that were traded. In addition to locational information such as the street name and house number of the property (or properties) traded and the selling price, other information such as tenure type, the level of annual and ground rents, the type of occupancy etc. were also included. Not all of the transactions that were published in the year books of the Mart however could be used to construct the indices. A substantial number of the transfers were for multiple properties, while some were for commercial or high-end residential property as indicated by their exceptionally high selling prices. The former were excluded from the sample because only one price was provided for the multiple properties traded, while the inability to identify whether the properties in the latter category were for residential or commercial purposes made them unsuitable as a basis for an index of residential house prices. Indeed, this problem can be said to beset the whole sample because the year books do not distinguish between residential or commercial property. There is no guarantee therefore that the properties included in the final sample were indeed single houses for residential use, rather than other types of property, such as flats or apartments, groups of houses or commercial property.
0.0
005
.001
.001
5.0
02
Ker
nel D
ensi
ty
0 500 1000 1500 2000House Price (£)
CPBS London Auction data

8
Notwithstanding these issues, the approach taken to select the sample was to include only those properties that had a single street number in their address field, and which did not exceed a certain selling price. The determination of this cut-off price was arbitrary, and set at £1000 (this led to the exclusion of 11 per cent of the properties with a single street number in their address field). Fortunately, the year books published the properties located in London separately from those located outside London (i.e. ‘country’ properties), which simplified the exclusion of non-London properties from the sample.
Applying these selection rules still yielded a sufficiently large sample to construct the index. Figure 4 shows the number of properties in the sample for each year, and the proportion of total annual sales at the Mart made up by the sample. A total of 32,910 properties covering the years 1895 to 1922 were included, with the number of observations varying each year from 397 in 1917 to 1,940 in 1919. For most years, the proportion of total sales at the Mart covered by the sample hovered between 15 to 20 per cent, declining during the First World War before rising to over 30 per cent in 1922. What is noteworthy from the outset is the secular decline in housing activity during the first decade of the twentieth century and continuing throughout the Great War, reflecting of course the Edwardian housing slump and the domestic effects of the war respectively.
Figure 4: Sample Size of London Auction Mart data: 1895-1922
0
0.05
0.1
0.15
0.2
0.25
0.3
0.35
0
500
1000
1500
2000
1895 1897 1899 1901 1903 1905 1907 1909 1911 1913 1915 1917 1919 1921
Perc
enta
ge o
f Lon
don
Sale
s
Sam
ple
Size
Sample Size Percentage of London Sales
B. CPBS mortgage data
Much less selectiveness was required for the CPBS mortgage data. The CPBS was at the vanguard of
vanguard of extending home ownership to a new group of owner occupiers during the interwar period,
interwar period, helped in part by rising incomes, falling building costs and the rising aspirations of the

9
aspirations of the populace during these years. The geographic distribution of the properties mortgaged
mortgaged to the society was shown in
Figure 2 to be largely concentrated on the outskirts of London, where semi-detached and detached houses were being built in new suburban housing estates for owner-occupation. As such, most of the properties mortgaged to the society provide a proper basis for the construction of a house and rent price index, but only a subset of these properties were selected in the sample due to the ever-increasing number of loans being made throughout the interwar years. The CPBS was one of the fastest growing societies in Britain during this period, increasing its mortgage portfolio from 2,729 mortgages in 1919 to 65,711 in 1939. As a consequence, the proportion of total advances covered by the sample declined from 100 per cent in 1919 to less than 9 per cent in 1939. The full sample had 10,365 observations between 1919 and 1939, with the number of observations varying each year according to the availability of mortgage registers (see Figure 5). In most years, the selected properties were drawn evenly across each year to avoid variation in the final indices due to seasonal biases. The best feature about the mortgage registers of the CPBS is the copious detail given about the properties being mortgaged, especially the structural information of each property which includes the number of rooms, the size dimensions of the property and the tenure type, in addition to the address of the property, its annual rental value and its selling price. Such details allow for a relatively well-specified hedonics function.
Figure 5: Sample Size of CPBS mortgage data: 1919-1939
0.00
10.00
20.00
30.00
40.00
50.00
60.00
70.00
80.00
90.00
100.00
0
100
200
300
400
500
600
700
800
900
1919 1921 1923 1925 1927 1929 1931 1933 1935 1937 1939
Perc
enta
ge o
f Tot
al A
dvan
ces
Sam
ple
Size
Number of Mortgages Percentage of Total Advances

10
III. The Hedonics Method
The hedonics method is commonly used by statisticians to produce price indices for non-homogeneous commodities whose characteristics vary across multiple dimensions of quality. A good example of such items, other than housing, are information and communications technology (ICT) goods (e.g. computers), where any given item may differ in terms of the quality of the materials used, the performance of the item relative to other items (such as processing speeds), or non-standard features that may affect the selling price. In the house price index literature, three general sets of characteristics are considered to be important determinants of house prices, and are included in the hedonics function to produce quality-adjusted price indices. These are (1) the structural characteristics of houses, which refer to such things as the type of construction materials used, the size of the house and the number of rooms, and other non-standard features such as water closets (WCs), kitchens and garages; (2) neighbourhood characteristics, which refer to the qualities of the environment in which a house is situated (such as demography, or environmental factors such as the aesthetics of surrounding structures, local crime rates etc.); and (3) locational characteristics, or how the property is situated in relation to other places that may affect house prices, such as distance to the centre of town, the nearest shopping centre, schools, hospitals, recreational areas etc. As far as possible, the specification of the hedonics regression should include variables that represent these three characteristics to extract the variation in house prices due to variation in these factors over time (i.e. compositional change) rather than due to the pure price inflation of the housing stock in general.
The set of variables available for hedonics regressions in the two data sources however is different and so different specifications were used to produce indices for the two sub-periods. The key difference between the London auction mart data and the CPBS mortgage registers is the availability of structural information in the latter, which allows for well-specified hedonics functions that account for more of the variation due to quality differences in the sample. Equations (1) to (5) are specifications that increase in sophistication. In all but the first equation, a semi-log specification is used, which enables the easy derivation of the indices from the parameter estimates, and minimises the impact of outlier observations on estimation. Equation (1) is a simple model which only includes time dummy variables for each year (e.g. D_1896 which equals 1 if property h was sold in 1896, or 0 otherwise), so that the parameter estimates measure the average price for its corresponding year. These are used to construct an index series by dividing the average price for each year by the average price of the base year, multiplied by 100. Equation (2) is similar to equation (1), except that log prices are used so that the parameter estimates represent the percentage change between each year and the base year. Equation (3) involves the addition of area fixed effects in the form of dummy variables for each ward21 in order to remove the variation in the indices caused by differences in locality. Equation (4) is the most complicated specification using the London auction mart data and improves on equation (3) by including dummy variables for tenure type, i.e. whether freehold, copyhold or leasehold (i.e. D_COPYHOLD=1 if property is copyhold or zero otherwise; D_LEASEHOLD=1 if property is leasehold or zero otherwise), interacted with a continuous variable for the number of years remaining on the lease for
21 A ward is a subdivision of a local authority area, which is more disaggregated than boroughs and thus provides for a greater control for locational fixed effects.

11
leasehold (LEASEHOLD_UNEXPIRED_TERM), as well as distance variables measuring the distance (in kilometres) of the property from central London (DIST_LONDON) and from the nearest railway station (DIST_RAILSTATION). This equation uses as much of the information contained in the data as possible, although supplementing the data with other data sources such as the British census, ordnance survey data and electoral data would yield additional variables that could also be used in future analyses. This is highlighted as a possible avenue for future research in the concluding section.
∑= jhd_pricejhprice δ (1)
∑+= jhd_year)log( jhprice δα (2)
∑ ∑++= ihjh d_wardd_year)log( ijhprice ηδα (3)
24
32
21
1
0ihjh
aildistance_r
aildistance_rondondistance_Londondistance_L
_termunexpired_leasehold_*_
dd_leasehold_copyholdd_wardd_year)log(
β
βββ
ωϑ
ϑπηδα
+
+++
++
++++=
∑ ∑∑∑∑∑
possessiondleaseholdd
price ijh
(4) The same regression models (1) to (4) are applied to the CPBS data, in addition to
equation (5) which includes variables that relate to the structural characteristics of the houses. These are namely the number of rooms (N_ROOMS), the size of the property (in square feet) (PROPERTY_AREA), the frontage size (in feet) (FRONTAGE) and the distance of the property from the head-quarters of the CPBS on Bloomsbury Way, London WC1 (DISTANCE_HQ) (acting as a control for distance to central London). The model results from equation (4) allow the relative importance of these structural variables to be ascertained by comparing the goodness of fit with equation (3). Whilst the regressions are based on different data sets, they provide some idea of the loss of explanatory power that arises when these variables are omitted from the model.
h
hh
hijh leaseholddprice
frontage reaproperty_areaproperty_an_roomsqdistance_h
qdistance_h_d_wardd_year)log(
6
254h3
2h2
h1ihjh
β
ββββ
βϑηδα
+
++++
++++= ∑∑∑ (5)
The derivation of the house price indices depends on whether the dependent variable is in
level or logarithmic form. Equation (6) shows how to derive the house price index from the parameter estimates for the time dummy variables when (1) is used as the model specification, while equation (7) shows the formula when (2) to (5) are used. The base year (s) for HPI/RRPI using the London auction mart data is 1895, while the base year for the

12
indices using the CPBS data is 1920. In each case, the HPI/RRPI values for the base years are set to 100.
100×=s
tTDtP δ
δ (6)
100]exp[ ×= tTDtP δ (7)
The price indices (7) and (8) rely on a prior estimation of a hedonics model with time
dummy variables to derive estimates that can be used in the formula. This approach however suffers from a number of problems in addition to the obvious problems surrounding model mis-specification. One of these problems is that the shadow prices of the various factors (i.e. the parameter estimates of the regressors in the model) are kept fixed over the full sample period, when in fact they may well vary from year to year. This leads to biases which in turn affect the accuracy of the resulting indices. A further problem is that the addition of a new period to the data set may change the price indices for all periods, violating the desirable property of temporal fixity which requires indices to be robust to new data being added to the sample.22 Such weaknesses of the time-dummy approach warrant the inclusion of indices constructed using an alternative approach.
One of these approaches is to remove the time dummies from the hedonics specification, and to use imputation methods over adjacent periods to construct the indices. Imputation methods make use of standard price index formulae, but replace actual transaction prices with prices imputed from an hedonics regression in order to remove the variation due to compositional change as before. The replacement of actual prices with imputed prices may sound counter-intuitive, but research has shown that replacing real prices with imputations can sometimes reduce the omitted variables bias from the hedonics specification and help ensure that like is compared with like.23
Three additional versions of HPIs and RRPIs are computed in this paper using the imputation approach. These use the Laspeyres, Paasche and Fisher formulae, but using the fully-specified hedonics models (i.e. equation (4) for the London auction mart data, and equation (5) for the CPBS mortgage data, excluding the time variables) to calculate the prices corresponding to the numerator and the denominator of these formulae. The first step in this process is to estimate separate hedonics models for each year (using the properties actually sold in each year) and then use the resulting parameter estimates from these regressions to calculate the prices of the same bundle of houses for each year. In the case of the Laspeyres index ( L
stP ), this involves imputing the prices of the properties sold in the base year for all years in the sample (i.e. using the characteristics of property h sold in year shz to estimate the price that such a property would have been if it were sold in year t, namely )(ˆ shth zp ) and then dividing the sum of these imputed prices by the sum total of the imputed prices for the base year ( )(ˆ shsh zp ). The formula is shown in equation (8). In the case of the Paasche index ( P
stP ), the imputed prices for each year are calculated using the properties sold in that year, but their sum is divided by the sum of imputed prices for the base year using the properties sold in the current year, rather than the properties sold in the base year. This is shown in equation (9).
22 Hill, ‘Hedonic price indexes for housing’, p.23. 23 Ibid, p.22.

13
The third index, the Fisher index ( FstP ), is simply a combination of the first two, derived by
taking the square root of the Laspeyres index multiplied by the Paasche index. This is shown in equation (10).
∑∑==
=ss H
hshsh
H
hshth
Lst zpzpP
11)(ˆ)(ˆ (8)
)(ˆ)(ˆ11
th
H
hsh
H
hthth
Pst zpzpP
tt
∑∑==
= (9)
Pst
Lst
Fst PPP ×= (10)
Producing these indices resolves the problem of biases resulting from parameter
instability across periods, and temporal non-fixity. Nonetheless, the consistency of these indices also depends on the proper specification of the hedonics model, which in the present case is limited by the availability of relevant variables. Notwithstanding this fact, Tables A4.1 and A4.2 in Appendix 4 show that the estimated models explain a fair proportion of the variation in house prices and rent prices respectively. Table A4.1 shows the difference in explanatory power when the more complex model (4) is used on the London auction mart data compared to the more simple averages models of (1) and (2). The simple averages models explain only 6 per cent of the total variation in house prices and 0.9 per cent in rents, while the more complex models explains 29.9 per cent of house price variation and 22.1 per cent in rent price variation. This rise in explanatory power is even greater in the case of the CPBS house price data, from 9 per cent of house price and 12.1 per cent of rent price variation, to 51 per cent of house price and 43.9 per cent of rent price variation. The signs of the estimated coefficients of these models match the expected signs a priori, although the models violate the classical linear regression assumption of heteroscedasticity, meaning that the reported goodness of fit measures may be inflated. The fact that the models are under-specified means that not all of the compositional change will be removed from the final indices, and indeed more work must be done to supplement the data with variables that will capture the structural and neighbourhood characteristics that are missing from the present models. That said, whilst the models used here may suffer from omitted variables bias, they allow for the removal of at least some of the variation due to compositional change.
III. Findings: House Prices and Rental Prices in London I. House and Rent Price Indices: 1895-1922
The nineteenth century saw a massive transformation in housing as Britain became more
urbanised due to industrialisation. According to Burnett, the urban dwellers of England and Wales rose from 9.9 million (or 54 per cent of the population) in 1851 to 28,468,000 (or 79
14
per cent of the population) in 1911.24 Housing construction in most places by the mid-nineteenth century was largely organized by a private building industry with houses bought and sold in a private housing market.25 For various reasons, the predominant housing tenure for working and middle-class families was rental from private landlords, with the figure of 10 per cent being thought by some historians as the approximate proportion of the housing stock that was owner-occupied on the eve of the First World War.26 The capacity of the private housing market however to provide decent and adequate housing for all classes of English society was not guaranteed, with the number of houses built annually being subject to marked and rapid fluctuations despite the more regular growth of the population.27 Up until the First World War, the building industry was still largely composed of small-scale builders using traditional methods, and despite its remarkable record of constructing new houses for a rapidly growing population in the late nineteenth century, it still oversaw a massive shortfall in housing that became known as the Victorian housing problem.28 Various causes have been cited in the housing history literature for this problem (which mainly affected the working-classes whose lower incomes limited the investment returns on their type of housing and thus led to under-investment and under-production), such as demographic pressures,29 stagnating incomes and unstable employment,30 unstable interest rates, inferior investment returns on housing compared to other investments,31 the declining fiscal position of landlords,32 politics and local taxation,33 and the building cycle.34 According to Weber, who constructed an index of residential house building from 1856 to 1914 (based on house plans that had to be submitted to local authorities before construction), building activity in Great Britain followed a cyclical pattern that reached its long-run peak in 1876, and then declined until the mid-1890s when there was a brief upturn in construction. This brings us to the period under study in this paper, during which building activity in London reached a triple peak in 1899, 1901 and 1903, before a secular decline thereafter that was so severe that the resulting levels of building activity in 1912 and 1913 were lower than that of any time since 1895.35 This is shown in Figure 6 below. In what has been described as the Edwardian property slump, prices have been estimated to have fallen by 40 per cent while rents remained stable and high.36 The declining house prices compounded an already unfavourable environment for housing capitalists, whose economic position had weakened since the end of the nineteenth century as greater rights were being accorded to tenants and a more interventionist policy was being taken by the government.37 This culminated in the price controls on rents imposed during the First World War which severely squeezed the returns on housing investment. It
24 Burnett, A Social History of Housing, 1815-1970, pp.138-9. 25 Thompson, The Rise of Respectable Society, pp.168-9. 26 Ibid., p.168. 27 Burnett, op. cit., p.139. 28 Ibid., p.139. 29 Wohl, ‘Housing the Working Classes in London, c.1815-1914,’ p.16. 30 Ibid, p.36. 31 Cooney, ‘Capital exports and investments in building in Britain and the U.S.A.,’ pp.347ff. 32 Daunton, op. cit., p.234. 33 Offer, op. cit., pp.283-316. 34 Cairncross, Home and Foreign Investment, 1870-1913, pp.212-4. 35 Weber, ‘A New Index of Residential Construction,’ pp.131-2. 36 Offer, op. cit., p.254-282. 37 Daunton, op. cit., p.234.

15
was not until the late 1920s when house construction activity recovered as Britain faced the monumental task of building homes ‘fit for heroes’ amidst an already acute housing shortage.
Figure 6: Index of House Building in London (1895=100): 1895-1921
0
50
100
150
200
250
1895 1897 1899 1901 1903 1905 1907 1909 1911 1913 1915 1917 1919 1921
Inde
x&of&H
ouses&C
onstructed
&in&Lo
ndon
&(1895=100)
Source: Weber, ‘A New Index of Residential Construction,’ p.129.
The house price indices reflect these various developments in the housing market. Figure
7 shows the pattern of house price inflation for the period of 1895 to 1922. All of the different HPIs show the same trend, of steady house price inflation between 1895 and 1903, followed by rapid deflation from 1903 to 1914 and stagnation during the First World War (1914-1918). House construction activity was high throughout the last few years of the nineteenth century and the first few years of the twentieth, before declining sharply during the Edwardian years. Prices were stagnant during the First World War because of rent controls imposed by the government (specifically, the Mortgage and Rate Restriction Act of 1915) and rose rapidly after the end of the War because of the surge in demand for housing as troops returned home from the war and as price controls were eased. The indices however differ in the magnitude of house price inflation during these different phases of the housing cycle. The most basic of these indices (the one based on simple averages) differs most from the other indices, showing a general appreciation in house prices of 17 per cent from 1895 to 1903, followed by a fall of 34 per cent from peak to trough in the Edwardian property slump. The indices based on hedonics adjustment show a slightly higher appreciation in house prices from 1895 to 1903, of between 20 to 24 per cent, followed by a larger fall in house prices during the property slump of between 34 to 42 per cent. The hedonics-adjusted indices therefore depict a stronger move in house prices during this period than the indices based on

16
simple averages. Table A1.1 contains the index numbers for each year according to the different hedonics specifications used.
Figure 7: Annual HPI - 1895-1914
50.00
60.00
70.00
80.00
90.00
100.00
110.00
120.00
130.00
140.00
1895 1897 1899 1901 1903 1905 1907 1909 1911 1913 1915 1917 1919 1921
HPI-Simple Averages (Eq.1) HPI-Log Linear Specification with Time Dummies Only (Eq.2)
HPI-Log Linear Specification with Time and Ward Dummies (Eq.3) HPI-Log Linear Specification with All Variables (Eq.4)
HPI-Chained-Fisher (Eq.10)
One feature that can be observed among the above indices is their high co-movement.
The indices paint a similar picture of the pattern and timing of the different phases of the housing cycle described. Of particular interest to housing historians is the beginning of the Edwardian property slump, which from the above can be seen to have occurred around 1903-4, when all of the indices began to turn from their peak. In order to identify the exact timing of the start of the slump, Figure 8 below shows the percentage changes in average house prices from quarter to quarter between 1900 and 1905. The graph shows that there were significant deflations in house prices in all four quarters of 1900 until 1901 when house prices rose sharply. The change in the longer-term cycle however occurred in 1903, and more specifically in the second quarter of 1903, when house prices fell by between 2 to 3 per cent. While this fall may have been less than the percentage falls in 1900, it was the first in a long succession of quarters when house prices consistently fell.

17
Figure 8: Quarterly percentage changes in house prices - 1900:1-1905:1
-0.2
-0.15
-0.1
-0.05
0
0.05
0.1
0.15
0.2
1900:1 1900:3 1901:1 1901:3 1902:1 1902:3 1903:1 1903:3 1904:1 1904:3 1905:1
Percentage Change in HPI-Using Simple Averages (Eq.1)Percentage Change in HPI-Using Log Specification with All Variables (Eq.4)
The movement of rents on the other hand during this period was much less eventful.
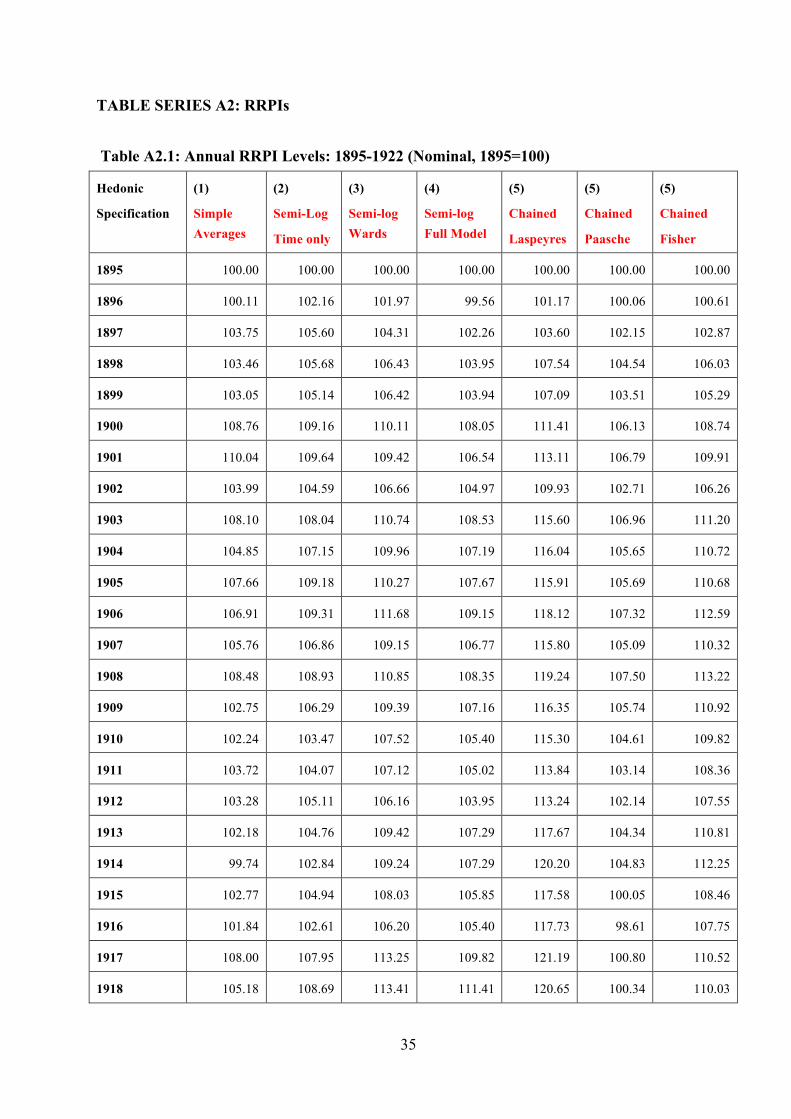
Figure 9 shows that, apart from a large surge in rents after the First World War, rents remained stable from the late nineteenth century and throughout the Edwardian property slump. According to the hedonics-adjusted indices, rents rose around 8 per cent between 1895 to 1903, and remained largely unchanged from 1903 until the end of the First World War. The insensitivity of rents to the general housing cycle before the First World War reflects the fact that most home renters were unable to take advantage of falling house prices by switching from renting to home ownership, and thereby force rents to fall with house prices. Renting and home ownership were clearly not perfect substitutes for working-class house occupants. Table A2.1 contains the index numbers of rents for each year according to the different hedonics specifications used.
It is possible with the data compiled in this study to investigate the different geographical trends in house and rent prices. Figure 10 shows the HPIs for properties located in inner London, outer London and the whole of London separately (using equation (4) as the hedonics specification). The indices for inner and outer London are more volatile than the index for the whole of London because fewer observations were used in the estimation of the former. This is especially so for the outer London series given that the bulk of the properties in the sample were located in inner London. At any rate, the graphs show that house prices declined more acutely in inner London than in outer London, indicating that the property slump was felt mostly in the buy-to-let market than in the owner-occupier market which was localised in outer London. Between 1903 to 1914, house prices fell in inner London by approximately 44.8 per cent, compared to 33 per cent in outer London, while rents fell by 5.6 per cent in inner London and rose by 6.1 per cent in outer London. The surge in rent prices at the end of the First World War was higher in inner London than in outer London, with rents

18
rising 26.8 per cent in the former and 13.1 per cent in the latter between 1915 and 1922, while house prices rose by 21.0 per cent in inner London and 17.9 per cent in outer London over the same period.
Figure 9: Annual RRPI - 1895-1922
80.00
90.00
100.00
110.00
120.00
130.00
140.00
1895 1897 1899 1901 1903 1905 1907 1909 1911 1913 1915 1917 1919 1921
RPI-Simple Averages (Eq.1) RPI-Log Linear Specification with Time Dummies Only (Eq.2)
RPI-Log Linear Specification with Time and Ward Dummies (Eq.3) RPI-Log Linear Specification with All Variables (Eq.4)
RPI-Chained-Fisher (Eq.10)
Figure 10: HPIs for Inner vs. Outer London - 1895-1922
20.00
40.00
60.00
80.00
100.00
120.00
140.00
160.00
1895 1897 1899 1901 1903 1905 1907 1909 1911 1913 1915 1917 1919 1921
All London Inner London Outer London
Note: HPIs calculated using the full hedonics specification (eq.4).
19
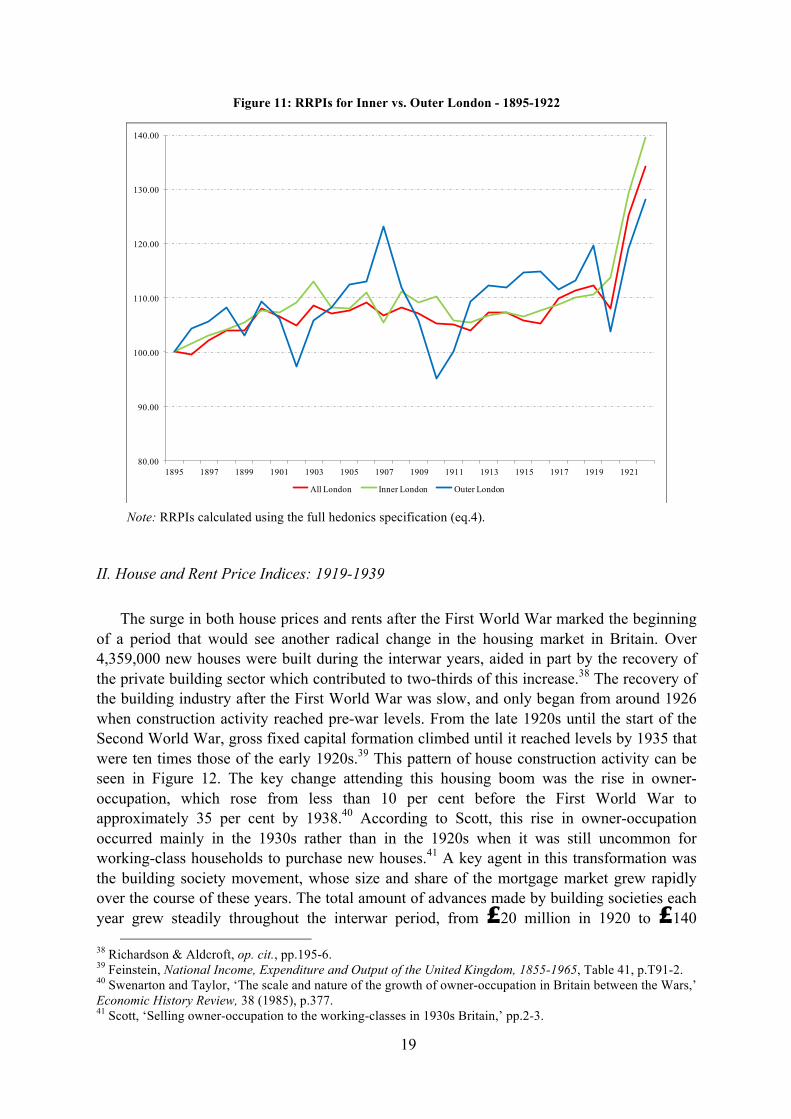
Figure 11: RRPIs for Inner vs. Outer London - 1895-1922
80.00
90.00
100.00
110.00
120.00
130.00
140.00
1895 1897 1899 1901 1903 1905 1907 1909 1911 1913 1915 1917 1919 1921
All London Inner London Outer London
Note: RRPIs calculated using the full hedonics specification (eq.4).
II. House and Rent Price Indices: 1919-1939
The surge in both house prices and rents after the First World War marked the beginning of a period that would see another radical change in the housing market in Britain. Over 4,359,000 new houses were built during the interwar years, aided in part by the recovery of the private building sector which contributed to two-thirds of this increase.38 The recovery of the building industry after the First World War was slow, and only began from around 1926 when construction activity reached pre-war levels. From the late 1920s until the start of the Second World War, gross fixed capital formation climbed until it reached levels by 1935 that were ten times those of the early 1920s.39 This pattern of house construction activity can be seen in Figure 12. The key change attending this housing boom was the rise in owner-occupation, which rose from less than 10 per cent before the First World War to approximately 35 per cent by 1938.40 According to Scott, this rise in owner-occupation occurred mainly in the 1930s rather than in the 1920s when it was still uncommon for working-class households to purchase new houses.41 A key agent in this transformation was the building society movement, whose size and share of the mortgage market grew rapidly over the course of these years. The total amount of advances made by building societies each year grew steadily throughout the interwar period, from �20 million in 1920 to �140
38 Richardson & Aldcroft, op. cit., pp.195-6. 39 Feinstein, National Income, Expenditure and Output of the United Kingdom, 1855-1965, Table 41, p.T91-2. 40 Swenarton and Taylor, ‘The scale and nature of the growth of owner-occupation in Britain between the Wars,’ Economic History Review, 38 (1985), p.377. 41 Scott, ‘Selling owner-occupation to the working-classes in 1930s Britain,’ pp.2-3.

20
million in 1935.42 Consequently, building society lending became a more important source of housing finance, with loans rising from 40 per cent of gross fixed capital formation in housing in 1920 to over 80 per cent by the end of the 1930s. In the process, building societies overtook private solicitors as the predominant providers of housing finance, being better suited to handle the high volumes of mortgage transactions in an ever expanding housing market. Examining the properties mortgaged to one of the largest building societies in the movement at the time can therefore give us insight into the house price and rent price movements of the kinds of properties purchased with mortgage finance during the interwar period.
Figure 12: Index of House Building in London (1895=100): 1895-1921
0
100
200
300
400
500
600
700
1895 1898 1901 1904 1907 1910 1913 1916 1919 1922 1925 1928 1931 1934 1937
Inde
x&of&H
ouses&C
onstructed
&in&Lo
ndon
&(1895=100)
Source: Weber, ‘A New Index of Residential Construction,’ p.129.
Another significant development in this period which affected the dynamics of house and
rent prices was rent controls. Rent controls were introduced in 1915 as a means of protecting tenants of working-class property from rent price hikes due to the cessation of private house building during the War. The controls were originally intended to be temporary but were extended after the War to prevent inflation due to the sharp rise in building costs after the War and endured throughout the whole interwar period. Various acts throughout the 1920s and 1930s extended and modified these rent controls. The original Increase of Rent and Mortgage Restriction Act of 1915 froze rent and mortgage interest rate increases on all working-class properties with a rateable value in excess of ₤35 in London and ₤30 elsewhere,
42 Registry of Friendly Societies, Annual Reports, various issues (1920-1939).

21
but upward pressure on rent prices after the War and acute shortages in housing supply required the government in subsequent Acts of the same name in 1917, 1918 and 1919 to change the scope of properties covered by the Act and/or allow increases in rates by a specified amount.43 In the Increase of Rent and Mortgage Restriction Act of 1920, the limits of rate control were raised to three times the original rateable value level, which spread the coverage of rent control to 98 per cent of the nation’s housing stock.44 In addition, a rent increase of 30 per cent was allowed, which was subsequently raised to 40 per cent in 1921. Significantly, the Act did not apply to houses erected or in the course of erection after the 2nd of April 1919, which meant that new houses were exempt from rent control. The purpose of this exemption was to encourage private house building, however a combination of different factors such as competition from subsidized public housing and high building costs militated against this idea in the 1920s. In 1923, the government attempted to address this problem by introducing decontrol, i.e. removing rent controls on houses when changes of tenancy occurred. In other words, the control of the rent of any house would only last during the existing term of the tenancy, which allowed landlords to charge higher rents to new tenants of their property. The policy had little effect. The Marley Committee in 1930 was established to investigate the effectiveness of the various housing acts in the 1920s and concluded that the process of decontrol had been much slower and ineffective than expected. They found that only one eighth of the working-class houses controlled by 1919 had become decontrolled by 1930, leading to significant inconsistencies in the amount of rents charged for identical properties. They found that the rents on decontrolled properties had rents that were around 85 to 90 per cent above their pre-war level, while controlled properties had rents that were only 50 per cent above their pre-war level.45 One of the pernicious effects of control and decontrol had been that it had discouraged labour mobility by raising the transaction costs of tenants from moving to better homes and locations where they could avail of better job opportunities. The Committee recommended the division of the housing stock into three categories according to rateable value, with controls to be removed from the more expensive properties in the highest category. The Ridley Committee in 1937 estimated that the effect of the Marley Committees policies had been to reduce the proportion of the housing stock that was under rent control to only 44 per cent, and recommended that houses above ₤40 rateable value be decontrolled. The 1938 Act decontrolled houses with a rateable value exceeding ₤35 in London, and ₤20 elsewhere.46
Figure 13 shows the course of house prices over the period. House prices grew rapidly throughout the 1920s as the sudden demand for housing after the War outstripped supply that took until the end of the decade to properly respond to the excess demand in the housing market. According to the indices, house prices grew somewhere between 35 to 50 per cent between 1920 and 1925: the indices based on simple averages indicating a 49 per cent increase in house prices, while the Chain Fischer index indicating a 44 per cent increase in prices over the period. Most of these indices peaked in 1926, when building construction activity began to recover from the hiatus it had reached since the Edwardian property slump. Throughout the 1930s, house prices declined annually as the building boom took place, but inflected towards the end as the Second World War loomed. Between 1930 and 1935, house
43 Field-Fisher et al, Rent Regulation and Control, pp.1-2. 44 Lewis, op. cit., p.227. 45 Ibid.,, p.229. 46 Ibid., pp.229-30.

22
prices fell by between 5 to 8 per cent, before re-inflating such that house prices in 1938 were only as little as 2 per cent lower their 1930s level.
Figure 13: Annual HPI - 1919-1939
60.00
80.00
100.00
120.00
140.00
160.00
180.00
1919 1921 1923 1925 1927 1929 1931 1933 1935 1937 1939
HPI-Simple Averages (Eq.1) HPI-Log Linear Specification with Time Dummies Only (Eq.2)
HPI-Log Linear Specification with Time and Ward Dummies (Eq.3) HPI-Log Linear Specification with All Variables (Eq.5)
HPI-Chained-Fisher (Eq.10)
It is noteworthy that this inflation in house prices came at a time of high deflation in
consumer prices. Consumer prices fell by 32 per cent between 1920 and 1930, and continued to fall over the first half of the 1930s before re-inflating slightly from 1935 to 1939.47 The rise in nominal house prices and the fall in the general price level magnified the rise in real house prices during the 1920s. Figure 14 compares the course of nominal house prices with real house prices, obtained by dividing the nominal house price index with the consumer price index. Whilst nominal prices grew 55 per cent between 1920 and 1930, real house prices grew 127.6 per cent over the decade before falling 3.2 per cent during the 1930s. Most of this growth occurred during the early 1920s when consumer price deflation was high and house prices were rapidly inflating. By the end of the interwar period, real house prices were still over double their 1920 level (i.e. 118.9 per cent above), having declined during the 1930s.
47 Based on CPI series in Bank of England, ‘Three Centuries of Data on the UK Economy’.

23
Figure 14: Nominal vs. Real HPI - 1919-1939
80
100
120
140
160
180
200
220
240
1919 1921 1923 1925 1927 1929 1931 1933 1935 1937 1939
Nominal HPI Real HPI
Note: Using the HPIs calculated using the full hedonics specification with time dummies (Eq.5)
Unlike the pre-war period when rents remained stagnant during the Edwardian property
slump, rents rose even higher than house prices during the 1920s before stabilising throughout the 1930s (see Figure 15). This is not surprising given the surge in demand for housing from returned servicemen after the First World War combined with the relatively inelastic supply of housing in the 1920s. Rent prices doubled between 1920 and 1926 and rose a further 11 per cent between 1926 and 1930. Rents then declined during the 1930s as the boom in housing construction eased demand pressures, reaching a nadir in 1935 that was 11.1 per cent below the 1930 level, and then re-inflating until 1939 to the level they were in 1930. It is difficult to ascertain the exact effect of rent controls on the magnitude of rent price inflation reported here, but rent controls probably suppressed the scale of rent inflation that would have occurred if the market pricing mechanism were allowed to function unhindered in the 1920s by discouraging private house building and reducing effective demand for homes through discouraging tenants to move homes and thereby be subject to higher rents in decontrolled property.48 It must be borne in mind however that the rent data in the CPBS mortgage registers were most likely not from properties that were subject to rent control, either because the properties were built in the interwar period (and hence exempt from control) or because the rent figures reported in the mortgage registers (particularly from 1923 onwards) were not the actual levels of rent being paid by tenants of the properties being mortgaged but rather the surveyors’ valuations of their rental values if the properties were to have new tenants. In other words, the rent figures used in this study are rent prices for decontrolled properties rather than controlled properties, and thus record the rent prices
48 See Richardson & Aldcroft, op.cit., p.194.

24
determined by market forces, albeit in a highly regulated housing market where the majority of properties were subject to rent control. That said, it should also be kept in mind that the savage deflation in consumer prices over much of the interwar period would have eased the burden on households facing rent price increases in both controlled and decontrolled properties through an income effect as the fall in the price of consumerables freed up income to spend on rent expenditures, mortgage repayments and other expenditures.
Figure 15: Annual RRPI - 1919-1939
20.00
70.00
120.00
170.00
220.00
270.00
1919 1921 1923 1925 1927 1929 1931 1933 1935 1937 1939
RPI-Simple Averages (Eq.1) RPI-Log Linear Specification with Time Dummies Only (Eq.2)
RPI-Log Linear Specification with Time and Ward Dummies (Eq.3) RPI-Log Linear Specification with All Variables (Eq.5)
RPI-Chained-Fisher (Eq.10)
An important comparison to keep in mind is the course of rents and house prices vis-à-vis earnings during this period. Average annual earnings doubled in the interwar period from their pre-war levels, but stagnated from the mid-1920s until the end of the interwar period. Rents therefore grew much faster than earnings, particularly in the early 1920s when the ratio of rents to earnings more than doubled. In fact, rents doubled against earnings between 1920 and 1923, and this disparity grew until 1931 when the ratio of rents to earnings was 2.7 times the ratio in the 1920s, a factor no doubt contributing to the rise in home ownership from less than 10 per cent before the First World War to over a third of the housing stock by the end of the 1930s. Whilst rents moderated during the 1930s, the ratio of rents to earnings was still more than double the level it had been at the start of the interwar period. This trend is shown in Figure 16. Another contributing factor to the rise in homeownership is the slower growth of house prices compared with rents. The ratio of house prices to earnings exhibited the same general pattern of the ratio of rents to earnings, but grew to a lesser extent such that they were in the 1930s at around double the level they were in 1920. The rising house prices however were offset by the liberalisation of loan terms by building societies and the low interest rates caused by cheap money in the 1930s, both of which acted to bring debt servicing costs down

25
such that they were commensurate with rental rates, providing in turn a stronger incentive to households to buy rather than rent and facilitating the phenomenal rise in home ownership levels that took place during the 1930s.
Figure 16: Ratio of House Prices and Rents to Earnings - 1920-1939
0.00
0.50
1.00
1.50
2.00
2.50
3.00
1920 1922 1924 1926 1928 1930 1932 1934 1936 1938
Ratio of Rent to Earnings Ratio of House Prices to Earnings
IV. Conclusion
The indices produced in this paper are a first attempt at producing continuous measures of house and rent price information for the London housing stock before the Second World War. They are by no means intended to provide a final and definitive measure of housing inflation over this period, but rather to demonstrate the viability of using the two primary sources used in this study to derive decent measures of housing and rent inflation that corroborate with what is known in the historical literature about the housing market at this time. Indeed, there is much scope to extend the work of this paper by using these sources more exhaustively, particularly the mortgage registers of building societies, which can be readily found in archives all over England, and which cover the periods both before and after the period under study in this paper. The data used in this study is from only one of many different building societies that operated all over England during the period, and even so only covers a small sample of the total loans made by that society. The ubiquity of building societies in England and their appeal to a wide segment of British society means that large samples can be gathered for different kinds of housing in different cities, and used to improve the precision of the estimates in this paper, as well as provide indices for other cities and across wider time periods.

26
Additionally, there are other sources that can be exploited to supplement the data used in this paper. The hedonics models estimated here were particularly lacking in neighbourhood and locational characteristics because of the relative dearth of socioeconomic and local area data in Britain for this period. Nonetheless, various options exist. One possible (albeit imperfect) variable for neighbourhood characteristics may come from electoral data. The political parties that were elected in local area elections, as well as the percentage of the votes they received, might serve as useful proxies for the socioeconomic character of local areas in the sample. In the case of locational characteristics, obtaining lists and locations of shopping centres, schools and other community amenities from telephone directories and suchlike would be useful to providing more locational information to the models. The inclusion of such variables in the hedonics model will be important to removing as much of the compositional variation due to neighbourhood and locational characteristics as possible.
The omission of such data in the present case leaves much room for improvement in the model specification, which even in the case of the full model explains only a small proportion of the total variation in prices. Further work remains to be done also on the appropriate functional form specification to adopt, and experimenting with alternative approaches to index measurement given the particular limitations of the data. That said, the indices presented in this paper must be qualified in a number of respects. First, the indices presented are measures of the house price and rent price inflation of a particular kind of housing property, i.e. residential working-class housing in London: they are not general measures of inflation for the whole housing stock. Second, the primary sources used are biased in their coverage of only certain areas of London (the inner city in the case of the London auction mart data, and the outer suburbs in the case of the CPBS data), which means that each index is biased in its capture of the price dynamics of certain areas in London. There is scope therefore for future research into the inflation experience of different types of housing in a more representative sample of London and England, which again might be addressed by a more comprehensive use of the primary source material that is available. Third, there is still much work to be done on the hedonics models used in this study, particularly with regard to the functional form and the set of variables to be used in estimation. The goodness-of-fit statistics of the hedonics models are low, which means that much of the compositional variation is still yet to be extracted. Supplementing house sales data with socioeconomic and locational data of the kind just described may help, as well as experimenting with different functional forms, and different approaches to index measurement which would maximize the accuracy and efficiency of the indices produced.
Despite the shortcomings of the data and the methodology employed in this study, the story of house price and rent inflation told by the indices produced in this study is consistent with the housing history literature, and gives estimates of the magnitude and timing of house price and rent price movements between 1895 and 1939. Overall, the paper provides a continuous set of statistics that opens up new possibilities for econometric-based research in British housing and macroeconomic history, and most importantly, fills a long-standing lacuna in the stock of historical statistics for Britain.

27
References Manuscript and Archival Sources
LONDON AUCTION MART, Yearbook (1895-1921)
NATIONWIDE BUILDING SOCIETY ARCHIVES (Northampton), (Co-operative Permanent Building Society (CPBS), Mortgage Registers: 1919-1939).
Unpublished Sources MORRIS, S., ‘Private profit and public interest: model dwellings companies and the housing of the working classes in London, 1840-1914’, Unpublished Thesis (DPhil: University of Oxford 1998). SAMY, L. G., ‘The Building Society Promise: The Accessibility, Efficiency and Stability of Building Societies in England, 1880-1939’ Unpublished DPhil Thesis (University of Oxford, 2010).
SPEIGHT, G., ‘Building society behaviour and the mortgage lending market in the inter-war period: risk-taking by mutual institutions and the inter-war house-building boom’, Unpublished Thesis (DPhil: University of Oxford, 2000). Published Sources BANK OF ENGLAND, ‘Three centuries of data on the UK economy’, Quarterly Bulletin Q4 (2010). Available: http://www.bankofengland.co.uk/statistics/Pages/default.aspx.
BURNETT, J., A Social History of Housing 1815-1970 (London: 1978).
CAIRNCROSS, A. K., Home and Foreign Investment, 1870-1913 (Cambridge: 1953).
COONEY, E. W., ‘Capital exports and investments in building in Britain and the U.S.A.,’ Economica 16 (1949), pp.347-354.
DAUNTON, M. J., House and Home in the Victorian City: Working-class Housing 1850-1914 (London: 1983).

28
DAUNTON, M. J., ‘Housing’ in THOMPSON, F. M. L. (ed.), The Cambridge Social History of Britain: Vol. 2: People and their Environment (Cambridge: 1990), 195-250. FEINSTEIN, C. H., National income, expenditure and output of the United Kingdom, 1855-1965 (London: 1972). FIELD-FISHER, T. G., IBBOTSON, S., and ROYDHOUSE, E. Rent Regulation and Control (London: 1967). HILL, R. ‘Hedonic Price Indexes for Housing’, OECD Statistics Working Papers, no. 36 (2011). Available online: http://dx.doi.org/10.1787/5kghzxpt6g6f-en. KNOLL, K., SCHULARICK, M.., and STEGER, T., ‘No price like home: Global House Prices, 1870-2012’, CEPR Discussion Paper no. 10166, Available at: www.cepr.org/pubs/dps/DP10166.php. MANSBRIDGE, A., Brick upon brick (London: 1934). OFFER, A., Property and Politics 1870-1914: Landownership, Law, Ideology, and Urban Development in England (Cambridge: 1981). PARRY LEWIS, J. Building Cycles and Britain’s Growth (New York: 1965). REGISTRY OF FRIENDLY SOCIETIES (RFS), Reports of the Chief Registrar of Friendly Societies, Various Issues: 1920-1939. RICHARDSON, H. W, and ALDCROFT, D. H. Building in the British Economy between the Wars (London: 1968). SCOTT, P., ‘Selling owner-occupation to the working classes in 1930s Britain,’ University of Reading Business School Discussion Paper, 23 (2004). SWENARTON, M. and TAYLOR, S., ‘The scale and nature of the growth of owner-occupation in Britain between the wars,’ Economic History Review, 38 (1985), 373-392. THOMPSON, F. M. L., The Rise of Respective Society: A Social History of Victorian Britain 1830-1900 (London: 1988).

29
WEBER, B., ‘A New Index of Residential Construction,’ Scottish Journal of Political Economy, 2 (1955), pp.104-132.

30
Data Appendices TABLE SERIES A1: HPIs Table A1.1: Annual HPI Level: 1895-1922 (Nominal, 1895=100)
Hedonic
Specification
(1)
Simple Averages
(2)
Semi-Log with
Time dummies
(3)
Semi-log with Ward dummies
(4)
Semi-log Full Model
(5)
Chained
Laspeyres
(5)
Chained
Paasche
(5)
Chained
Fisher
1895 100.00 100.00 100.00 100.00 100.00 100.00 100.00
1896 101.45 102.53 103.27 105.55 107.43 102.48 104.93
1897 110.07 113.40 112.24 114.34 115.46 110.27 112.83
1898 113.82 119.70 118.95 121.19 125.07 118.10 121.54
1899 114.51 121.94 119.45 122.77 126.99 118.51 122.67
1900 111.98 118.14 116.71 122.62 125.61 116.79 121.12
1901 115.50 122.50 120.13 125.17 128.67 120.29 124.41
1902 116.76 122.21 119.52 125.36 130.39 123.34 126.82
1903 117.20 124.26 120.03 122.78 128.64 117.46 122.92
1904 111.55 116.56 113.68 116.97 126.13 114.08 119.95
1905 106.66 109.27 107.42 111.77 120.38 108.17 114.11
1906 102.21 105.01 102.28 106.47 113.59 102.64 107.98
1907 95.30 97.59 92.98 96.62 103.81 93.85 98.71
1908 88.47 87.75 87.19 91.68 97.38 88.09 92.62
1909 84.49 86.11 82.86 85.25 92.39 84.14 88.17
1910 84.35 82.70 80.35 79.83 92.57 80.76 86.46
1911 79.41 79.07 76.88 77.66 91.60 79.10 85.12
1912 77.27 76.29 72.32 75.19 85.48 71.92 78.40
1913 76.35 73.39 69.28 73.80 87.95 72.95 80.10
1914 78.79 76.93 72.83 76.07 90.38 76.20 82.99
1915 74.68 74.70 72.58 76.08 91.14 74.34 82.31
31
1916 79.80 77.87 73.28 75.30 89.01 71.36 79.70
1917 76.21 73.65 72.05 77.86 89.87 71.76 80.31
1918 80.49 78.74 76.04 78.62 93.30 75.04 83.67
1919 93.88 90.46 85.69 88.89 103.98 84.63 93.81
1920 116.01 107.30 99.22 99.15 117.25 95.08 105.58
1921 108.22 96.87 90.36 88.92 106.58 82.95 94.03
1922 113.43 105.81 100.15 95.93 112.24 84.21 97.22
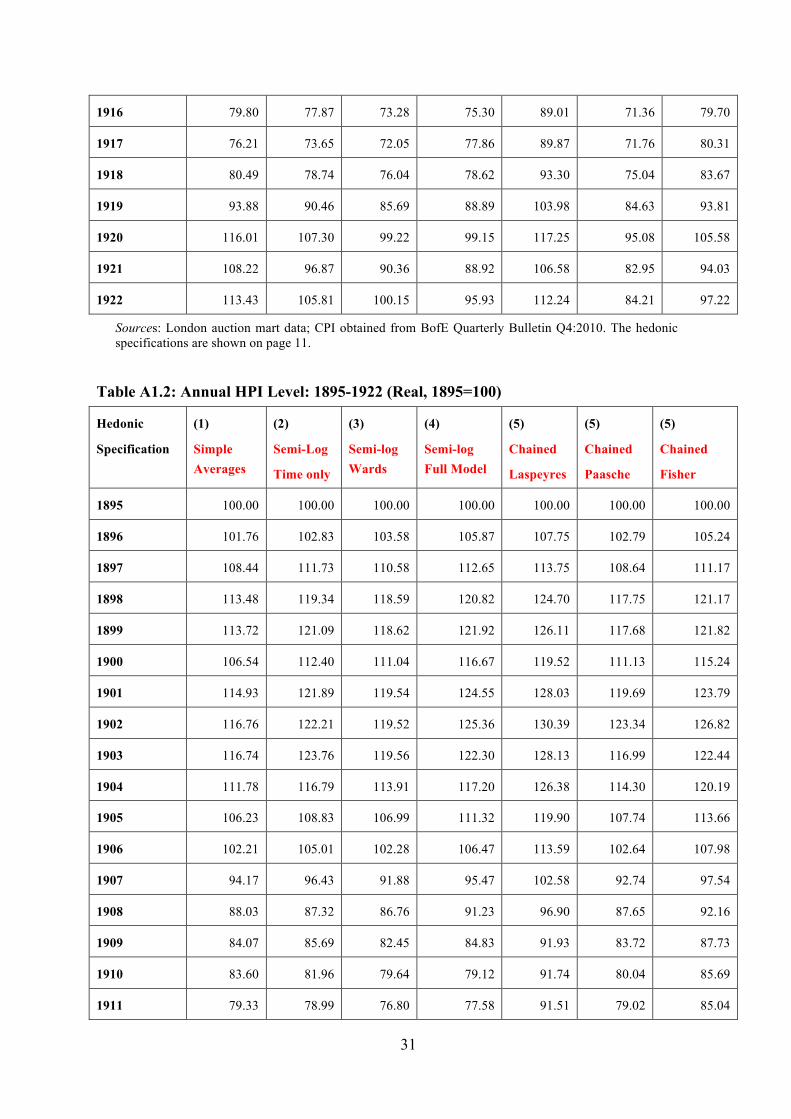
Sources: London auction mart data; CPI obtained from BofE Quarterly Bulletin Q4:2010. The hedonic specifications are shown on page 11.
Table A1.2: Annual HPI Level: 1895-1922 (Real, 1895=100)
Hedonic
Specification
(1)
Simple Averages
(2)
Semi-Log
Time only
(3)
Semi-log Wards
(4)
Semi-log Full Model
(5)
Chained
Laspeyres
(5)
Chained
Paasche
(5)
Chained
Fisher
1895 100.00 100.00 100.00 100.00 100.00 100.00 100.00
1896 101.76 102.83 103.58 105.87 107.75 102.79 105.24
1897 108.44 111.73 110.58 112.65 113.75 108.64 111.17
1898 113.48 119.34 118.59 120.82 124.70 117.75 121.17
1899 113.72 121.09 118.62 121.92 126.11 117.68 121.82
1900 106.54 112.40 111.04 116.67 119.52 111.13 115.24
1901 114.93 121.89 119.54 124.55 128.03 119.69 123.79
1902 116.76 122.21 119.52 125.36 130.39 123.34 126.82
1903 116.74 123.76 119.56 122.30 128.13 116.99 122.44
1904 111.78 116.79 113.91 117.20 126.38 114.30 120.19
1905 106.23 108.83 106.99 111.32 119.90 107.74 113.66
1906 102.21 105.01 102.28 106.47 113.59 102.64 107.98
1907 94.17 96.43 91.88 95.47 102.58 92.74 97.54
1908 88.03 87.32 86.76 91.23 96.90 87.65 92.16
1909 84.07 85.69 82.45 84.83 91.93 83.72 87.73
1910 83.60 81.96 79.64 79.12 91.74 80.04 85.69
1911 79.33 78.99 76.80 77.58 91.51 79.02 85.04

32
1912 75.02 74.06 70.22 73.00 82.99 69.82 76.12
1913 76.66 73.69 69.55 74.10 88.31 73.25 80.42
1914 79.02 77.16 73.05 76.30 90.65 76.43 83.24
1915 66.38 66.40 64.51 67.63 81.01 66.08 73.17
1916 67.57 65.93 62.05 63.76 75.37 60.43 67.48
1917 60.87 58.83 57.55 62.19 71.78 57.32 64.14
1918 65.97 64.54 62.32 64.44 76.47 61.51 68.58
1919 85.27 82.16 77.83 80.74 94.44 76.87 85.20
1920 100.53 92.98 85.98 85.92 101.60 82.39 91.49
1921 118.41 105.98 98.86 97.29 116.61 90.75 102.87
1922 131.90 123.04 116.45 111.55 130.51 97.92 113.04
Notes: †Real HPIs obtained by deflating the nominal HPIs in Table A1.1 with the Consumer Price Index. Sources: London auction mart data; CPI obtained from BofE Quarterly Bulletin Q4:2010. The hedonic specifications are shown on page 11.
Table A1.3: Annual HPI Level: 1919-1939 (Nominal, 1920=100)
Hedonic
Specification
(1)
Simple Averages
(2)
Semi-Log
Time only
(3)
Semi-log Wards
(4)
Semi-log Full Model
(5)
Chained
Laspeyres
(5)
Chained
Paasche
(5)
Chained
Fisher
1919 83.70 87.30 90.85 89.47 86.33 84.42 85.37
1920 100.00 100.00 100.00 100.00 100.00 100.00 100.00
1921 113.85 115.00 117.20 116.73 113.92 115.40 114.66
1922 122.51 126.33 126.54 122.66 117.70 118.45 118.07
1923 128.55 133.62 135.50 131.83 125.74 130.68 128.19
1924 133.03 139.77 136.79 135.35 129.93 138.77 134.28
1925 149.19 156.04 151.61 144.28 134.62 153.49 143.75
1926 153.39 164.67 163.50 153.69 136.26 156.30 145.94
1927 148.28 159.36 159.69 151.11 134.26 157.97 145.63
1928 151.49 163.22 163.40 154.48 134.14 158.65 145.88
1929 145.70 155.82 158.77 152.92 139.69 158.14 148.63
1930 146.29 158.33 163.07 155.75 140.43 158.83 149.35

33
1931 137.31 148.90 157.98 153.85 140.62 154.82 147.55
1932 135.82 146.16 152.74 148.57 137.59 153.40 145.28
1933 133.79 145.48 149.57 146.30 139.06 153.11 145.91
1934 130.21 140.16 145.77 143.16 133.94 146.62 140.14
1935 130.09 140.99 144.11 143.75 134.32 148.84 141.39
1936 128.81 138.88 145.64 141.58 132.35 146.10 139.05
1937 126.94 137.70 144.07 141.81 133.30 148.59 140.74
1938 137.15 148.21 150.09 149.72 140.10 154.83 147.28
1939 136.51 148.14 148.91 149.66 139.04 157.54 148.00
Sources: CPBS mortgage registers; The hedonic specifications are shown on page 11.
Table A1.4: Annual HPI Level: 1919-1939 (Real, 1920=100)
Hedonic
Specification
(1)
Simple Averages
(2)
Semi-Log
Time only
(3)
Semi-log Wards
(4)
Semi-log Full Model
(5)
Chained
Laspeyres
(5)
Chained
Paasche
(5)
Chained
Fisher
1919 96.59 100.74 104.84 103.25 99.62 97.42 98.52
1920 100.00 100.00 100.00 100.00 100.00 100.00 100.00
1921 124.57 125.82 128.23 127.71 124.64 126.26 125.44
1922 155.86 160.72 160.98 156.05 149.73 150.69 150.21
1923 173.98 180.85 183.39 178.42 170.18 176.87 173.49
1924 181.32 190.50 186.43 184.47 177.09 189.13 183.01
1925 202.73 212.04 206.01 196.05 182.94 208.58 195.34
1926 210.11 225.57 223.97 210.54 186.65 214.10 199.91
1927 208.11 223.66 224.12 212.08 188.44 221.71 204.40
1928 213.26 229.78 230.03 217.47 188.84 223.34 205.36
1929 206.97 221.35 225.54 217.22 198.43 224.64 211.13
1930 213.79 231.40 238.32 227.62 205.23 232.13 218.26
1931 209.68 227.39 241.25 234.95 214.73 236.43 225.32
1932 212.94 229.17 239.47 232.94 215.73 240.51 227.78
1933 214.27 232.98 239.54 234.29 222.70 245.20 233.68

34
1934 208.54 224.47 233.45 229.26 214.51 234.81 224.43
1935 206.90 224.23 229.18 228.61 213.62 236.70 224.87
1936 203.43 219.34 230.02 223.59 209.02 230.73 219.60
1937 193.89 210.32 220.05 216.59 203.60 226.95 214.96
1938 206.18 222.81 225.63 225.08 210.62 232.76 221.41
1939 199.62 216.63 217.77 218.87 203.32 230.38 216.43
Notes: †Real HPI based on full hedonic specification (5) and obtained by deflating the nominal HPI with the Consumer Price Index. Sources: CPBS mortgage registers; CPI obtained from BofE Quarterly Bulletin Q4:2010. The hedonic specifications are shown on page 11.
35
TABLE SERIES A2: RRPIs Table A2.1: Annual RRPI Levels: 1895-1922 (Nominal, 1895=100)
Hedonic
Specification
(1)
Simple Averages
(2)
Semi-Log
Time only
(3)
Semi-log Wards
(4)
Semi-log Full Model
(5)
Chained
Laspeyres
(5)
Chained
Paasche
(5)
Chained
Fisher
1895 100.00 100.00 100.00 100.00 100.00 100.00 100.00
1896 100.11 102.16 101.97 99.56 101.17 100.06 100.61
1897 103.75 105.60 104.31 102.26 103.60 102.15 102.87
1898 103.46 105.68 106.43 103.95 107.54 104.54 106.03
1899 103.05 105.14 106.42 103.94 107.09 103.51 105.29
1900 108.76 109.16 110.11 108.05 111.41 106.13 108.74
1901 110.04 109.64 109.42 106.54 113.11 106.79 109.91
1902 103.99 104.59 106.66 104.97 109.93 102.71 106.26
1903 108.10 108.04 110.74 108.53 115.60 106.96 111.20
1904 104.85 107.15 109.96 107.19 116.04 105.65 110.72
1905 107.66 109.18 110.27 107.67 115.91 105.69 110.68
1906 106.91 109.31 111.68 109.15 118.12 107.32 112.59
1907 105.76 106.86 109.15 106.77 115.80 105.09 110.32
1908 108.48 108.93 110.85 108.35 119.24 107.50 113.22
1909 102.75 106.29 109.39 107.16 116.35 105.74 110.92
1910 102.24 103.47 107.52 105.40 115.30 104.61 109.82
1911 103.72 104.07 107.12 105.02 113.84 103.14 108.36
1912 103.28 105.11 106.16 103.95 113.24 102.14 107.55
1913 102.18 104.76 109.42 107.29 117.67 104.34 110.81
1914 99.74 102.84 109.24 107.29 120.20 104.83 112.25
1915 102.77 104.94 108.03 105.85 117.58 100.05 108.46
1916 101.84 102.61 106.20 105.40 117.73 98.61 107.75
1917 108.00 107.95 113.25 109.82 121.19 100.80 110.52
1918 105.18 108.69 113.41 111.41 120.65 100.34 110.03

36
1919 106.00 108.93 114.01 112.19 122.11 100.96 111.03
1920 109.50 105.42 108.38 108.02 119.34 97.18 107.69
1921 122.60 123.49 126.92 125.32 139.21 111.43 124.55
1922 129.53 125.22 134.95 134.35 148.56 117.65 132.20
Sources: London auction mart data. The hedonic specifications are shown on page 11.
Table A2.2: Annual RRPI Levels: 1895-1922 (Real, 1895=100)
Hedonic
Specification
(1)
Simple Averages
(2)
Semi-Log
Time only
(3)
Semi-log Wards
(4)
Semi-log Full Model
(5)
Chained
Laspeyres
(5)
Chained
Paasche
(5)
Chained
Fisher
1895 100.00 100.00 100.00 100.00 100.00 100.00 100.00
1896 100.41 102.46 102.28 99.85 101.47 100.36 100.91
1897 102.22 104.04 102.77 100.75 102.07 100.64 101.35
1898 103.15 105.36 106.11 103.64 107.22 104.23 105.72
1899 102.33 104.41 105.68 103.22 106.34 102.79 104.55
1900 103.48 103.87 104.77 102.81 106.01 100.98 103.47
1901 109.49 109.09 108.88 106.01 112.55 106.26 109.36
1902 103.99 104.59 106.66 104.97 109.93 102.71 106.26
1903 107.67 107.61 110.30 108.10 115.14 106.53 110.75
1904 105.06 107.36 110.18 107.40 116.27 105.86 110.95
1905 107.23 108.74 109.83 107.24 115.45 105.27 110.24
1906 106.91 109.31 111.68 109.15 118.12 107.32 112.59
1907 104.50 105.60 107.85 105.50 114.43 103.84 109.01
1908 107.94 108.39 110.29 107.81 118.65 106.97 112.66
1909 102.24 105.76 108.84 106.63 115.77 105.21 110.37
1910 101.33 102.54 106.56 104.46 114.27 103.67 108.84
1911 103.62 103.97 107.02 104.92 113.73 103.04 108.25
1912 100.27 102.05 103.07 100.92 109.94 99.17 104.42
1913 102.59 105.18 109.86 107.72 118.14 104.76 111.25
1914 100.04 103.15 109.57 107.61 120.56 105.15 112.59

37
1915 91.35 93.28 96.02 94.09 104.51 88.94 96.41
1916 86.24 86.89 89.92 89.25 99.69 83.50 91.24
1917 86.26 86.22 90.46 87.71 96.80 80.51 88.28
1918 86.21 89.09 92.96 91.32 98.89 82.24 90.18
1919 96.27 98.94 103.56 101.89 110.91 91.70 100.85
1920 94.88 91.35 93.92 93.60 103.42 84.21 93.32
1921 134.14 135.11 138.86 137.12 152.31 121.92 136.27
1922 150.61 145.60 156.92 156.22 172.74 136.80 153.73
Notes: †Real RRPIs obtained by deflating the nominal RRPIs in Table A2.1 with the Consumer Price Index. Sources: London auction mart data; CPI obtained from BofE Quarterly Bulletin Q4:2010. The hedonic specifications are shown on page 11.
Table A2.3: Annual RRPI Levels: 1919-1939 (Nominal, 1920=100)
Hedonic
Specification
(1)
Simple Averages
(2)
Semi-Log
Time only
(3)
Semi-log Wards
(4)
Semi-log Full Model
(5)
Chained
Laspeyres
(5)
Chained
Paasche
(5)
Chained
Fisher
1919 91.61 85.20 91.43 91.87 87.40 79.50 83.36
1920 100.00 100.00 100.00 100.00 100.00 100.00 100.00
1921 105.26 97.31 100.32 99.89 108.34 100.66 104.43
1922 129.08 128.59 133.23 133.12 128.79 108.59 118.26
1923 143.95 159.03 164.69 164.66 159.62 147.71 153.55
1924 150.17 155.25 160.32 160.40 165.30 156.57 160.88
1925 185.63 190.78 193.74 194.92 182.99 194.58 188.70
1926 183.03 202.58 206.02 205.97 183.72 189.16 186.42
1927 185.23 215.18 225.42 225.71 203.32 212.54 207.88
1928 200.24 228.68 235.30 235.42 208.44 217.44 212.90
1929 190.39 217.92 225.93 226.71 214.66 218.42 216.53
1930 188.01 215.34 227.21 228.70 211.55 219.47 215.47
1931 179.91 207.98 224.41 225.57 211.44 214.83 213.13
1932 177.85 203.84 213.95 215.11 202.86 207.94 205.38
1933 171.77 201.06 212.78 214.10 207.08 212.67 209.86

38
1934 160.75 188.16 203.38 204.34 200.40 201.16 200.78
1935 167.53 192.29 202.91 203.90 204.69 200.99 202.83
1936 161.58 189.45 205.61 206.85 203.29 197.26 200.25
1937 163.15 189.48 210.85 212.34 206.64 203.53 205.08
1938 183.26 213.41 225.70 227.64 219.40 215.08 217.23
1939 185.55 217.42 227.18 228.35 222.34 219.13 220.73
Sources: CPBS data. The hedonic specifications are shown on page 11.
Table A2.4: Annual RRPI Levels: 1919-1939 (Real, 1920=100)
Hedonic
Specification
(1)
Simple Averages
(2)
Semi-Log
Time only
(3)
Semi-log Wards
(4)
Semi-log Full Model
(5)
Chained
Laspeyres
(5)
Chained
Paasche
(5)
Chained
Fisher
1919 105.72 98.32 105.51 106.02 100.86 91.74 96.19
1920 100.00 100.00 100.00 100.00 100.00 100.00 100.00
1921 115.16 106.47 109.76 109.28 118.54 110.13 114.26
1922 164.22 163.59 169.49 169.35 163.85 138.15 150.45
1923 194.82 215.23 222.90 222.85 216.03 199.91 207.81
1924 204.67 211.59 218.50 218.61 225.30 213.40 219.27
1925 252.24 259.24 263.27 264.87 248.66 264.41 256.42
1926 250.72 277.51 282.21 282.15 251.66 259.11 255.36
1927 259.97 302.00 316.38 316.79 285.36 298.31 291.76
1928 281.88 321.92 331.24 331.41 293.43 306.10 299.70
1929 270.45 309.55 320.94 322.04 304.93 310.27 307.59
1930 274.76 314.71 332.06 334.23 309.17 320.74 314.90
1931 274.73 317.61 342.69 344.46 322.89 328.07 325.47
1932 278.85 319.59 335.44 337.27 318.05 326.02 322.01
1933 275.09 322.00 340.77 342.89 331.63 340.60 336.09
1934 257.44 301.33 325.71 327.26 320.94 322.15 321.54
1935 266.44 305.82 322.70 324.28 325.53 319.66 322.58
1936 255.18 299.20 324.72 326.68 321.05 311.54 316.26
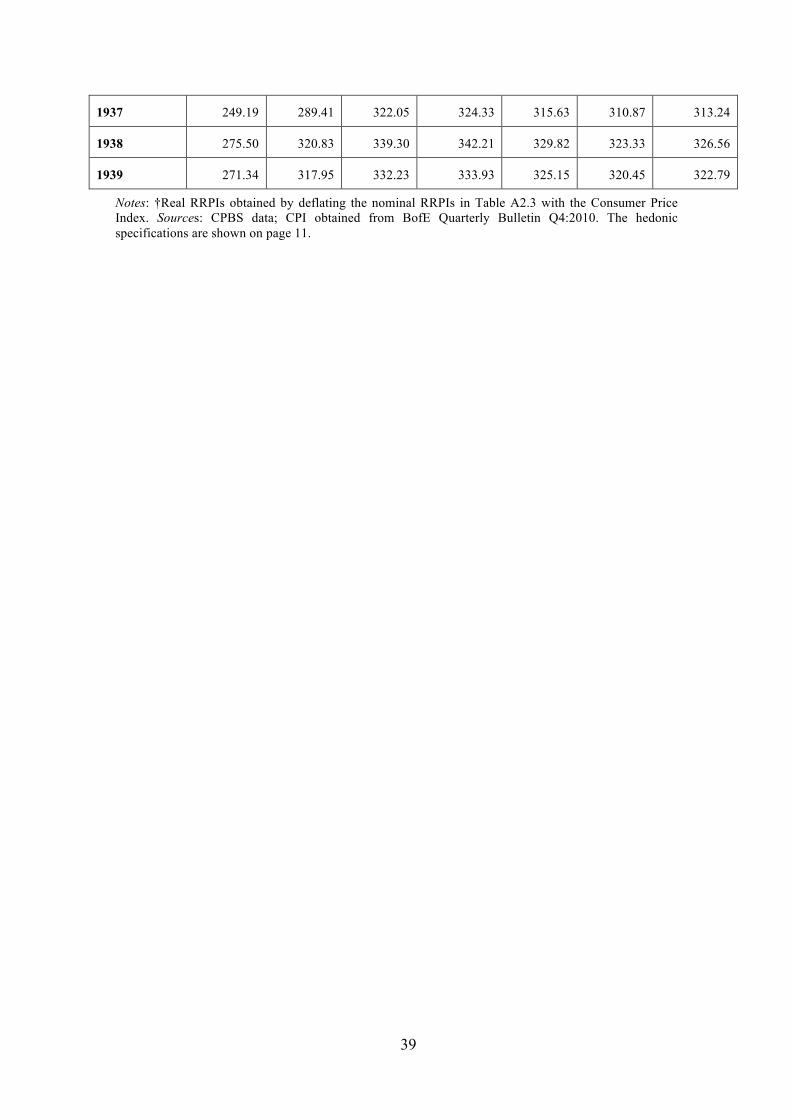
39
1937 249.19 289.41 322.05 324.33 315.63 310.87 313.24
1938 275.50 320.83 339.30 342.21 329.82 323.33 326.56
1939 271.34 317.95 332.23 333.93 325.15 320.45 322.79
Notes: †Real RRPIs obtained by deflating the nominal RRPIs in Table A2.3 with the Consumer Price Index. Sources: CPBS data; CPI obtained from BofE Quarterly Bulletin Q4:2010. The hedonic specifications are shown on page 11.

TA
BL
E SE
RIE
S A3: SU
MM
AR
Y ST
AT
ISTIC
S OF H
OU
SE PR
ICE
S, RE
NT
AL
VA
LU
ES, Y
EA
RS PU
RC
HA
SE A
ND
RE
NT
AL
R
ET
UR
NS
Table A
3.1: House Prices by B
orough (median in £, selected years)
L
ondon Auction M
art data C
PBS data
Borough
1895 1900
1905 1910
1915 1920
1920 1925
1930 1935
1938
Barking
N/A
N
/A
N/A
N
/A
N/A
N
/A
685.00 (1) 621.00 (4)
647.50 (4) 675.00 (1)
365.00 (1)
Barnet
265.00 (2) 400.00 (4)
375.00 (6) N
/A
375.00 (3) 550.00 (17)
925.00 (19) 1085.00 (19)
635.00 (33) 777.50 (38)
437.50 (20)
Bexley
N/A
N
/A
N/A
N
/A
N/A
N
/A
875.00 (3) 620.00 (2)
619.50 (78) 627.50 (44)
975.00 (2)
Brent
275.00 (26) 400.00 (30)
397.00 (35) 250.00 (15)
370.00 (7) 450.00 (89)
800.00 (86) 885.00 (76)
737.50 (42) 775.00 (43)
600.00 (16)
Brom
ley 275.00 (20)
412.50 (6) 225.00 (2)
120.00 (7) 225.00 (5)
417.50 (12) 750.00 (12)
1000.00 (37) 780.00 (28)
745.00 (59) 362.50 (12)
Cam
den 350.00 (137)
365.00 (91) 355.00 (81)
320.00 (32) 250.00 (25)
460.00 (67) 1112.50 (4)
N/A
N
/A
685.00 (4) 700.00 (4)
City of London
360.00 (17) 247.50 (10)
585.00 (10) 482.50 (6)
550.00 (1) 645.00 (15)
N/A
N
/A
N/A
N
/A
N/A
Croydon
N/A
130.00 (1)
N/A
N
/A
N/A
N
/A
822.50 (138) 795.00 (82)
765.00 (26) 737.50 (38)
550.00 (11)
Ealing 380.00 (6)
365.00 (6) 367.50 (10)
415.00 (10) 257.50 (2)
455.00 (13) 900.00 (63)
800.00 (13) 925.00 (2)
675.00 (15) 510.00 (17)
Enfield 525.00 (8)
450.00 (9) 297.50 (6)
395.00 (3) 330.00 (1)
500.00 (24) 550.00 (31)
725.00 (75) 582.50 (34)
715.00 (33) 400.00 (27)
Greenw
ich 285.00 (31)
345.00 (18) 285.00 (23)
255.00 (13) N
/A
487.50 (14) 550.00 (4)
800.00 (8) 650.00 (7)
695.00 (15) 355.00 (5)
Hackney
330.00 (133) 380.00 (141)
335.00 (126) 207.50 (76)
222.50 (34) 247.50 (124)
377.50 (4) 795.00 (3)
N/A
900.00 (1)
625.00 (7)
Ham
mersm
ith and Fulham
362.50 (62) 365.00 (25)
412.50 (54) 316.50 (30)
215.00 (25) 447.50 (72)
675.00 (5) 975.00 (1)
800.00 (3) 700.00 (1)
475.00 (16)
Haringey
290.00 (95) 387.50 (82)
400.00 (77) 305.00 (61)
300.00 (36) 360.00 (139)
760.00 (29) 880.00 (20)
765.00 (5) 770.00 (10)
525.00 (20)
Harrow
N
/A
N/A
N
/A
N/A
N
/A
N/A
950.00 (57)
1055.00 (16) 864.00 (5)
700.00 (25) 1150.00 (3)
Havering
N/A
N
/A
N/A
N
/A
N/A
N
/A
600.00 (15) 667.50 (48)
600.00 (3) 600.00 (6)
400.00 (3)

41
Hillingdon
N/A
N
/A
N/A
N
/A
N/A
N
/A
615.00 (8) 815.00 (84)
525.00 (24) 680.00 (22)
329.00 (4)
Hounslow
520.00 (6)
497.50 (8) 592.50 (6)
435.00 (7) 485.00 (2)
580.00 (4) 1162.50 (6)
600.00 (21) 650.00 (19)
565.00 (56) 250.00 (3)
Islington 340.00 (163)
382.50 (178) 332.50 (162)
210.00 (105) 220.00 (57)
240.00 (108) 1062.50 (2)
N/A
775.00 (2)
N/A
350.00 (3)
Kensington and C
helsea 400.00 (60)
410.00 (63) 475.00 (34)
350.00 (27) 310.00 (18)
400.00 (55) 5000.00 (1)
1200.00 (1) N
/A
N/A
N
/A
Kingston
N/A
N
/A
N/A
N
/A
N/A
N
/A
790.00 (31) 580.00 (8)
600.00 (9) 825.00 (13)
550.00 (16)
Lambeth
400.00 (94) 420.00 (71)
385.00 (94) 260.00 (50)
250.00 (24) 485.00 (82)
750.00 (13) 1060.00 (5)
795.00 (6) 687.50 (8)
650.00 (13)
Lewisham
335.00 (67)
350.00 (79) 350.00 (74)
292.50 (32) 220.00 (23)
310.00 (68) 850.00 (13)
845.00 (22) 815.00 (32)
832.50 (20) 475.00 (13)
Merton
500.00 (6) 675.00 (4)
530.00 (9) 265.00 (5)
500.00 (1) 327.50 (18)
800.00 (23) 900.00 (33)
740.00 (48) 775.00 (40)
400.00 (17)
New
ham
230.00 (37) 335.00 (28)
297.50 (24) 265.00 (29)
255.00 (14) 250.00 (39)
600.00 (14) 597.50 (2)
572.50 (4) 625.00 (8)
367.50 (10)
Redbridge
N/A
850.00 (1)
350.00 (1) N
/A
N/A
752.50 (2)
700.00 (24) 690.00 (90)
695.00 (48) 815.00 (81)
400.00 (37)
Richm
ond upon Thames
425.00 (4) 600.00 (3)
435.00 (6) 485.00 (3)
N/A
585.00 (2)
900.00 (13) 822.50 (14)
700.00 (12) 685.00 (13)
600.00 (15)
Southwark
290.00 (222) 350.00 (112)
320.00 (104) 250.00 (79)
220.00 (31) 282.50 (90)
660.00 (15) 850.00 (6)
975.00 (3) 895.00 (5)
475.00 (3)
Sutton N
/A
N/A
N
/A
N/A
N
/A
N/A
700.00 (9)
625.00 (51) 683.00 (5)
795.00 (23) 550.00 (11)
Tower H
amlets
260.00 (101) 320.00 (119)
315.00 (63) 210.00 (41)
162.50 (18) 200.00 (54)
N/A
N
/A
N/A
625.00 (3)
190.00 (1)
Waltham
Forest 290.00 (19)
277.50 (16) 327.50 (28)
197.50 (24) 295.00 (3)
400.00 (31) 625.00 (25)
696.00 (23) 720.00 (16)
725.00 (60) 462.50 (8)
Wandsw
orth 285.00 (63)
350.00 (67) 360.00 (41)
280.00 (39) 250.00 (11)
435.00 (71) 667.50 (38)
850.00 (12) 700.00 (6)
650.00 (11) 400.00 (19)
Westm
inster 400.00 (137)
450.00 (92) 425.00 (115)
320.00 (53) 285.00 (15)
405.00 (92) N
/A
N/A
N
/A
N/A
850.00 (1)
AL
L B
OR
OU
GH
S
325.00 (1549)
380.00 (1562)
357.50 (1217)
267.50 (758)
390.00 (1534)
370.00 (1346)
450.00 (348)
820.00 (724)
785 (790)
695 (518)
725 (728)
Note: The num
ber in parentheses is the number of observations used to obtain the m
edian. Sources: London auction mart data (1895-1920), C
PBS m
ortgage registers (1920-1938).
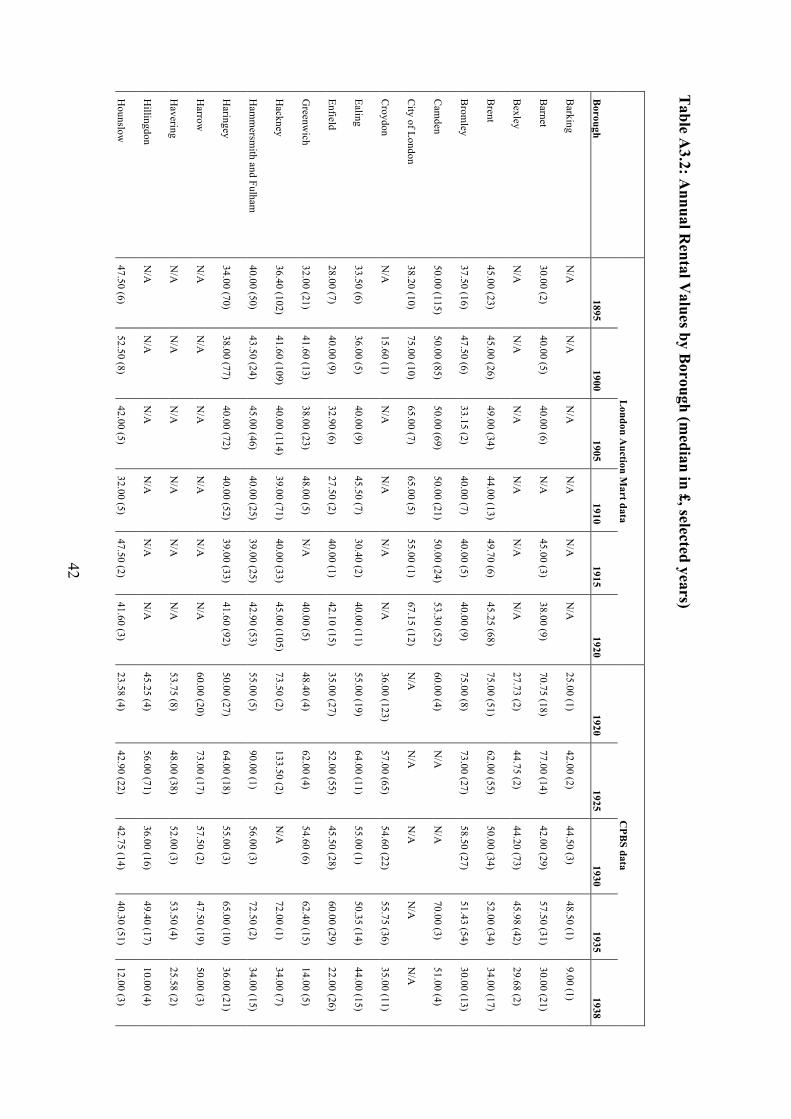
42
Table A
3.2: Annual R
ental Values by B
orough (median in £, selected years)
L
ondon Auction M
art data C
PBS data
Borough
1895 1900
1905 1910
1915 1920
1920 1925
1930 1935
1938
Barking
N/A
N
/A
N/A
N
/A
N/A
N
/A
25.00 (1) 42.00 (2)
44.50 (3) 48.50 (1)
9.00 (1)
Barnet
30.00 (2) 40.00 (5)
40.00 (6) N
/A
45.00 (3) 38.00 (9)
70.75 (18) 77.00 (14)
42.00 (29) 57.50 (31)
30.00 (21)
Bexley
N/A
N
/A
N/A
N
/A
N/A
N
/A
27.73 (2) 44.75 (2)
44.20 (73) 45.98 (42)
29.68 (2)
Brent
45.00 (23) 45.00 (26)
49.00 (34) 44.00 (13)
49.70 (6) 45.25 (68)
75.00 (51) 62.00 (55)
50.00 (34) 52.00 (34)
34.00 (17)
Brom
ley 37.50 (16)
47.50 (6) 33.15 (2)
40.00 (7) 40.00 (5)
40.00 (9) 75.00 (8)
73.00 (27) 58.50 (27)
51.43 (54) 30.00 (13)
Cam
den 50.00 (115)
50.00 (85) 50.00 (69)
50.00 (21) 50.00 (24)
53.30 (52) 60.00 (4)
N/A
N
/A
70.00 (3) 51.00 (4)
City of London
38.20 (10) 75.00 (10)
65.00 (7) 65.00 (5)
55.00 (1) 67.15 (12)
N/A
N
/A
N/A
N
/A
N/A
Croydon
N/A
15.60 (1)
N/A
N
/A
N/A
N
/A
36.00 (123) 57.00 (65)
54.60 (22) 55.75 (36)
35.00 (11)
Ealing 33.50 (6)
36.00 (5) 40.00 (9)
45.50 (7) 30.40 (2)
40.00 (11) 55.00 (19)
64.00 (11) 55.00 (1)
50.35 (14) 44.00 (15)
Enfield 28.00 (7)
40.00 (9) 32.90 (6)
27.50 (2) 40.00 (1)
42.10 (15) 35.00 (27)
52.00 (55) 45.50 (28)
60.00 (29) 22.00 (26)
Greenw
ich 32.00 (21)
41.60 (13) 38.00 (23)
48.00 (5) N
/A
40.00 (5) 48.40 (4)
62.00 (4) 54.60 (6)
62.40 (15) 14.00 (5)
Hackney
36.40 (102) 41.60 (109)
40.00 (114) 39.00 (71)
40.00 (33) 45.00 (105)
73.50 (2) 133.50 (2)
N/A
72.00 (1)
34.00 (7)
Ham
mersm
ith and Fulham
40.00 (50) 43.50 (24)
45.00 (46) 40.00 (25)
39.00 (25) 42.90 (53)
55.00 (5) 90.00 (1)
56.00 (3) 72.50 (2)
34.00 (15)
Haringey
34.00 (70) 38.00 (77)
40.00 (72) 40.00 (52)
39.00 (33) 41.60 (92)
50.00 (27) 64.00 (18)
55.00 (3) 65.00 (10)
36.00 (21)
Harrow
N
/A
N/A
N
/A
N/A
N
/A
N/A
60.00 (20)
73.00 (17) 57.50 (2)
47.50 (19) 50.00 (3)
Havering
N/A
N
/A
N/A
N
/A
N/A
N
/A
53.75 (8) 48.00 (38)
52.00 (3) 53.50 (4)
25.58 (2)
Hillingdon
N/A
N
/A
N/A
N
/A
N/A
N
/A
45.25 (4) 56.00 (71)
36.00 (16) 49.40 (17)
10.00 (4)
Hounslow
47.50 (6)
52.50 (8) 42.00 (5)
32.00 (5) 47.50 (2)
41.60 (3) 23.58 (4)
42.90 (22) 42.75 (14)
40.30 (51) 12.00 (3)

43
Islington 42.00 (127)
45.00 (165) 45.00 (159)
42.00 (93) 45.00 (52)
47.50 (90) 52.50 (2)
N/A
68.50 (2)
N/A
34.00 (3)
Kensington and C
helsea 50.00 (49)
60.00 (57) 57.25 (32)
46.80 (24) 55.00 (15)
53.00 (47) 300.00 (1)
77.00 (1) N
/A
N/A
N
/A
Kingston
N/A
N
/A
N/A
N
/A
N/A
N
/A
52.00 (23) 44.00 (5)
40.30 (7) 61.50 (12)
20.00 (14)
Lambeth
42.00 (69) 44.00 (65)
45.00 (83) 40.95 (36)
42.00 (24) 45.25 (62)
65.00 (14) 85.00 (6)
56.55 (6) 70.53 (6)
42.00 (12)
Lewisham
34.00 (63)
41.00 (66) 36.00 (64)
31.20 (24) 35.10 (23)
36.00 (51) 59.00 (12)
59.00 (17) 57.70 (26)
60.00 (15) 28.80 (12)
Merton
30.00 (6) 60.00 (6)
42.00 (9) 46.00 (3)
39.00 (1) 33.55 (16)
55.00 (21) 68.75 (26)
49.05 (34) 56.00 (35)
27.00 (18)
New
ham
28.60 (31) 36.40 (19)
32.50 (24) 29.95 (28)
32.45 (14) 32.75 (32)
38.50 (16) 46.00 (2)
44.10 (4) 48.00 (7)
17.65 (10)
Redbridge
N/A
50.00 (1)
38.00 (1) N
/A
N/A
55.00 (1)
42.00 (24) 49.00 (74)
50.00 (41) 60.00 (61)
30.80 (37)
Richm
ond upon Thames
45.00 (3) 80.00 (3)
53.50 (6) 40.00 (3)
N/A
43.00 (2)
54.00 (12) 70.50 (10)
48.10 (10) 58.00 (11)
32.18 (15)
Southwark
34.00 (186) 38.00 (91)
38.00 (94) 36.40 (62)
41.60 (27) 39.87 (75)
70.00 (16) 74.00 (5)
84.50 (3) 79.30 (5)
26.00 (4)
Sutton N
/A
N/A
N
/A
N/A
N
/A
N/A
48.00 (8)
47.00 (44) 53.30 (4)
58.50 (24) 30.00 (10)
Tower H
amlets
32.00 (81) 36.20 (60)
34.50 (62) 33.80 (36)
32.25 (18) 36.80 (49)
N/A
N
/A
N/A
48.00 (3)
26.00 (1)
Waltham
Forest 28.00 (18)
37.00 (10) 32.50 (25)
28.00 (19) 30.50 (2)
30.00 (19) 40.00 (24)
49.50 (20) 51.00 (13)
48.00 (45) 33.00 (8)
Wandsw
orth 34.00 (55)
37.85 (54) 38.00 (39)
39.00 (34) 36.00 (13)
37.85 (50) 55.00 (38)
66.50 (12) 52.00 (5)
65.00 (9) 35.00 (19)
Westm
inster 55.00 (109)
75.00 (127) 65.00 (105)
62.50 (42) 72.80 (15)
60.00 (72) N
/A
N/A
N
/A
N/A
55.00 (1)
AL
L B
OR
OU
GH
S
39.00 (1549)
45.00 (1562)
42.00 (1214)
40.00 (758)
41.60 (396)
43.77 (1346)
32.00 (348)
52.00 (724)
55.00 (790)
48.50 (518)
54.25 (728)
Note: The num
ber in parentheses is the number of observations used to obtain the m
edian. Sources: London auction mart data (1895-1920), C
PBS m
ortgage registers (1920-1938).
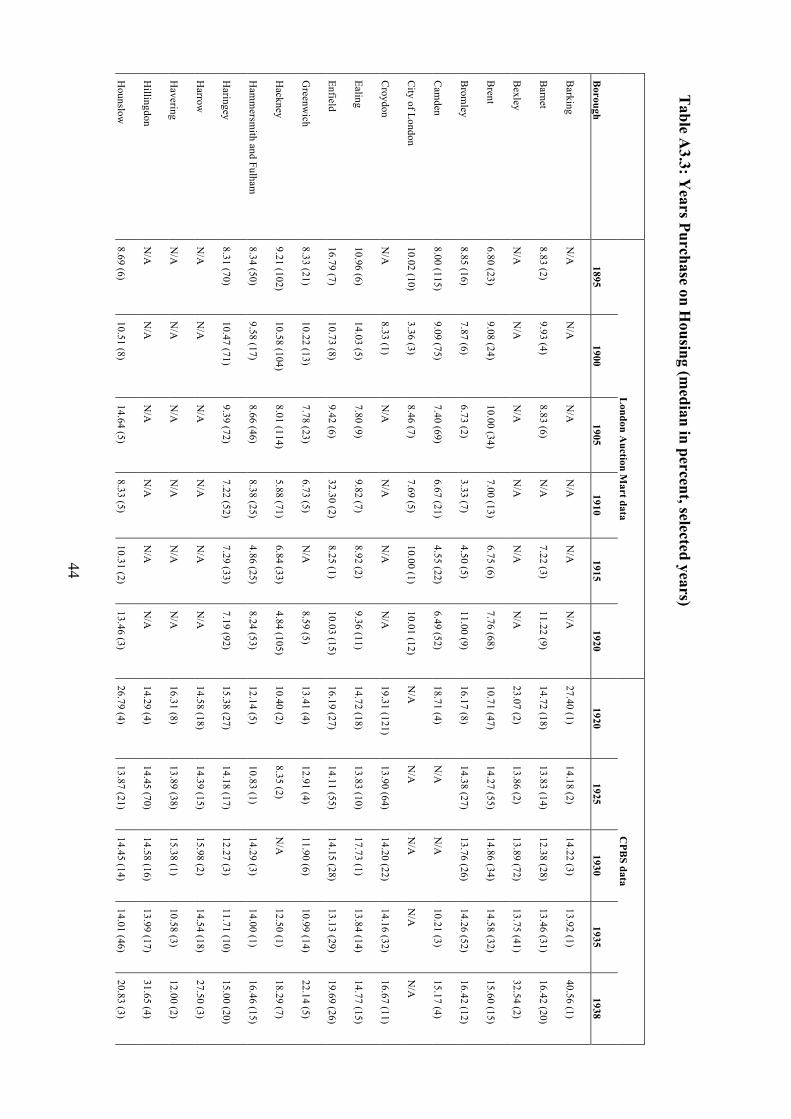
44
Table A
3.3: Years Purchase on H
ousing (median in percent, selected years)
L
ondon Auction M
art data C
PBS data
Borough
1895 1900
1905 1910
1915 1920
1920 1925
1930 1935
1938
Barking
N/A
N
/A
N/A
N
/A
N/A
N
/A
27.40 (1) 14.18 (2)
14.22 (3) 13.92 (1)
40.56 (1)
Barnet
8.83 (2) 9.93 (4)
8.83 (6) N
/A
7.22 (3) 11.22 (9)
14.72 (18) 13.83 (14)
12.38 (28) 13.46 (31)
16.42 (20)
Bexley
N/A
N
/A
N/A
N
/A
N/A
N
/A
23.07 (2) 13.86 (2)
13.89 (72) 13.75 (41)
32.54 (2)
Brent
6.80 (23) 9.08 (24)
10.00 (34) 7.00 (13)
6.75 (6) 7.76 (68)
10.71 (47) 14.27 (55)
14.86 (34) 14.58 (32)
15.60 (15)
Brom
ley 8.85 (16)
7.87 (6) 6.73 (2)
3.33 (7) 4.50 (5)
11.00 (9) 16.17 (8)
14.38 (27) 13.76 (26)
14.26 (52) 16.42 (12)
Cam
den 8.00 (115)
9.09 (75) 7.40 (69)
6.67 (21) 4.55 (22)
6.49 (52) 18.71 (4)
N/A
N
/A
10.21 (3) 15.17 (4)
City of London
10.02 (10) 3.36 (3)
8.46 (7) 7.69 (5)
10.00 (1) 10.01 (12)
N/A
N
/A
N/A
N
/A
N/A
Croydon
N/A
8.33 (1)
N/A
N
/A
N/A
N
/A
19.31 (121) 13.90 (64)
14.20 (22) 14.16 (32)
16.67 (11)
Ealing 10.96 (6)
14.03 (5) 7.80 (9)
9.82 (7) 8.92 (2)
9.36 (11) 14.72 (18)
13.83 (10) 17.73 (1)
13.84 (14) 14.77 (15)
Enfield 16.79 (7)
10.73 (8) 9.42 (6)
32.30 (2) 8.25 (1)
10.03 (15) 16.19 (27)
14.11 (55) 14.15 (28)
13.13 (29) 19.69 (26)
Greenw
ich 8.33 (21)
10.22 (13) 7.78 (23)
6.73 (5) N
/A
8.59 (5) 13.41 (4)
12.91 (4) 11.90 (6)
10.99 (14) 22.14 (5)
Hackney
9.21 (102) 10.58 (104)
8.01 (114) 5.88 (71)
6.84 (33) 4.84 (105)
10.40 (2) 8.35 (2)
N/A
12.50 (1)
18.29 (7)
Ham
mersm
ith and Fulham
8.34 (50) 9.58 (17)
8.66 (46) 8.38 (25)
4.86 (25) 8.24 (53)
12.14 (5) 10.83 (1)
14.29 (3) 14.00 (1)
16.46 (15)
Haringey
8.31 (70) 10.47 (71)
9.39 (72) 7.22 (52)
7.29 (33) 7.19 (92)
15.38 (27) 14.18 (17)
12.27 (3) 11.71 (10)
15.00 (20)
Harrow
N
/A
N/A
N
/A
N/A
N
/A
N/A
14.58 (18)
14.39 (15) 15.98 (2)
14.54 (18) 27.50 (3)
Havering
N/A
N
/A
N/A
N
/A
N/A
N
/A
16.31 (8) 13.89 (38)
15.38 (1) 10.58 (3)
12.00 (2)
Hillingdon
N/A
N
/A
N/A
N
/A
N/A
N
/A
14.29 (4) 14.45 (70)
14.58 (16) 13.99 (17)
31.65 (4)
Hounslow
8.69 (6)
10.51 (8) 14.64 (5)
8.33 (5) 10.31 (2)
13.46 (3) 26.79 (4)
13.87 (21) 14.45 (14)
14.01 (46) 20.83 (3)
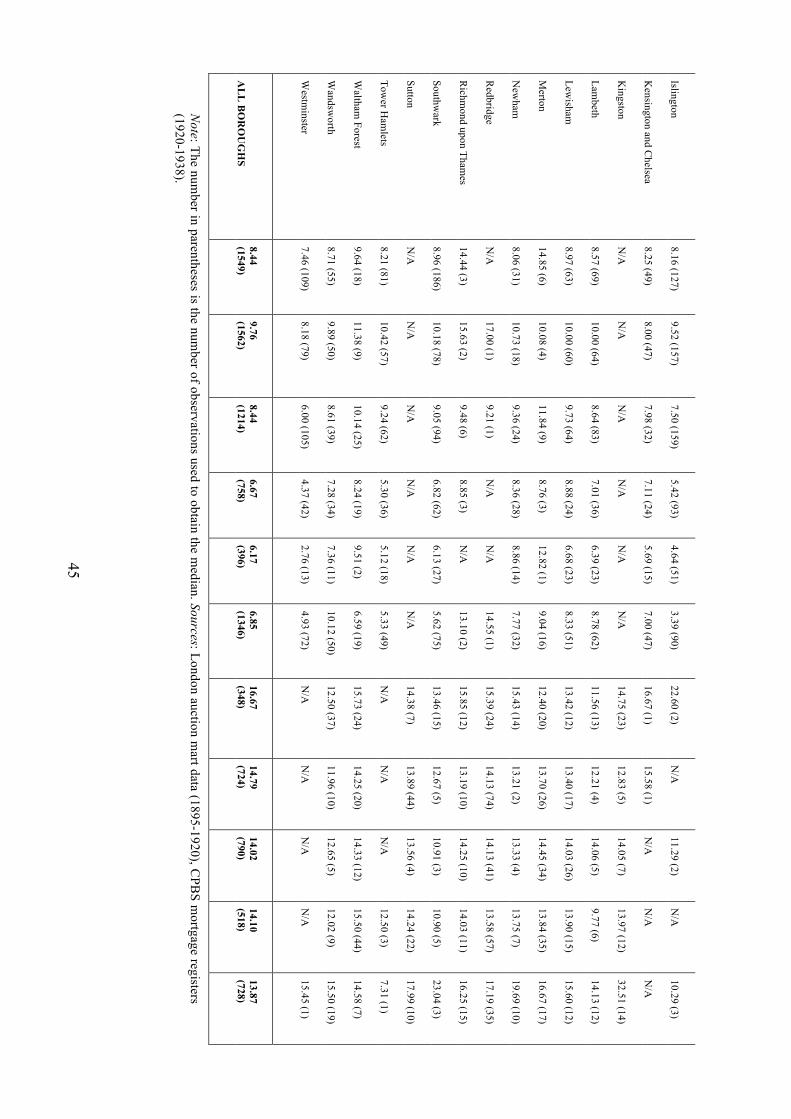
45
Islington 8.16 (127)
9.52 (157) 7.50 (159)
5.42 (93) 4.64 (51)
3.39 (90) 22.60 (2)
N/A
11.29 (2)
N/A
10.29 (3)
Kensington and C
helsea 8.25 (49)
8.00 (47) 7.98 (32)
7.11 (24) 5.69 (15)
7.00 (47) 16.67 (1)
15.58 (1) N
/A
N/A
N
/A
Kingston
N/A
N
/A
N/A
N
/A
N/A
N
/A
14.75 (23) 12.83 (5)
14.05 (7) 13.97 (12)
32.51 (14)
Lambeth
8.57 (69) 10.00 (64)
8.64 (83) 7.01 (36)
6.39 (23) 8.78 (62)
11.56 (13) 12.21 (4)
14.06 (5) 9.77 (6)
14.13 (12)
Lewisham
8.97 (63)
10.00 (60) 9.73 (64)
8.88 (24) 6.68 (23)
8.33 (51) 13.42 (12)
13.40 (17) 14.03 (26)
13.90 (15) 15.60 (12)
Merton
14.85 (6) 10.08 (4)
11.84 (9) 8.76 (3)
12.82 (1) 9.04 (16)
12.40 (20) 13.70 (26)
14.45 (34) 13.84 (35)
16.67 (17)
New
ham
8.06 (31) 10.73 (18)
9.36 (24) 8.36 (28)
8.86 (14) 7.77 (32)
15.43 (14) 13.21 (2)
13.33 (4) 13.75 (7)
19.69 (10)
Redbridge
N/A
17.00 (1)
9.21 (1) N
/A
N/A
14.55 (1)
15.39 (24) 14.13 (74)
14.13 (41) 13.58 (57)
17.19 (35)
Richm
ond upon Thames
14.44 (3) 15.63 (2)
9.48 (6) 8.85 (3)
N/A
13.10 (2)
15.85 (12) 13.19 (10)
14.25 (10) 14.03 (11)
16.25 (15)
Southwark
8.96 (186) 10.18 (78)
9.05 (94) 6.82 (62)
6.13 (27) 5.62 (75)
13.46 (15) 12.67 (5)
10.91 (3) 10.90 (5)
23.04 (3)
Sutton N
/A
N/A
N
/A
N/A
N
/A
N/A
14.38 (7)
13.89 (44) 13.56 (4)
14.24 (22) 17.99 (10)
Tower H
amlets
8.21 (81) 10.42 (57)
9.24 (62) 5.30 (36)
5.12 (18) 5.33 (49)
N/A
N
/A
N/A
12.50 (3)
7.31 (1)
Waltham
Forest 9.64 (18)
11.38 (9) 10.14 (25)
8.24 (19) 9.51 (2)
6.59 (19) 15.73 (24)
14.25 (20) 14.33 (12)
15.50 (44) 14.58 (7)
Wandsw
orth 8.71 (55)
9.89 (50) 8.61 (39)
7.28 (34) 7.36 (11)
10.12 (50) 12.50 (37)
11.96 (10) 12.65 (5)
12.02 (9) 15.50 (19)
Westm
inster 7.46 (109)
8.18 (79) 6.00 (105)
4.37 (42) 2.76 (13)
4.93 (72) N
/A
N/A
N
/A
N/A
15.45 (1)
AL
L B
OR
OU
GH
S
8.44 (1549)
9.76 (1562)
8.44 (1214)
6.67 (758)
6.17 (396)
6.85 (1346)
16.67 (348)
14.79 (724)
14.02 (790)
14.10 (518)
13.87 (728)
Note: The num
ber in parentheses is the number of observations used to obtain the m
edian. Sources: London auction mart data (1895-1920), C
PBS m
ortgage registers (1920-1938).

46
Table A
3.4: Rental R
eturn by Borough (m
edian of ratio, selected years)
L
ondon Auction M
art data C
PBS data
Borough
1895 1900
1905 1910
1915 1920
1920 1925
1930 1935
1938
Barking
N/A
N
/A
N/A
N
/A
N/A
N
/A
3.65 (1) 7.05 (2)
7.03 (3) 7.19 (1)
2.47 (1)
Barnet
11.34 (2) 10.07 (4)
11.62 (6) N
/A
13.85 (3) 8.91 (9)
6.79 (18) 7.23 (14)
8.08 (28) 7.43 (31)
6.09 (20)
Bexley
N/A
N
/A
N/A
N
/A
N/A
N
/A
4.35 (2) 7.22 (2)
7.20 (72) 7.27 (41)
3.07 (2)
Brent
14.71 (23) 11.01 (24)
10.00 (34) 14.29 (13)
14.81 (6) 12.90 (68)
9.33 (47) 7.01 (55)
6.73 (34) 6.86 (32)
6.41 (15)
Brom
ley 11.31 (16)
12.72 (6) 18.20 (2)
30.00 (7) 22.22 (5)
9.09 (9) 6.19 (8)
6.96 (27) 7.27 (26)
7.01 (52) 6.18 (12)
Cam
den 12.50 (115)
11.00 (75) 13.52 (69)
15.00 (21) 22.00 (22)
15.43 (52) 5.52 (4)
N/A
N
/A
9.79 (3) 6.69 (4)
City of London
10.11 (10) 29.73 (3)
11.82 (7) 13.00 (5)
10.00 (1) 9.99 (12)
N/A
N
/A
N/A
N
/A
N/A
Croydon
N/A
12.00 (1)
N/A
N
/A
N/A
N
/A
5.18 (121) 7.19 (64)
7.04 (22) 7.06 (32)
6.00 (11)
Ealing 9.13 (6)
7.13 (5) 12.83 (9)
10.19 (7) 11.50 (2)
10.69 (11) 6.79 (18)
7.23 (10) 5.64 (1)
7.23 (14) 6.77 (15)
Enfield 5.96 (7)
9.37 (8) 10.65 (6)
6.71 (2) 12.12 (1)
9.97 (15) 6.18 (27)
7.09 (55) 7.07 (28)
7.62 (29) 5.09 (26)
Greenw
ich 12.00 (21)
9.78 (13) 12.86 (23)
14.86 (5) N
/A
11.64 (5) 7.47 (4)
7.76 (4) 8.40 (6)
9.10 (14) 4.52 (5)
Hackney
10.85 (102) 9.45 (104)
12.48 (114) 17.00 (71)
14.62 (33) 20.65 (105)
9.62 (2) 12.41 (2)
N/A
8.00 (1)
5.47 (7)
Ham
mersm
ith and Fulham
11.98 (50) 10.43 (17)
11.55 (46) 11.93 (25)
20.59 (25) 12.13 (53)
8.24 (5) 9.23 (1)
7.00 (3) 7.14 (1)
6.08 (15)
Haringey
12.03 (70) 9.55 (71)
10.65 (72) 13.85 (52)
13.71 (33) 13.91 (92)
6.50 (27) 7.05 (17)
8.15 (3) 8.66 (10)
6.67 (20)
Harrow
N
/A
N/A
N
/A
N/A
N
/A
N/A
6.86 (18)
6.95 (15) 6.26 (2)
6.88 (18) 3.64 (3)
Havering
N/A
N
/A
N/A
N
/A
N/A
N
/A
6.15 (8) 7.20 (38)
6.50 (1) 9.45 (3)
8.65 (2)
Hillingdon
N/A
N
/A
N/A
N
/A
N/A
N
/A
7.00 (4) 6.92 (70)
6.86 (16) 7.15 (17)
3.17 (4)
Hounslow
11.52 (6)
9.52 (8) 6.83 (5)
12.00 (5) 10.04 (2)
7.43 (3) 3.73 (4)
7.21 (21) 6.92 (14)
7.14 (46) 4.80 (3)

47
Islington 12.26 (127)
10.50 (157) 13.33 (159)
18.46 (93) 21.57 (51)
29.49 (90) 5.48 (2)
N/A
8.88 (2)
N/A
9.71 (3)
Kensington and C
hels 12.12 (49)
12.50 (47) 12.54 (32)
14.07 (24) 17.58 (15)
14.29 (47) 6.00 (1)
6.42 (1) N
/A
N/A
N
/A
Kingston
N/A
N
/A
N/A
N
/A
N/A
N
/A
6.78 (23) 7.79 (5)
7.12 (7) 7.16 (12)
3.22 (14)
Lambeth
11.67 (69) 10.00 (64)
11.58 (83) 14.26 (36)
15.65 (23) 11.40 (62)
8.65 (13) 8.19 (4)
7.11 (5) 10.26 (6)
7.08 (12)
Lewisham
11.15 (63)
10.00 (60) 10.27 (64)
11.27 (24) 14.97 (23)
12.00 (51) 7.45 (12)
7.46 (17) 7.13 (26)
7.20 (15) 6.55 (12)
Merton
6.73 (6) 9.97 (4)
8.44 (9) 11.41 (3)
7.80 (1) 11.11 (16)
8.06 (20) 7.30 (26)
6.92 (34) 7.23 (35)
6.00 (17)
New
ham
12.41 (31) 9.32 (18)
10.68 (24) 11.96 (28)
11.29 (14) 12.88 (32)
6.50 (14) 7.69 (2)
7.53 (4) 7.27 (7)
5.13 (10)
Redbridge
N/A
5.88 (1)
10.86 (1) N
/A
N/A
6.88 (1)
6.50 (24) 7.08 (74)
7.07 (41) 7.36 (57)
5.82 (35)
Richm
ond upon Thames
6.92 (3) 6.94 (2)
10.60 (6) 11.30 (3)
N/A
8.09 (2)
6.35 (12) 7.58 (10)
7.02 (10) 7.13 (11)
6.15 (15)
Southwark
11.16 (186) 9.82 (78)
11.05 (94) 14.66 (62)
16.31 (27) 17.79 (75)
7.43 (15) 7.89 (5)
9.17 (3) 9.18 (5)
4.34 (3)
Sutton N
/A
N/A
N
/A
N/A
N
/A
N/A
6.96 (7)
7.20 (44) 7.38 (4)
7.03 (22) 5.57 (10)
Tower H
amlets
12.17 (81) 9.60 (57)
10.82 (62) 18.87 (36)
19.55 (18) 18.77 (49)
N/A
N
/A
N/A
8.00 (3)
13.68 (1)
Waltham
Forest 10.38 (18)
8.79 (9) 9.86 (25)
12.13 (19) 10.68 (2)
15.18 (19) 6.36 (24)
7.02 (20) 6.98 (12)
6.45 (44) 6.86 (7)
Wandsw
orth 11.48 (55)
10.11 (50) 11.61 (39)
13.74 (34) 13.58 (11)
9.88 (50) 8.00 (37)
8.36 (10) 7.90 (5)
8.32 (9) 6.45 (19)
Westm
inster 13.40 (109)
12.22 (79) 16.67 (105)
22.87 (42) 36.19 (13)
20.28 (72) N
/A
N/A
N
/A
N/A
6.47 (1)
AL
L B
OR
OU
GH
S
11.84 (1549)
10.24 (1562)
11.84 (1214)
15.00 (758)
16.22 (396)
14.60 (1346)
6.00 (348)
6.76 (724)
7.13 (790)
7.09 (518)
7.21 (728)
Note: The num
ber in parentheses is the number of observations used to obtain the m
edian. Sources: London auction mart data (1895-1920), C
PBS m
ortgage registers (1920-1938).

TABLE SERIES A4: REGRESSION RESULTS
Table A4.1: Hedonics Regression of House Prices using London Auction mart data The following table presents the estimated coefficients for the hedonics regressions used to derive the indices by the time series dummy approach. The regression coefficients estimated for the imputation approach are not provided as they are too numerous to report.
Dependent Variable value lvalue lvalue Lvalue
Model Specification (1) (2) (3) (4)
d_1896 5.3218 0.0249 0.0321 0.0576
d_1897 36.8920 0.1258 0.1155 0.1410
d_1898 50.6209 0.1793 0.1735 0.2029
d_1899 53.1781 0.1984 0.1777 0.2041
d_1900 43.8853 0.1667 0.1545 0.2146
d_1901 56.8086 0.2030 0.1834 0.2216
d_1902 61.3903 0.2006 0.1783 0.2283
d_1903 63.0295 0.2172 0.1826 0.2114
d_1904 42.3267 0.1532 0.1282 0.1532
d_1905 24.3948 0.0886 0.0716 0.0968
d_1906 8.0944 0.0489 0.0226 0.0495
d_1907 -17.2344 -0.0244 -0.0728 -0.0543
d_1908 -42.2498 -0.1307 -0.1371 -0.1331
d_1909 -56.8391 -0.1494 -0.1880 -0.1833
d_1910 -57.3348 -0.1900 -0.2188 -0.2503
d_1911 -75.4561 -0.2348 -0.2630 -0.2803
d_1912 -83.2938 -0.2707 -0.3240 -0.3182
d_1913 -86.6367 -0.3094 -0.3671 -0.3520
d_1914 -77.7248 -0.2623 -0.3171 -0.2926
d_1915 -92.7668 -0.2917 -0.3205 -0.3160
d_1916 -74.0197 -0.2501 -0.3109 -0.3220
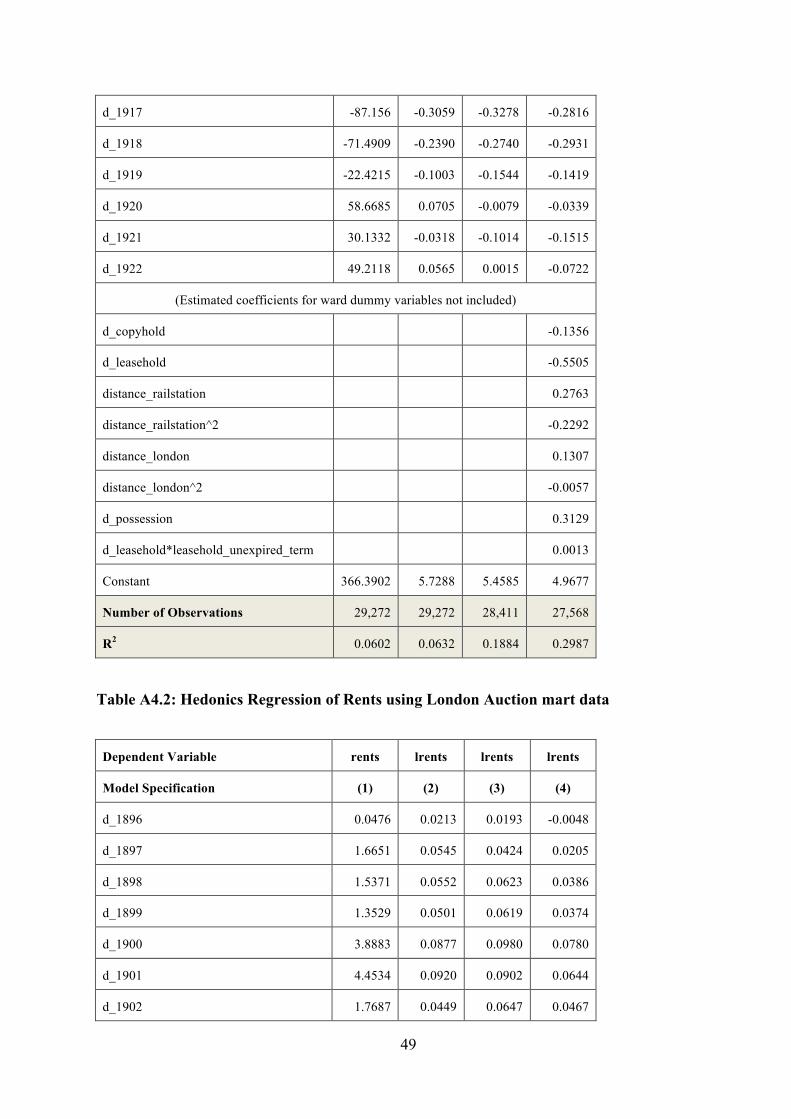
49
d_1917 -87.156 -0.3059 -0.3278 -0.2816
d_1918 -71.4909 -0.2390 -0.2740 -0.2931
d_1919 -22.4215 -0.1003 -0.1544 -0.1419
d_1920 58.6685 0.0705 -0.0079 -0.0339
d_1921 30.1332 -0.0318 -0.1014 -0.1515
d_1922 49.2118 0.0565 0.0015 -0.0722
(Estimated coefficients for ward dummy variables not included)
d_copyhold
-0.1356
d_leasehold
-0.5505
distance_railstation
0.2763
distance_railstation^2
-0.2292
distance_london
0.1307
distance_london^2
-0.0057
d_possession
0.3129
d_leasehold*leasehold_unexpired_term
0.0013
Constant 366.3902 5.7288 5.4585 4.9677
Number of Observations 29,272 29,272 28,411 27,568
R2 0.0602 0.0632 0.1884 0.2987
Table A4.2: Hedonics Regression of Rents using London Auction mart data
Dependent Variable rents lrents lrents lrents
Model Specification (1) (2) (3) (4)
d_1896 0.0476 0.0213 0.0193 -0.0048
d_1897 1.6651 0.0545 0.0424 0.0205
d_1898 1.5371 0.0552 0.0623 0.0386
d_1899 1.3529 0.0501 0.0619 0.0374
d_1900 3.8883 0.0877 0.0980 0.0780
d_1901 4.4534 0.0920 0.0902 0.0644
d_1902 1.7687 0.0449 0.0647 0.0467

50
d_1903 3.5948 0.0773 0.1021 0.0814
d_1904 2.1529 0.0690 0.0950 0.0710
d_1905 3.3976 0.0878 0.0977 0.0747
d_1906 3.0677 0.0890 0.1106 0.0869
d_1907 2.5541 0.0664 0.0875 0.0661
d_1908 3.7613 0.0855 0.1032 0.0816
d_1909 1.2194 0.0610 0.0895 0.0702
d_1910 0.9959 0.0341 0.0724 0.0522
d_1911 1.6518 0.0399 0.0687 0.0487
d_1912 1.4564 0.0499 0.0600 0.0401
d_1913 0.9681 0.0465 0.0903 0.0715
d_1914 -0.1171 0.0280 0.0880 0.0699
d_1915 1.2273 0.0482 0.0773 0.0569
d_1916 0.8181 0.0258 0.0601 0.0410
d_1917 3.5503 0.0765 0.1242 0.0935
d_1918 2.2966 0.0833 0.1256 0.1082
d_1919 2.6609 0.0856 0.1364 0.1164
d_1920 4.2141 0.0528 0.0802 0.0772
d_1921 10.0288 0.2110 0.2381 0.2272
d_1922 13.1022 0.2249 0.3009 0.2957
(Estimated coefficients for ward dummy variables not included)
d_copyhold
-0.1699
d_leasehold
0.0685
distance_railstation
0.0931
distance_railstation^2
-0.0783
distance_london
-0.0427
distance_london^2
-0.0034
d_possession
-0.3585
d_leasehold*leasehold_unexpired_term
-0.0001
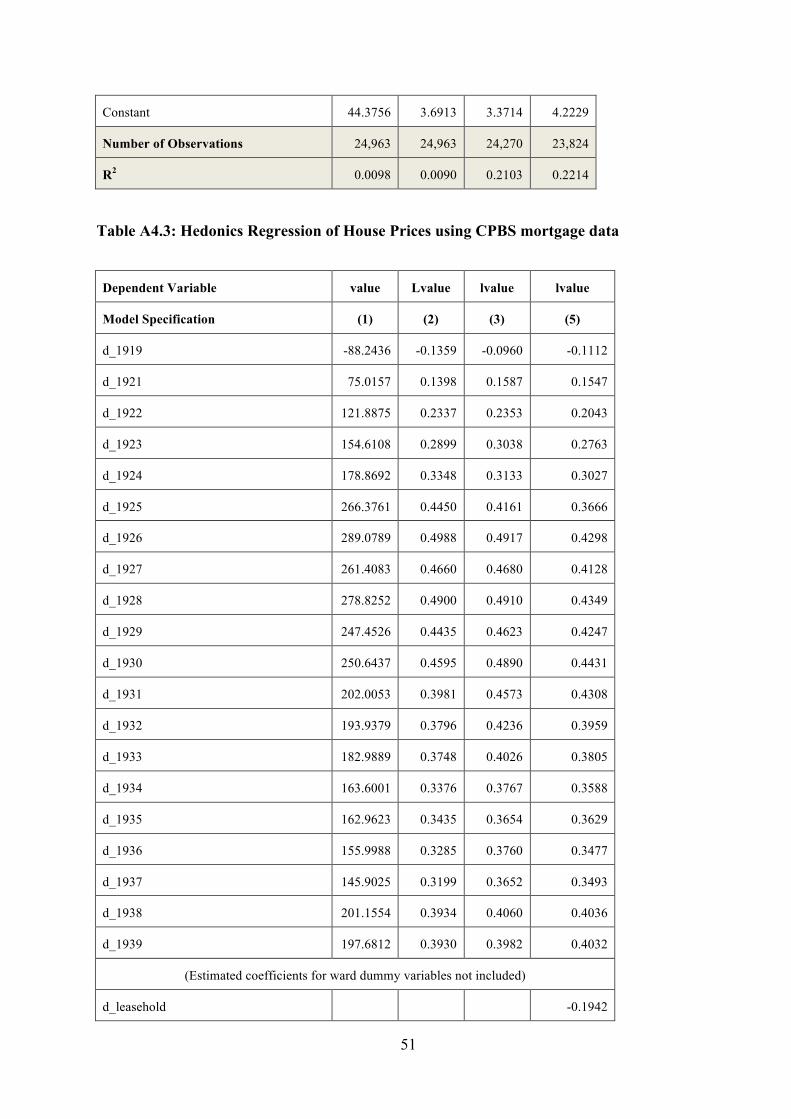
51
Constant 44.3756 3.6913 3.3714 4.2229
Number of Observations 24,963 24,963 24,270 23,824
R2 0.0098 0.0090 0.2103 0.2214
Table A4.3: Hedonics Regression of House Prices using CPBS mortgage data
Dependent Variable value Lvalue lvalue lvalue
Model Specification (1) (2) (3) (5)
d_1919 -88.2436 -0.1359 -0.0960 -0.1112
d_1921 75.0157 0.1398 0.1587 0.1547
d_1922 121.8875 0.2337 0.2353 0.2043
d_1923 154.6108 0.2899 0.3038 0.2763
d_1924 178.8692 0.3348 0.3133 0.3027
d_1925 266.3761 0.4450 0.4161 0.3666
d_1926 289.0789 0.4988 0.4917 0.4298
d_1927 261.4083 0.4660 0.4680 0.4128
d_1928 278.8252 0.4900 0.4910 0.4349
d_1929 247.4526 0.4435 0.4623 0.4247
d_1930 250.6437 0.4595 0.4890 0.4431
d_1931 202.0053 0.3981 0.4573 0.4308
d_1932 193.9379 0.3796 0.4236 0.3959
d_1933 182.9889 0.3748 0.4026 0.3805
d_1934 163.6001 0.3376 0.3767 0.3588
d_1935 162.9623 0.3435 0.3654 0.3629
d_1936 155.9988 0.3285 0.3760 0.3477
d_1937 145.9025 0.3199 0.3652 0.3493
d_1938 201.1554 0.3934 0.4060 0.4036
d_1939 197.6812 0.3930 0.3982 0.4032
(Estimated coefficients for ward dummy variables not included)
d_leasehold
-0.1942

52
distance_hq
-0.0454
distance_hq^2
0.0010
n_rooms
0.0673
frontage
-0.0011
property_area
0.0002
property_area^2
-1.28E-08
Constant 541.4936 6.1837 6.1137 5.9909
Number of Observations 9,323 9,323 9,323 9,306
R2 0.0933 0.1268 0.3748 0.5135
Table A4.4: Hedonics Regression of Rents using CPBS mortgage data
Dependent Variable rents lrents lrents lrents
Model Specification (1) (2) (3) (4)
d_1919 -2.5889 -0.1602 -0.0896 -0.1249
d_1921 1.6216 -0.0272 0.0032 -0.0023
d_1922 8.9711 0.2514 0.2869 0.2530
d_1923 13.5559 0.4639 0.4989 0.4949
d_1924 15.4738 0.4399 0.4720 0.4898
d_1925 26.4123 0.6460 0.6614 0.6362
d_1926 25.6120 0.7060 0.7228 0.7034
d_1927 26.2893 0.7663 0.8128 0.8212
d_1928 30.9185 0.8272 0.8557 0.8556
d_1929 27.8801 0.7789 0.8151 0.8537
d_1930 27.1465 0.7671 0.8207 0.8582
d_1931 24.6471 0.7323 0.8083 0.8633
d_1932 24.0138 0.7122 0.7606 0.8189
d_1933 22.1373 0.6984 0.7551 0.8272
d_1934 18.7391 0.6321 0.7099 0.7876
d_1935 20.8303 0.6538 0.7076 0.7945
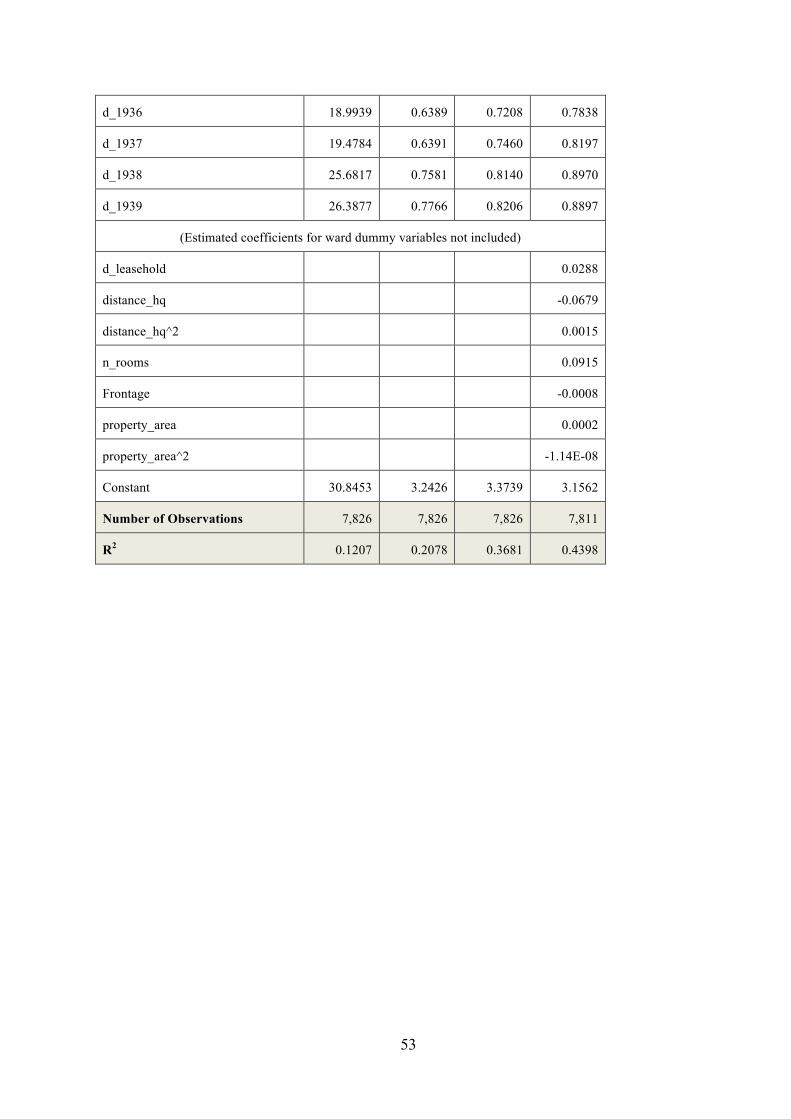
53
d_1936 18.9939 0.6389 0.7208 0.7838
d_1937 19.4784 0.6391 0.7460 0.8197
d_1938 25.6817 0.7581 0.8140 0.8970
d_1939 26.3877 0.7766 0.8206 0.8897
(Estimated coefficients for ward dummy variables not included)
d_leasehold
0.0288
distance_hq
-0.0679
distance_hq^2
0.0015
n_rooms
0.0915
Frontage
-0.0008
property_area
0.0002
property_area^2
-1.14E-08
Constant 30.8453 3.2426 3.3739 3.1562
Number of Observations 7,826 7,826 7,826 7,811
R2 0.1207 0.2078 0.3681 0.4398

54
UNIVERSITY OF OXFORD DISCUSSION PAPERS IN ECONOMIC AND SOCIAL HISTORY
are edited by
Rui Esteves (Brasenose College, Oxford, OX1 4AJ) Arthur Downing (All Souls College, Oxford, OX1 4AL)
Papers may be downloaded from http://www.economics.ox.ac.uk/index.php/working-papers/oxford-
economic-and-social-history-working-papers