Indicators of Environment and Sustainable Development — Theories
66
ENVIRONMENTAL ECONOMICS SERIES Indicators of Environment and Sustainable Development Theories and Practical Experience PAPER NO. 89 Lisa Segnestam December 2002
Transcript of Indicators of Environment and Sustainable Development — Theories

E N V I R O N M E N TA L E C O N O M I C S S E R I E S
Indicators ofEnvironmentand SustainableDevelopment
Theories andPractical Experience
PAPER NO. 89
Lisa Segnestam
December 2002

Papers in this series are not formal publications of the World Bank. They are circulated to encourage thought and discussion. The useand citation of this paper should take this into account. The views expressed are those of the authors and should not be attributed tothe World Bank. Copies are available from the Environment Department, The World Bank, Room MC-5-126.
Indicators ofEnvironment andSustainable DevelopmentTheories andPractical Experience
Lisa Segnestam
December 2002
THE WORLD BANK ENVIRONMENT DEPARTMENT

The International Bank for Reconstructionand Development/THE WORLD BANK1818 H Street, N.W.Washington, D.C. 20433, U.S.A.
Manufactured in the United States of AmericaFirst printing December 2002

iiiEnvironmental Economics Series
Contents
ACKNOWLEDGMENTS vii
ACRONYMS AND ABBREVIATIONS ix
Chapter 1Introduction 1
Chapter 2Conceptual Aspects 3
Definitions 3Frameworks 4
Monitoring at project level 4Monitoring at national, regional, and international levels 7
Selection Criteria 12
Chapter 3Practical Aspects 17
Data Availability and Quality 17Data Collection 19
Credibility 19Cost effectiveness 20Incentives 20
Practical Considerations for Work with Different Issues 21Geographic scale 21Time scale 21Different considerations for different issues 21Interpretation 23
Practical Considerations for Work on Different Analytical Levels 26Tools for Presentation and Analysis 29
Analytical aids 30Presentational and analytical tools 32
Dissemination of Findings and Information 35

iv Environment Department Papers
Indicators of Environment and Sustainable Development — Theories and Practical Experience
Chapter 4Lessons Learned and Suggestions for Future Activities 37
Theoretical Gaps — Do They Exist? 37Making the Instruments Work for You 37Understanding the Link between Actions and Impacts 38From Green to Multicolored — The Issue of Complexity 38Pushing the Practical Envelope 39Listening to the Audience 40
Appendix AOutputs of the World Bank’s Environment Department’s Work Program 45
Appendix BSelected Examples of other Organizations’ Work 47
Environmental Indicators 47I. Aggregated 47II. Sets of indicators 48
Sustainable Development Indicators 49I. Aggregated 49II. Sets of indicators 49
Appendix CHow to Develop a Set of Indicators 55
NOTES 57
REFERENCES 59
BOXES
Box 1. Using the Input-Output-Outcome-Impact Framework in World Bank Operations 6Box 2. The Pressure-State-Impact-Response Framework in the Water Sector 10Box 3. Policy Relevant Indicators for Watershed Management 15Box 4. Why the Monitoring of Biodiversity and the Like Is Complicated 22Box 5. An Index of Environmental Vulnerability 24Box 6. Indicators of Sustainable Development — Sets of Indicators or “One Big Index?” 25Box 7. International Collaboration on Sustainable Development Indicators 27Box 8. The Good and Bad with Geographic Information Systems 35
FIGURES
Figure 1. From data to information 3Figure 2. A project-based framework 5Figure 3. The Pressure-State-Response framework 7Figure 4. Adding another category to the operational cycle — Impact indicators 8Figure 5. The DPSIR framework 11Figure 6. The information pyramid 17Figure 7. Environmental vulnerability index 24

vEnvironmental Economics Series
Contents
Figure 8. Connecting the different analytical levels 28Figure 9. Indicator diamonds as a tool for presenting the results — The example of
Sub-Saharan Africa 33Figure 10. Maps as a presentational and analytical tool 34
TABLES
Table 1. Major areas, themes, and sub-themes from the UNCSD initiative 12Table 2. Keeping development and collection costs down 14Table 3. Baselines, thresholds, and targets 29Table 4. Comparators in The Little Green Data Book 32


viiEnvironmental Economics Series
Acknowledgments
Thanks are due to Kirk Hamilton, John Dixon,and Mohammad Ordoubadi of the World Bankand Mats Segnestam of the SwedishInternational Development CooperationAgency (Sida) for useful comments andsuggestions on an earlier version of this paper.It should also be noted that neither this paper
nor several of the World Bank’s indicatorinitiatives, which the experience referred to inthis paper stem from, would have beenpossible without the generous support of theGovernments of Sweden, Norway, andDenmark. This support is greatly appreciated.


ixEnvironmental Economics Series
Acronyms and Abbreviations
DSR Driving Force-State-Response
GDP Gross Domestic Product
GIS Geographic Information Systems
LPI Living Planet Index
MDGs Millennium Development Goals
OECD Organisation for Economic Co-operation and Development
OECD/DAC OECD’s Development Assistance Committee
PCD Project Concept Document
PSIR Pressure-State-Impact-Response
PSR Pressure-State-Response
UNCSD United Nations Commission on Sustainable Development
UNEP United Nations Environment Programme


1Environmental Economics Series
1 Introduction
Indicators have been used for a long time as atool with which more information can beobtained about issues as varied as people’shealth, weather, and economic welfare.Compared to indicators of economic and socialaspects, environmental and sustainabledevelopment indicators are a relatively newphenomenon. The Rio Conference onEnvironment and Development in 1992, andother similar environmental milestone activitiesand happenings, recognized the need for betterand more knowledge and information aboutenvironmental conditions, trends, and impacts.To achieve this, it was not only necessary tocollect new and better data; new thinking andresearch with regard to indicator frameworks,methodologies, and actual indicators were alsoneeded.
The interest in the World Bank’s indicatorrelated work and other organizations’ indicator
initiatives has been ever increasing over theyears. After years of learning, developing andresearching indicators, it is time to go back andlook at the collected experience and lessonslearned (Appendix A presents a list of thevarious outputs of the indicator work of theEnvironment Department of the World Bankand Appendix B introduces a selection of otherorganizations’ indicator work). This paper ismeant to give a non-exhaustive overview of themore technical aspects of indicator work—definitions, frameworks, and selection criteria –as well as the more practical aspects—dataavailability, quality and collection, work withdifferent issues and at different analytical levels,tools for presentation and analysis, and ways todisseminate the collected knowledge. The lastsection of the paper summarizes the mostimportant lessons learned and gives somesuggestions for future indicator work.


3Environmental Economics Series
2 Conceptual Aspects
Definitions
In working with indicators, there are severalterms that figure frequently. The most commonones are data, indicator, index and information(Figure 1 shows how data, indicators, indicesand information are most commonly linked toeach other). These are terms that mean differentthings in different contexts and for differentpeople. For that reason, this section presents thedefinitions used in this paper.
Data is the most basic component of indicatorwork. As such, it is the basis for indicators,indices and information. Most data can not beused to interpret change in the state of theenvironment, the economy or the social aspectsof society. Aspects such as data availability,quality and collection are discussed in a sectionbelow.
Indicators, which are derived from data, arecommonly the first, most basic, tools foranalyzing change in society. Indicators aresuperior data as an analytical tool for severalreasons. Firstly, they can work as a basis forassessment by providing information onconditions and trends of sustainable
development. Secondly, as a basis of suchassessments, indicators can provide input topolicy formulation processes. Thirdly, bypresenting several data in one number thatcommonly is more simple to interpret thancomplex statistics, they can facilitatecommunication between different groups, forexample between experts and non-experts.
If two or more indicators, alternatively severaldata, are combined an index is created. Indicesare commonly used at more aggregatedanalytical levels such as at the national orregional level1. At these levels it may not beeasy to analyze the causal links using individualindicators since the relationships betweendifferent indicators become more and morecomplex the more aggregate the analytical levelis. However, there are problems with computingindices as well. For example, sustainabledevelopment indices are extremely complex tocreate (see section below on indicator work ondifferent issues for a discussion on this). Indicesthat cover issues from one and the same sector,or aspect, are thus more common (for example,the Living Planet Index, which “only” coversenvironmental issues—see Appendix B).
Figure 1. From data to information
Data
Indicators
Indices
Information

Environment Department Papers4
Indicators of Environment and Sustainable Development — Theories and Practical Experience
Indicators, or indices, are not the end inthemselves—they are the means to an end,consisting of improved decision-making. To geta step closer to that end, analyses based onindicators, indices, and, some times, data needto be carried out. These analyses result ininformation, which is the basis for sounddecision-making. For the analyses to becomplete and accurate, more data, or otherindicators than the ones originally monitored,may have to be included. This is quite natural asthe purpose of an indicator is for it to indicate achange – not necessarily disclose all aspectsbehind a change. Not until information isachieved, and the decision-making processeshave integrated this information, has the goal ofindicator development been reached.
After having introduced the most commonterms used in indicator work, it is time to lookat the first step of indicator development –frameworks. The following sections look at theother steps in the evolution of an indicatorinitiative, which are presented in a summarizedform in Appendix C.
Frameworks
Indicator frameworks provide the means tostructure sets of indicators in a manner thatfacilitates their interpretation. Indicators areusually needed for many aspects of a problemor issue, and the framework selected ensuresthat all of those aspects have been taken intoaccount. Frameworks can also aid theunderstanding of how different issues areinterrelated.
In general, different analytical levels requiredifferent frameworks. That is to say, dependingon the detail of analysis, and the structure andpurpose of the monitoring, differentframeworks provide the proper support and
help. This paper discusses three commonly usedframeworks and some variations on a couple ofthese frameworks:A. A project-based framework (also referred to in
the literature as the Input-Output-Outcome-Impact framework), which is used in themonitoring of the effectiveness of projectswhose objective it is to improve the state ofthe environment. Parts of this frameworkcan be used to monitor projects, which riskhaving an environmental impact withouthaving environmental aspects as their mainfocus.
B. A framework developed by theOrganisation for Economic Co-operationand Development (OECD) for national,regional and international level analyses. Thefirst version of this framework is called thePressure-State-Response (PSR) framework,but has since been developed in threedifferent directions: the first variationreplaces the pressure indicator categorywith a category of driving force indicators(creating a DSR framework), the secondvariation adds a category of impactindicators, transforming it into a Pressure-State-Impact-Response (PSIR) framework,and, finally, the last version includes all fiveindicator categories creating a DPSIRframework. The reasons for thesedevelopments are presented in thediscussions below.
C. A framework based on environmental (orsustainable development) themes.
These three different frameworks are nowdiscussed in more detail.
Monitoring at project level
For project-level indicators, the project cycleitself can help to provide a framework. Thecommon steps in the project cycle are:

5Environmental Economics Series
Conceptual Aspects
• Step 1. Inputs are provided for theimplementation of various projectcomponents (for example, money andequipment are provided to install watermonitoring stations).
• Step 2. The project is implemented and anumber of immediate outputs are achievedat the end of the project (for example, watermonitoring stations are installed andoperating).
• Step 3. The outputs, combined in complexways, lead to the desired outcomes andimpacts of the project as specified in theproject objectives (for example, an increasein access to safe drinking water). The projectoutputs may, however, also result in adverseenvironmental outcomes and impacts (socalled negative externalities).
These steps suggest the following classificationof indicators:• Input indicators: monitor the project-specific
resources provided• Output indicators: measure goods and
services provided by the project
• Outcome indicators: measure the immediate,or short-term, results of projectimplementation
• Impact indicators: monitor the longer-term ormore pervasive results of the project.
The project-based framework is depicted inFigure 2. The figure shows both the variousphases of a project and the indicator categories.As can be seen in the figure, indicators aredeveloped for the inputs, the outputs of thecomponents, and the overall project objectives.Impact indicators relate to the stated objectives ofthe project (for example, percent urban and/orrural population with access to safe water),while output indicators relate to the components(for example, number of water monitoringstations that were installed). In the same waythat the project components are closely linked tothe overall objectives of the project, the outputand impact indicators should be related.
Note that while the input-output-outcome-impact framework distinguishes betweenproject outcomes and project impacts, the
InputIndicatorcategory: Output Outcome
& impact
Projectinputs outputs
Project Project outcomesand long-term
impacts
Projectcycle phase:
Pro
ject
ob
ject
ives
Projectcomponents
Figure 2. A project-based framework
Environment Department Papers6
Indicators of Environment and Sustainable Development — Theories and Practical Experience
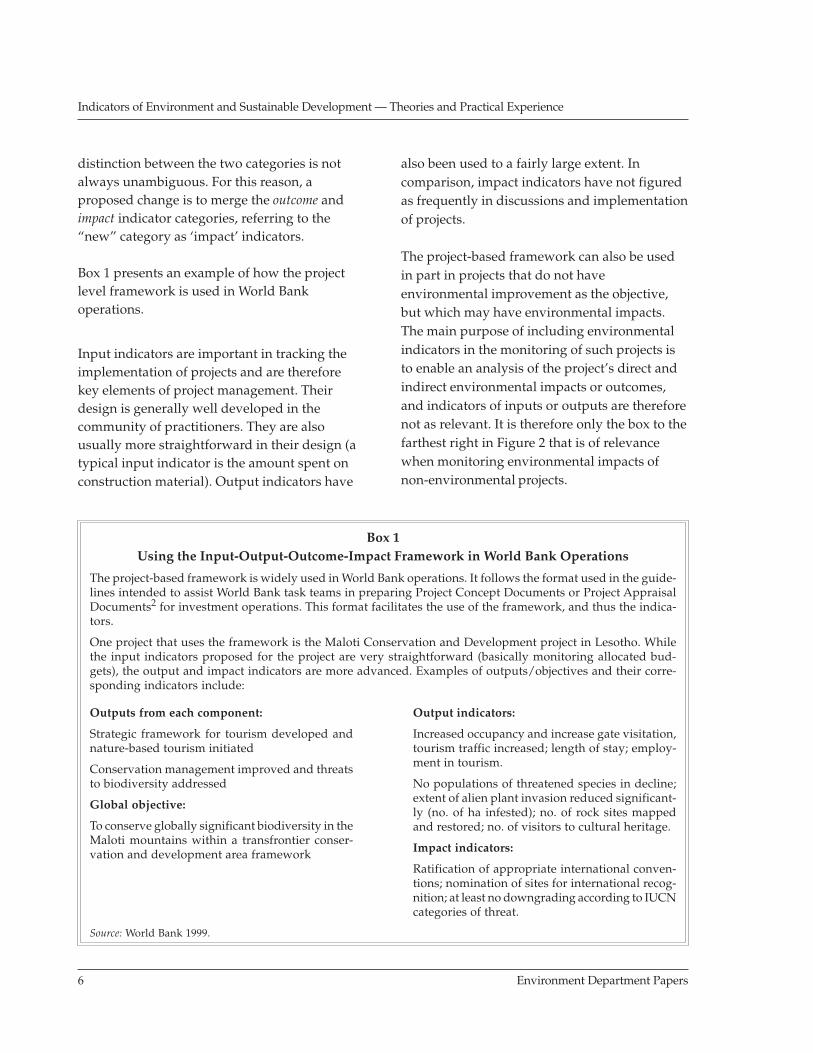
distinction between the two categories is notalways unambiguous. For this reason, aproposed change is to merge the outcome andimpact indicator categories, referring to the“new” category as ‘impact’ indicators.
Box 1 presents an example of how the projectlevel framework is used in World Bankoperations.
Input indicators are important in tracking theimplementation of projects and are thereforekey elements of project management. Theirdesign is generally well developed in thecommunity of practitioners. They are alsousually more straightforward in their design (atypical input indicator is the amount spent onconstruction material). Output indicators have
also been used to a fairly large extent. Incomparison, impact indicators have not figuredas frequently in discussions and implementationof projects.
The project-based framework can also be usedin part in projects that do not haveenvironmental improvement as the objective,but which may have environmental impacts.The main purpose of including environmentalindicators in the monitoring of such projects isto enable an analysis of the project’s direct andindirect environmental impacts or outcomes,and indicators of inputs or outputs are thereforenot as relevant. It is therefore only the box to thefarthest right in Figure 2 that is of relevancewhen monitoring environmental impacts ofnon-environmental projects.
Box 1Using the Input-Output-Outcome-Impact Framework in World Bank Operations
The project-based framework is widely used in World Bank operations. It follows the format used in the guide-lines intended to assist World Bank task teams in preparing Project Concept Documents or Project AppraisalDocuments2 for investment operations. This format facilitates the use of the framework, and thus the indica-tors.
One project that uses the framework is the Maloti Conservation and Development project in Lesotho. Whilethe input indicators proposed for the project are very straightforward (basically monitoring allocated bud-gets), the output and impact indicators are more advanced. Examples of outputs/objectives and their corre-sponding indicators include:
Source: World Bank 1999.
Outputs from each component:
Strategic framework for tourism developed andnature-based tourism initiated
Conservation management improved and threatsto biodiversity addressed
Global objective:
To conserve globally significant biodiversity in theMaloti mountains within a transfrontier conser-vation and development area framework
Output indicators:
Increased occupancy and increase gate visitation,tourism traffic increased; length of stay; employ-ment in tourism.
No populations of threatened species in decline;extent of alien plant invasion reduced significant-ly (no. of ha infested); no. of rock sites mappedand restored; no. of visitors to cultural heritage.
Impact indicators:
Ratification of appropriate international conven-tions; nomination of sites for international recog-nition; at least no downgrading according to IUCNcategories of threat.

7Environmental Economics Series
Conceptual Aspects
Monitoring at national, regional, andinternational levels
At a less detailed level, where inputs andoutputs are either not relevant or not easilyidentified, the PSR framework is more useful.Instead of focusing on the different phases of aproject, the PSR framework distinguishesbetween three different angles of environmentalissues:• The pressure variable describes human
activities or aspects that exert pressures onthe environment, that is the underlyingcauses of a problem. The cause can be analready existing one or a new activity orinvestment. Examples of potential pressuresinclude income growth, trade patterns andactivities, energy use, and populationgrowth.
• The state variable usually describes somephysical measurable characteristic of theenvironment that results from the pressure.Examples include indicators that monitoraspects such as water quality, wateravailability, deforestation, soil erosion, andexistence and quality of habitats.
• The response variables measure to whatdegree society is responding toenvironmental changes and concerns, forexample those policies, actions orinvestments that are introduced to solve theproblem. As responses to environmentalproblems they can affect the state eitherdirectly or indirectly. In the latter case theyaim to influence the pressures at work.Examples include water-pricing methods,the establishment of resource rents, the useof alternative crops, and reforestationprograms.
The PSR framework (as depicted in Figure 3) isbased on a concept of causality (OECD, 1994):human activities exert pressures on theenvironment and change its quality and thequantity of natural resources (the “state” box).Information about these changes reaches thedecision-making instances in society, whichrespond through environmental, generaleconomic and sectoral policies. These societalresponses strive to result in a change of thehuman behavior, which in turn result in an
Figure 3. The Pressure-State-Response framework
Source: OECD 1994.
Pressures Information
Societal responses
(Decisions-Actions)
Resources
Human activities
Energy
Transport
Industry
Agriculture
Other
Air
Water
Land
Living resources
Administration
Households
Enterprises
International
State of theenvironment and ofnatural resources
Economic andenvironmental
agents
Information
Societal responses (Decisions-Actions)
Pressure State Response

Environment Department Papers8
Indicators of Environment and Sustainable Development — Theories and Practical Experience
improved state of the environment. While thePSR framework has the advantage ofhighlighting these links, it tends to suggestlinear relationships in the human activity-environment interaction. This should notobstruct the view of more complex relationshipsin ecosystems and in environment-economyinteractions. (OECD, 1994) Another critique ofthe PSR framework is the missing reflection ofhow a degraded environment affects humanwelfare, that is, the pressure arrow between the“state” box and the “pressure” box could go inboth ways.
The PSR framework has been developed furtherby various users. One such development, orchange, is the use of driving force indicatorsinstead of pressure indicators. The differencebetween these two indicator categories is theircoverage. The advocates of the DSR frameworkclaim that pressure indicators are best used forenvironmental issues only. Driving forceindicators in comparison accommodate more forsocial, economic, and institutional aspects. Inaddition, ‘driving forces’ sounds more positiveand can thus be used as explanations to bothpositive and negative impacts on sustainabledevelopment. (Virtual Research and Deve-lopment Centre, 2001)
A second development of the PSR frameworkincludes the addition of a fourth indicatorcategory. With an increasing use of indicators asa decision-making tool, a need to better separateout the state of the environment, from thechanges in that state has arisen. Severalorganizations have therefore chosen to add anindicator category to the PSR framework—impact indicators—to capture the change in thestate, thereby creating a PSIR framework (see,for example, Winograd and others (1998)).
In the PSIR framework, the state indicators havethe advantage to be able to solely focus on the
physical measurable characteristics of theenvironment, on existing policies (such as waterpricing policies), and on management practicesused (for example soil management practices –do the farmers have leveled soils? Are theirrigation canals lined?). As such the stateindicators explain what factors influence thepressures at work but they also illustrate thecurrent state of the environment. The categoryof impact indicators is added in order to capturethe effects the pressures may have on that state.These indicators would in the PSR frameworkbe included in the category of state indicators,which may at times give less guidance when thestep to decision-making, or responses, is taken.
Figure 4 depicts an operational cycle using thePSIR framework. The pressures at work affect thestate of the environment resulting in a numberof environmental impacts. For example, chemicaluse in agriculture may have an impact on thestate of nearby water resources throughexcessive water pollution. This is both animpact on the environment per se, but couldalso risk having human health impacts. Tomitigate the pressure, decision-makers need to
Figure 4. Adding another category to theoperational cycle � Impact indicators
Impact
State
Response
Pressure
Information
Societal
responses
Pressures

9Environmental Economics Series
Conceptual Aspects
have information about the underlying causesto the farmers’ behavior (and thus the observedpressures and impacts). Therefore, pricingpolicies for agro-chemicals, possible subsidies,and crop patterns, for example, need to beestablished with the help of state indicators tocreate a knowledge on which decisions can bebased.
Finally, the decisions made based on theinformation collected with the help of pressure,state and impact indicators need to bemonitored. Response indicators can therefore beused to monitor three aspects of the societalresponses: i) what policies or investments areintroduced to reduce the pressure; ii) whetherthe mitigating measures proposed areimplemented properly; and iii) whether thebehavior of the involved actors and theactivities exerting the pressures change asexpected.
If no changes occur, or if the changes areunexpected, the project design and/or all of theindicators need to be revised. Maybe theassumed causal links are incorrect. The pressureand impact indicators then need to be revised,analyzing other plausible pressures within thearea. Maybe there are other policies,management practices, or similar aspects (forexample, cultural behavior) that are theexplanation to the farmers’ behavior, and maybethe responses need to be different to capturethose aspects properly. The PSIR framework isflexible and yet complex enough to capture allof these issues. However, the critique of the PSRframework about it simplifying therelationships between the different parts ofsociety is relevant for the PSIR framework aswell. Box 2 gives examples of indicators for thewater sector developed with the help of thePSIR framework.
The third, and final, development of the PSRframework is the presentation of all fiveindicator categories (driving force, pressure,state, impact, and response indicators) in oneand the same framework, providing an overallmechanism for analyzing environmentalproblems. In this DPSIR framework, thedifferent indicator categories cover thefollowing aspects of an environmental issue(Virtual Research and Development Centre,2001) (also see Figure 5):• Driving forces, such as industry and
transport produce…• Pressures on the environment, such as
polluting emissions, which then degradethe…
• State of the environment, which have an…• Impact on human health and eco-systems,
causing society to…• Respond with various policy measures, such
as regulations, information and taxes, whichcan be directed at any other part of thesystem.
Another framework option is to avoid thedifferent angles of an environmental issuesand instead focus on the environmental orsustainable development themesthemselves. The United NationsCommission on Sustainable Development(UNCSD) initiated the development ofindicators for the monitoring of sustainabledevelopment in 1995. At the outset, theUNCSD used the PSR framework toorganize the indicators selected. However,the framework turned out to be rarely usedby testing countries and was thereforeabandoned. Instead, the indicators selectedwere organized according to Major Areas,Themes and Sub-themes (see Table 1). TheUNCSD says that “(t)he principal objectiveof creating a framework formed by Themesand Sub-themes that conceptualizesustainability is to support policy makers intheir decision making at a national level.”(UNCSD 2000)

Environment Department Papers10
Indicators of Environment and Sustainable Development — Theories and Practical Experience
Box 2The Pressure-State-Impact-Response Framework in the Water Sector
As a sub-initiative to a project on indicators for rural sustainability in Central America, a conceptual case studywas developed for the water sector using the PSIR framework. Indicators of issues such as water use, waterdemand, hydroelectricity generation, water emissions (categorized as pressure variables), water availabilityand quality (categorized as state variables), population risk, effects on water (categorized as impact variables),water protection and water satisfaction (categorized as response variables) were suggested:
In addition, an index was proposed for the four indicator categories (pressure, state, impact and response).Unfortunately, the data coverage in Central America for the water sector is poor. It was thus not possible todevelop a case study using the above indicators and indices. Nevertheless, developing a conceptual model ofthis sort can help formulate priorities for data collection and indicator development as well as function as abasis for arguments around the importance of well-functioning information systems. As a conceptual frame-work, it is, of course, also applicable to other countries and regions than Central America.
Source: Winograd and others 2000.
Detailed information Aggregated information
Indicators of use Annual extraction per capita (m3)Annual extraction by sector (%)
Indicators of demand Total demand (m3)Use efficiency (%)Recycling potential (%)
Indicators of generation Number of dams (no)Kilowatts per hectare inundated (kW)Hydroelectricity production (mW)
Pres
sure
Indicators of emissions N emissions (kg)Other emissions (kg)
Water Vulnerability Index
Indicators of availability Reserves (m3)Rate of recharge (m3 yr-1)Annual rainfall (mm)Annual extraction as % of total (%)
Stat
e
Indicators of quality Biological oxygen demand(mg L- 1)Chemical oxygen demand (mg L-1)EutrophicationAcidificationColibacilli (m L-1)
Water Quality Index
Indicators of availability People affected by diarrheic diseases (#)Population affected by inundation (#)Toxicity/ Heavy metal concentration
Impa
ct
Indicators of quality Population risking inundations (no)Capital risking inundations ($)
Climatic Risk Index
Indicators of effects Watershed land useWatershed protected area
Res
pons
e
Indicators of risk Access to potable water (%)Access to drains (%)Aqueducts (#)Treatment of used waters (%)Water price (US/m3)
Safe Water Index

11Environmental Economics Series
Conceptual Aspects
A feature of all of the frameworks discussed inthis paper is that they enable the user todetermine whether all concerns (whether theyare impacts and pressures in general or relatedto specific themes) are being monitored andaddressed. A framework based on sustainabledevelopment themes, such as the one used byUNCSD, can additionally facilitate theidentification of core issues for sustainability.For this reason, this framework is commonlyused among organizations that work on acombination of aspects, such as the onescomposing sustainable development. It is alsocommon for initiatives at the international levelwhere causal links between, for example,pressures and impacts can be difficult to
determine. There are many more examples ofinitiatives that prefer to focus on themes ratherthan on categories of indicators. TheDevelopment Assistance Committee of theOECD (OECD/DAC) is one organization thatused the same type of framework in itscollaborative work on a set of indicators for theMillennium Development Goals for sustainabledevelopment (see Box 7 for an introduction tothe environmental indicators proposed for theset). Another example is the World Wide Fundfor Nature and its Living Planet Report (seeAppendix B).
To select a framework is the first step inworking with indicators. All frameworks,
Figure 5. The DPSIR framework
Drivers
e.g. industry andtransport
Responses
e.g. clean production,public transport,
regulations, taxes,information
Impact
e.g. ill health,biodiversity loss,
economic damages
State
e.g. air, water, soilquality
Pressures
e.g. pollution, naturalresource extraction

Environment Department Papers12
Indicators of Environment and Sustainable Development — Theories and Practical Experience
however, need to have indicators identified forthe respective categories, whether they areproject phases, indicator categories, orenvironmental/sustainable developmentthemes. The next section introduces a number ofselection criteria – a methodological aspect thatneeds to be taken into account when workingwith indicators.
Selection Criteria
There is no universal set of indicators that isequally applicable in all cases. However, a smallset of well-chosen indicators tends to be themost effective approach. There are a number ofselection criteria that can be applied whennarrowing down the number of indicators. Theselection criteria ensure that the indicators are
Table 1. Major areas, themes, and sub-themes from the UNCSD initiative
Source: UNDSD 2001.
Major Areas Themes Sub-themes
Equity PovertyGender equality
Health
Nutrition statusMortalitySanitationDrinking waterHealthcare delivery
EducationEducation levelLiteracy
Housing Living conditions
Security Crime
Social
Population Population change
AtmosphereClimate changeOzone layer depletionAir quality
Land
AgricultureForestsDesertificationUrbanization
Ocean, seas and coastsCoastal zoneFisheries
Fresh-waterWater quantityWater quality
Environmental
BiodiversityEcosystemSpecies
Economic structureEconomic performanceTradeFinancial status
Economic
Consumption and production patterns
Material consumptionEnergy useWaste generation and managementTransportation
Institutional frameworkStrategic implementation of sustainable developmentInternational cooperation
Institutional
Institutional capacity
Information accessCommunication infrastructureScience and technologyDisaster preparedness and response

13Environmental Economics Series
Conceptual Aspects
useful and effective in their provision ofinformation to the decision-makers. Theliterature on indicators probably has as manyselection criteria listed as there are indicators,but the following criteria are appropriate tomost indicator selections and are commonlyincluded:
Direct relevance to objectives. The indicatorselection must be closely linked to theenvironmental problems being addressed. It istherefore important that the problem to beaddressed in well defined. Vague or overlybroad problem formulation, such as “loss inbiodiversity” are of little use in selectingindicators (and may well indicate that the issueitself is not very well identified).
Direct relevance to the target group. Differenttarget groups could have different needs anduses for the information provided by theindicators. To carefully consider who the targetgroup consists of is therefore central. Forexample, an authority responsible for themonitoring of an environmental aspect in acountry is likely to need more detailedinformation than the general public could evendigest. The authority could therefore need alarger set of indicators, while the general publicwould be satisfied (and probably the indicatorinitiative would be more successful) with asmall set of “headline” indicators (that is,indicators that signal something which makespeople react as we do when reading theheadlines in a newspaper).
Clarity in design. It is important that the selectedindicators are defined clearly in order to avoidconfusion in their development orinterpretation. Clarity can mean different thingsfor different groups of people – whether theindicator needs to be scientifically very solid, or
rather be very communicable is thereforesomething to consider. Who the audience of theindicators is central for this selection criteria.
Realistic collection or development costs. Indicatorsmust be practical and realistic, and their cost ofcollection and development therefore need to beconsidered. This may lead to trade-offs betweenthe information content of various indicatorsand the cost of collecting them. What isimportant to remember is the correspondingbenefit of new indicators—an indicator shouldbe relatively inexpensive to develop, that is, thebenefits should exceed the costs.
Even though it may sound paradoxical, thedevelopment of two sets of indicators can helpto lower the costs through a division betweenindicators that are collected as a first priority,and indicators that can be considered as secondpriority. This can be done in a couple ofdifferent ways, which have different purposesof the monitoring (for a summary of these twoways, see Table 2). One way is to develop a coreset of indicators consisting of a number ofindicators that monitor issues relevant at a moreaggregated level. The core set of indicators canthen be supplemented by another set ofindicators that either look at issues that are notcommon for the whole monitored area, orprovide a more detailed picture of the selectedissues once the core indicators have establishedthat changes are occurring. This approach hasbeen used at an international and regional level,where the main objective is to be able tocompare the values of the indicators among thecountries. A set of core indicators, monitored byall the countries involved, has therefore beenpart of that objective. However, the individualcountries have also been encouraged to monitorother issues that may be of importance for them,and not necessarily for all the countries

Environment Department Papers14
Indicators of Environment and Sustainable Development — Theories and Practical Experience
involved, with the help of a supplemental set ofindicators. One example of this is the OECD/DAC’s initiative of indicators for theMillennium Development Goals (see Box 7). Aset of indicators was developed to be monitoredby as many countries as possible in the world.The core set of indicators therefore had to coverissues that were common for all those countries.However, several countries highlighted theneed for indicators to monitor other, nationallyrelevant, issues, such as desertification. Thosecountries were therefore encouraged to developa supplemental set including those indicatorsthat were country specific and not necessarilyrelevant to all countries involved. This approachcould be used at all analytical levels.
Another approach is to develop one set of alarmindicators, and one set of diagnostic indicators. Inthis approach, the issues are relevant andpresent throughout the area and process, andthe first priority of the monitoring activity is togive early enough warning about adverseenvironmental effects in order for decision-makers to react. There is therefore a differencein the purpose of the alarm and diagnostic
indicators. The alarm indicators are a small setof indicators whose development andmonitoring are low cost, permitting a frequentmonitoring. They are also specifically chosen togive an early warning about changes and signalchange in time for policy-makers to react.
Diagnostic indicators, in comparison, are asecond set of indicators that is activated if thevalue of the alarm indicators crosses apredetermined threshold and that enables amore in-depth analysis (or diagnosis) of thecauses of the alarm. The diagnostic indicatorsgive more detailed information about the issuesat hand and sometime cover a larger area thanthe alarm indicators. As a result they aregenerally more costly. In addition, theygenerally do not provide the monitoring agencywith enough lead-time for a timely reaction tothe problem. All of these characteristics makethem appropriate as diagnostic indicators ratherthan as alarm indicators.
This approach was used in a policy relevantmonitoring system for watershed management
Table 2. Keeping development and collection costs down
First priority: To be able to compare
areas/countries/regions
First priority: To be able to give early warning to decision
makers
Core set Alarm indicators
Indicators to bemonitored by everybody involved inthe monitoring initiative to enable comparisonbetween monitored areas/countries/regions.
For example, access to safe drinking water
Indicators to be constantly monitored in order togive timely warning about adverse changesthreatening to exceed set thresholds.
For example, electric conductivity of water
Supplemental/complementary set Diagnostic indicators
Indicators to be monitored by a smaller group forwhom the supplemental indicators are relevant,AND/OR to show more detail on the issueshighlighted by the core set of indicators.
For example, desertification (not relevant for allcountries in the world), pollution sources (toestablish causes behind the lack of access to cleanwater).
Indicators to be monitored to enable an in-depthanalysis of the issues highlighted by the alarmindicators.
For example, more monitoring points of electricconductivity of water.

15Environmental Economics Series
Conceptual Aspects
in Costa Rica. Box 3 discusses alarm anddiagnostic indicators in more detail, as well asexamples from the Costa Rican project.
High quality and reliability. Indicators, and theinformation they provide, are only as good asthe data from which they are derived. For mostmonitoring systems there is a discrepancybetween what is realistic or practical for themoment, and what would be most useful or“ideal”, for the system to cover. If the “ideal”indicator to measure a problem is based onunreliable data, it is common to depart from the“ideal” indicator and use proxies instead.However, it is always useful to consider thealternative to the proxies—the “ideal”
indicators—as the development of those maynot be as impossible or costly as one mightimagine, especially if the corresponding benefitsare correctly estimated.
Appropriate spatial and temporal scale. Carefulthought should be given to the appropriatespatial and temporal scale of indicators. Sincethe environmental impact of activities seldomcoincides with administrative boundaries,indicators often need to be measured ondifferent scales. There might also be lags in timebefore project effects are felt.
Apart from these criteria, which are applicableand relevant for indicator selection at allanalytical levels, there are examples of other
Box 3Policy Relevant Indicators for Watershed Management
The World Bank has, together with the International Food Policy Research Institute, ProDesarrollo Internacio-nal and the government of Costa Rica, developed a policy relevant monitoring system for a watershed inwestern Costa Rica. The monitoring system consists of three components: a model that provides a means ofidentifying the causes of an emerging problem and evaluates alternative options for fixing it, an institutionalframework which discusses how the involved institutions affect and are affected by the proposed monitoringsystem, and, finally, an indicator component.
The main part of the indicator component is developed in such a way that it is possible to keep costs down andyet follow the developments within the watershed. This is made feasible with the development of alarm anddiagnostic indicators.
In the policy relevant monitoring system developed for the watershed in Costa Rica, the diagnostic indicatorsare also used in an economic model, which uses the indicators as a base for the evaluation and comparison ofpotential responses. The results of the monitoring of the alarm and diagnostic indicators can be used in other,more “direct” ways as well as long as the indicators are fairly clear in what they signal. The possibilities ofacting directly on the monitoring results depend on the capacities of the monitoring institutions and the mon-itoring system those institutions have selected.
To demonstrate the interaction between the alarm and diagnostic indicators, the issue of salinity in the soils inthe downstream areas of the Costa Rican watershed can be used. There are several potential culprits to in-creased soil salinity levels in the downstream areas; basically every farmer in the area could be the cause ofsuch an observed change. Electrical conductivity of the water is a fairly straightforward pressure indicator thatgives a much quicker warning than the relevant impact indicator – agricultural yields – would. Furthermore,agricultural yield is more ambiguous as an indicator since changes in yield can depend on many other thingsthan whether the soils are saline or not. As an alarm indicator it is therefore proposed that one monitors theelectrical conductivity at the points in the drainage canals where an existing monitoring system is alreadymeasuring. However, to be able to direct any interventions correctly when the alarm indicator reaches itsthreshold, the individual farmers experiencing the salinity problem need to be identified. A diagnostic indica-tor, similar to the alarm indicator is therefore proposed to be monitored at each of the farms, at different pointsfor a complete coverage of areas potentially affected by salinization.

Environment Department Papers16
Indicators of Environment and Sustainable Development — Theories and Practical Experience
criteria whose appropriateness depends on thelevel of the indicator initiative:• National or regional level: The indicators are
preferably national in scope or relevant toan issue of national concern. If thedeveloper or user wishes to create an index,it is also an advantage if the indicator isquantifiable.
• International level: The indicators arepreferably calculated using available dataconsidering the cost of developing newindicators; especially for hundred countriesor more. The indicators selected should alsobe available in all countries since inter-country comparisons are commonly apurpose with such initiatives. For suchcomparisons to be possible withoutdisagreement, international consensus ispreferable to the largest extent possible.(UNDSD 2000.)
Alternatively the selection criteria can dependon the issue to be analyzed. In the literature,such selection criteria are specifically discussedin relation to sustainable development analyses.The following specific selection criteria forsustainable development are taken from“Sustainable Development in the United States.An Experimental Set of Indicators” (USInteragency Working Group on SustainableDevelopment Indicators 1998):• The indicator should reflect changes in
important endowments (for example, publicinfrastructure, air or water quality, naturalresource stocks and governmentalinstitutions).
• The indicator should reflect an issue thatcould have significant costs or benefits forcurrent or future generations (for example,technological advances, political stability,loss of biodiversity, status of children anddesertification).
• The indicator should reflect an issue that canonly be addressed over a period of years, decadesor centuries (for example, global climatechange).
• The indicator should reflect an issue thatinvolves thresholds beyond which small changescould potentially lead to irreversible effects (forexample, endangered species becomingextinct).
After having introduced the most commonlyused frameworks, and a number of selectioncriteria that are useful in the establishment ofindicator sets, it is now time to look at the morepractical aspects that play a role in the workwith indicators. Many times, practical aspectscan be a great challenge – sometimes to theextent that it seems impossible to achievesomething useful due to lack of data, lowquality of existing data, difficulties indeveloping useful indicators for the analyticallevel in focus, or even due to difficulties inpresenting and disseminating the results in aneffective manner. The following sections presentand discuss various experience gained inindicator work of the World Bank and otherorganizations. For some areas, where theexperience is quite extensive, advice is given onhow to overcome these obstacles, but in manycases discussions are all that is possible since acomplete answer is yet to be found.

17Environmental Economics Series
3 Practical Aspects
Data Availability and Quality
The lack of data in general, and reliable dataspecifically, is a common problem in theindicator world. This is true for most indicatorinitiatives at most analytical levels. Due to theirrelative infancy, environmental data are difficultto come by compared to data for economic andsocial indicators. The theory behind thedevelopment of indicators and indices looks likeFigure 6A, with a broad base of good qualityprimary data on which the indicators andindices can rest on. To show a simplified pictureof reality, this information pyramid is commonlyturned upside down (Figure 6B) with manyindices developed using the same, limited datasets that currently exist. As is discussed below,this should and does not necessarily hinder anddiscourage the development of indicators today,but the figure clearly illustrates the need for
new and improved environmental data. Whilethe problem of data availability and quality canbe relatively easily solved at the project levelthrough the inclusion of a data collectioncomponent, it is commonly a bigger problem atthe national or regional level, considering thecosts involved in collecting new data for awhole country or region.
What are the different issues that work as aconstraint to the development of new anduseful environmental data? In its GlobalEnvironment Outlook 2000 report (UNEP 1999),UNEP (the United Nations EnvironmentProgramme) discusses two categories ofconstraints—institutional and technical:• The institutional constraints are divided into
four categories: i) general institutionalconstraints—limitations in resources,personnel and equipment; ii) data reporting
Primary data
Analyzed data
Indicators
Indices
Indices
Indicators
Analyzed data
Primarydata
Ag
gre
ga
tio
n
A. Theory B. Reality
Figure 6. The information pyramid

Environment Department Papers18
Indicators of Environment and Sustainable Development — Theories and Practical Experience
units—difficulties with the aggregation andcomparison of data sets; iii) datamanagement—lack of central compilingsystems; and iv) relevance—lack ofrelevance of certain issues for somecountries result in incomplete global datasets.
• In addition, the report includes sixcategories of technical constraints: i)definition differences—vague definitions,and differences in definitions betweencountries, risk resulting in misinterpreta-tions; ii) coverage of monitoring networks—the lack of monitoring networks results ingaps in data time series; iii) differentreporting periods—difficult to comparecountries’ collected time series; iv) gapfilling—using various estimates, instead ofreal data, can lead to misinterpretation; v)conceptual and technical difficulties ofmeasurement—certain aspects ofsustainable development are difficult tomonitor over large geographic areas or todetermine the cause and effect relationship;and vi) differences in measurementmethod—data that are incompatible riskending up in the same aggregated data setwithout detailed analysis of data collectionand measurement methods.
In addition to these two categories ofconstraints, a third category could be relevant tointroduce—political constraints. Especiallyenvironmental issues have not always been highon the list of priorities for governments aroundthe world. One reason for this is quite likely theshort-term perspective that most politicianshave due to the shortness of political terms. Thepolitical willingness to invest in theenvironment, or even in sustainabledevelopment, which both typically demandlong-term investments, has thus been low. To
the people who work with these issues, there isagreement on the need for dissemination ofinformation about the importance of theseaspects, not only for the environment itself, butalso for the welfare of the people in thecountries. Without that knowledge, the publicopinion will not change, thus the demand forthese aspects in political decision-making willnot change, and, since the politicians generallylisten to the public opinion, the politicalwillingness will continue to be low. Theseconstraints of low priority and politicalwillingness have consequently led to small, ornon-existing, budgets, since there have been somany other things to spend money on. Theresult being that the data collected have beeneconomic, or in some cases social, but to a lesserextent environmental.
Many of these constraints require resources,time, equipment and personnel to deal with.Considering reality in many countries, theimprovement of data availability and quality istherefore a long process. In the meantime,environmental and sustainable developmentaspects need to be monitored so that they arenot ignored in decision-making processes. Asolution to this problem is the use of alreadyavailable data.
Available data should be used to the greatestextent possible and with creativity in order toreduce the cost for involved parties. It is notuncommon that data on a national level aredemanded for a regional or internationalinitiative in which it is difficult to find resourcesto develop new data. Imagine, for example, aninternational initiative, which identifies a newindicator to be developed by as many countriesin the world as possible. To collect completelynew data and develop a new indicator for ahundred countries or more would not only be

19Environmental Economics Series
Practical Aspects
extremely costly, it would also be very difficultto arrange in a practical way. To use proxies inthe form of already available data to begin withcould therefore be the only feasible solution(except from the alternative of not developingan indicator set at all, which, most likely, wouldbe a worse alternative from a sustainabledevelopment perspective). However, thecommon and widespread problem of non-existing or low-quality environmental datashould not be forgotten, and new initiatives ondata collection should be considered as well.
At the project level, the issue of data availabilityand quality looks a bit different. To include adata collection component in an indicatorinitiative for a well-defined smaller area doesnot have to be expensive, nor impractical. Thereare, however, several aspects to consider in thedevelopment of a data collection component.
Data Collection
Collection of data can be arranged in manydifferent ways. Whether the indicator initiativeis at the project or a more aggregate level willmatter for the methods used. At the projectlevel, the implementing agency may be the bestdata collector – they are already in place, andthe data for the particular project are not likelyto exist already. At the international level, thereare two levels of data collection – first the dataneed to be collected within the countries, secondan international organization needs to collectthe data from the individual countries. This isalso the common method for indicatorinitiatives at the regional level, unless a regionalorganization collects the data from the nationalorganizations. At the national level, the mostcommon solution is for a national organizationor ministry to be responsible for the collection ofdata for their specific field of interest.
For an indicator initiative that has as itsobjective to study an area within a country, forexample a watershed, the methods and possibleimplementers look a bit different. Existingliterature may include data that can becompiled through a desk study, externalcompanies or institutions specializing in theissues can be contracted, organizationsrepresenting the stakeholders’ interests can beinvolved using their vested interests as anincentive, schoolchildren can participate as partof their education, or the local population – forexample farmers, residents, and researchers –can be encouraged to take an active role in thechanges of their social, environmental, andeconomic surroundings by contributing to thedata collection.
If an external company or institution iscontracted, transports, meals and housing costsfor the professionals need to be covered. Thisimplicates that the monitoring will be moreexpensive than if the local population ororganizations are trained for the task ofcollecting the data. This is especially true if themonitoring system becomes more permanent,resulting in high contracting costs whenaccumulating over time. Another advantage ofinvolving local stakeholders is the enhancedsupport and sustainability of the project thatusually follow.
Several issues are relevant for the datacollection phase—independent of the analyticallevel. Aspects such as credibility, cost efficiency,and incentives are important, and determine notonly the quality of the monitoring system, butalso its sustainability and the possibilities tointegrate it into the decision-making process.
Credibility
In order for the indicators to play their role infull, the data collected have to be credible. This
Environment Department Papers20
Indicators of Environment and Sustainable Development — Theories and Practical Experience
implies that the data collectors need to be so. Ifthe results are not credible, both explicitly(results of poor quality) and implicitly (resultsare not credible due to the data collector’svested interests), the indicators may never beused.
Hence there are two aspects to credibility thatcome into play: trustworthiness and capacity. It isimportant that although a data collector mayhave an interest in the monitoring resultsshowing a certain “truth”, other groups, thatwill use the indicators, can trust the results thatcome out of the monitoring. Trust is thereforeimportant, but so is capacity. The monitoringresults may very well be developed by atrustworthy organization, or company, but ifthey do not have the proper capacity to developand analyze the indicators, the results mayshow wrong trends.
A solution can be to create “monitoring teams”consisting of one agency that collects the data,and one that controls the quality of the results ofthe data collection. In that way, it is possible toachieve cost-efficiency and credibility even inthe cases where one single agency does notpossess both characteristics. For example, if amonitoring system is set up in a watershedwhere different actors, including a hydropowercompany and farmers, are sharing the resourceof water, a “monitoring team” could consist ofrepresentatives from both of these groups. Thehydropower company would most likely becollecting data on water supply, while thefarmers could work as quality controllers,ensuring that the data submitted by thehydropower company are trustworthy.
Cost effectiveness
The discussion on credibility also needs to takecost-effectiveness into account. Some of the
indicators proposed may already be collected byvarious organizations, or they may be about tobe included in various programs. As long as thedevelopers of those indicators are reliable andtrusted by the other stakeholders, there is noreason to start developing the same indicatorswithin a different organization. On the contrary,the more costs can be cut by taking advantage ofalready established monitoring systems orprograms, the better it is.
Incentives
The various costs and benefits need to bestudied properly when deciding whichinstitution to put in charge of the monitoring.This last aspect also raises the question abouthow to get the institution to agree to spend themoney on monitoring – an issue of incentives.
Most monitoring or data collection impliesvarious costs for the collector. If the monitoringagency is to agree to bear these costs, the properincentives need to be established. Suchincentives can be created in many ways, forexample, through regulations, laws, fines,compensations, and economic benefits – alldepending on the level of the indicatorinitiative. Incentives for data collection at thenational level are probably best created throughregulatory requirements, laws, political orstatistical mandates, or through disseminationof information to the public and others aboutplausible benefits from a changed behavior. Atthe international and regional levels the bestincentive is commonly mandates, for examplethe mandate of a non-governmentalorganization to disseminate information aboutdeforestation in the world. The incentives at theproject level can be created through regulations(the organization paying for the project maydemand that the project be monitored) and

21Environmental Economics Series
Practical Aspects
through economic benefits (it can be costly forthe project if it is heading in the wrongdirection).
Practical Considerations for Work withDifferent Issues
Apart from the more technical and conceptualaspects discussed so far in this paper, there areseveral considerations that need to be taken intoaccount when working practically withindicators. This section discusses the mostinfluential ones of the considerations that arerelevant in the work with different issues, suchas pollution, natural resource management andvarious cross-cutting issues.
Geographic scale
In working with indicators of natural resourcemanagement and pollution, the geographic andthe time scale of the indicator play a significantrole. The geographic scale is partly an issue ofglobally significant indicators versus locallysignificant indicators. For example, theextinction of a species in a region within acountry may be of serious concern for thatregion, even if the species is not near extinctionglobally. At a global level, there may even becompletely different species that matter.
The role of indicators in decision-makingprocesses that concern natural resourcemanagement and pollution aspects is alsopotentially linked to the geographic scale.Indicators of pollution and natural resourcemanagement do not always coincide withpolitically defined areas, to which decision-making is commonly delimited. A watershed istypically such an area, where it is common thatthe area for which the indicators are relevant isat a much larger scale than the areas for which
decisions are taken. In the practical work withindicators, collaboration between governments,sub-national organizations or local groups istherefore fundamental. If the indicators aredeveloped according to the political boundaries,both the interpretation of the indicators and theindicators themselves risk being far from perfector irrelevant and, thus, result in either incorrectmeasures or measures that fail to appear.
Time scale
The time scale of an indicator also affects theusefulness and interpretation of indicators. Theissue of time becomes important in the design ofmitigating measures and to enable preventionrather than reaction to a problem. If theindicator is meant to give enough warningabout, for example, extinction, the number ofextinct species is not appropriate since their rolein preventing extinction is limited to say theleast. Several indicators do, furthermore, notindicate change until some time has passed, andmay therefore be less appropriate in a decision-and policy-making environment. In monitoringissues with such characteristics, considerationneeds to be taken in the early stages of themonitoring initiative. If taken into account earlyenough, it may be possible to implement actionsfor the reduction of long-term impacts beforethose impacts are noticeable. Initiatives thatvalue the long-term losses may also benecessary to begin at an early stage to be able tomotivate further investments in mitigatingmeasures.
Different considerations for different issuesPOLLUTION INDICATORS
Apart from these common considerations in thepractical work with indicators, there are a fewthat are specific for pollution and natural

Environment Department Papers22
Indicators of Environment and Sustainable Development — Theories and Practical Experience
resource management monitoring respectively.For example, while several pollution issues maybe more difficult to interpret than some naturalresource issues due to their commonly globalcharacteristic, more and more practitionersagree on the indicators to use in theirmonitoring. The World Health Organization hasdeveloped global standards of water quality, airquality indicators have been used in many citiesaround the world, and their monitoring is fairlyeasily motivated due to their link to humanhealth. Impacts from many pollutants alsocommonly take longer before they aredetectable and last for a long time—indicators
of pollution therefore have to consider the timescale issue discussed above.
NATURAL RESOURCE MANAGEMENT INDICATORS
Many indicators of natural resourcemanagement, on the other hand, show animpact directly (even though the importance ofthat impact may be of the long-term nature).Deforestation is apparent the same instance ithappens, so is land use change. There are ofcourse other indicators that may not show aclear trend immediately – indicators of wateruse may belong to that category since it may be
Box 4Why the Monitoring of Biodiversity and the Like Is Complicated
Biodiversity is here used as an example of the difficulties in defining and developing indicators for someissues such as biodiversity and several cross-cutting issues including sustainable development. The monitor-ing of biodiversity has traditionally been difficult due to several factors. These factors can be divided intopolitical, conceptual, practical (technical), and institutional factors:
Political factors. Factors that affect the development of biodiversity indicators are often political. Political will-ingness to prioritize an issue such as biodiversity, and to spend money on the monitoring of it, is commonlylow since the benefits to the general population sometimes can be difficult to identify. This in turn is often aresult of ignorance – the economic benefits of conserving biodiversity, or the economic losses of destroyingbiodiversity, may not be analyzed enough. The ignorance can also be a result of a traditionally greater focus onbiodiversity’s nonutilitarian values as opposed to its utilitarian values, which may result in a lower prioritygiven to biodiversity conservation.
Conceptual factors. The monitoring of biodiversity is extremely complex as a result of various aspects. First,the diversity within the concept of biodiversity demands a flexible approach to the selection of indicators. Differ-ent aspects such as genetic diversity, species diversity, diversity in untouched areas, and diversity in agricul-tural areas all require different indicators. Second, the ambiguity associated with the term “diversity” itselfcreates confusion in how to monitor and measure it. Third, the multidimensional roles mentioned above contrib-ute to the complexity. This intricacy clearly creates problems when one tries to express it in a few selectedparameters.
Practical (technical) factors. The general problem of a lack of data plays a significant role for the few identifiedbiodiversity indicators that are currently commonly used. Difficulties in being exhaustive in the measuring ofbiodiversity indicators are noticeable. In addition, practical measuring problems result in a lower reliability inthe data that do exist. For example, “number of species” is a commonly proposed and used indicator of biodi-versity. However, with the current knowledge gaps in, for example, how many species actually exist, such anindicator does not necessarily reflect reality.
Institutional factors. Capacity to develop and, perhaps even more important, to interpret and analyze thedeveloped indicators is commonly lacking in many countries. The capacity needed is both of the human and ofthe technical kind. Hammond et al. (1995) state, for example, that “national measures of biodiversity of use topolicymakers may be impossible to compile unless they are based on spatially referenced data – essentiallydigital maps.” While the technology to achieve this is becoming more and more developed, it is still far fromavailable to all involved parties.

23Environmental Economics Series
Practical Aspects
difficult to establish a threshold for sustainableuse of fresh water resources. Effectivemanagement, and thus quality, is therefore acentral aspect in the monitoring of naturalresources. This is easily missed when onlymonitoring number of hectares of deforestationor people trained in environmentalmanagement. Some natural resources arefurthermore difficult to monitor due to theircharacteristics. For example, it is difficult toestimate marine fish stocks and the richness of acountry’s biodiversity due to the vast areasutilized by the resource. Unlimited monitoringareas are not the only reason why issues such asbiodiversity are complicated to monitor.Political, conceptual, practical and institutionalfactors all contribute to the complexity of someissues (see Box 4).
INSTITUTIONAL INDICATORS
For the development of institutional indicators,the considerations look slightly different. Insome cases, indicators simply note the presenceor absence of institutions, laws, regulations orstrategies. However, these so-calledcommitment indicators demonstrate a numberof problems. First, they do not reveal whetherthe management, enforcement orimplementation is effective, that is, the quality isnot monitored. Second, they are commonlyfairly limited in their coverage. One aspect thatis often forgotten in the monitoring ofinstitutional development is public attitudes—an aspect that may not only be the reason fordecision-makers to consider the environmentfrom the beginning, but is also vital for thesuccess of change. (Segnestam 1999.)
CROSS-CUTTING INDICATORS
For the more cross-cutting issues, complexity isthe most central practical consideration. Howcan one capture several different aspects in one,
or a few, indicators? Causal links are herefundamental. Without established causal linksbetween, for example, poverty andenvironment, relevant indicators are notpossible to identify. This may sound obviousand something that is true for all indicatordevelopment. However, most cross-cuttingissues with regard to the environment have onlybeen researched to a minor extent and manycausal links have thus not been established yet.On the other hand, the recommendation to useexisting data and indicators creatively isapplicable here as well. Many indicatorinitiatives around the world have includedindicators that can be interpreted in a “cross-cutting setting”. One such example is thecommonly used ‘access to safe drinking water’,which mirrors some of the links betweenpoverty and environment, and health andenvironment. Another is the index ofenvironmental vulnerability (which shows riskof inundation and land slides) developed withinthe CIAT-World Bank-UNEP collaborativeproject on rural sustainability indicators forCentral America – an indicator that furthermoremirrors management issues (Box 5).
Interpretation
In general, complexity creates problems for anyindicator developer. This has become especiallyobvious with the last years focus on sustainabledevelopment. While the experts consider all thecritical factors as vital to follow, politicians keepasking for a few indicators, or “the one” to basedecisions on. This “conflict of opinions” circlesaround the issue of interpretation. The use ofindicators that consist of several indicators, ordata combined in a way to give a more completepicture of the monitored aspect (so calledcomposite indicators), is common in themonitoring of sustainable development. The

Environment Department Papers24
Indicators of Environment and Sustainable Development — Theories and Practical Experience
interpretation is then complicated by the manydifferent trends that can occur within theindicator itself—is it a positive or negativechange if the value of one part goes up at thesame time as the value of another part goesdown? The relative weights “internally” need tobe established, an issue that is often difficult toagree on. Another problem with large sets of
indicators or indices is that they commonlyreflect the specific expertise and researchinterest of the organization that “invents” theset or index. Hence, they are often biasedtowards one aspect, for example environmental.However, there are several other aspects toconsider in solving this “conflict” between setsof indicators or one single index, whether it is of
LEGEND
Landslide riskareas
Potential inundatedareas by rivers
Potential inundatedareas by soil’s poordrainage
San Pedro Sula
Choluteca
Tegucigalpa
Box 5An Index of Environmental Vulnerability
Figure 7 illustrates an environmental vulnerability index calculated for Honduras. This index takes such is-sues into account as the biophysical characteristics of the environment, and shows the risk of landslides andinundation (flooding). It is computed through the creation of intermediary maps of flood and landslide riskusing data on forests, rivers, topography, slopes, soil permeability, and vegetation. Only the risk of landslidesand flooding are highlighted in this index due to the impacts suffered in Honduras in the wake of HurricaneMitch. An environmental vulnerability index, could, however, highlight other aspects as well depending onwhat a country or region is vulnerable to.
The map clearly shows an alarming picture with over 60 percent of the territory being under some type of riskof flooding or landslide, in particular the more populated and agricultural areas, for example the axis SanPedro Sula-Tegucigalpa-Choluteca. This first tells us that environmental vulnerability, and the risk of beingaffected by floods or landslides, need to be dealt with in one way or the other. We furthermore know the areasin which interventions need to implemented, and we have some ideas of what needs to be done (e.g. experi-ence tells us that planting trees can help prevent landslides from happening). If the information provided inFigure 7 is combined with other types of data, such as data on location of the population, poverty levels, andthe location of infrastructure, a more integrated and complete picture of a country’s vulnerability can be achieved,which can be used as the basis for decision-making and planning. For more information about this type ofcombined vulnerability index, see Segnestam and others (2000).
Figure 7. Environmental vulnerability index
Source: CIAT 2000.

25Environmental Economics Series
Practical Aspects
sustainable development or other cross-cuttingissues. Box 6 presents some of the mostcommonly discussed. The most important
features (apart from the more general featuresdiscussed in the section on frameworks above)of frameworks for the monitoring of sustainable
Box 6Indicators of Sustainable Development — Sets of Indicators or “One Big Index?”
Many concerned with sustainable development would like to see a single indicator to compete with the enor-mous political power of the Gross Domestic Product (GDP). In addition, it is becoming more and more com-mon for decision-makers to ask for a single, powerful number that is easy to understand and use in decision-making. But many are skeptical that a single number could assess something as complex as sustainabledevelopment, especially if one considers all the criticism that has been raised against GDP. The skeptics areinstead promoting sets of indicators that include numbers on the most important aspects of society’s well-being. The tables below present some of the pros and cons with a single indicator and indicator sets respective-ly.
Indices of sustainable development
Benefits Problems
♦ The aggregation of indicators makes it possibleto obtain clear messages, gain an overview ofsustainable development, and show whereperformance is especially weak or strong
♦ An aggregated indicator of sustainabledevelopment can compete with the GDPindicator in the communication to the generalpublic about material well-being
♦ Aggregated indicators explores the relationshipamong the variables, which lies at the heart ofthe linkages intrinsic to sustainabledevelopment
♦ An aggregated number is more difficult toquality assess since the aggregation hides theindividual parts of the indicator
♦ The actual aggregation may become a bitambiguous when items, whose units differ, areadded together (for example, life expectancy,educational attainment and adjusted income asis done in the Human Development Index)
♦ The aggregation is, in general, difficult toachieve in a clear and unambiguous mannersince it demands weighting of items that aredifficult to value
♦ An aggregated number may be good forcomparisons between countries, or regions, butdoes not necessarily have a functional value as apolicy tool
Indicator sets of sustainable development
Benefits Problems
♦ Quality assurance of the individual indicators ismade easier
♦ A set with several indicators provide countrieswith more flexibility with regard to whichindicators to include (according to variations inconditions, activities and priorities)
♦ A set with several indicators can be based onindicators that are conceptually accepted andfamiliar to developers and the public
♦ The linkages between the economic, social, andenvironmental trends in society as well asbetween and among systems are not alwaysillustrated properly for the sets to be measuringsustainable development
♦ It is not uncommon that sets of sustainabledevelopment indicators include multipleindicators for essentially the same issue whilehardly (or not) including indicators of otherimportant issues
♦ Their assessment is made difficult by thediversity of issues that different indicatorsmeasure, and the different directions in whichthe indicators move

Environment Department Papers26
Indicators of Environment and Sustainable Development — Theories and Practical Experience
development is probably i) that it assessestrade-offs between different dimensions ofsustainable development, and ii) that it helps setpriorities across different policy areas (OECD,2000a). These features are important whetherthe monitoring is carried out with the help of aset of indicators or an index.
Practical Considerations for Work onDifferent Analytical Levels
As the above discussions on frameworks andselection criteria already have made clear, theanalytical level can be of importance for thedesign and development of an indicator. Inaddition, the analytical level can play a role inthe interpretation of the monitoring results. Justas for the monitoring of various issues, there area few considerations that need to be taken whenworking practically with indicators at differentanalytical levels – considerations that differaccording to the level that one works with.
These differences can be demonstrated usingimplementation as an example. While allanalytical levels demand an identification of theinstitution that is responsible to implement anysuggested mitigating measures or other actionsthat may come out of the monitoring results, theprocess for the identification may differdepending on the level of analysis. For example,at the local level, the actors may be easilyidentified, and the responsibilities among themclearly stated. However, at the internationallevel, the identification of such responsibilitiesmay be extremely sensitive since the willingnessto carry out change must come from within theindividual countries. No internationalmonitoring body can thus declare the variouscountries’ respective responsibilities.
INTERNATIONAL LEVEL
The international level is in general more“political” than the other levels. This expressesitself through considerations such as the needfor consensus on the importance of issues tomonitor and the selected indicators, theimportance of global institutions to take the leadand structure the development of an indicatorset or an index, and the sensitivity amongcountries in international comparisons. Thelatter is commonly an objective of internationalinitiatives. Two other common features ofinternational initiatives are the inclusion ofglobal indicators (for example, emission ofgreenhouse gases and ozone depletion), andthat the indicators are of the type that monitorprogress or degeneration of variousenvironmental aspects (thus they focus onenvironmental themes as opposed to aspects(pressure, state, impact or response) ofenvironmental problems). For a briefintroduction to an international initiative andthe challenges it met, see Box 7.
REGIONAL LEVEL
The regional level is quite similar to theinternational level since it still involves anumber of different countries. Consensus on thevarious issues to monitor and the indicatorsselected is therefore still of importance. Theprocess of determining consensus can form thebasis for conflict resolution (both in relation toissues and indicators, and to “losers andwinners” of possible changes in currentpractices). In addition, the monitoring oftenaims at establishing trends of progress ordegeneration. However, there are otherpossibilities as well. At the regional level,indicators can also be used to ascertain causallinks for issues that are relatively well analyzed.For such issues, and also for areas which arewell defined, the objective can be to monitor

27Environmental Economics Series
Practical Aspects
outputs and impacts of certain activities in thearea (that is, the project based framework can beused). Another difference between theinternational and the regional level (as well asthe other, more disaggregated levels) is thepossible focus on aspects (driving force,pressure, state, impact or response) of
environmental problems instead ofenvironmental themes.
NATIONAL LEVEL
As soon as the initiative is at a less aggregatedlevel, such as at the national level, theconsiderations differ a lot more. For example,
Box 7International Collaboration on Sustainable Development Indicators
Developing sustainable development indicators at an international level can not be categorized as an easytask. In 1996, the Development Assistance Committee of the Organization for Economic Co-operation andDevelopment initiated such an effort, the indicators for the then called International Development Goals (IDGs)initiative, inviting the United Nations, the World Bank and the International Monetary Fund to become part-ners. Over the four years that followed, five working groups discussed indicators for issues such as poverty,education, gender, infant and child mortality, maternal health, HIV/AIDS, malaria and other diseases, envi-ronment, and global partnership.
At a later stage, the name of the targets changed from the IDGs to the MDGs (the Millennium DevelopmentGoals). Each goal has a number of targets identified, which are more specific in their character. The targets forenvironmental sustainability and regeneration are: i) Integrate the principles of sustainable development intocountry policies and programmes and reverse the losses of environmental resources; ii) halve, by 2015, theproportion of people without sustainable access to safe drinking water; and iii) have achieved, by 2020, asignificant improvement in the lives of at least 100 million slum dwellers. The working group on environmen-tal indicators agreed on nine indicators to be included in the set of indicators to monitor the MDGs:
• Proportion of land area covered by forest
• Ratio of area protected to maintain biological diversity to surface area
• Energy use (kg oil equivalent) per $1 GDP (PPP)
• Carbon dioxide emissions (per capita)
• Consumption of ozone depleting CFCs (ODP tons)
• Proportion of population using solid fuels
• Proportion of population with sustainable access to an improved water source, urban and rural
• Proportion of urban population with access to improved sanitation
• Proportion of population with access to secure tenure (owned or rented)
The nine indicators were selected according to a number of selection criteria, of which the most importantwere that they captured important environmental problems, were relevant for the majority of the countries in the world(including developed countries), and that data were available (collection of new data was beyond the scope ofthe project). Furthermore, there was a limit to how many environmental indicators could be included in thetotal set of indicators for the MDGs.
The core set of indicators will be used—at a global level—to monitor performance and adjust developmentstrategies as required. The World Development Indicators published annually by the World Bank, will reporton the nine core indicators, making the information accessible world wide, and putting it in the front of theWorld Bank’s priorities in its collaboration with other international partners.
Source: World Bank 2002.

Environment Department Papers28
Indicators of Environment and Sustainable Development — Theories and Practical Experience
consensus may not be as important as the issuesthat are relevant for the development of thecountry. The national level initiatives are alsomore practical in their approach. Activities suchas involvement of different national institutionsand organizations, survey of national databases, focused initiatives with regard to datacollection and indicator development, surveysof information needs, and investigations inwhat decision-making processes that are notwell supported by good quality information aretherefore commonly in focus.
LOCAL OR PROJECT LEVEL
At the local or project level the initiatives becomeeven more practical and action oriented. At this
level, the initiative can really benefit fromincluding a phase in which actions andrecommendations on measures to implementare a central part. At the local level, the causallinks are more easily ascertained, data collectionand indicator development are built into theproject and the monitoring objective is usuallyto identify outputs and impacts.
It is not always only one analytical level that isof importance for an initiative. To begin with,for example, a regional analysis and thencontinue to look at the details on a national oreven local level can be very helpful. For suchinitiatives, flexibility is a central feature. Figure8 depicts an example of a framework used in
Figure 8. Connecting the different analytical levels
Source: Segnestam and others 2000.
Indices
(components)
Indices
(issues)
Pressure, State, Impact, Response indicators
Complementary
indicators
(components)
Complementary
indicators
(issues)
Core indicators
(components)
Core indicators
(issues)
Regional and national level
National level
National and local level

29Environmental Economics Series
Practical Aspects
the CIAT-World Bank-UNEP collaborativeproject on indicators for rural sustainability inCentral America. Many of the considerationsmentioned above are included in thisframework. The work with this frameworkstarted at the regional level where the issues tobe covered by the initiative were discussed andagreed upon. Depending on the audience andsituation, the indices and indicators can also bestructured according to aspects ofenvironmental problems. In the project, thisapproach was demanded in order to enabledecision-makers to separate, for example, allpotential underlying causes from all observedimpacts. In addition, since the project dealt withrural sustainability, the project allowed the userto sort the indicators according to components(social, economic and environmental) and theirinteractions (socioeconomic, socio-environmental and economic-environmental).
Owing to this flexibility, various users atvarious analytical levels can find a use of theindicator initiative. The indices developed at theregional level can guide the regional decision-making, but it can also suggest what the
national decision-makers should focus theirinvestigations on. Finally, where available, locallevel data can help support in more detailvarious decisions and policy changes madebased on the indicators included in the project.
Tools for Presentation and Analysis
When the indicators have been selected using anumber of stringent selection criteria, it is timefor collection, and finally analysis andpresentation. Given the role of indicators as abasis for analysis, improvements in policy-making, and in informing and educating thegeneral public as well as societies’ decision-makers, the tools and manner used for analysisand presentation are important. There are manymethods of presentation of indicators that canbe used: textual presentations, graphs,numerical presentations, tables, and maps aresome examples. In addition, it can beadvantageous for the analysis to usecomparators, baseline values, thresholds, and/or targets (for a summary of the use ofbaselines, thresholds, and targets, see Table 3).
Table 3. Baselines, thresholds, and targets
For which activity When to use… How to establish…
Baseline For any activity whoseimpacts one wishes to follow
To monitor environmentalchanges (positive or negative)due to an activity
When used for monitoringenvironmental change:establish baseline at initiationof activity.
When used to illustrate totalenvironmental change: setbaseline at zero.
Thresholds To control an activity thatmay have a negativeenvironmental impact
To monitor negative impactswhich should not exceed apre-determined threshold
Establish threshold throughdetermining the carryingcapacity of the system.
Targets For activities which aim toimprove the state ofenvironment or sustainabledevelopment
To mo nitor that positiveenvironmental impacts of anactivity are sufficiently large
Establishment depends on theobjective of the activity.

Environment Department Papers30
Indicators of Environment and Sustainable Development — Theories and Practical Experience
Analytical aids
BASELINES
For any indicator to be meaningful, eitherbaselines, thresholds and/or targets for theindicators need to be established. A baseline is avalue that is determined before an indicatorinitiative starts in order to show a positive ornegative environmental change as a result of anintiative. Without a baseline, the indicatorvalues detected as the monitoring continues cannot be compared to anything meaningful; it isnot possible to say whether things haveimproved or become worse. It is then difficult toestablish what kind of impact an activity hashad, or what kind of changes are occurring in aregion, country, or area.
If the project’s objective is not about improvingthe environmental conditions, but rather aboutanother development initiative which needs tobe monitored so that it does not degrade theenvironment, the baseline is best establishedthrough the monitoring of the project area at theinitiation of the project (to establish the currentstate of environment). The same method toestablish the baseline is used in those initiativesthat wish to illustrate how that state ofenvironment is improving. For those indicatorinitiatives that have as their objective toillustrate how the state of environment haschanged in total, the baselines are established aszero (for example, extent of protected areas ortotal CO2 emissions).
It can be worthwhile to point out that, for theinterpretation of the change within the area tobe correct, the baseline may not be enough tocompare with. To be able to determine whether,for example, the project was the best alternative,the resulting values should be compared to thealternative development scenarios. That is, thealternative development path for the monitored
area without the project may not have been apath of non-existing change. Whatever wouldhave happened in the area without the projectshould therefore be kept in mind during theinterpretation of the monitoring result.
THRESHOLDS
For some monitoring systems the establishmentof thresholds may be of even greater importancethan that of baselines as a tool for analysis.Thresholds are useful in initiatives that do notnecessarily have environmental improvements,or sustainable development, as their mainobjective. Instead, there may be possiblenegative impacts on the environment or thedevelopment could in some other way beunsustainable, and thresholds should thereforebe included for those aspects. This is, forexample, true for a monitoring system that isbased on alarm and diagnostic indicators asdiscussed above in Box 3. Without such levels,there is no way of knowing when the alarmsounds or when to react to what the indicatorreveals. As a result of years of research, suchthresholds already exist for several indicators.However, there are still many indicators that arenot currently being monitored in the world, andthresholds therefore need to be establishedbefore those indicators become meaningful.Those thresholds should be established in anobjective manner so that the currentmanagement practices and resource uses can berelated to them.
TARGETS
The use of targets is very similar to the use ofthresholds. However, targets are used toimprove the state of environment throughactions such as improved natural resourcemanagement, reduced pollution levels, orincreased institutional efficiency. In short,targets are useful in initiatives that have

31Environmental Economics Series
Practical Aspects
environmental or sustainable developmentimprovement as one of their objectives.Performance indicators are used to monitor theprogress towards these targets. The MillenniumDevelopment Goals, as developed by the worldcommunity, are an example of such targets.Each of the eight areas monitored (poverty,education, gender equality, infant and childmortality, maternal health, HIV/AIDS, malariaand other diseases, environmentalsustainability, and global partnership fordevelopment) has a related development goalestablished. In addition, each of the indicatorsused for the monitoring of the areas hasindividual goals. For many of the most commonindicators at the national, regional andinternational levels, targets already exist in theform of international commitments orconsensus. Examples include the World HealthOrganization’s guidelines on availability of safedrinking water and water for sanitary means ofexcreta disposal (WHO estimates this amount to20 to 40 liters of water per person per daylocated within a reasonable distance from thehousehold (WHO, 1996)) or the WorldConservation Union’s target for protected areas(10 % of a country’s surface). Other targets arebest determined through the monitoring of an“unspoiled” part of the monitoring area, or evenof another area (if it seems likely that the areathat is to be monitored already has beenchanged from its original state).
COMPARATORS
While baselines, thresholds and targets can beseen as a sort of comparator—the result ofmonitoring the indicator is compared to apredetermined baseline, threshold or target forthat indicator—the concept of comparators ismuch wider than that. Comparators belong tothe most basic but important tools forfacilitating indicator analysis. In order to decide
which comparator to use and what it shouldlook like, the indicator which one wishes toanalyze needs to be thought about. The firstchoice for this number is whether to present itas a relative or absolute number. The differencebetween the two is easily illustrated by theindicator “protected areas.” If the number ofhectares of protected land in a country ispresented—for example 47,000 hectares inArgentina—it probably does not say much tomost people. If, on the other hand, the hectaresof protected land are compared to the total landarea, the interpretation of the indicator issimplified as it can now be expressed as 1.7%protected land of total land area. For somepeople, this may still not say much—is this asmall or a large share of protected land? Toanswer that question, a comparator is necessary.
The comparator should, quite clearly, bepresented in the same way as the originalindicator, that is as an absolute or relativenumber. The assessment of what comparator touse can further highlight the relative use ofthese two types. For example, if the absolutenumber of protected hectares discussed above iscompared to the regional average of protectedhectares, the extent of biodiversity protection inArgentina would not be well illustrated. Themain reason for this is that some countries areso much larger than others—the number ofprotected hectares in Argentina can therefore bemuch higher than the protected hectares inanother smaller country, even if the latter hasprotected a larger share of its land.
If, on the other hand, the relative number ofprotected hectares is compared to the regionalaverage (7.3%) or the average of the incomegroup that Argentina belongs to (5.7%), thepicture becomes a lot clearer—Argentina isprotecting a relatively small share of its land.These types of considerations are taken into

Environment Department Papers32
Indicators of Environment and Sustainable Development — Theories and Practical Experience
Argentina*
Latin America & Caribbean
Argentina LAC RegionUpper middleincome group
Population (millions)
Urban population (% of total)
GDP ($ billions)
36
89.3
298
502
74.5
2,028
588
76.6
2,838
Agriculture
Land area (,000 sq.km)
Fertilizer consumption (100 grams/ha of arable land)
Population density, rural (people per sq.km)
2,737
333
16
20,064
812
253
21,777
928
188
Biodiversity
Nationally protected area (% of land area) 1.7 7.3 5.7
Water and sanitation
Access to safe water (% of total population)
Fresh water resources per capita (cubic meters)
Access to sanitation in urban areas (% of urban population)
65
27,865
80
..**
27,393
..
..
..
..
account in indicator publications such as theWorld Development Indicators, World ResourcesReport or The Little Green Data Book whichpresent some of the indicators as absolutenumbers and some as relative (see Table 4).
A second choice concerns the actual comparator.This is very much an issue of the message thatthe indicators are supposed to convey. In somecases, like in the case of some Argentineanindicators, a comparison with most of the othercountries in the region may work more as anexcuse not to work on the issues monitoredsince the Argentine values look above average(for example, Argentina’s annual freshwater useis 2.8% of its total resources compared to 3.6% inChile). In that case an average for a couple ofdeveloped countries may be more useful ascomparators since Argentina is relatively highlydeveloped for its region (using the same
example as above, Canada’s annual freshwateruse is 1.6% of its total resources). However, oneshould keep in mind to select comparators thatare relevant, that is comparators that face moreor less the same circumstances.
Presentational and analytical tools
CHARTS, GRAPHS, TABLES, AND TEXT
One purpose of comparators is of course to beable to compare countries, regions or incomegroups with each other. Nonetheless, careshould be taken not to end up in a situationwhere a country, for example, feels the need todefend itself rather than taking the comparisonas a help in achieving a necessary change.Another reason to be cautious with comparisonsbetween countries is the variations inmeasurement and monitoring methodologies,and definitions (OECD 1994). A lack of
Table 4. Comparators in The Little Green Data Book
Notes: *The indicators listed here are a selection of those included in The Little Green Data Book.** �..� � No data available.
Source: World Bank 2000.

33Environmental Economics Series
Practical Aspects
standardization in such matters risks resultingin unfair and incorrect comparisons. Lists andtables such as the ones used in the Little GreenData Book easily invite people to rank countriesand to make judgement on the countries that arelowest on the list. To avoid this, a number ofvisual tools can be used. One such example isthe “indicator diamonds” used in the WorldBank’s Country-at-a-glance tables or in the workwith the Millennium Development Goals (seeBox 7). Figure 9 gives an example of this. Eventhough the individual countries’ successes (orfailures) in reaching the goals can be compared,this type of presentational tool makes theviewer focus more on the progress towards thestandards for each country than to comparethem with each other. Another way to avoiddirect ranking is the use of quintiles. Thisenables a comparison between groups ofcountries, but the individual countries are notexposed.
A graph such as the data diamond is one toolfor presenting indicators so that analyses and
assessments are facilitated. The assessments arefurther facilitated if the diamonds are designedin such a way that an expansion (or reduction)is unambiguously positive (or negative, that is,a trend outwards is positive/negative) for eachof the selected indicators. Other tools includeother types of graphs and charts, tables, mapsand text. Which tool one should use depends alot on the type of indicator, the aim of thepresentation and the audience. For example,text is best used when an indicator is qualitativeand not quantitative. Text is sometimes alsobetter when the audience are non-experts. Themessage that an indicator conveys may not bethat clear to the general public if presented as alist of numbers.
Graphs and charts are also commonly usefulwhen presenting monitoring results to anaudience that is more interested in the overallmessage than in the details that the numberscan provide. They are per definition a visualtool and may, as such, be more communicative
Figure 9. Indicator diamonds as a tool for presenting the results � The example of Sub-SaharanAfrica
Note: Baseline consists of data from 1990.Source: OECD 2000b.
XX
X
X
X
Baseline
Latest
GoalXIncidence of extreme poverty
Population with
access to safe water
Replacement fertility rate Under 5 mortality rate
Literacy rate (15-24 year olds)

Environment Department Papers34
Indicators of Environment and Sustainable Development — Theories and Practical Experience
than a table. Tables, on the other hand, providethe user with more control over the numberspresented. Quality control is thus better enabledas are further analyses based on the numberspresented. There may also be a practical reasonfor using tables as they demand much less spacein their presentation if several countries orregions are to be included.
MAPS
One final tool for presentation and analysis ismaps. Maps can be powerful as an analyticaltool if used in the right context in a correct way.They are created either with the help of remotesensing, that is satellite images which give apicture of various aspects, for example forestareas, or with Geographic Information Systems(GIS). GIS is a computer-based system in whichdata (collected through any of the methodsdiscussed above) are fed and mapped. It iscommonly more useful for sub-national level
data since data on a national level only resultsin a map covered in one color. At such a level,the analytical contribution of GIS does not differfrom that of a graph. If data are available at aless aggregated level, however, analyses fordifferent areas within a country, for example,are enabled. Take an indicator of deforestationas an example. If the data of deforestation areonly available as one number for a wholecountry, it is not easy for a decision-maker todirect any reforestation actions since it is notclear where in the country deforestation isoccurring. If, on the other hand, data areavailable at a sub-national level, a map canillustrate where the actions are needed.
The main advantage with maps is probably thatthey allow several indicators to be analyzed atthe same time in an illustrative and easilycomprehended way. One example of overlayingof indicators is presented in Figure 10. Two
Figure 10. Maps as a presentational and analytical tool
Source: Segnestam and others 2000.
Broadleaved Forest
Coniferous Forest
Mixed Forest
Fire Incidents 1993

35Environmental Economics Series
Practical Aspects
Advantages Disadvantages
• An extremely visual tool for easycommunication between developers and users
• The only good tool for overlaying differentindicators to enable analysis of several possiblyinterrelated aspects
• GIS facilitate the superimposition and analysisof large amounts of data from different sources,simplifying the identification and analysis ofpotential interrelations between causes andeffects of rural sustainable development issues
• GIS enable the incorporation of, for example,socioeconomic, environmental, and sustainabledevelopment considerations intodecisionmaking
• GIS visualize data, indicators, and informationat different analytical levels (regional, national,or local)
• Significant spatial samples for indicators, orimpartial averages for a geographicallydistributed sample of measures, can be obtainedwith the help of the geostatistic analysiscapacity of GIS.
• The quality of underlying data risk become lessapparent (a map looks more “real” than data ina table)
• Data quality control is made more difficult sincethe data are “hiding” behind the map and arenot always accessible to the viewer
• Working with GIS demands resources in termsof money and competent personnel
• Maps may lead the user to think there are causallinks that in reality may not exist
• A map is not able to show a relationship wherethe cause of a problem cannot be found withinthe same area as the impact (for example, thelogging of tropical timber: the cause of theproblem may lie in the demand from developedcountries, while the deforestation problemoccurs in developing countries). A table incomparison can be more flexible in includingdata from different parts of the world.
different indicators have been included in thesame map—forest type and fire incidents. Ifthese two indicators would be presented in atable, or two separate graphs, it would bedifficult to assess their interrelationship.Presented in a map, however, it is easier tovisualize this relationship. Figure 10 shows howfire incidents in Honduras are more common inthe areas that are not covered by forest.
Even though the use of GIS and the resultingmaps can be very powerful both in theirpresentation and as an analytical tool, there area number of aspects that any user should beaware of and cautious of. A summary of theseaspects as well as of the main benefits of GIS ispresented in Box 8.
Dissemination of Findingsand Information
The participation of decision-makers and thepublic is necessary for the indicators to becomeuseful. Without that participation, indicatorswill remain only a resource to be used.Participation can be achieved in many differentways. What method to select and use dependson various aspects such as the level of desiredparticipation (only information sharing or activeparticipation), desired impact of indicators(increased knowledge or increased use ofinformation), who the audience is (generalpublic, technical experts or policy-makers), andavailable means of dissemination.
Box 8The Good and Bad with Geographic Information Systems
Source: Adapted from Segnestam and others (2000).

Environment Department Papers36
Indicators of Environment and Sustainable Development — Theories and Practical Experience
Web sites, CD-ROMs and publications belong tothe more common dissemination tools usedtoday. Both have the potential and advantage ofreaching many. If the technology is there, thereis hardly any tool that is as easily accessible andflexible as a web site. A CD-ROM as the onedeveloped in the CIAT-World Bank-UNEPproject on rural sustainability indicators forCentral America (CIAT et al., 2000) is anothertool with which data and indicators as well asvarious presentational instruments can bedisseminated. If the technology is lacking, onthe other hand, hard copies of findings,experiences and help are useful. For less“formal” information transfer, means such asposters, brochures, flyers and postcards havebeen used by various organizations.
These tools can also be used in a moreinteractive manner. Training material and
courses can be developed for the Internet aswell as for use in a classroom. What type oftraining one uses depends a lot on theaudience—a decisionmaker may be in greaterneed of general information on the use ofindicators while a technical expert commonlyneeds more support in the use and developmentof indicators and information. Considering this,individual training sessions with technicalexperts may result in greater impact.
No matter what the purpose of dissemination orwho the audience is, some thought should beput into how to best convey the message toachieve the desired result. Several of the mostcommonly used and most effective tools ofpresentation have therefore been presented inthe previous section.

37Environmental Economics Series
4Lessons Learned and Suggestionsfor Future Activities
Work on environmental and sustainabledevelopment indicators have, in many ways,come a long way in a few years time. However,as always when a new area of research is“discovered” and pursued, some aspects of thework has come much further ahead than others.Hence, there are still large knowledge gaps inthe field of environmental indicators, andperhaps even larger in the area of indicators ofsustainable development. Below follows adiscussion in a summarized form on a selectednumber of these gaps as linked to some of themain lessons learned.
Theoretical Gaps — Do They Exist?
Over the years, the conceptual developmentbehind environmental indicators has come far.The discussions continue on what framework touse, or which selection criteria, but on thewhole, the stakeholders (technicians as well asdecision-makers) seem to agree on what hasbeen developed so far. None of the frameworkspresented in this paper is perfect, butconsidering the diversity of contexts, issues,circumstances, and conditions that are relevantto take into account when monitoring theenvironment, it may not be feasible to develop abetter framework than those existing. Animportant lesson learned is to select among theexisting frameworks carefully depending on theissue analyzed and the level of analysis.
For the choice of selection criteria, the mostimportant advice is to be selective. Indicators areall about indicating a change or direction ofdevelopment, not about providing the completeanswer.
Making the Instruments Work for You
In the same manner indicators should be usedas an instrument to achieve higher ends, theinstruments commonly related to indicatordevelopment discussed in this paper should beused as effectively as possible. Here, the lessonlearned is: be flexible. The usefulness of theinstruments depends on aspects as diverse asdata quality and availability to the message thatone wishes to convey. The different tools andinstruments also differ in how far they havecome in their development and what there isleft to do:
• That the understanding of the role andpurpose of baselines, thresholds and targetsis increasing is clear. However, the practicaluse of the same needs to be taken farther.Targets for environmental indicators in aninternational context are still commonlylacking (for example, forest cover).
• The use of comparators in indicator work isbecoming almost as common as the use ofindicators themselves. However, the senseof what comparator to use when needs to befurther refined.

Environment Department Papers38
Indicators of Environment and Sustainable Development — Theories and Practical Experience
• GIS is becoming very well developedtechnologically. The problem here is one ofdata quality and availability. In addition, formany countries in the world a well-developed use of GIS would require quite alot in terms of infrastructure development.The use of tables, charts, graphs and textshould therefore be emphasized also in thefuture. Their relative disadvantage to GIS incomparing relating, or “over-lapping”,several indicators should, however, behighlighted.
Understanding the Link between Actionsand Impacts
The link between cause and effect is still amystery in many analyses. While indicators canbe used to understand this link, many initiativestoday seem to assume causal links that may ormay not exist. In many cases, it is also difficultto establish the links clearly. This is, forexample, a common problem with the projectlevel framework discussed in this paper. Whilean observed output is easy to relate to theinvestments made and actions taken within thesetting of the project, long-term impacts of thesame investments or actions can be difficult toidentify. Observed impacts can also be difficultto link to the project. The same analyticalproblems are often encountered in other typesof initiatives where the purpose of theindicators is to see how one action leads, ordoes not lead, to an observed impact. Moreresearch on causal links are clearly needed, andindicators could be used in a more explicit wayin that research.
From Green to Multicolored — The Issueof Complexity
There are groups of indicator initiatives thatneed more focus in the future such as those that
emphasize gaps in existing indicator sets ofenvironmental aspects, including indicators ofinstitutional development, biodiversity andvarious cross cutting issues (for example,environment and poverty, environment andgender, environment and conflicts). Among theindicator initiatives that focus on cross cuttingissues and that need special attention are thosethat emphasize sustainable development as opposedto environmental sustainability or change.
For many years, the concept of sustainabledevelopment has in many publications andcontexts been used almost as a synonym toenvironmental sustainability or change.Indicators could potentially play an importantrole in widening the concept again to comprisesocial, economic, and environmental issues ininterplay. Several initiatives of this sort arealready underway. However, two lessonslearned are that these initiatives are either toocomplicated to communicate, or do not manageto link the various components properly. Anycomposite indicator (or index) of sustainabledevelopment is likely to become complicatedconsidering the nature of the concept ofsustainable development. One suggestion forfuture activities could therefore be to focus moreon the interlinkages between social, economic andenvironmental aspects, that is to analyze thelinkages between those aspects in the indicatorinitiatives which encompass indicators of allthree sorts. GIS could potentially be a powerfultool in such analysis.
An analysis of the interlinkages puts the issue ofsustainability in the center. Most indicator setsof sustainable development consider a positivetrend being sustainable. However, before thetargets have been set according to carryingcapacity (global, regional, national or local), it isdifficult to establish what is sustainable. This

39Environmental Economics Series
Lessons Learned and Suggestions for Future Activities
problem also needs to consider the issue ofweighting the indicators against each other—can the development be sustainable if oneindicator shows improvement and anotherdeterioration?
Before any refining of the indicator workrelevant to sustainable development will mirrorthe state of the world, the gaps in existing setsneed to be filled. An emphasis on indicators of,primarily, institutional development,biodiversity and cross-cutting issues would helpfill these gaps. Such an emphasis deals withdifferent aspects depending on the issue. Forexample, the primary problem to overcome inthe development of indicators of institutionaldevelopment is probably the aspect of causallinks and quality assurance. For biodiversity, itis more a financial aspect that plays a role—theideal indicators have in many cases beenidentified, but it costs a lot to develop andmaintain them. For the cross-cutting issues, themain missing aspect sometimes seems to becreativity. Many indicators, such as those ofenvironmental vulnerability and accessibility to,for example, protected areas, have beendeveloped, but perhaps not been put in thecontext of poverty, gender or conflicts.
Pushing the Practical Envelope
The largest gaps in current indicator workprobably consist of the practical challenges thatstill need to be met and solved. One of thesegaps has been stressed before, but is worthrepeating—data collection and qualityassurance are among the largest challenges thatindicator developers face. Future work withinthis area could focus on a number of thingsdepending on the level of development in theindividual countries. In some countries, supportmay be needed to establish statistical offices in
general; in others a special focus onenvironmental statistics may be what is lacking.Many countries that are already collectingenvironmental statistics would benefit from areview of what kind of statistics they shouldspend their resources on. The purpose ofcollecting data needs to be considered more ingeneral since that is what guides, to a largeextent, the type of support and developmentneeded. For example, if the purpose ofcollecting data is to develop indicators that areinternationally comparable, efforts oncontinuous monitoring, analysis, harmonizationand quality assurance are needed.
Another necessary step into the practical worldof indicators is to interpret the collected anddeveloped indicators, to transform this intoinformation, and to use that information toimprove decision-making processes. Currently thereis a risk of indicators becoming the tool thatnever left the desk of developers and technicalexperts. To take this step, several of the abovesuggested actions need to be taken. However, afew selected and well-analyzed pilot studies ofhow indicators have, or could be, used to createinformation to base decisions on, could furtherhighlight existing knowledge gaps and functionas support for future initiatives. While theUNCSD-initiative has carried out tests in 22countries, the focus has been mainly onmonitoring progress on sustainabledevelopment strategies, policies and activities(UN, 2000; Pretorius et al, 1998). Similar teststudies on indicators as a basis for decision-making would be of equal value. Such teststudies do not have to be carried out at anational level or in several countries. Analyticalexamples of indicator and information usecould be performed at any level of analysis inbasically any context and still contribute withseveral helpful hints on practical solutions onhow to achieve the greatest results.

Environment Department Papers40
Indicators of Environment and Sustainable Development — Theories and Practical Experience
Listening to the Audience
A final lesson learned and recommendation forfuture practical work with indicators is toremember that different audiences, contexts,and ends need different indicators. Targetgroups for the indicator initiatives are seldomdiscussed explicitly. This risks resulting in anaim to identify conceptual frameworks,indicators, and analytical/presentational tools
that are relevant to all different categories ofaudiences. Such an aim commonly fails inreaching several target groups, and one is oftenbetter off designing different indicatorinitiatives for different target groups. Therefore,make sure you know your target group, whythey wish to use indicators and for what beforedeciding on framework, indicators, andanalytical and presentational tools.

45Environmental Economics Series
Appendix AOutputs of the World Bank’s EnvironmentDepartment’s Work Program
CIAT, World Bank & UNEP. 2000. Indicadores desustentabilidad rural: Una vision para AméricaCentral. CD-ROM. The World Bank:Washington DC; CIAT: Cali, Colombia;UNEP: Mexico City.
CIAT, World Bank & UNEP. 2000. DevelopingIndicators: Lessons Learned from CentralAmerica. Poster. Part of publication packageon rural sustainability indicators for CentralAmerica.
Chinese State of Environmental ProtectionAdministration. 1999. China UrbanEnvironmentally Sustainable DevelopmentIndicator Handbook: The Case of Sanming andYantai. Prepared by the China SustainableUrban Development Indicator Project Team,China Environmental Science Press.
Hamilton, K. 2000. Genuine Saving as aSustainability Indicator. EnvironmentDepartment Papers, No. 77. The WorldBank: Washington, DC.
Hazell, P., Chakravorty, U., Dixon, J.A., & Celis,R. 2001. Monitoring Systems for ManagingNatural Resources: Economics, Indicators, andEnvironmental Externalities in a Costa RicanWatershed. EPTD Discussion Paper No. 73.IFPRI & the World Bank: Washington, DC.
Henninger, N., Hammond, A. 2002.Environmental Indicators Relevant toPoverty Reduction. Environment StrategySeries No. 3. The World Bank: Washington,DC.
Kunte, A., Hamilton, K., Dixon, J. & Clemens,M. 1998. Estimating National Wealth:Methodology and Results. EnvironmentDepartment Papers, No. 57. The WorldBank: Washington, DC.
Linddal, M. in collaboration with Winograd, M.,Aguilar, M. & Farrow, A. 1999. Forest SectorIndicators: An Approach for Central America.The World Bank: Washington, DC.
Segnestam, L. 2001. Indicators for a PolicyRelevant Monitoring System Hazell, P.,Chakravorty, U., Dixon, J.A., & Celis, R.2001. Monitoring Systems for ManagingNatural Resources: Economics, Indicators, andEnvironmental Externalities in a Costa RicanWatershed. EPTD Discussion Paper No. 73.IFPRI & the World Bank: Washington, DC.
Segnestam, L. 1999. Environmental PerformanceIndicators, A Second Edition Note.Environment Department Papers, No. 71.The World Bank: Washington, DC.
Segnestam, L. in collaboration with Winograd,M. & Farrow, A. 2000. Developing Indicators:Lessons Learned from Central America. TheWorld Bank: Washington, DC.
Shyamsundar, P. 2001. Poverty-EnvironmentIndicators. Environment DepartmentPapers, No. 84. The World Bank:Washington, DC.
Winograd, M., Aguilar, M., Farrow, A. &Segnestam, L. 2000. Conceptual Framework forthe Development and Use of Water Indicators.The World Bank: Washington, DC.
(For more information visit http://www.worldbank.org/environmentaleconomics)

Environment Department Papers46
Indicators of Environment and Sustainable Development — Theories and Practical Experience
World Bank. 1997-2002. World DevelopmentIndicators. Development Data Group, TheWorld Bank: Washington, DC.
World Bank. 1997. Expanding the Measure ofWealth. Indicators of EnvironmentallySustainable Development. EnvironmentallySustainable Development Studies andMonographs Series, No. 17. The WorldBank: Washington, DC.
World Bank. 2000. The Little Green Data Book.Development Data Group in collaborationwith the Policy and Economics Team(Environment Department), The WorldBank: Washington, DC.
World Bank, CIAT & UNEP. 2001. RuralSustainability Indicator Project. http://www.ciat.cgiar.org/indicators/index.htm.The World Bank: Washington DC; CIAT:Cali, Colombia; UNEP: Mexico City.
In addition, a number of indicator outputs havebeen part of more general initiatives. Examplesinclude:
Millennium Development Goals — Nineenvironmental indicators were selected as partof the Millennium Development Goals (MDGs).The MDGs are monitored by a number ofeconomic, social and environmental indicatorsthat have been selected through aninternationally collaborative effort. Mainpartners are OECD/DAC, various UN agenciesand the World Bank.
CASE indicators — An indicator page wasdeveloped as part of the Country AssistanceStrategies and the Environment (CASE)initiative for incorporation in the World Bank’sCountry Assistance Strategies;
UN Commission on Sustainable Development —Indicators for the measurement of sustainabledevelopment. The Bank’s EnvironmentDepartment has been part of the expert groupadvising the work on the CSD indicators.
47Environmental Economics Series
Appendix BSelected Examples of other Organizations’ Work
This appendix presents a selected number ofexamples of indicator initiatives from otherorganizations’ work than the World Bank’s.They have been selected since they illustrate thedifferent paths one can choose in developingindices or indicator sets for environmentalaspects and sustainable developmentrespectively. However, it may be worth pointingout that there exist many more initiatives, andthe usefulness of each of them depend entirelyon the context and wish of the user. Therefore,the below presented initiatives should not beviewed as particularly recommended for use inall contexts.
Environmental Indicators
I. Aggregated
The Ecological Footprint. The Ecological Footprintis a method for estimating the biologicallyproductive area necessary to support currentconsumption patterns, given prevailingtechnical and economic processes. Bycomparing human impact with the planet’slimited bioproductive area, this method tests abasic ecological condition for sustainability. TheEcological Footprint calculations have so farincluded land for energy supply, food, forestproducts, and the built environment, degradedareas, and sea space for fishing. For the wasteside the land needed for sequestering CO2 isincluded in the Ecological Footprint. (Holmberget al., 1999)
Pilot Environmental Sustainability Index. The PilotEnvironmental Sustainability Index isconstructed in ahierarchical fashion(see figure to theright). The fivecomponents describethe currentenvironmentalsystems; stresses tothose systems; thevulnerability ofhuman populations to environmentaldisturbances and disasters; the social andinstitutional capacity to respond toenvironmental problems; and globalstewardship, or the degree to which aneconomy behaves responsibly with respect toother economies. These components consist of anumber of factors (for example, urban airquality, air pollution, basic sustenance, scienceand technical capacity, and contribution tointernational cooperation) considered toconstitute the most fundamental building blocksof each component. For each factor, variables(for example, urban NO2 and SO2concentration, SO2 and NO emissions per landarea, percentage of households with electricity,scientific and technical articles per millionpopulations, and number of memberships onenvironmental intergovernmentalorganizations) are identified to serve asmeasures. (World Economic Forum 2000)
ENVIRONMENTALSUSTAINABILITY INDEX
COMPONENTS (5)
FACTORS (21)
VARIABLES (64)

Environment Department Papers48
Indicators of Environment and Sustainable Development — Theories and Practical Experience
Living Planet Index. The Living Planet Index(LPI) is an index which primarily measuresabundance – the area of the world’s forests andthe populations of different marine andfreshwater species. Thus it is essentiallymeasuring natural wealth and, particularly, howthis natural wealth has changed over time. TheLPI is an aggregate of three different indicatorsof the state of natural ecosystems. These are: thearea of natural forest cover around the world,populations of freshwater species around theworld, and populations of marine speciesaround the world. (WWF, NEF & WCMC, 1999)
II. Sets of indicators
OECD core set of environmental indicators. In 1994,the OECD Environmental Policy Committeefinalized the first part of a three-part workprogram. They developed a core set ofenvironmental indicators to be used inenvironmental performance reviews in OECDcountries (all indicators are based on availabledata). The indicators are structured byenvironmental issues, which reflectenvironmental challenges. The list of issuesproposed was never meant to be final norexhaustive, but rather flexible where new issuescan be incorporated or old ones abandonedaccording to their environmental relevance.
Broadly speaking, the first nine issues (climatechange, ozone layer depletion, eutrophication,acidification, toxic contamination, urbanenvironmental quality, biodiversity, landscape,and waste) can be considered “sink-oriented”,dealing with issues of environmental quality,whereas the other issues (water resources, forestresources, fish resources, and soil degradation)are “source-oriented”, focusing on the quantityaspect of natural resources. Not all indicatorscan be directly associated with a specific
environmental issue (for example, populationgrowth or economy-wide environmentalexpenditure). A category of general indicatorshas therefore been introduced in the framework.(OECD 1994.)
Environmental Pressure Indicators. Eurostat (thestatistical department of the EU) has developeda consistent and comprehensive system ofenvironmental pressure indicators. They showthe important trends for ten policy fields: airpollution, climate change, loss of biodiversity,marine environment and coastal zones, ozonelayer depletion, resource depletion, dispersionof toxic substances, urban environmentalproblems, waste, and water pollution and waterresources. The framework used is the Drivingforce-Pressure-State-Impact-Response modeldescribed earlier in this paper. The possibility ofcondensing these indicators into ten indices, onefor each policy field, is being explored. (TAUand EMAIL 2001.)
Material Flows. Because all environmentalproblems are ultimately related to flows ofmaterials, World Resources Institute isdeveloping indicators that capture a picture ofthe material flows through industrialeconomies: industrial minerals, constructionmaterials, metals, chemicals, infrastructure,fossil fuels, soil erosion, renewables, semi-manufactures, finished products, and thehidden flows (WRI 2000). Material flowaccounting can systematically track the physicalflows of natural resources through extraction,production, fabrication, use and recycling, andfinal disposal, accounting for all losses along theway. This technique is motivated by the desireto relate the use of natural resources to thecapacity of the environment to provide thematerials and absorb the wastes. (Adriaanseand others 1997.)

49Environmental Economics Series
Selected Examples of other Organizations’ Work
Sustainable Development Indicators
I. Aggregated
The Genuine Progress Indicator. In 1995,Redefining Progress created a more accuratemeasure of progress, called the GenuineProgress Indicator. It starts with the sameaccounting framework as the GDP, but thenmakes some crucial distinctions: It adds in theeconomic contributions of household andvolunteer work, but subtracts factors such ascrime, pollution, and family breakdown.Because the GDP and the GPI are bothmeasured in monetary terms, they can becompared on the same scale. (RedefiningProgress 1999.)
The Barometer of Sustainability. The Barometer ofSustainability is a tool for combining indicatorsand displaying the results. It presents indicesvisually, providing anyone—from villager tohead of state—with an immediate picture ofhuman ecosystem wellbeing. It can portraychanges in the indices over time and comparethe indices of different societies. TheBarometer’s key features are:
• Two axes, one for human wellbeing, theother for ecosystem wellbeing. This enableseach set of indicators to be combinedindependently, keeping them separate toallow analysis of people-ecosysteminteractions.
• The axis with the lower score overrides theother axis. This prevents a high score forhuman wellbeing from offsetting a lowscore for ecosystem wellbeing (or viceversa)—reflecting the view that people andthe ecosystem are equally important andthat sustainable development must improveand maintain the wellbeing of both.
• Each axis is divided into five bands. Thisallows users to define not just the endpoints of the scale but intermediate pointsas well, for greater flexibility and control ofthe scale. (Prescott-Allen 1999.)
II. Sets of indicators
Indicators of Sustainable Development (UNCSD).At its Third Session in 1995, the Commission onSustainable Development (CSD) initiated thedevelopment of indicators for the measurementof sustainable development. A working list of134 indicators was selected and 22 countriesvolunteered to test their applicability. By theyear of 2001, the aim is to have a standardizedset of indicators available as a tool to measureprogress toward sustainable development. Thistool will be available to all countries in order tosupport high-level decision-makers in theirprocess of defining their national plans towardssustainability. (UNCSD, 2000) For moreinformation on the themes covered by the set,see Table 1.


55Environmental Economics Series
Appendix CHow to Develop a Set of Indicators
Indicator initiatives can, as discussed in thispaper, fulfill many different uses. They can alsobe developed in a participatory or non-participatory manner. The following stepsdescribe the actions taken in the most commonindicator initiatives.3 They also distinguishbetween those needed for a participatoryinitiative, or for the different purposes of theinitiatives (monitoring of progress ordegeneration, monitoring of outputs/impacts,and establishment of causal links).
• Development and harmonization of a frameworkto organize the information. A frameworkneeds to be developed, or agreed upon, tobe able to structure what is to be monitored,the interlinkages between the monitoredaspects, and the identification of possibleactions to influence the observed trends anddevelopments;
• Definition of selection criteria, indicator sets,and analytical methods/tools. For the clarity ofthe initiative as well as to make itcommunicable to various stakeholders,selection criteria need to be established andagreed upon. Based on the framework andthe identified selection criteria, a set ofindicators and indices can be identified. Thetools used in the analysis of the forthcomingmonitoring results are necessary to identifyand develop – without such tools it is notpossible to explore the dynamics andimpact of policies, action, and strategies in
the developmental processes or to identifyand analyze cause-effect relationships;
• Establishment of participatory/consultativenetwork. If a participatory method isdesired, it should be established fairly earlyon in the process. For several types ofprojects (particularly those that aim to affectdecision-making processes at variouslevels), participation of institutions andpeople is crucial for the sustainability of theproject. Activities that have been tried in theestablishment of networks includeworkshops in which goals and needs areidentified and where participatingorganizations and groups can meet, visits tothe various participants to obtainparticipation, harmonize activities, identifycontact people, exchange results, andtraining in indicator development and use;
• Data search and development of databases forthe indicator sets and analytical tools. Afterhaving considered all the conceptualaspects in indicator development, thepractical phase begins. A survey of existingdatabases (availability, production and useof data, unmet needs, and the timing forneeded data can all be included in thesurvey), development of actual indicatorsand indices and the application of theselected analytical tools are part of thisphase. The application of the analyticaltools may have to wait for new data to be

Environment Department Papers56
Indicators of Environment and Sustainable Development — Theories and Practical Experience
collected and, based on that data, indicatorsto be developed;
The following four steps may not be relevant forall kinds of indicator initiatives. Primarily, theyare vital in initiatives which either aim to havean impact on decision-making processes, or thatis more research-based and need to bevalidated.
• Development of capacities and tools to visualizeinformation and analyze cause-effectrelationships. For the information obtainedthrough analyses of the data, indicators andindices to play a role in existing decision-making processes, it needs to be presentedin a way that i) enables analysis of causallinks, and ii) visualizes the results of suchanalyses. If the results are notcommunicable, the information obtained isunlikely to convince any decision-maker tochange current practices;
• Development of test studies for the validation ofproject results. If the fourth step above (‘Datasearch and development of databases forthe indicator sets and analytical tools’) doesnot entail practical work in relation to, forexample, a project, the findings from thefirst steps need to be validated. Withoutsuch validation, the implementation at alater stage may not be feasible and theselected indicators may not be applicable.
The selection of test studies needs to bebased on the purpose of the project. Theyshould also focus on the same analyticallevel as the aim of the project;
• Dissemination of information and tools.Another vital step is the dissemination ofproject results, testing results and the toolsnecessary for the project to be replicable inother parts of the world. Tools fordissemination has been discussed in thispaper, and should first and foremost takeinto consideration the various obstacles andpossibilities faced by various groups andcountries; and
• Design of actions and implementation. Finally,since indicators are only the means to anend, the indicator initiative could include astep of designing actions, mitigatingmeasures and the implementation of thesame. This step is crucial for the success andmeaningfulness of an indicator initiative,but does not have to be part of the initiativeper se. The dissemination of informationand tools can be the step, which triggers thispart even if it is not within the scope of themonitoring initiative. If the indicator projectis well designed, the development of actionsand mitigating measures should followquite easily. The relatively large challengelies in the implementation of the same sinceit demands resources, political willingness,and further monitoring.

57Environmental Economics Series
Notes
1. In this paper, a group of countries are referredto as a region (a region is thus not an areawithin a country). Furthermore, even thougha region as defined in this paper is aninternational area, a distinction is madebetween analyses or initiatives at theregional level and at the international level(meaning analysis and initiatives relevantfor as many countries as possible in theworld). The reason for this distinction is thedifference in how methodologies andpractical considerations matter for the twolevels.
2. The Project Concept Document (PCD)defines the rationale for a proposedinvestment operation and the frameworkfor its preparations, and flags issues or areasof special concern to the Bank. It serves asthe basis for a Bank decision to assist aborrower with project preparation in theearly stages of the project cycle. The PCDlater evolves into the Project AppraisalDocument.
3. The steps in the evolution of an indicatorproject are adapted from Segnestam andothers (2000).


59Environmental Economics Series
References
Adriaanse, A., Bringezu, S., Hammond, A.,Moriguchi, Y., Rodenburg, E., Rogich, D. &Schütz, H. 1997. Resource Flows: The MaterialBasis of Industrial Economies. WorldResources Institute: Washington, DC, USA;Wuppertal Institute: Wuppertal, Germany;Netherlands Ministry of Housing, SpatialPlanning, and Environment: The Hague,Netherlands; National Institute forEnvironmental Studies: Tsukuba, Japan.
Baltic Environment Forum. 1998. Baltic State ofthe New Environment Report based onenvironmental indicators. In collaborationwith Estonian Environmental InformationCentre, Latvian Environment Data Centre,Latvian Environmental Consulting andMonitoring Center, Joint Research Center,Lithuanian Ministry of EnvironmentalProtection. Printing House <<Gandrs>>Ltd.: Latvia.
Bossel, H. 1999. Indicators for SustainableDevelopment: Theory, Method, Applications. AReport to the Balaton Group. InternationalInstitute for Sustainable Development:Winnipeg, Canada.
CIAT (International Center for TropicalAgriculture). 2000. Analysis of NaturalDisaster Vulnerability for Honduras.Powerpoint presentation. The InternationalCentre for Tropical Agriculture: Cali.
CIAT, World Bank, and UNEP. 2000. Indicadoresde sustentabilidad rural: Una vision para
América Central. CD-ROM. The World Bank:Washington DC; CIAT: Cali, Colombia;United Nations Environment Programme:Mexico City.
Economic and Social Commission for Asia andthe Pacific. 1997. Towards Indicators ofSustainable Development in Asia and thePacific. United Nations: New York, USA.
Hammond, A., Adriaanse, A., Rodenburg, E.,Bryant, D., and Woodward, R. 1995.Environmental Indicators: A SystematicApproach to Measuring and Reporting onEnvironmental Policy Performance in theContext of Sustainable Development. WorldResources Institute: Washington, DC, USA.
Holmberg, J., Lundqvist, U., Robèrt, K-H., andWackernagel, M. 1999. ‘The ecologicalfootprint from a systems perspective ofsustainability’. International Journal ofSustainable Development and World Ecology,vol. 6: pp. 17-33.
OECD (Organisation for Economic Co-operationand Development). 1994. EnvironmentalIndicators. OECD Core Set. OECD: Paris,France.
_____. 2000a. Frameworks To Measure SustainableDevelopment. OECD: Paris, France.
_____. 2000b. Development Indicators. Sub-Saharan Africa: Five Dimensions ofDevelopment. http://www.oecd.org/dac/indicators/htm/rcha_ssa.htm

Environment Department Papers60
Indicators of Environment and Sustainable Development — Theories and Practical Experience
Prescott-Allen, R. 1999. System AssessmentMethod. Origins and Key Features. The WorldConservation Union: Washington, DC, USA.
Pretorius, R., Grobler, L., and Moore A., eds.1998. Results From Testing of CSD Indicators ofSustainable Development in South Africa: 1998.Report to the United Nations Commissionon Sustainable Development. Departmentof Environmental Affairs and Tourism:Pretoria, South Africa.
Redefining Progress. 1999. The Genuine ProgressIndicator. http://www.rprogress.org/progsum/nip/gpi/gpi_main.html
Reid, W.V., McNeely, J.A., Tunstall, D.B., Bryant,D.A., and Winograd, M. 1993. BiodiversityIndicators for Policy-Makers. World ResourcesInstitute: Washington, DC, USA.
Segnestam, L. 1999. Environmental PerformanceIndicators: A Second Edition Note.Environment Department Papers No. 71.The World Bank: Washington, DC, USA.
Segnestam, L., in collaboration with Winograd,M., and Farrow, A. 2000. DevelopingIndicators: Lessons Learned from CentralAmerica. The World Bank: Washington, DC,USA.
TAU and EMAIL. 2001. Towards environmentalpressure indicators for the EU – Second edition2000. TAU Consultora Ambiental andEnvironment Management And InformationLiaison: Spain and the Netherlands.
UN. 2000. The CSD Work Programme OnIndicators Of Sustainable Development.Addendum to Report of the SecretaryGeneral on Information for Decision-Making and Participation. E/CN.17/2001/_/Add.1. UN Economic and Social Council:New York, USA.
UNDSD. 2000. Report of the Consultative Group toIdentify Themes and Core Indicators ofSustainable Development. New York, 6-9March 2000. UN: New York, USA.
_____. 2001. Indicators of Sustainable Development:Framework and Methodologies. Commissionon Sustainable Development, Ninth Session,16-27 April 2001. Background Paper No. 3.UN: New York.
UNEP. 1999. GEO-2000. UNEP’s MillenniumReport on the Environment. EarthscanPublications Ltd.: London, UK.
US Interagency Working Group on SustainableDevelopment Indicators,. 1998. SustainableDevelopment in the United States. AnExperimental Set of Indicators. Washington,DC, USA.
Virtual Research and Development Centre.2001. Livestock and Environment Toolbox.http://lead.virtualcentre.org/en/dec/toolbox/homepage.htm
WHO (World Health Organization). 1996. Waterand Sanitation. Fact sheet No. 112. http://www.who.int/inf-fs/en/fact112.html
Winograd, M., Fernandez, N.F., and Farrow, A.1998. Tools for Making Decisions in LatinAmerica and the Caribbean. CIAT: Cali,Colombia; UNEP: Mexico City, Mexico.
Winograd, M., Aguilar, M., Farrow, A., andSegnestam, L. 2000. Conceptual Framework forthe Development and Use of Water Indicators.The World Bank: Washington, DC.
World Bank. 1999. Lesotho. Maloti Conservationand Development Project. Project ConceptDocument. Africa Regional Office, TheWorld Bank: Washington, DC, USA.
_____. 2000. The Little Green Data Book. From theWorld Development Indicators. The WorldBank: Washington, DC, USA.

61Environmental Economics Series
References
_____. 2002. Millennium Development Goals 2002.From the World Development Indicators. TheWorld Bank: Washington, DC, USA.
World Economic Forum. 2000. PilotEnvironmental Sustainability Index. AnInitiative of the Global Leaders for TomorrowEnvironment Task Force, World DevelopmentForum. In collaboration with Yale Center forEnvironmental Law and Policy, and Centerfor International Earth Science Information
Network. Annual Meeting 2000. Davos:Switzerland.
WRI (World Resources Institute). 2000.Developing environmental indicators: Materialsecology. http://www.wri.org/matecology/index.html
WWF, NEF, and WCMC. 1999. Living PlanetReport 1999. WWF International: Gland,Switzerland.