Indicators Are Mixed but Overall Trend Remains Positive
8
January 2012 Issue | 1 January 2012 Indicators Are Mixed but Overall Trend Remains Positive New Jersey The state’s economic recovery continued as 2011 ended and 2012 began. Following November’s strong increases, December saw modest declines in the job numbers, with an overall net loss of 400, including 2,000 in the private sector. Nonetheless, 2011 was the first year since 2007 in which the state recorded gains in overall employment though, as of December, the number of jobs in the state was still 200,000 short of its peak in early 2008. The unemployment rate ticked down to 9 percent last month. As was the case for much of last year, New Jersey’s unemployment rate has stayed high relative to the nation because discouraged workers have started looking for employment and thus get included in the formally counted ranks of the unemployed. The number of New Jerseyans who reported in December that they were at work was 1.9 percent higher than in December 2010. This was the largest rise in this series for any year since 1996. However, even with the 2011 gains there are still almost 150,000 fewer Garden State residents at work than in early 2008. The difference between the figures on the number of jobs in the state and the number of people working is due to several factors: not all jobs in the state are held by state residents, some people hold more than one job, others work out-of-state and the job count does not include agriculture or household employment or the self-employed. Moving into 2012 the Federal Reserve Bank of Philadelphia’s index of local manufacturing conditions was solidly positive in January. The South Jersey Business Survey administered by the Philly Fed which asks members of the South Jersey Chamber of Commerce about general business conditions reached its highest level of the year in the fourth quarter of 2011, more than reversing a third quarter decline. These are both signs the economic expansion is ongoing, and our Garden State Activity index continues to advance. Nonetheless, the unusually mild winter weather could well make some of the numbers for the next month or two look unusually strong. For example the volume of construction will surely be atypically high this winter. Any such abnormal strength would likely come at the expense of gains later in the year. U.S. Economic Outlook The national economy has shown some strength across a number of dimensions. The unemployment rate dropped to 8.5 percent in December, its lowest level since February 2009 and almost a full percentage point lower than the 9.4 percent rate of December 2010. As many have noted, the decline in the national unemployment rate partly reflects very lethargic growth in the labor force (a marked contrast to New Jersey’s experience). Still, job growth has apparently firmed. December’s 200,000 gain in employment boosted the increase in jobs over the twelve months of 2011 to 1.6 million. Since the (Continued on page 2) State and national economies are growing as 2012 starts.
Transcript of Indicators Are Mixed but Overall Trend Remains Positive
January 2012 Issue | 1
January 2012
Indicators Are Mixed but Overall Trend Remains Positive
New Jersey The state’s economic recovery continued as 2011 ended and 2012 began. Following November’s strong increases, December saw modest declines in the job numbers, with an overall net loss of 400, including 2,000 in the private sector. Nonetheless, 2011 was the first year since 2007 in which the state recorded gains in overall employment though, as of December, the number of jobs in the state was still 200,000 short of its peak in early 2008.
The unemployment rate ticked down to 9 percent last month. As was the case for much of last year, New Jersey’s unemployment rate has stayed high relative to the nation because discouraged workers have started looking for employment and thus get included in the formally counted ranks of the unemployed.
The number of New Jerseyans who reported in December that they were at work was 1.9 percent higher than in December 2010. This was the largest rise in this series for any year since 1996. However, even with the 2011 gains there are still almost 150,000 fewer Garden State residents at work than in early 2008. The difference between the figures on the number of jobs in the state and the number of people working is due to several factors: not all jobs in the state are held by state residents, some people hold more than one job, others work out-of-state and the job count does not include agriculture or household employment or the self-employed.
Moving into 2012 the Federal Reserve Bank of Philadelphia’s index of local manufacturing conditions was solidly positive in January. The South Jersey Business Survey administered by the Philly Fed which asks members of the South Jersey Chamber of Commerce about general business conditions reached its highest level of the year in the fourth quarter of 2011, more than reversing a third quarter decline.
These are both signs the economic expansion is ongoing, and our Garden State Activity index continues to advance. Nonetheless, the unusually mild winter weather
could well make some of the numbers for the next month or two look unusually strong. For example the volume of construction will surely be atypically high this winter. Any such abnormal strength would likely come at the expense of gains later in the year.
U.S. Economic Outlook The national economy has shown some strength across a number of dimensions. The unemployment rate dropped to 8.5 percent in December, its lowest level since February 2009 and almost a full percentage point lower than the 9.4 percent rate of December 2010. As many have noted, the decline in the national unemployment rate partly reflects very lethargic growth in the labor force (a marked contrast to New Jersey’s experience). Still, job growth has apparently firmed. December’s 200,000 gain in employment boosted the increase in jobs over the twelve months of 2011 to 1.6 million. Since the
(Continued on page 2)
State and national economies are growing as 2012 starts.
January 2012 Issue | 2
low point in January 2010 about 2.7 million jobs have been created across the nation. That’s a slow pace of growth compared to past expansions. And it leaves the job count a whopping 6 million under its peak. A plausible estimate of the current gap between actual and full employment would be in excess of 10 million jobs. Thus there has been at best only modest progress on the job front.
Other key indicators also showed gains. Some disappointment was expressed about retail sales results in December but combining the sales numbers for both November and December reveals a fairly healthy holiday shopping season. Manufacturing production rose sharply in December after a brief decline in November. In the housing sector, several indicators showed brisk gains in December. While, the level of housing activity remains abysmal and mild weather may have boosted the most recent figures, there are signs that bargain hunters are starting to surface and rejuvenate the markets. The latest round of inflation numbers remains quite low.
Putting all the numbers together the Commerce Department estimates that real GDP rose at a 2.8 percent annual rate in the fourth quarter of 2011. This was a bit lower than forecasters anticipated and is still fairly subdued. But it was the highest such figure since early 2010 and shows that, fortunately, the late summer fears of a collapse into a new recession were overdone.
The combination of continuing high unemployment and low inflation has encouraged the Federal Reserve to say that there is little or no likelihood that interest rates will be increased in 2012 and that the odds are against any increase in 2013. Despite the continuing support of the Fed, there are still risks that unsettled world financial markets and gridlock in Washington could result in another downturn, but it appears the immediate outlook is reasonably favorable.
Real GDP rose at a 2.8 percent annual rate in the fourth quarter

January 2012 Issue | 3
When Resorts International opened the first casino in Atlantic City in 1978 , New Jersey became the only state other than Nevada with legalized land-based commercial gaming. For many years New Jersey and Nevada had the market pretty much to themselves. Now, however, that edge has eroded as thirty seven states offer some form of gaming, including riverboat casinos and slot machines at racetracks and competitive pressure on New Jersey’s casinos has intensified.
Currently there are eleven casinos in Atlantic City, employing around 33,000 people. However, overall activity in the industry has been declining. Employment peaked at close to 50,000 in the late 1990s, and the number of visitors has fallen from about 35 million in 2005 to below 30 million in 2010.Year-over-year winnings for the casinos have also declined over the last five years although the rate of decline slowed in 2011 .
But casinos are still far and away the largest employers in the Atlantic City area and they remain a critical economic engine for Atlantic City and county
with clear spillovers to related industries in the area such as dining, lodging and retailing. They are also an element of the Leisure, Hospitality and Retail industry cluster, which has been identified by the state’s Labor Department as one of the state’s key industry clusters.
In terms of the state’s overall economy, the industry’s impact is less dramatic. The current level of casino employment is barely one percent of New Jersey’s private sector job total and aggregate wages paid to casino workers amount to less than $1 billion a year, or
less than one-half of one percent of state earnings. Nonetheless, casinos do provide many jobs, particularly at the lower end of the wage scale. Although hard to measure accurately, the casino industry also generates thousands of secondary jobs in Atlantic City and other parts of the state through various business spending.
The industry also provides a fair amount of revenue to the state and local governments. During fiscal year 2011, casinos generated close to $435 million in various taxes and fees. The bulk, over $250 million, originated from the 8% gross revenue tax. Taxes collected from casinos equaled around 1.5 percent of the state’s aggregate revenue. The gross revenue tax is dedicated to support programs for New Jersey’s elderly and disabled citizens. Casinos also contributed $44.6 million in investment alternative tax obligations in 2010. These funds are dedicated for reinvestment by the Casino Reinvestment Development Authority (CRDA). Since its inception in 1984, the CRDA has reinvested over $1.9 billion in more than 400 projects that have included housing projects and day care centers around the state as well as casino hotel expansion in Atlantic City.
Casinos are also subject to other taxes and fees dedicated for the Atlantic City Convention Center and other economic development projects in the area. These include the Atlantic City Luxury Tax, Atlantic City Tourism Promo Fee and the Atlantic City Parking Fee that in total yielded over $65 million during the last fiscal year.
(Continued on page 4)
New Jersey’s Casino Industry Local Gaming Has Been Losing Ground to Competitors but still Has a Big Footprint in Atlantic City and Remains a Significant Source of Tax Revenue
1. In 1976, New Jersey voters approved the legalization of casinos in Atlantic City. Resorts International was the first casino to open.
2. The casino industry profile and revenue trends are based on data from sources including the New Jersey Division of Gaming Enforcement, the New Jersey Casino Control Commission, the New Jersey Department of Labor, the Office of Management and Budget and the Casino Reinvestment Development Authority.
Dr. Ranjana Madhusudhan Deputy Director, Office of Revenue & Economic Analysis
Casinos … remain a critical economic engine for Atlantic City and county.
1
2

January 2012 Issue | 4
Although the current size of the revenue stream from casinos is fairly impressive, its decline over the last five years reflects the impact of increased competition that has led to the loss of business in Atlantic City.
The national gaming industry has evolved beyond the well-segmented Atlantic City/Nevada pattern to a fiercely competitive open one. In particular, the opening of new casinos, slot machines and video lottery termi-nals at racetracks in nearby states has clearly diverted business from Atlantic City.
In 2011, Atlantic City was battered by some of the large storms that afflicted the state such as last winter’s series of snowstorms and the damage inflicted by Hurricane Irene. The recession has also likely depressed gaming in the same way it did other recreational activities. At least in the near term a return to more normal weather patterns as well as an improving economy should make the year-over-year comparisons look a bit more favorable.
We may have seen a first indication of that in the latest revenue report, which shows that total casino win increased to $246.5 million in December 2011, up 4.2 percent over the same period a year ago. It marked the highest month-over-month percentage increase since December 2006. In the longer term, the opening of new facilities (most notably the Revel Project) as well as new marketing strategies aimed at strengthening Atlantic City’s non-gaming attractions and making it a more complete tourist destination could stabilize the industry.
The outcome of these efforts will be critical not only for Atlantic City but for the state as a whole. A continuing rapid decline in gaming would pose major problems for the Atlantic City region but it would also weaken an important state revenue stream that supports social and economic development programs.

January 2012 Issue | 5
Business Sentiment Starting to Turn Positive
New Jersey businesses reported generally balanced assessment about current economic conditions and upbeat views about the outlook in December. These findings come from a survey administered by the New Jersey Department of the Treasury.
The New Jersey Business Pulse Survey was created to look beyond conventional economic data and gather views in real time directly from a diverse group of businesses in the state. More than 90 firms spanning a wide spectrum of industries and sizes responded to the December survey. It included 14 questions about current and perspective conditions and allowed respondents to give their views on other topics of their choice. Detailed results may be found at http://www.state.nj.us/treasury/pdf/SurveySummary‐12302011.xls.
General Conditions: Current Situation Balanced While Outlook Is Positive The overall assessment of current conditions has returned to balanced after some months of being generally negative. Approximately one-fifth of the panel saw conditions (either in the U.S. and world economies or in New Jersey) as currently improving, with roughly equal fractions seeing deterioration. Respondents were upbeat about conditions over the next year, with about one-third anticipated some or marked gains in and outside of New Jersey. Less than one-fifth expect conditions to deteriorate in the U.S. and global economies while only one out of ten anticipate a decline in New Jersey conditions over this time.
Revenues, Hiring and Capital Spending: All Systems Are Go Turning to the outlook for their own companies, responses remained heavily weighted toward anticipated gains in revenues, employment, and capital spending, both worldwide and in their New Jersey operations. In
particular, the more upbeat outlook for New Jersey business is markedly better than the November responses for the same questions.
Respondents continue to report some difficulty hiring for open positions in New Jersey, with nearly one-fourth asserting that they have moderate or significant problems filling open slots in the Garden State. While a slightly larger portion deny that they experienced any problems in December locating workers to fill positions in New Jersey, there has been an ongoing significant share asserting problems in locating qualified workers for local jobs.
Product Price Increases Are Uncommon but Input Cost Pressures Continue As was the case in November, only one-fifth of December’s respondents report recent increases in any prices that they charge. More than 70 percent report increased input costs, which is up from November’s share.
Conclusion The December results show continuing gains from November, with respondents reporting stable current conditions and even more optimism about the outlook. The ongoing improvement is consistent with many other local and national surveys, as well as the improvement seen in national economic data as 2011 drew to a close. Open-ended responses continued to cover many topics, with some touching on regulatory issues, but a number of responses were received expressing optimism about the outlook.
The New Jersey Business Pulse Survey has been created to look beyond conventional economic data and gather views in real time directly from a diverse group of businesses in the state. If your New Jersey firm is interested in participating in this monthly survey, please contact Mary Filipowicz at 609-633-6781.

January 2012 Issue | 6
The Garden State Activity Index is our broad measure of monthly economic activity in the state of New Jersey. The index incorporates information from three sources: the Federal Reserve Bank of New York’s coincident index, the Federal Reserve Bank of Philadelphia’s coincident index and the Philadelphia Fed’s South Jersey Business Survey.
In the August 2011 newsletter, we began using principal components analysis to calculate the activity index. This statistical technique systemically constructs weighted averages of the three Fed indicators. The new weighted index should more accurately capture the state of the New Jersey economy.
Based on the most recent monthly data, the state economy continues to grow at a moderate pace; this past December, New Jersey’s economy reached an index level 1.8 percent higher than the level in December 2010.
-Andrew Lai
Data source: New Jersey Department of Labor

January 2012 Issue | 7
(f) - forecast Data source: U.S. Bureau of Economic Analysis
Total Employment (Relative Employment 1990=100)
This chart compares the number of employed workers to the base year of 1990. The number 100 represents employment in 1990.
(Percent change, compound annual rate)
January 2012 Issue | 8
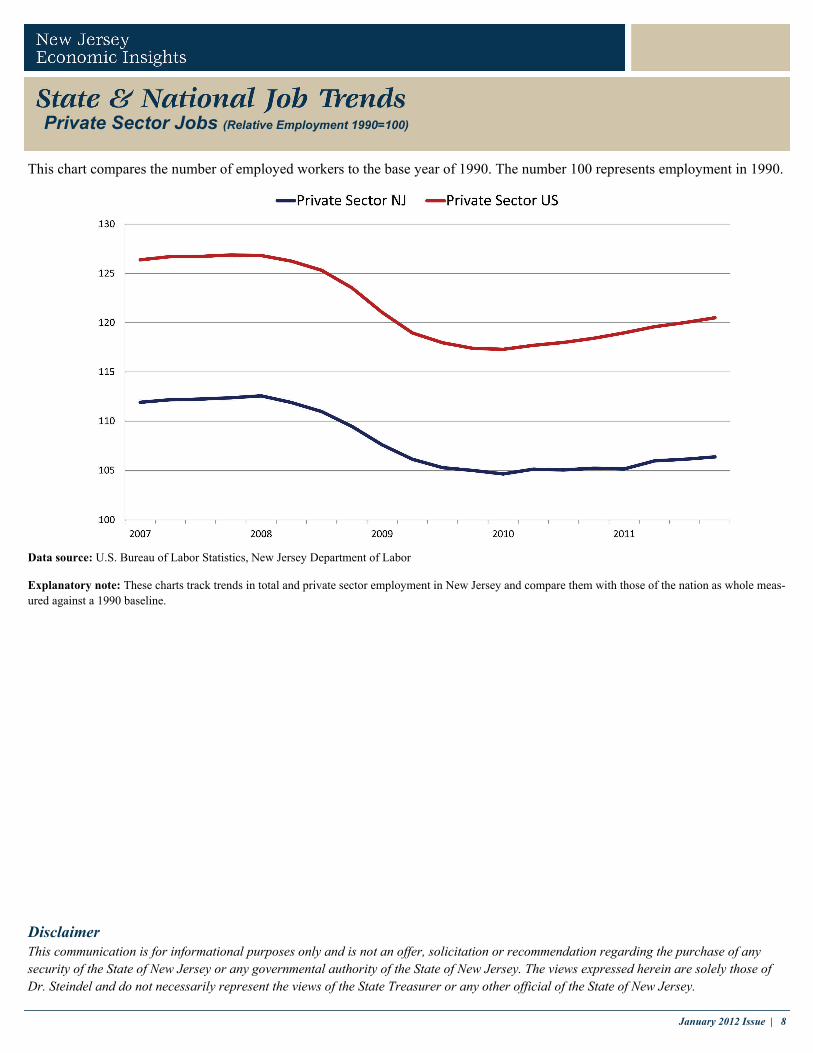
Private Sector Jobs (Relative Employment 1990=100)
Data source: U.S. Bureau of Labor Statistics, New Jersey Department of Labor
Explanatory note: These charts track trends in total and private sector employment in New Jersey and compare them with those of the nation as whole meas-ured against a 1990 baseline.
This chart compares the number of employed workers to the base year of 1990. The number 100 represents employment in 1990.
This communication is for informational purposes only and is not an offer, solicitation or recommendation regarding the purchase of any security of the State of New Jersey or any governmental authority of the State of New Jersey. The views expressed herein are solely those of Dr. Steindel and do not necessarily represent the views of the State Treasurer or any other official of the State of New Jersey.
Disclaimer