INDICATORS AND THEIR SURVIVAL DURING SEWAGE SLUDGE...
275
i INDICATORS AND THEIR SURVIVAL DURING SEWAGE SLUDGE TREATMENT A thesis submitted in fulfilment of the requirements for the degree of Doctor of Philosophy Tania Mondal D.V.M., MS. Micro. School of Applied Sciences College of Science, Engineering and Health RMIT University August, 2012
-
Upload
nguyenhanh -
Category
Documents
-
view
216 -
download
0
Transcript of INDICATORS AND THEIR SURVIVAL DURING SEWAGE SLUDGE...

i
INDICATORS AND THEIR SURVIVAL DURING SEWAGE
SLUDGE TREATMENT
A thesis submitted in fulfilment of the requirements for the degree of
Doctor of Philosophy
Tania Mondal D.V.M., MS. Micro.
School of Applied Sciences
College of Science, Engineering and Health
RMIT University
August, 2012

ii
Declaration
I declare that where due acknowledgement has been made, this submission is my own work;
the work has not been submitted before, to qualify for any other academic award; the
content of this thesis is the result of the work which has been carried out since the official
commencement date of the approved research program; any editorial work, paid or unpaid,
carried out by a third party is acknowledged.
Tania Mondal
Date:

iii
Abstract
Biosolids are defined as the end-products from sewage sludge treatment processes that
meet specific quality requirements for land application. These products have value as
nutrient and organic matter sources and are effective as soil conditioners and alternatives to
chemical fertilizers for crop production. There are a range of treatment process options for
biosolids production. In Victoria, Australia approximately 60% of the biosolids (66,700 dry
tonnes) is produced by two major metropolitan treatment plants serving the city of
Melbourne. At the Eastern Treatment Plant (ETP), sludge is treated by mesophilic anaerobic
digestion (MAD) followed by pan drying and stockpiling. In Victoria, only a very small
proportion of biosolids is used for land application, compared with other states in Australia
and in other developed countries. One reason for this is that there is a conservative
interpretation of Victorian guidelines, in part due to the lack of microbiological data on sludge
treatment under Australian conditions. Furthermore, the guidelines stipulate a minimum
storage period of three years following sludge digestion for unrestricted use, which greatly
diminishes the agronomic value of biosolids, and there is a reluctance to recycle biosolids of
a lesser microbiological quality. Therefore, the research reported here examines the fate of
microbiological indicator microorganisms present in sludge during its treatment by MAD, pan
drying and stockpiling.
An operational process-monitoring investigation examined the decay of indicator
microorganisms (Escherichia coli, enterococci, coliphage) over time at different stages in the
sludge treatment process at ETP. Numbers of E. coli declined to small values during 8 to 11
months of pan drying (depending on season) and attained the Victorian unrestricted T1
Grade (<100 MPN/g DS) or T2 Grade (<1000 MPN/g DS, in this case certain restrictions
apply). Coliphages were undetectable after 8 to 11 months of drying. The results showed
that biosolids produced by ETP were microbiologically safe for land application after pan
drying, based on indicator microorganism measurements. Further storage in stockpiles for 3

iv
years, as required by the current Biosolids Guidelines in Victoria, were unnecessary from a
microbiological safety standpoint.
A series of controlled laboratory experiments were completed to simulate the sludge
treatment process by MAD, pan drying and stockpiling to understand the decay of different
indicators at each step. Since the levels of indigenous coliphage were too low to adequately
follow their decay during laboratory simulation of pan drying, known concentrations of MS2
bacteriophage and P22 bacteriophage were added to the MAD sludge. The numbers of
indigenous coliphage, MS2 bacteriophage and P22 bacteriophage were counted at 1-2
weekly intervals for 17 to 21 weeks. Decay coefficients of indigenous coliphage obtained in
the field and laboratory simulations of field drying were not significantly different, thus
validating the laboratory simulation with respect to bacteriophages.
Factors affecting the die-off of bacterial and viral indicators during MAD and drying pan
treatment were also investigated. Nutrient deprivation and the presence of indigenous flora
affect bacterial die-off in liquid material, while dryness and increased mixed salt
concentration were important factors as drying proceeded.
Since the rapid decay of coliphage was observed during laboratory simulation of MAD and
pan drying and also in the field, the effect of sludge extract as a protease source on
coliphage die-off in MAD output and drying pan sludge was also investigated. Protease
activity was observed in MAD and pan drying sludge extracts over time, and at different
temperatures and pH values, using azocasein as substrate. Protease activity was greatest at
37°C and pH 8. Known concentrations of MS2 bacteriophage were seeded into sludge
extracts and quantified over time. MS2 bacteriophage showed a 3-3.5 log10 reduction within
25 hr at 37°C when exposed to these extracts. This observation suggests that proteases
with other enzymes produced by indigenous bacteria in sludge extracts are responsible for
coliphage inactivation.

v
From this research, it is concluded that numbers of potential indicators, can be reduced to
values consistent with T1 or T2 Grade biosolids after 8 to 11 months of pan drying without
long-term stockpiling at ETP in Victoria. Competition with indigenous flora, predation by
protozoa, nutrient deprivation, dryness, increased mixed salt concentration, together with
enzyme activity, are responsible for the decay of indicators during pan drying treatment of
sludge. These findings may be helpful to regulatory authorities and water companies in
setting guidelines and treatment parameters for wastewater treatment plants in Victoria.

vi
Acknowledgement
It was hardly possible to complete my thesis without the support of some individuals. I’m
really grateful with my cordially respected senior supervisor, Professor Margaret Deighton to
encourage and teach me, not only as a teacher, but also as a very good mentor throughout
my PhD study. I like to bestow my sincere gratitude upon my supervisor Professor Stephen
Smith, Imperial College of London, to help in my research design, thesis writing and also
encourage me to think independently. I’m deeply indebted to my second supervisor Dr.
Duncan Rouch for his cordial academic support and useful advice throughout my study.
I want to give big thanks to other members of the research team, especially, Vennessa
Fleming and Nerida Thurborn who were part of the Smart Water Project team involved in
collecting samples and doing microbiological analysis. Vennessa and Nerida were very
helpful in teaching me the microbiological techniques used to analyse biosolids samples.
I want to acknowledge Smart Water Fund and RMIT in particular to give me a partial
financial support for last two years of my PhD study.
I also want to give thanks to my laboratory Collegues, Bintao, Yu Qu, Salem, Florian
Glauche, Samareh Ajami, Sassikumar, Sri Harini and also others to work together in a good
environment. Special thanks to all of the staff and students in this department whose smiling
faces were helpful to relieve tensions sometimes.
I always remember my dear parents (Nemai Mondal and Trishna Rani Nandi) and other
family members (especially my Boroaunti, Rina Rani Nandi) for their endless and
unconditional sacrifice, financial and mental support during this difficult journey. A lot of
thanks to my dear husband, Subrata Kumar Mondal to give mental support and to help me

vii
work in an undisturbed environment during my study and my beloved baby boy, Aniket
Mondal who likes to be calm and quiet in his own world.

viii
Table of Contents
Declaration ii
Abstract iii
Acknowledgement
List of Contents
vi
viii
List of Tables xvii
List of Figures xix
List of Abbreviations
CHAPTER 1- Introduction
1.1 Overview of Biosolids
1.2 Problems with Biosolids Management in Victoria
1.3 Potential Risks Associated with Land Application of Biosolids
1.4 Use of Indicators in Biosolids
1.5 Project Aims
1
3
4
4
5
6
7
CHAPTER 2- Literature Review 8
2.1 Overview of Wastewater Treatment Processes with Production of
Sludge and Effluent
9
2.1.1 Sludge Treatment 10
2.1.1.1 Thickening 12
2.1.1.2 Stabilization 13
2.1.1.2.1 Digestion 13
2.1.1.2.2 Composting 14
2.1.1.2.3 Chemical stabilization 14
2.1.1.2.4 Physical stabilization 14
2.1.1.3 Conditioning 15
2.1.1.4 Dewatering 15
2.1.1.5 Thermal drying 17

ix
2.1.2 Biosolids Production 17
2.1.3 Biosolids Disposal and Management 18
2.2 Sludge Treatment and Management in Victoria 19
2.3 Pathogens in Sewage Sludge 20
2.3.1 General Characteristics of Pathogens in Sewage Sludge 21
2.3.1.1 Bacterial pathogens 21
2.3.1.2 Viral pathogens 24
2.3.1.3 Protozoan pathogens 25
2.3.1.4 Helminths 26
2.4 Possible Problems with Sludge Treatment in Victoria 26
2.4.1 Nutrient Loss 27
2.4.2 Regrowth of Microorganisms 27
2.4.3 Odour Generation 28
2.5 Safety of Biosolids 29
2.5.1 Public Health Risk Associated with Land Application of Biosolids 29
2.5.2 Control of Public Health Risk Arising from Microorganisms 31
2.5.3 Regulatory Control of Public Health Risk 31
2.5.3.1 Victorian regulation 32
2.5.3.2 Regulations in other states of Australia 37
2.5.3.3 Regulation in USA and United Kingdom 40
2.6 Indicators in Biosolids 43
2.6.1 Escherichia coli 46
2.6.2. Enterococcus spp. 47
2.6.3. Bacteriophage 48
2.7 Inactivation Mechanisms and Factors of Pathogens and Indicators in
Wastewater Treatment System
49
2.7.1 Factors Affecting Die-off of Pathogens During Wastewater Treatment System 50
2.7.1.1 Factors affecting pathogen inactivation during wastewater treatment 50

x
2.7.1.1.1 Predation 50
2.7.1.1.2 Adsorption 52
2.7.1.1.3 Photo oxidation by sunlight and the effect of pH and dissolved oxygen 53
2.7.1.2 Factors affecting pathogen and indicator die-off during sludge treatment 54
2.7.1.2.1 Temperature 55
2.7.1.2.2 Moisture content 57
2.7.1.2.3. Competition and predation 58
2.7.1.2.4 Retention time 60
2.8 Removal of Indicators During Wastewater Treatment System 61
2.8.1 Indicator Removal During Wastewater Treatment 61
2.8.2 Indicator Removal During Sludge Treatment 62
2.9 Conclusion 67
CHAPTER 3- General Materials and Methods 68
3.1 General Procedures 69
3.2 General Chemicals and Equipment 70
3.3 Stock Solutions 72
3.3.1 Ampicillin solution (30mg/mL), Sigma Aldrich, Victoria, Australia 72
3.3.2 2.5% (w/v) Azocasein solution, Sigma Aldrich, Victoria, Australia 72
3.3.3 0.5 M Ethylenediaminetetraacetic acid (EDTA), Sigma Aldrich, Victoria,
Australia
72
3.3.4 Glucose-calcium chloride solution 73
3.3.5 Maximum recovery diluent (MRD), Oxoid Ltd., Hampshire, England 73
3.3.6 20 mM Magnesium-sulphate solution 73
3.3.7 Nalidixic acid solution (25 mg/mL), Sigma Aldrich, Victoria, Australia 73
3.3.8 Phosphate buffered saline (PBS), Oxoid Ltd., Hampshire, England 74
3.3.9 Proteinase K (20 mg/mL), Sigma Aldrich, Victoria, Australia 74
3.3.10 2 M Sodium hydroxide (NaOH), Sigma Aldrich, Victoria, Australia 74
3.3.11 0.5% (w/v) Sodium bicarbonate (NaHCO3) buffer (pH 8.3), Sigma Aldrich, 74

xi
Victoria, Australia
3.3.12 1 M Tris-Cl (pH 8.0), Sigma Aldrich, Victoria, Australia 75
3.3.13 5% (v/v) Trichloroacetic acid (TCA) solution, Sigma Aldrich, Victoria,
Australia
75
3.4 Bacteriological Culture Media 75
3.4.1 Bile aesculin agar (BAA), Oxoid Ltd., Hampshire, England 75
3.4.2 Lactose peptone water, Oxoid Ltd., Hampshire, England 75
3.4.3 Luria bertani (LB) medium, Oxoid Ltd., Hampshire, England 76
3.4.4 MacConkey agar (MCA), Oxoid Ltd., Hampshire, England 76
3.4.5 MacConkey agar (MCA) No. 2, Oxoid Ltd., Hampshire, England 76
3.4.6 Membrane lactose glucuronide agar (MLGA), Oxoid Ltd., Hampshire,
England
77
3.4.7 Motility–indole-lysine decarboxylase medium (MIL), Oxoid Ltd., Hampshire,
England
77
3.4.8 Nutrient agar (NA), Oxoid Ltd., Hampshire, England 77
3.4.9 Nutrient broth (NB), Oxoid Ltd., Hampshire, England 78
3.4.10 Rappaport-vassiliadis soya peptone broth Agar (RVSA), Oxoid Ltd.,
Hampshire, England
78
3.4.11 Salt tolerance test broth (NB + 6.5% NaCl) 78
3.4.12 Semisolid tryptone yeast extract glucose agar (SS TYGA), Oxoid Ltd.,
Hampshire, England
79
3.4.13 Slanetz and bartley agar, Oxoid Ltd., Hampshire, England 79
3.4.14 Todd-Hewitt broth, Oxoid Ltd., Hampshire, England 79
3.4.15 Tryptone water, Oxoid Ltd., Hampshire, England 80
3.4.16 Tryptone yeast extract glucose agar (TYGA), Oxoid Ltd., Hampshire,
England
80
3.4.17 Tryptone yeast extract glucose Broth (TYGB), Oxoid Ltd., Hampshire,
England
80
3.4.18 Xylose lysine desoxycholate agar (XLD), Oxoid Ltd., Hampshire, England 81

xii
3.5 Bacterial Isolates 81
3.6 Equipment for The Field Trip 82
3.6.1 Sampling kit 82
3.6.1.1 MAD sampling kit 82
3.6.1.2 Drying pan and stockpile sampling kit 82
3.6.1.3 Safety kit 82
3.6.1.4 Others 82
3.7 Dry solid (DS) and volatile solid (VS) measurement 83
3.8 Preparation of Bacterial Inoculum 84
3.9 Preparation of High Titre Stock Culture of MS2 (F-Specific RNA
Bacteriophage)
84
3.10 Preparation of High Titre Stock Culture of P22 Bacteriophage 85
3.11 Salmonella spp. Enumeration 85
3.12 Statistical Analysis 85
CHAPTER 4- Indicator Die-off During Drying Pan Treatment 86
4.1 Introduction 87
4.2 Materials and Methods 90
4.2.1 Sample collection 90
4.2.2 Sample analysis 93
4.2.2.1 Enumeration of E. coli 93
4.2.2.2 Enumeration of Enterococcus spp. 94
4.2.2.3 Coliphage enumeration 95
4.2.3 Collection of air temperatures, rainfall data and sludge temperatures 95
4.2.4 Statistical analysis 95
4.3 Results 96
4.3.1 Decay of E. coli 96
4.3.2 Decay of Enterococcus spp. 98

xiii
4.3.3 Decay of coliphage 100
4.3.4 Comparison of the decay rates of different indicators 102
4.3.5 Relationship between indicator decay with rainfall and air temperature over
the monitoring period
104
4.3.6 Sludge temperatures in two different pans over the monitoring period 106
4.3.7 Relationship between dry solid (DS) contents and drying time 107
4.3.8 Indicator decay in relation to sludge dry solids 108
4.4 Discussion 110
CHAPTER 5- Laboratory Simulation of Mesophilic Anaerobic Digestion 114
5.1 Introduction 115
5.2 Materials and Methods 118
5.2.1. Set up of MAD simulation in laboratory 118
452.2. Sludge Collection 118
5.2.3. Sample analysis for microorganisms and physical parameters 119
5.3. Results 120
5.3.1 Decay of E. coli and coliphage during MAD simulation 120
5.3.2 Physical parameters during MAD simulation 122
5.4 Discussion 124
CHAPTER 6- Laboratory Simulation of Drying Pan and Stockpiling 126
6.1 Introduction 127
6.2 Materials and Methods 129
6.2.1 Sludge collection 129
6.2.2 Settling and decanting of sludge 129
6.2.3 Laboratory set up of drying pan 130
6.2.4 Inoculation of MS2 and P22 bacteriophage 131
6.2.5 Sample collection during simulations 132
6.2.6 DS and VS measurement 132
6.2.7 Bacteriophage analysis 132
xiv
6.2.8 Statistical analysis 132
6.3 Results 133
6.3.1 Fate of somatic coliphage during simulated pan drying and stockpiling 133
6.3.2 Fate of MS2 coliphage during pan drying and stockpiling 136
6.3.3 Fate of P22 during pan drying and stockpiling 139
6.3.4 Comparison between field study and laboratory simulation for different
bacteriophages
140
6.4 Discussion 142
CHAPTER 7- Factors Affecting Pathogen Die-Off During Sewage Sludge
Treatment
146
7.1 Introduction 147
7.2 Materials and Methods 150
7.2.1 Bacterial isolates and culture conditions 150
7.2.2 Confirmation of isolates of E. coli and S. Birkenhead 150
7.2.3 Effect of different salt mixtures on the fate of E. coli 150
7.2.3.1 Preparation and inoculation of salt mixture 151
7.2.4 Effect of indigenous flora on the growth of S. Birkenhead in biosolids 155
7.2.4.1 Sample collection and preparation 155
7.2.4.2 Inoculation of samples 155
7.2.4.3 Enumeration of S. Birkenhead 156
7.2.5 Contribution of added nutrients and indigenous flora to the growth of S.
Birkenhead in biosolids
156
7.2.5.1 Sample collection and preparation 156
7.2.5.2 Determination of dry solid, volatile solid and carbon content of biosolid 156
7.2.5.3 Inoculation of MAD output with field isolates of S. Birkenhead 157
7.2.5.4 Enumeration of S. Birkenhead 157
7.3 Results 158
7.3.1 Effect of different salt mixtures on the growth and decay of E. coli in 158

xv
biosolids
7.3.2 Effect of indigenous flora on the growth of S. Birkenhead in biosolids 159
7.3.2.1 MAD output 159
7.3.2.2 Pan samples, 24 hr incubation period 160
7.3.2.3 Pan samples, 48 hr. incubation 161
7.3.3 Effect of nutrients on the growth of S. Birkenhead in biosolids 162
7.4 Discussion 164
CHAPTER 8- Factors Affecting Coliphage Die-off During Sewage Sludge
Treatment
166
8.1 Introduction 167
8.2 Materials and Methods 172
8.2.1 Sample collection 172
8.2.2 Enzyme extraction and detection in biosolids 172
8.2.3 Enzyme assay 172 8.2.4 Effect of pH and temperature on protease activity of sludge from ETP 173
8.2.5 Effect of sludge extract on the fate of coliphage 173
8.2.6 Statistical analysis 174
8.3 Results 175
8.3.1 Calibration curve 175
8.3.2 Demonstration of protease activity of supernatants prepared from different
sludge samples
176
8.3.3 Effect of pH and temperature on protease activity of different sludges 178
8.3.4 Effect of MAD filtered sludge extract, collected from Melton on the fate of
MS2 bacteriophage
180
8.3.5. Effect of different types of filtered sludge extract collected from ETP on MS2
bacteriophage
8.3.6. Comparison between decay rates of MS2 coliphage in different sludge
extracts
181
182
8.4 Discussion 183

xvi
CHAPTER 9- General Discussion and Conclusion 186
References 199
Appendix 226
List of Publications 253

xvii
List of Tables
Table 2.1 Reported nutrient content in digested biosolids 12
Table 2.2 Annual biosolids production in United States 18
Table 2.3 Projections of disposal and beneficial use of
biosolids in USA
19
Table 2.4 The use of wastewater flow of metropolitan
wastewater treatment plants in Victoria
20
Table 2.5 Major pathogens in municipal wastewater and
sewage sludge
21
Table 2.6 Number of reported gastrointestinal diseases in
Australia from 2007 to 2011
23
Table 2.7 MID of some pathogens and parasites 30
Table 2.8 Allowable levels of various pathogens in T1, T2 and
T3 Grade of biosolids in Victoria
33
Table 2.9 Biosolids classification and permitted end use in
Victoria, Australia
36
Table 2.10 Grading of biosolids in different states of Australia for
microbial quality assessment
39
Table 2.11 Allowable levels of various pathogens in US EPA
Class A, B biosolids and UK safe sludge
41
Table 2.12 Safe sludge matrix in UK 42
Table 4.1
Table 4.2
Sampling dates in 2009-2010
Decay rate coefficients of different indicators in
different pans
90
102
Table 4.3 Average monthly rainfall data from Mornington
Weather Station and air temperature data from
Frankston Weather Station, Melbourne over the
105

xviii
monitoring period
Table 5.1 Levels of E. coli and coliphage in feed sludge and
MAD output
121
Table 5.2 Result of pH and biogas 122
Table 5.3 Results for DS and VS 123
Table 6.1 Dry solids value of settled sludge 129
Table 7.1 Chemical content of sludge, collected from seven
WWTPs following anaerobic digestion at 35ºC for 30
days in the laboratory
152
Table 7.2 Salt concentration in sludge containing different
%DS levels
153
Table 7.3 Individual and total Salt concentrations in Luria broth 154
Table 7.4 Characteristics of MAD sample 162

xix
List of Figures
Figure 1.1
Figure 2.1
Annual production and uses of biosolids in Australia
(state/territory) and Newzealand
Schematic diagram of wastewater treatment processes
5
10
Figure 2.2 Generalized sludge treatment processing 11
Figure 2.3 Man-sludge-soil-crop-man infection pathway 30
Figure 4.1 Sludge treatment process at ETP and sampling point over
the study period
91
Figure 4.2 Sample collection from drying pan and stockpile 92
Figure 4.3 Decrease in E. coli during different drying times (days) in
drying Pan 23 (full year pan) and Pan 41 (summer pan) at
ETP
97
Figure 4.4 Decrease of Enterococcus spp. during different drying time
(days) in Pan 23 (full year pan) and Pan 41 (summer pan) at
ETP
99
Figure 4.5 Decrease of coliphage during different drying time (days) in
Pan 23 (full year pan) and Pan 41 (summer pan)
101
Figure 4.6 Comparison of decay coefficients of different indicators in
Pan 23 (full year pan) and 41 (summer pan).
103
Figure 4.7 Sludge temperature over the study period 106
Figure 4.8 Dry solid content (DS) of Pan 23 and Pan 41 over the drying
period
107
Figure 4.9 Dry solid versus indicator removal in Pan 23, full year pan. 108
Figure 4.10 Dry solid versus indicator removal in Pan 41, summer pan 109
Figure 5.1 Different steps of anaerobic digestion process 116
Figure 5.2 Set up of MAD simulation 119
Figure 6.1 Set up of drying-pan simulation in biological safety cabinet 131

xx
Figure 6.2 Somatic coliphage die-off in drying pan simulation 1 133
Figure 6.3 Somatic coliphage die-off in drying pan simulation 2 134
Figure 6.4 Somatic coliphage die-off in drying pan simulation 3 135
Figure 6.5 MS2 coliphage die-off in drying pan simulation 1 136
Figure 6.6 MS2 coliphage die-off in drying pan simulation 2 137
Figure 6.7 MS2 coliphage die-off in drying pan simulation 3. 138
Figure 6.8 P22 die-off in drying pan simulation 1 139
Figure 6.9 Comparison of the decay coefficients of bacteriophages in the
field study and the laboratory simulation
141
Figure 7.1 Growth of field isolates of E. coli and two reference strains, E.
coli ATCC 25922 and E. faecalis 29212 in different salt
mixtures
158
Figure 7.2 Growth of Salmonella Birkenhead in anaerobic digester
sludge (MAD) collected from ETP after 24 hr of incubation
159
Figure 7.3 Fate of Salmonella Birkenhead in pan samples after 24 hr
incubation period at 20ºC.
160
Figure 7.4 Fate of Salmonella in differently treated different aged pan
samples after 48hr incubation period at 20ºC
161
Figure 7.5 Effect of nutrient supplementation of MAD on growth of
Salmonella Birkenhead
163
Figure 8.1 Calibration curve for Proteinase K after 30 min incubation
with azocasein substrate at 37°C
175
Figure 8.2 Protease activity in mesophilic anaerobic digester output
(EMADa), early Pan (EPa), late Pan (LPa) samples,
collected from ETP and MAD output (MMAD), collected from
Melton
177
Figure 8.3 The effect of pH on protease activity of different sludge at
20ºC
178

xxi
Figure 8.4 The effect of pH on protease activity of different sludge at
37ºC
179
Figure 8.5 The effect of MAD sludge extract (protease source) on the
removal of MS2 bacteriophage
180
Figure 8.6 The effect of different types of sludge extract (protease
source) on the removal of MS2 bacteriophage
181
Figure 8.7 Comparison among decay coefficients of MS2 coliphage in
different extracts
182

1
List of Abbreviations
ACMSF=Advisory Committee on the Microbiological Safety of Food
ADAS= Agricultural Development and Advisory Service
ATCC=American type culture collection
ANOVA=Analysis of variance
API=Analytical profile index
CDC= Centre for Disease Control
CLRS=Centrifuged liquid raw sludge supernatant
CSIRO=Commonwealth Scientific and Industrial Research Organisation
DH=Department of Health
DNA=Deoxyribonucleic acid
DS=Dry solid
EP=Early pan
EPS=Extracellular polymeric substance
ETP=Eastern Treatment Plant
FDA=Food and Drug Administration
IAWPRC=International Association on Water Pollution Research and Control
LP=Late pan
MAD=Mesophilic anaerobic digestion
MID=Minimum infective dose
MWC=Melbourne Water Corporation
NRC=National Research Council
NRE= Department of National Resources and Environment
NRMMC= National Resource Ministerial Management Council

2
PA=Protease activity
PFRPS= processes to further reduce pathogens
PFU/g=Plaque forming unit/gram
PIRSA=Department of Primary Industries and Resources of South Australia
PK=Proteinase K
PSRPS= process to significantly reduce pathogens
PVS-1=Poliovirus type 1
RNA=Ribonucleic acid
SA=South Australia
SEWL=South East Water Limited
STEC= Shiga toxigenic E. coli infection
SWF=Smart Water Fund
TAD=Thermophilic anaerobic digestion
TSB =Tryptone soya broth
TVOSCs=Total volatile organic sulphur compound concentrations
UK=United Kingdom
UV=Ultra violet
VFAs=Volatile fatty acids
VS=Volatile solid
VTEC= Verocytoxin producing E. coli
WHO=World Health Organization
WTP=Western Treatment Plant
WWL=Western Water Limited
WWTP=Wastewater Treatment Plant
WAS=Waste activated sludge

3
CHAPTER 1
Introduction

4
1.1 Overview of Biosolids
Biosolids are defined as sewage sludge which has been treated to a level that meets
standards for beneficial use. Biosolids have plant nutritional and soil improving qualities.
They also contain pathogenic microorganisms; bacteria, viruses, protozoa, parasites as
well as potentially toxic elements (PTEs) and organic pollutants (US EPA, 2003).
However, potential human exposure to pathogens in sludge represents the major
immediate risk to health. Therefore, the beneficial use of biosolids is carefully controlled
and regulated to prevent environmental problems. Different countries have varying
standards for the acceptable levels of pathogens in biosolids. In Australia, these
standards vary from state to state. According to EPA Victorian guidelines, biosolids are
classified as T1, T2 and T3 Grades according to microbiological criteria. T1 Grade of
biosolids can be used for land application without restriction whereas restrictions on end
use apply to T2 and T3 Grades (EPA Victoria, 2004).
1.2 Problems with biosolids management in Victoria
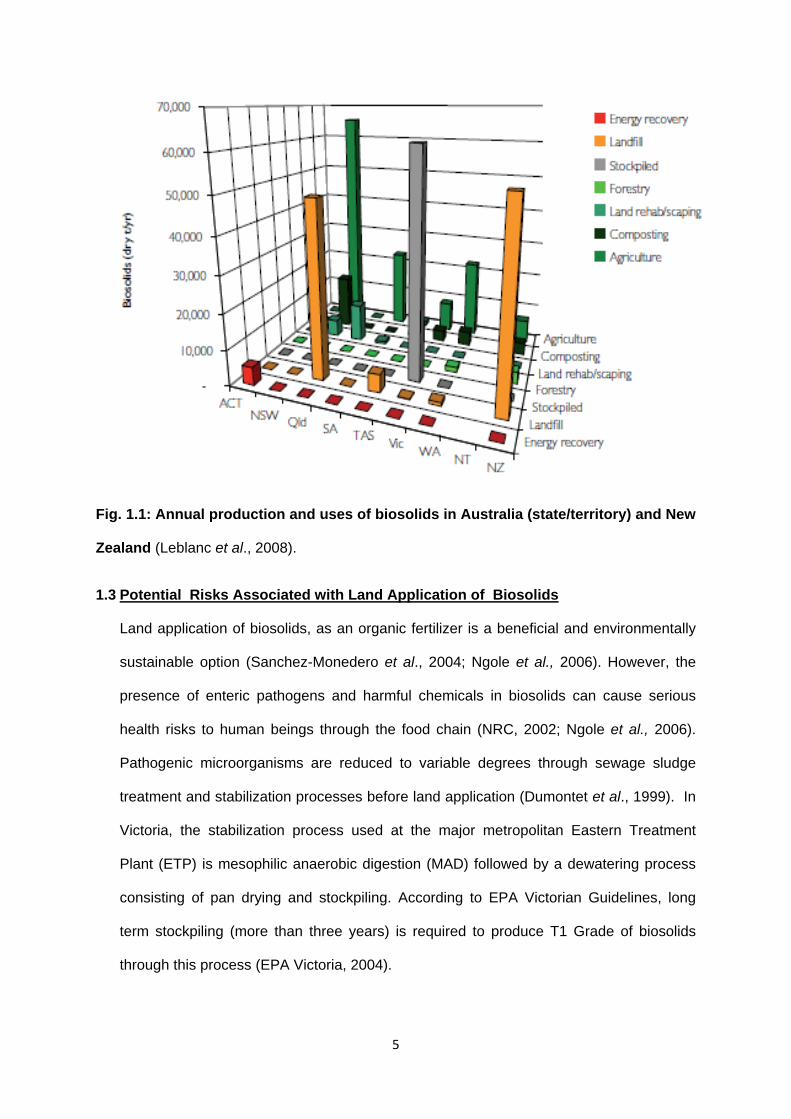
In Victoria, biosolids production is increasing every year. For instance, in 2001, about
66,700 tonnes of dry solids (DS) were produced from 175 wastewater treatment plants in
Victoria, according to the survey on the status of biosolids management in the Victorian
urban water industry (NRE, 2002). In 2009, 82,300 tonnes of DS were produced,
contributing to 23% of the biosolids production in Australia and New Zealand that year
(Grant and Smith, 2010). A large proportion of biosolids produced in Victoria is stockpiled
rather than used beneficially, for example, for agriculture (Fig. 1.1).
5
Fig. 1.1: Annual production and uses of biosolids in Australia (state/territory) and New
Zealand (Leblanc et al., 2008).
1.3 Potential Risks Associated with Land Application of Biosolids
Land application of biosolids, as an organic fertilizer is a beneficial and environmentally
sustainable option (Sanchez-Monedero et al., 2004; Ngole et al., 2006). However, the
presence of enteric pathogens and harmful chemicals in biosolids can cause serious
health risks to human beings through the food chain (NRC, 2002; Ngole et al., 2006).
Pathogenic microorganisms are reduced to variable degrees through sewage sludge
treatment and stabilization processes before land application (Dumontet et al., 1999). In
Victoria, the stabilization process used at the major metropolitan Eastern Treatment
Plant (ETP) is mesophilic anaerobic digestion (MAD) followed by a dewatering process
consisting of pan drying and stockpiling. According to EPA Victorian Guidelines, long
term stockpiling (more than three years) is required to produce T1 Grade of biosolids
through this process (EPA Victoria, 2004).
6
Prior to land application and to protect public health, several barriers to the possible
transmission of infectious disease are put into place. The effectiveness of these steps is
demonstrated through the monitoring of selected microorganisms, usually indicator
microorganisms. The first barrier is a treatment/disinfection process such as heat drying,
composting, or mesophilic/thermophilic anaerobic or aerobic digestion. The process train
must include a stabilisation stage, such as anaerobic digestion, to reduce the substrate
available to microorganisms (as determined by the volatile solids reduction); addition of
lime, or drying of the sludge. These processes may be followed by access or cropping
restrictions to allow time, if necessary, for the microorganism numbers to be further
attenuated in the environment. Furthermore check/monitoring may be required to insure
that regrowth of microorganisms including pathogens has not occurred and this usually
means checking on the number of indicator microorganisms present in the biosolids to
be land applied. Indicator microorganisms typically monitored are faecal coliforms and/or
Escherichia coli.
Since pan-drying and stockpiling is widely used in metropolitan Melbourne, it is important
to determine the pathogen removal efficiencies of these processes. This is particularly
pertinent since long-term stockpiling lessens the agricultural value of biosolids (Rouch et
al., 2011a). It is also important to know the different factors affecting the decay of
microorganisms during sewage sludge treatment to improve management practices and
efficiency.
1.4 Use of Indicators in Biosolids
As all of the pathogenic microorganisms are present in very low numbers in sludge and
also the enumeration techniques of pathogenic microorganisms are very difficult and not
reliable, suitable indicator microorganisms are used as surrogates for the decay of
pathogens in biosolids (Toze and Sidhu, 2011). Details of indicators are described in

7
Section 2.6.
1.5 Project Aims
The general aim of this research was to provide quantitative data on rates of decay and
factors affecting decay of microbial indicators and pathogens during sewage sludge
treatment by MAD, dewatering by pan drying and stockpiling. This information is necessary
to encourage the adoption of sustainable treatment and end-use practices of air-dried and
stored sewage sludge in Victoria.
The specific objectives of the research were:
1. To monitor the die-off of indicators of bacterial and viral enteric pathogens; E. coli,
Enterococcus spp. and coliphage, in field studies of digested sewage sludge pan-
drying and stockpiling.
2. To investigate the physical, chemical and biological factors affecting the die-off of
bacteria and coliphage in biosolids.
3. To simulate and quantify the decay of E. coli and coliphage in biosolids during MAD,
pan drying and stockpiling in the laboratory.
4. To relate the die-off found in the field with the die-off of indicators in a laboratory
simulation of pan drying and stockpiling

8
CHAPTER 2
Literature Review

9
2.1 Overview of Wastewater Treatment Processes with Production of Sludge and
Effluent
Wastewater treatment processes involve preliminary treatment, primary treatment,
secondary treatment and tertiary treatment, by which residual by products, sludge and
effluent are produced (Fig. 2.1). Preliminary treatment involves grit removal to take out
dense particles and screening to remove particles and floating objects using bars or mesh.
In primary treatment, gross solids are removed by quiescent sedimentation and ‘primary
sludge’ is produced (Stuetz and Stephenson, 2009a). An example of secondary treatment is
the activated sludge process in which water; suspended solids, air, nutrients and
microorganisms are mixed together with a supply of sufficient oxygen in aeration tanks (Pell
and Worman, 2011). In this process, a proportion of settled sludge containing viable biomass
called ‘waste activated sludge’ undergoes further treatment and a proportion of sludge is
returned to the process to maintain the biological activity and biomass retention called
‘returned sludge’ (Pell and Worman, 2011). Tertiary treatment involves advanced treatment
processes including membrane filtration, ion exchange, reverse osmosis system,
precipitation, coagulation, flocculation, chlorination disinfection, UV disinfection (Stuetz and
Stephenson, 2009a). Membrane filtration, ion exchange, reverse osmosis system,
precipitation, coagulation or flocculations are used to generate sludge from wastewater. UV
and chlorine disinfection are used to destroy microorganisms from the effluent
(Tchobanoglous et al., 1991; Stuetz and Stephenson, 2009a). This study is concerned with
the decay of microbial pathogens and their indicators during the treatment of sludge.

10
Fig. 2.1: Schematic diagram of wastewater treatment processes (Stuetz and
Stephenson, 2009b).
2.1.1 Sludge Treatment
The process of sludge treatment (Fig. 2.2) involves several stages that are broadly
described as thickening, stabilization (e.g.: by aerobic/ anaerobic digestion, composting,
physical or chemical treatment), conditioning, dewatering (e.g.: by mechanical or natural
means) and thermal drying (Tchobanoglous et al., 1991). The methods used to achieve
these stages differ between wastewater treatment plants (WWTPs), for example, sludge is
generally stabilized by aerobic or anaerobic digestion, but other processes used include
composting, stabilization with lime. Stabilization processes reduce the amount of solid
matter, nuisance e.g.: odour and vector attraction, as well as pathogen numbers and
regrowth potential (Sanin et al., 2011b). Following digestion, sludge can be dewatered,
Influent
Preliminary treatment
Screening
Grit removal
Primary treatment
Secondary treatment
Tertiary treatment
Effluent
Sludge
Sludge
Sludge
Sludge treatment

11
composted, or chemically stabilized by lime treatment or treated by pasteurization. The
dewatering process is commonly accomplished by air-drying in beds or mechanical means.
Mechanically dewatered sludge can be further treated by thermal drying.
Fig. 2.2: Generalized sludge treatment processing (Tchobanoglous et al., 1991).
Thickening
Digestion
Conditioning
Air drying in beds/lagoons
Dewatering
Chemical stabilization
Thermal drying
Mechanical dewatering
Untreated sludge
Stabilization Composting
Physical stabilization, eg: Pasteurization

12
Solids coming from the stabilization processes that they can be beneficially utilized for their
nutrient, soil conditioning, energy, safe microbiological criteria or other properties are called
biosolids (Bitton, 2011b). These properties of biosolids can be achieved by providing
properly a balanced amount of organic matter, trace elements, nitrogen, phosphorus,
potassium, water content and also other nutrients to the soil for the purpose of good plant
growth. Nutrient contents of biosolids are presented in Table 2.1.
Table 2.1 Reported nutrient content in biosolids. (Sommers, 1977; Gutteridge et al.,
1997; Rigby et al., 2010; DEFRA, 2010)
Country Nutrients (% DS)
Total N P K
Australia 5.2 0.9-3.6 0.1-0.24
UK 2.0-5.0 3.0-3.5 0.2
USA 4.2 3.0 0.3
Values are expressed as % DS
N=Nitrogen,
P=Phosphorus,
K=Potassium
2.1.1.1 Thickening
Thickening, also called consolidation or concentration, is a process of sludge treatment by
which the solid contents of sludge is increased by removing a portion of the liquid fraction.
The process aims to produce a sludge of around 4-6% DS and 50% of volume reduction
(Stuetz and Stephenson, 2009b). Thickening is mostly done by physical processes; gravity
settling, dissolved-air-floatation, centrifugation and gravity belt thickening. (Tchobanoglous et
al., 1991; Stuetz and Stephenson, 2009b). Some thickening processes, such as,

13
gravitational settling and dissolved air floatation of primary and waste activated sludge do
not achieve 4-6% DS (Tchobanoglous et al., 1991).
2.1.1.2 Stabilization
Stabilization can be defined as “any physical, chemical or biological process that significantly
reduces pathogens, odour and ability to undergo putrefaction” (Tsang and Smith, 2005).
Stabilization can be achieved by digestion, composting, centrifugation, chemical or physical
means. The common stabilization processes of sludge are as follows.
2.1.1.2.1 Digestion
Primary, secondary and co-settled sludge are generally aerobically or anaerobically digested
(Stuetz and Stephenson, 2009b).
Aerobic digestion occurs by partial oxidation of sewage sludge by aerobic microorganisms
under aerated conditions. In the process of anaerobic digestion, complex organic material is
broken down into smaller particles under anaerobic conditions, producing methane
predominantly as well as carbon dioxide. Anaerobic digesters have a floating steel cover and
are mixed by different methods including mechanical means and gas circulating systems.
Gas circulating systems help to ensure proper mixing to obtain the uniform biological activity
in the tanks. The anaerobic digesters also contain heat exchangers to pre-heat incoming
sludge to create conditions required for optimal anaerobic microbiological activity. Most
anaerobic digesters are operated at mesophilic temperatures (35°C), although some
digesters are operated under thermophilic temperatures (55-60°C) (Stuetz and Stephenson,
2009b). Descriptions of the chemical processes involved in anaerobic digestion can be found
in Chapter 5.

14
2.1.1.2.2 Composting
Composting is a process by which sludge is stabilized under aerobic, moist and warm
conditions to facilitate the degradation of organic matter by microorganisms (Bitton, 2011b).
During decomposition, the temperature increases to approximately 70ºC in a well-operated
composting process (Sanin et al., 2011b). Three main types of composting systems are
available; aerated static pile process, windrow process and enclosed system (Benedict et al.,
1988; Reed et al., 1988). In aerated static pile processes, a mixture of well digested sludge
and bulking agent, e.g.: wood chips, is placed over an aeration grid and sludge is mixed with
bulking agent by rotating drum mixture or by movable equipment (Tchobanoglous et al.,
1991). In the windrow process, the mixing and operation procedure are similar to those of
the aerated static pile process. Windrows in long piles are made from 3-6 ft. high and 6-14 ft
at the base and are turned periodically to facilitate aeration (Sanin et al., 2011b). In the
enclosed system, composting is achieved inside an enclosed container or vessel by
mechanically controlling environmental conditions; such as, temperature, air flow and
oxygen concentration (Tchobanoglous et al., 1991).
2.1.1.2.3 Chemical stabilization
Chemical stabilization of sludge is accomplished by the application of a sufficiently high
concentration of lime to destroy pathogens and reduce odour by increasing the pH. Two
types of lime; quick lime and hydrated lime are used for this type of sludge stabilization
(Sanin et al., 2011b).
2.1.1.2.4 Physical stabilization
Physical stabilization of sludge is achieved by the application of heat or ionizing radiation. In
the case of heat stabilization, disinfection of sludge is performed at the pasteurization
temperature of 70°C for 30 min to 1 hr. to prevent organic fouling and inorganic scaling.
Gamma (γ) and beta (β) radiations are mostly used to disinfect sludge (Sanin et al., 2011b).

15
2.1.1.3 Conditioning
Conditioning helps to separate the solids from the liquid phase and this process is done by
chemical treatment (lime, ferrous sulphate, ferric chloride, organic polymers and
polyelectrolytes) or physically (heating or freezing) to aid flocculation and water separation
(Stuetz and Stephenson, 2009b; Bitton, 2011b). Conditioning may be required to remove
water from sludge effectively during thickening and dewatering (Sanin et al., 2011c).
2.1.1.4 Dewatering
Dewatering modifies the physical properties and increases the solid contents of sludge to
improve management and handling and reduce transport costs. The effect of dewatering
sludge on pathogen inactivation and VS depends on the types of processess
(Tchobanoglous et al., 1991; Sanin et al., 2011c). There are different techniques available
for dewatering of sludge. Some are based on natural evaporation and some rely on
mechanical devices (Tchobanoglous et al., 1991).
Among natural dewatering processes, the use of drying beds and lagooning are most
commonly used. These processes are used in those treatment plants where land availability
is not a problem (Tchobanoglous et al., 1991). Anaerobically digested sludge is dewatered in
open or covered beds with a sand, clay or concrete base (Eckenfelder and Santhanam,
1981b; Bitton, 2011b). In this case, water is removed from sludge in two steps, consisting of
drainage and natural evaporation resulting in material of approximately 45-75% dry solid
content (Sanin et al., 2011c; Bitton 2011b). Rapid dewatering by drainage takes 1-3 days
and further slow dewatering by evaporation takes few weeks to several months (Eckenfelder
and Santhanam, 1981b). In contrast, drying in lagoons is a low cost dewatering process
which consists of no drainage system. This process only relies on natural evaporation (Sanin
et al., 2011c). Air drying is the main dewatering process used in metropolitan Victoria,
Australia.

16
Among mechanical devices, the belt filter press and centrifugation are the most commonly
used dewatering processes; vaccum filtration is seldom done today. The aim of these
processes is to produce cakes containing 15-40% dry solid (Tchobanoglous et al., 1991).
There are some advantages and disadvantages of these processes used in different
treatment plants. Although mechanical dewatering is a very quick method and requires only
a small amount of land, it has high operation costs and energy requirements. Another
disadvantage is that regrowth of pathogens may occur (Salihouglu et al., 2007). Several
researchers have demonstrated regrowth of pathogens (Qi et al., 2007; Chen et al., 2011) or
E. coli (Higgins et al., 2007) after dewatering by centrifugation.
Higgins et al. (2007) examined the number of faecal coliforms in samples collected from
influent and output of mesophilic anaerobic digestion (MAD), thermophilic anaerobic
digestion (TAD) and also after centrifuge dewatering. Faecal coliforms were quantified in
each case. The results showed that the influent and output from TAD contained 108 CFU/g
DS and 102 CFU/g DS of faecal coliforms respectively whereas centrifuge dewatered sludge
contained 106 CFU/g DS. The influent and output of MAD contained 107 CFU/g DS and 104
CFU/g DS of faecal coliforms respectively. After centrifuge dewatering, there were >105
CFU/g faecal coliforms (Higgins et al., 2007). Both MAD and TAD output showed regrowth of
faecal coliforms after centrifuge dewatering.
Qi et al. (2007) also demonstrated an increase in faecal coliform levels after centrifuge
dewatering of sludge. The faecal coliform levels were examined in samples from influent and
output of MAD and TAD and also from centrifuged dewatered sludge. The effect of
temperature and storage on coliform regrowth in centrifuged dewatered sludge was also
examined. The results showed that half of the MAD samples contained an increased number
of coliforms of up to one order of magnitude after centrifugation. For TAD samples the
increase in coliform numbers was several orders of magnitude after dewatering. Upon

17
incubation at 25º and 37ºC and storage of centrifuge-dewatered samples, the number of
coliforms increased by 2-3 orders of magnitude. In contrast, the number of coliforms did not
increase in digested samples (Qi et al., 2007).
Chen et al. (2011) examined the regrowth of faecal coliforms in a laboratory simulation of
belt filter press and centrifuge dewatering. They reported the regrowth of faecal coliforms in
centrifuge dewatered sludge but not in sludge dewatered by belt filter pressing. This work
showed that centrifuge dewatering cannot remove the pathogens to get the required level in
biosolids.
Chen et al. (2011) have suggested that regrowth of faecal coliforms after centrifuge
dewatering may be due to the release of substrates during centrifugation. This problem
could be resolved by minimum agitation during handling. Another possible reason for
regrowth after centrifuge dewatering is that during anaerobic digestion indicator organisms
were in a viable but non culturable state which could be reactivated after centrifugation due
to release of chemical signals during mechanical dewatering (Higgins et al., 2007).
2.1.1.5 Thermal drying
In the thermal drying process, moisture is removed from the sludge by evaporation to
produce a granular or pelletised product with around 90% DS content so that the sludge can
be used effectively for incineration or as a fertilizer. Mechanically dewatered sludge may be
further treated by thermal drying (Tchobanoglous et al., 1991). Different types of thermal
drier include the flash drier, rotary drum drier and belt drier (Stuetz and Stephenson, 2009b).
2.1.2 Biosolids Production
Biosolids production is increasing globally mainly due to the upgrading of wastewater
treatment plants (Sanin et al., 2011a). Projections of biosolids production in the USA up to
2010 are shown in Table 2.2 (Iranpour et al., 2004). In the United Kingdom, sludge

18
production per annum was 1,186,615 tonnes per DS in 2001 whereas it was 1,360,366
tonnes DS in 2003 (Spinosa, 2011). In Canada, 660,000 tonnes DS is produced every year
(Spinosa, 2011). In Japan, 2.2 million tonnes DS is produced every year (Spinosa, 2007).
Table 2.2 Annual biosolids productions in United States (US EPA, 1999; Bastian 1997;
Iranpour et al., 2004)
Year Sludge production (million tonnes/ds)
1997 6.9
1998 6.9
2000 7.1
2005 7.6
2010 8.2
2.1.3 Biosolids Disposal and Management
The safe disposal of biosolids is an important environmental concern globally (Singh and
Agrawal, 2008). Among the management and disposal methods, soil application, land filling
and incineration are the principal approaches (Sanchez-Monedero et al., 2004). Land
application of biosolids is thought to be the most prudent management method because of
its potential in having ideal properties as a fertilizer and soil improver (Tchobanoglous et al.,
1991). In the USA from 1998 to 2010, approximately 40-50% biosolids were used
beneficially for land application (Table 2.3). In the UK, 67% of biosolids produced were used
for land application, 1.5% for landfill, 19.5% for incineration and 7% for other purposes were
used in 2005 (Leblanc et al., 2008).

19
Table 2.3 Projections of disposal and beneficial use of biosolids in USA (US EPA,
1999)
Year Beneficial use Disposal
Land application
Advanced treatment
Other uses
Surface disposal/landfill
Incineration Other uses
1998 41% 12% 7% 17% 22% 1%
2000 43% 12.5% 7.5% 14% 22% 1%
2005 45% 13% 8% 13% 20% 1%
2010 48% 13.5% 8.5% 10% 19% 1%
2.2 Sludge Treatment and Management in Victoria
In order to meet Victorian land application guidelines (EPA Victoria, 2004) for producing
biosolids for unrestricted use on land, sewage treatment plants in Victoria, Australia, typically
use MAD for 15 days at 35ºC, air drying in pans to dewater it to >10% DS and then stockpile
the material for three years. In Victoria, about 90% produced biosolids are stockpiled rather
than used for land application (Leblanc et al., 2008).
Melbourne Water Corporation (MWC) is Melbourne’s largest water company which treats
around 271,000 million litres of sewage every year and runs two main metropolitan
treatment plants; Eastern Treatment Plant (ETP) at Bangholme and Western Treatment
Plant (WTP) at Werribee. Approximately 40% of Melbourne’s sewage is treated by the ETP
whereas about 50% of Melbourne's sewage is treated by the WTP. The rest of the sewage is
treated by Mt Martha treatment plant owned by South East Water Ltd (SEWL), Melton
treatment plant owned by Western Water Ltd (WWL) and other smaller treatment plants
(Melbourne Water, 2011). The use of wastewater flow of metropolitan treatment plants in
Victoria is presented in Table 2.4.

20
Table 2.4 The use of wastewater flow of metropolitan wastewater treatment plants in
Victoria (Melbourne Water, 2011)
Wastewater treatment plants Population served Volume (hectare of land)
ETP 15,00000 1,100
WTP 16,00000 1,500
Others 200000 -
ETP=Eastern treatment plant, WTP=Western treatment plant
2.3 Pathogens in Sewage Sludge
The purpose of sewage sludge treatment processes is to attain reduction in the numbers of
infectious microorganisms, to levels that depend on expected uses of biosolids to ensure
public health safety. Different types of pathogens can survive in sewage sludge. Among
them, most of the pathogens coming from humans are of enteric origin and some may come
from a range of animal hosts (Sanin et al., 2011d). Major pathogens in municipal wastewater
and sewage sludge are shown in Table 2.5.

21
Table 2.5 Major pathogens in municipal wastewater and sewage sludge (Epstein,
2003)
Class of pathogens Examples Diseases
Bacteria Campylobacter jejuni Gastroenteritis
Enterohaemorrhagic Escherichia
coli (EHEC)
Gastroenteritis
Salmonella spp. Salmonellosis/
Gastroenteritis
Salmonella Typhi Typhoid fever
Shigella spp. Shigellosis
Vibrio cholera Cholera
Yersinia spp. Yersinosis
Viruses Coxsackie virus Flu-like symptoms
Echovirus Flu-like symptoms
Hepatitis virus Infectious hepatitis
Poliovirus Poliomyelitis
Rotavirus Acute gastroenteritis
Protozoa Cryptosporidium spp Gastroenteritis
Entamoeba histolytica Amoebic dysentry
Giardia spp. Giardiasis
Helminths Ascaris spp. Ascariasis
Taenia spp. Taeniasis
Trichuris trichura Trichuriasis
2.3.1 General Characteristics of Pathogens in Sewage Sludge
2.3.1.1 Bacterial pathogens
Bacteria are the most frequently detected pathogens found in sewage sludge. Bacteria are
unicellular, prokaryotic, metabolically active microorganisms. They are ubiquitous in nature
(Gerardi and Zimmerman, 2005a). Wastewater bacteria can be classified into four main
groups; Gram positive facultative anaerobes (e.g., Escherichia, Shigella, Klibsiella,
Enterobacter and Vibrio species), Gram negative aerobes (e.g., Pseudomoas,
Acinetobacter, Flavobacterium species), Gram positive spore formers (e.g., Bacillus spp.),

22
and Gram positive non spore formers (e.g. Arthrobacter and Rodococcus species) (Bitton,
2011a). 90% of wastewater bacteria are Gram negative rods (Sanin et al., 2011d). General
properties of some very common bacterial pathogens in sewage sludge are given below.
Salmonella spp. are members of the family Enterobacteriacae and include more than 2,000
serotypes. Salmonella spp. can be transmitted to the environment through human or animal
excretion. When humans or animals (either wild or domestic) are clinically diseased or have
had salmonellosis but still remain carriers, they can excrete Salmonella spp. in the
environment. The number of Salmonella spp. in wastewater ranges from a few cells to 8×10²
CFU/100 mL (Bitton, 2011a). The infective dose of Salmonella spp. is 107-108 cells, but may
vary depending on health and age of the host and the serotype. The faeces of infected
people contain large numbers of the microorganisms (FDA, 2011). Some serotypes are
confined to particular animal reservoirs, especially pigs and poultry, but many are capable of
crossing between species to cause disease in humans, often via food. In wastewater,
Salmonella spp. are the most important pathogenic bacteria and they cause different types
of diseases; typhoid and paratyphoid fever and gastroenteritis. Non-typhoidal Salmonella
serovars are much more common than Salmonella Typhi (FDA, 2011). In Australia, typhoid
fever is an uncommon infection, which is usually acquired overseas, while salmonella
gastroenteritis is a common food borne disease. The reported cases of gastroenteritis
caused by Salmonella spp. in Australia (Department of Health and Ageing, 2011) are shown
in Table 2.6. In the US, 1.2 million food-borne illnesses caused by Salmonella spp. occur
every year (CDC, 2011). Some strains of Salmonella spp. expressing resistance to several
antibiotics have emerged in some countries. Resistance is acquired through the transfer of
genetic material. Therefore, Salmonella creates a public health hazard because of its
presence in wastewater and also the potential presence of more resistant strains (Espigares
et al., 2006; Turki et al., 2012).

23
Table 2.6 Number of reported gastrointestinal diseases in Australia from 2007 to 2011
(Department of Health and Ageing, 2012)
Gastrointestinal diseases
2007 2008 2009 2010 2011
Campylobacteriosis 16990 15541 16083 16971 17725
Cryptosporidiosis 2809 2004 4624 1480 1807
Hepatitis A 166 277 564 267 144
Hepatitis E 18 44 33 37 40
Listeriosis 50 68 92 71 70
EHEC 106 108 129 80 97
Salmonellosis 9502 8316 9524 11928 12282
Shigellosis 597 828 618 551 497
Typhoid fever 90 105 115 95 135
EHEC= Enterohaemorrhagic E. coli.
Campylobacter jejuni is a gram negative slender, curved, motile rod. It is a microaerophilic,
thermotolerant microorganism with an optimum growth temperature of 42ºC. Campylobacter
jejuni is widely distributed in the environment (FDA, 2011). The microorganism requires 3 to
5% oxygen and 2 to 10% carbon dioxide for optimal growth (FDA, 2011). Campylobacter
jejuni is mostly associated with infections in humans and this microorganism is considered to
be one the main causes of bacterial gastroenteritis in the developed world (Kator and
Rhodes, 2003). Human infections occur through ingestion of raw or improperly handled
foods, including chicken, milk, and non-chlorinated water. The infective dose of
Campylobacter jejuni is considered to be 400-500 cells, although it may vary from individual
to individual (FDA, 2011). A range of wild and domestic mammals and birds carry
Campylobacter spp. (Brennhovd et al., 1992; Kator and Rhodes, 2003). As Campylobacter
spp. are sensitive to oxygen and cannot grow at temperature below 30ºC, they can survive
poorly in digested sludge (Eamens et al., 2006; Bitton, 2011a). Campylobacter spp. has
been isolated from sewage (Arimi et al, 1988). Rinsoz et al. (2009) surveyed 23 wastewater
treatment plants in Switzerland and the result showed that raw wastewater contained

24
variable concentrations of Campylobacter spp. from 6.8×10⁴ to 2.3×10⁶ cells/L and effluents
also contained about 2.8×10⁴ cells/L of Campylobacter spp.
Among the strains of E. coli, most are harmless and found in the intestinal tract of humans
and warm blooded animals. Some strains of E. coli contain virulence factors and are
capable of causing diarrhoea. Strains causing diarrhoea can be classified into
enterotoxigenic (ETEC), enteropathogenic (EPEC), enterohaemorrhagic E. coli (EHEC),
enteroinvasive (EIEC), enteroaggregative (Eaggec) and diffusively adherent E. coli (DAEC)
(Albert et al., 2009). The most important of those EHEC, for example E. coli 0157:H7,
producing shiga-like toxins causes haemorrhagic colitis and haemolytic–uraemic syndrome
and is a cause of kidney disease in children (Bitton, 2011a). This microorganism is generally
associated with food, in particular beef and milk, but in recent years has been implicated in a
number of waterborne outbreaks (Clark et al., 2003). The number of microorganisms
required to initiate infection is thought to be <100 (Bitton, 2011a).
As well as the established pathogens, a number of opportunistic pathogens can be found in
both untreated and treated wastewater. Opportunistic pathogens are defined as
microorganisms causing infections and diseases under only certain conditions, commonly in
the very young, elderly and the immunocompromised. The opportunistic pathogens that
have been identified in wastewater include environmental microorganisms such as,
Legionella Mycobacterium, Leptospira, Pseudomonas, Streptococcus, Flavobacterium and
Aeromonas species (Ashbolt et al. 1995; Gray, 2010).
2.3.1.2 Viral pathogens
Enteric viruses are obligate intracellular parasites that require cells of a suitable host for their
multiplication. As they are unable to self-replicate, they persist in the environment as inactive
particles. A large number of enteric viruses are excreted in human faeces and urine and are
commonly present in wastewater. Most viruses are able to remain infective for several
25
weeks in water at low temperatures (Gray, 2010; Bitton, 2011a). More than 120 pathogenic
enteric viruses, which can cause infection to humans with very low doses, have been
isolated (Simmons et al., 2011; Simmons and Xagoraraki, 2011). Enteric viruses in sewage
sludge can be divided into two main groups: enterovirus group, containing Poliovirus,
Coxsackievirus, Enterovirus and Echovirus, and a heterogeneous group including
Adenovirus, Hepatitis A virus, human Rotavirus, human Calicivirus such as Norovirus and
Astrovirus. Enteroviruses are transmitted by faecal-oral route, but can cause different types
of diseases, although most of the infections are asymptomatic (Grist et al., 1978). Among
enteroviruses, Polioviruses cause neurological diseases in which paralysis is one of the
major features, Coxsackievirus A and B infections are associated with hand, foot and
mouth disease, Bornholme disease, pericarditis and myocarditis, Echoviruses and
Enteroviruses cause encephalitis, haemorrhagic conjunctivitis as well as respiratory tract
infection. Most of the viruses under the heterogenous group including Adenovirus (type 12,
40, 41), Astrovirus, Rotavirus are responsible for gastroenteritis both in adults and children
(Glass and Bresee, 2011). In raw wastewater, the enteric viruses are present in relatively
low numbers ranging from 102 to 107 PFU/L (Sidhu and Toze, 2009; Bitton, 2011a)
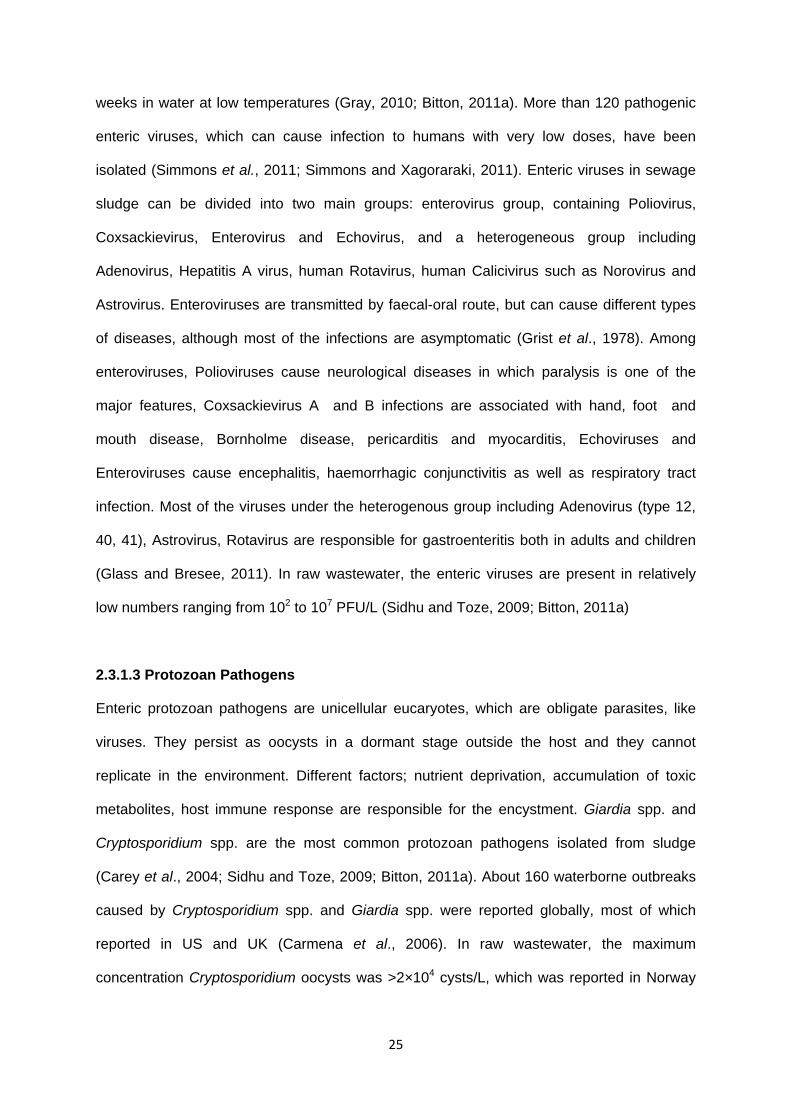
2.3.1.3 Protozoan Pathogens
Enteric protozoan pathogens are unicellular eucaryotes, which are obligate parasites, like
viruses. They persist as oocysts in a dormant stage outside the host and they cannot
replicate in the environment. Different factors; nutrient deprivation, accumulation of toxic
metabolites, host immune response are responsible for the encystment. Giardia spp. and
Cryptosporidium spp. are the most common protozoan pathogens isolated from sludge
(Carey et al., 2004; Sidhu and Toze, 2009; Bitton, 2011a). About 160 waterborne outbreaks
caused by Cryptosporidium spp. and Giardia spp. were reported globally, most of which
reported in US and UK (Carmena et al., 2006). In raw wastewater, the maximum
concentration Cryptosporidium oocysts was >2×10⁴ cysts/L, which was reported in Norway

26
(Robertson et al., 2006). In Italy, it was reported that raw wastewater contains Giardia cysts
varying from 2.1×10³ to 4.2×10⁴ cysts/L (Caccio et al., 2003).
2.3.1.4 Helminths
Helminths (nematodes and tape worms) are intestinal parasites with complex life cycles.
Tape worms require an intermediate host for development before creating infection in
humans (Gerardi and Zimmerman, 2005b). According to the World Health Organization
(WHO), it was estimated that, 1000 million cases of infection are due to Ascaris lumbricoides
and 500 million cases of infection are due to Trichuris trichiura worldwide (WHO, 1987).
Helminth infection is a common public health problem especially in developing countries
(Palmer et al., 2002). As for example, in China, the estimated overall prevalence of helminth
infection is 63% of which 47% are due to Ascaris lumbriocoides, 18.8% Trichuris trichuria
and 17.1% hookworm infection (Xu et al., 1995). This is because of poor sanitation in
developing countries compared with developed countries (Smith et al., 2001). Therefore, the
prevalence of helminth infection in developed countries indicates infections are rare. In
Australia, helminths are rarely a health problem (CDC, 2011). The presence of helminth
parasites in wastewater largely depends on the prevalence of infections within population.
Helminth egg concentrations (total and viable) of 2 to 53 eggs/10 g DS and 2 to 45 eggs/10
g DS respectively were found in raw sludge in France (Gantzer et al., 2001).
2.4 Possible Problems with Sludge Treatment Processes in Victoria
Possible problems associated with the processes operating in Victoria, Australia include
loss of nutrients during the long storage period, possibility of regrowth or reactivation of
microorganisms during the storage period, odour generation and large amounts of land
occupied for pan drying and stockpiling.

27
2.4.1 Nutrient Loss
During the long storage period, the nutrient value of biosolids is reduced through loss of
mineral nitrogen (N) by volatilization of the ammoniacal content, stabilization of the organic N
fraction, reduction of phosphorus (P) solubility and organic matter degradation. Therefore,
this reduces the quality and value of the treated material as a soil improver and fertilizer
(Rouch et al., 2011a). The nutrient value of biosolids could be increased by shortening of the
storage period, although the levels of microbial pathogens in the product must be within safe
limits. Storage periods of between 3 to 6 months after mechanical or solar/air drying are
common in other countries having climates ranging from temperate (e.g., UK) to arid (e.g.,
Egypt) (Hall & Smith 1997).
2.4.2 Regrowth of Microorganisms
Several research groups have shown that regrowth of indicator organisms or pathogens can
occur during storage. Gantzer et al. (2001) demonstrated that regrowth of E. coli and
enterococci occurred in dehydrated sludge treated by anaerobic digestion. The level
decreased by the end of 6 months of storage but increased by 5.5 log10 MPN/g DS after a
further 6-8 months of storage, to levels similar to those at the beginning of storage. The
authors also reported the regrowth of E. coli in lime treated sludge after 8 months of storage
and enterococci after 6 months of storage. Another research group investigated regrowth of
faecal coliforms and Salmonella spp. in stored and soil amended biosolids (Gibbs et al.,
1997). Both species decreased in numbers during the summer period in both the storage
and soil amendment trials. Repopulation occurred at the beginning of winter after 50 days of
storage following rainfall. Laboratory studies on the regrowth potential of Salmonella spp.
and faecal coliforms in biosolids and biosolids amended soil were performed by Zaleski et al.
(2005). Levels of Salmonella spp. decreased within 2 weeks but after rewetting at week 3,
the regrowth of faecal coliforms occurred. At week 5, negligible growth of Salmonella spp. in
sludge amended soil was observed. The results of these studies show that regrowth of
pathogens and indicator organisms in dewatered biosolids during the storage period are a

28
matter of concern, which could occur after rain due to increased levels of moisture.
Regrowth in lime-amended biosolids is a result of a reduction in alkalinity due to entry of
carbon dioxide into the material. This concern could be resolved by shortening the storage
period following treatment of biosolids, before land application, although more research is
needed in this field.
2.4.3 Odour Generation
Odour generation is another problem arising after dewatering of sludge. Chen et al. (2011)
investigated odour generation, based on total volatile organic sulphur compound
concentrations (TVOSCs) and also faecal coliform regrowth after dewatering of sludge. Two
types of field samples were collected. One was from a wastewater treatment plant using pre-
pasteurization/mesophilic anaerobic digestion followed by centrifuge dewatering and another
was from a plant using mesophilic anaerobic digestion followed by belt filter press
dewatering. The samples were stored at 25ºC and then analysed for the TVOSCs production
and faecal coliform regrowth. Both TVOSCs and faecal coliform regrowth showed similar
trends. Both increased soon after centrifuge dewatering, reached to peak level after a few
days and decreased to low levels after two weeks. In contrast, the belt filter pressing
dewatered samples did not show any odour generation or faecal coliform regrowth. A similar
trend was also observed in centrifuge dewatered cakes with mesophilic, thermophilic and
pre-pasteurization operations. The authors concluded that both odour production and faecal
coliform regrowth during biosolids storage are indicators of residual microbial activity.
Based on the result of this research, it is concluded that, some treatment plants, in Victoria,
using belt filter pressing following mesophilic anaerobic digestion are out of risk of odour
generation and faecal coliform regrowth. As there is no data available on air dried biosolids
regarding faecal coliform regrowth, further investigation would be warranted.

29
2.5 Safety of Biosolids
2.5.1 Public Health Risk Associated with Land Application of Biosolids
Biosolids containing different microbial pathogens create one of the most important potential
risks to public health through the faecal-oral transmission route. Faecal-oral transmission
occurs when pathogens leave an infected individual in faeces and are transmitted to a
noninfected individual through direct or indirect contact (Gerardi and Zimmerman, 2005c).
Direct contact occurs from one person to another person and indirect contact occurs through
ingestion of contaminated food, water or inhalation of contaminated air or through vectors;
fleas, flies etc. When an infective dose of virulent pathogens is ingested by a healthy person,
disease occurs and the pathogens leave the host by making their way through the
alimentary tract into the faeces (Gerardi and Zimmerman, 2005c). Table 1.6 shows
gastrointestinal disease prevalence in Australia from 2007-2011 (Department of Health and
Ageing, 2012). The minimum infective dose (MID) varies with the type of pathogen, as for
example, for viruses, helminth eggs or protozoan cysts, very few cells are required to cause
infection whereas some bacteria; pathogenic types of E. coli, Salmonella spp. require
thousands to millions of cells to cause infection (Bitton, 2011a). The MID of some pathogens
are shown in Table 2.7.

30
Table 2.7 MID of some pathogens and parasites (Bitton, 2011a)
Pathogen MID
Salmonella spp. 104-107 CFU
Shigella spp. 101-102 CFU
E. coli O157:H7 (EHEC) <100 CFU
Vibrio cholerae 103 CFU
Campylobacter jejuni ~500 CFU
Yersinia enterocolitica 106 CFU
Giardia lamblia 101-102 cysts
Cryptosporidium spp. 101 cysts
Ascaris spp. 1-10 eggs
Hepatitis A virus 1-10 PFU
EHEC= Enterohaemorrhagic E. coli, PFU=Plaque forming unit; CFU=Colony forming unit,
MID=Minimum infective dose.
Public health risk from agricultural use of biosolids occurs through consumption of raw food
grown in soil amended with biosolids (man-sludge-soil-crop-man infection pathway, shown in
Fig. 2.3, drinking water which is contaminated from runoff from soil amended with biosolids,
inhalation of aerosols and dust from soils amended with biosolids (Jimenez et al., 2002;
Toze and Sidhu, 2011).
Fig. 2.3: Man-sludge-soil-crop-man infection pathway (Jimenez et al., 2002)

31
2.5.2 Control of Public Health Risk Arising from Microorganisms
Public health risk arising from microorganisms for the land application of biosolids can be
controlled by the application of single or multiple barrier approaches to prevent the
transmission pathway. The barriers include treatment for the reduction of pathogen
concentration and vector attraction, restrictions on crops grown on soil amended with
biosolids and time intervals between biosolids application on land and grazing or harvesting
on that land applied biosolids (Godfree and Farrell, 2005).
The single barrier approach is applied to that sludge which can be applied to the land without
any restriction. In this case, sludge is treated in such level that can prevent the potential
microbiological risk to the public health. In contrast, a multiple barrier approach is applied to
sludge which requires some restrictions for land application. This approach includes barriers
which help to prevent the transmission of pathogens from raw wastewater to land-applied
biosolids. It does not require sludge treatment to reduce the pathogen concentration
significantly as it has some restrictions, such as, withholding times between biosolids
application and grazing or harvesting on the land-applied biosolids, which will cause natural
attenuation of pathogens in soil (Grant and Smith, 2010).
2.5.3 Regulatory Control of Public Health Risk
The land application of biosolids is carefully regulated to protect public health from the
potential risks arising from biosolids. To maintain this, different countries have different
regulations and it can differ among different states of Australia. Treatment processes must
be shown to reduce specific microorganisms to specified levels. In addition the sludge must
undergo a series of treatment processes that have been shown to reduce the level of
pathogens and must be stabilized to reduce the VS content (Section 2.1.1).

32
2.5.3.1 Victorian regulations
In Victoria, the classification of biosolids (Table 2.8) depends on two main factors; the
concentrations of contaminants in the biosolids and the microbial concentration in biosolids
after treatment. The classifications based on these factors are as follows:
1. Contaminant Grade (C1 or C2) based on biosolids contaminant
concentrations. This classification is determined by the presence of different
concentrations of heavy metals, such as Cu, Cd, Pb, Mg, Zn, Ca etc. in
biosolids.
2. Treatment Grade (T1, T2, T3) is based on the treatment technology,
microbiological criteria and measures used to restrict bacterial regrowth,
attraction of vectors, such as insects or vermin and odour.
Unrestricted grade biosolids are classified as C1/T1, whereas all other combinations are
restricted in their use (EPA Victoria, 2004).

33
Table 2.8 Allowable levels of various pathogens in T1, T2 and T3 Grade of biosolids in Victoria (EPA Victoria, 2004)
Classification grade
Pathogen Level
Escherichia coli Salmonella spp. Enteric viruses Helminths
T1 <100 E. coli MPN/g DSa,b <1 Salmonella/50g DSa ≤1PFU/100g DSa or,
>3 log10 reductionc
>2 log10 reduction in Ascaris eggc
T2 <1000 E. coli MPN/g DSb <10 Salmonella/50g DSb 2 log10 removalc or,
< 2 PFU/10g
DSc
2 log10 removal Taeniac, or,
<1 Taenia egg/10 g DSc
T3 <2,000,000 E .coli MPN/g DSb 1 log10 reductionc 1 log10 reductionc -
DS=Dry solid, MPN=Most probable number, PFU=Plaque forming unit
a= Verification for prescribed process, b= Routine monitoring, c= Verification for alternative process.

34
According to Victorian guidelines, prescribed processes that are listed in the guideline only
require limited verification and routine monitoring, while alternative processes (not
mentioned in the guideline) require much more extensive verification and testing (EPA
Victoria, 2004).
For T1 Grade biosolids, prescribed treatment processes require showing E. coli levels of
<100 MPN/g DS, Salmonella spp. levels of <1 Salmonella/50 g DS and enteric viruses levels
of ≤1PFU/100g DS. The requirement for alternative processes is >3 log10 reduction of enteric
viruses, 2 log10 reduction of Taenia spp. and >2 log10 reduction of Ascaris eggs (Table 2.8).
These criteria are difficult to meet due to the expense involved and very low levels of
parasites present in Victorian biosolids, making log reduction data impossible to obtain. They
can be used for land application without any restriction. Among the prescribed processes,
one is long term storage; sludge is digested, dewatered and stored for more than 3 years
(EPA Victoria, 2004). This is why a large portion of biosolids (18, 39,620 tonnes/ds) is
stockpiled (NRE, 2002) which significantly reduces the rate of beneficial use of biosolids in
Victoria every year.
For T2 Grade of biosolids, prescribed treatment processes require showing the levels of E.
coli are <1000 MPN/g DS and Salmonella spp. are <10 Salmonella/50g DS. There is a
requirement of alternative process for the removal of enteric viruses (2 log10 removal) and
eggs of Taenia spp. (2 log10 removal) in addition to the levels of E. coli and Salmonella spp.
(Table 2.8) (EPA Victoria, 2004).
For T3 Grade of biosolids, prescribed treatment processes require showing <2,000,000
MPN/g DS of E. coli and alternative treatment processes require demonstrating 1 log10
reduction of Salmonella and 1 log10 reduction of enteric viruses shown in Table 2.8 (EPA
Victoria, 2004).

35
T1 Grade is the highest microbiological grade of biosolids which is unrestricted in its uses.
T1 grade biosolids can be used in residential areas and for growing human food crops which
can be consumed raw. T2 and T3 are lesser grades of biosolids which have restricted uses;
control of public access on biosolids applied land, intervals between biosolids application
and harvesting, type of crops grown, forestry, rehabilitation (Table 2.9) (EPA Victoria, 2004).

36
Table 2.9 Biosolids classification and permitted end use in Victoria, Australia (EPA Victoria, 2004) Tr
eatm
ent g
rade
Che
mic
al g
rade
“Unr
estr
icte
d” a
“Restricted uses”
Agricultural uses Non-agricultural uses
Human food crops
consumed raw in direct
contact with biosolids b
Dairy and cattle grazing/ fodder
(also poultry), human food crops
consumed raw but not in direct
contact c
Processed
food crops d
Sheep grazing and
fodder (also horses,
goats), on food crops,
woodlots e
Landscaping
(unrestricted
public access)f
Landscaping
(restricted public
access), forestry,
land rehabilitation g
T1 C1 √ √ √ √ √ √ √
T2 C1 X X √ √ √ √ √
T3 C1 X X X √ √ X √
T1 C2 X √ √ √ √ √ √
T2 C2 X X √ √ √ √ √
T3 C2 X X X √ √ X √
√ The biosolids grade will generally be acceptable for the end use. Biosolids less than T1C1 will be subject to management controls. X Biosolids of this quality are not acceptable for the end use (would require a risk assessment and site specific EPA approval/ licensing) a Unrestricted uses – biosolids are suitable for distribution, marketing and appropriate use with only minimal controls, includes sale as a bagged product for residential use. b Human food crops potentially consumed raw and in direct contact with biosolids. c Human food crops potentially consumed raw but not in direct contact with biosolids includes those grown on trees. d Processed food crops refer to crops that are either cooked at greater than 70°C for two minutes or processed (such as cereals, wheat and grapes for wine production) prior to sale to the domestic market. e Non-human food crops include turf, woodlots, flowers and ornamental plants. f Landscaping with unrestricted public access – includes public parks and sports grounds, with controls on access during soil renovation and until fully vegetated. g Landscaping with restricted public access, land restoration – includes non-recreational land, road development, rehabilitation of quarries, mines and landfills, sewage treatment plants and other landscaping where there is controlled or limited public and stock access. Forestry also involves restricted public access and stock access.

37
2.5.3.2 Regulations in other states of Australia
Australia has a national guideline for the reuse of biosolids. Microbiological grades of
biosolids are classified into P1, P2, P3 and P4 according to the national guideline (NRMMC,
2004). Guidelines of Western Australia (Table 2.10) are similar to Federal guidelines. P1 (<1
Salmonella/50g DS; <100 E. coli or thermotolerant coliforms/g DS), P2 (<10 Salmonella/50 g
DS; <1000 E. coli or thermotolerant coliforms/g DS) and P3 (<2,000,000 E. coli or
thermotolerant coliforms/g DS) Grade of biosolids are equivalent to T1, T2 and T3 Grade for
the verification of prescribed processes in Victoria (Table 2.8). P1 Grade of biosolids can be
used for land application and other purposes without any restrictions, but P2, P3 and P4
Grades have restrictions on their use (NRMMC, 2004).
Approved or prescribed processes are those treatment processes which are described in the
guideline. These processes require verification and post verification, whereas alternative
processes, not mentioned in the guideline, require more extensive verification (EPA Victoria,
2004). According to the guideline in South Australia, microbiological grades of biosolids are
classified into stabilization Grades A and B. For stabilization Grade A, both approved and
alternative processes (not mentioned in the guideline) should fulfil the requirement of <1 E.
coli/g DS, <1 Salmonella/50 g DS, <1 virus/50 g DS and <1 helminth ova/50 g DS. For
stabilization Grade B, both approved and alternative processes should fulfil the requirement
of <1000 E. coli/g DS (EPA, DH, PIRSA, CSIRO, SA Water and United Water, 2009).
Stabilization Grade A is similar to T1 Grade in Victoria although there are some differences
in the levels of virus and helminth eggs and the criteria of prescribed and alternative
processes.
According to the guidelines in Tasmania, microbiological grades of biosolids are classified
into stabilization Grade A and B. Stabilization Grade A requires to demonstrate <1 PFU/4 g
DS of enteric viruses and <1 viable helminthic egg/4 g DS for the intial process (both
approved and alternative) verification. After initial process verification, routine monitoring

38
requires to meet levels of <100 MPN/g DS of E. coli, <100 MPN/g DS of faecal coliforms, no
Salmonella spp/100 g DS and no Listeria spp/100 g DS (Table 2.10). Stabilization Grade B
does not require determining the pathogen level (Department of Primary Industry, Water and
Environment, 1999). Stabilization Grade A is similar to T1 Grade of biosolids in Victoria
although types of pathogen, level of concentration and process verification differed from
each other.

39
Table 2.10 Grading of biosolids in different states of Australia for microbial quality assessment (Department of Primary Industry, Water
and Environment, 1999; Department of Environmental Protection, Water and River Commission, Department of Health, 2002; EPA, DH,
PIRSA, CSIRO, SA Water and United Water, 2009).
Grade of biosolids
South Australia Western Australia Tasmania
A B P1 P2 P3 P4 A B
<100 E. coli/g DS
<1 Salmonella/ 50 g
DS
< 1 virus/ 50 g DS
<1 viable helminthic
egg/ 50 g DS
<1,000 E. coli/g
DS < 1 Salmonella/ 50 g
DS
< 100 E. coli or
thermo-tolerant
coliforms/g DS
< 10 Salmonella/50 g
DS
< 1000 E. coli or
thermo-tolerant
coliforms/g DS
< 2,000,000 E. coli
or thermo-tolerant
coliforms/g DS
>2,000,000 E. coli
or thermo-tolerant
coliforms /g DS
<100 MPN E. coli/g DS
<100 MPN faecal
coliforms
Salmonella sp. ND/g DS
Listeria sp. ND /100 g
DS
< 1 PFU of enteric virus /
4 g DS
<1 viable helminthic egg
(Ascaris and Taenia
spp.)/ 4 g DS
Not necessary to
determine the
pathogen level
DS= dry solid, MPN= Most Probable Number, ND=Not detected, PFU= Plaque forming unit

40
2.5.3.3 Regulation in USA and United Kingdom
According to USEPA, under regulation 40 CFR 503, biosolids are classified into two groups;
Class A and Class B on the basis of microbiological criteria (US EPA, 2003). To quantify for
Class A biosolids, a product must demonstrate <3 MPN/ 4 g DS of Salmonella, <1 PFU/ 4 g
DS of enteric viruses and <1 viable ova/ 4 g DS of helminths (Table 2.11) for the processes
to further reduce pathogens (PFRPS) and equivalent alternative methods. Class A biosolids
must also meet the level of <1,000 MPN/ g DS of faecal coliforms and <3 MPN/ 4 g DS of
Salmonella spp., when ready to use or be disposed of. Class A biosolids can be used
without any restriction and also can be used for sale or given away in bags or containers
(NRC, 2002; US EPA, 2003). Class A biosolids for unrestricted use are similar to T2 Grade
of biosolids which have land use restrictions imposed in Victoria.
Class B biosolids are required to meet the level of <2,000,000 MPN/g of faecal coliforms for
the process to significantly reduce pathogens (PSRPS) and equivalent alternative
processes. Unlike Class A biosolids, Class B biosolids contain some pathogens, and some
restrictions on crop harvesting, animal grazing, public access are enforced after land
application. Class B biosolids cannot be used for sale or given away in bags or containers
(US EPA, 2003). Class B biosolids are equivalent to T3 Grade of biosolids Victoria.

41
Table 2.11 Allowable levels of various pathogens in US EPA Class A, B biosolids (US EPA, 2003) and UK safe sludge (ADAS, 2001;
ACMSF, 2002)
Country Types of biosolids
Pathogen level
USA
Faecal coliform Salmonella spp. Enteric viruses Helminths
Class A <1,000 MPN/ g DS <3 MPN/ 4 g DS <1 PFU/ 4 g DS <1 viable microorganism/ 4 g DS
Class B <2,000,000 MPN or
CFU/ g DS
_ _ _
UK
Enhanced >6 log removal ND -
Conventional >2 log removal - -
MPN= Most probable number, PFU= Plaque forming unit, DS=Dry solid, CFU=Colony Forming Unit, ND=Not detected

42
In the UK, sludge use for agricultural purpose is controlled by the sludge (use in agriculture)
Regulations, 1989. According to microbiological criteria, there are two types of sludge;
conventionally treated and enhanced treated sludge. Enhanced treatment requires of >6
log10 reduction of faecal coliforms and no Salmonella spp. Conventional treatment requires
>2 log10 reduction of faecal coliforms (Table 2.11) (ACMSF, 2002; ADAS, 2001). Restrictions
for land application are applied for both enhanced treated and conventionally treated sludge
especially for use on crops which are consumed raw to ensure the safe sludge matrix (Table
2.12) (ADAS, 2001).
Table 2.12 Safe sludge matrix in UK (ADAS, 2001)
Crop group Untreated sludge Conventionally treated sludge
Enhanced treated sludge
Fruit X X √
10
months
harvest
interval
applies
Salad X X (30 month harvest interval
applies) √
Vegetables X X (12 month harvest interval
applies) √
Horticulture X X √
Combinable and
animal feed crops
X √ √
Grass
and
Forage
Grazed
X
X (deep
injected or
ploughed
down only)
3 weeks
no grazing
and harvest
interval
applies
√ 3 weeks
no
grazing
and
harvest
interval
applies
Harvested X √ (no grazing
in season of
application)
√
√ All applications must comply with the Sludge (Use in Agriculture) Regulations and DETR Code of
Practice for Agricultural Use of Sewage Sludge.
X Applications not allowed (except where stated conditions apply)

43
2.6 Indicators in Biosolids
Wastewater contains many potential pathogens originating from the gastrointestinal tract of
humans and animals. This becomes a serious public health problem if wastewater is not
adequately treated or if portable water supplies and food become contaminated by untreated
wastewater. The detection and enumeration of all pathogenic microorganisms in wastewater
is very difficult, because the specific techniques for detection and identification are not
available for all potential pathogens; e.g. some enteric viruses including Norovirus and
Rotavirus cannot be cultured by conventional cell culture methods (Toze and Sidhu, 2011).
Another dilemma is that quantification becomes expensive and time consuming due to the
intermittent appearance of most of the pathogens in low numbers. Therefore early
bacteriologists developed methods using microbial indicators for faecal pollution of water (Ng
et al., 1993; Wen et al., 2009). As wastewater effluents are a major source of
microorganisms of faecal origin, the concept of using microbial indicators can be applied to
wastewater. The principle behind using indicator organisms is that a microorganism which is
always present in faecal matter could serve as surrogate for the detection of pathogens in
biosolids (Sidhu and Toze, 2009).
Several criteria have been proposed for an ideal faecal indicator in water or wastewater. All
of these criteria should be fulfilled for a good faecal indicator. The criteria are as follows: the
microorganism should be consistently present in large numbers in faecal material, should not
be capable of multiplying outside the host environment, should be as resistant or marginally
more resistant as the pathogen it represents against inactivation by environmental conditions
and disinfection, should have a strong association with the presence of pathogenic
microorganisms and should be easily detected and quantified without giving any false
positive results (Hurst et al., 2002). Total coliforms, E. coli, fecal enterococci, somatic
coliphage, F-specific coliphage, phage infecting Bacteroides fragilis and Clostridium
perfringens have been used as indicators for the presence of pathogens in wastewater or

44
reclaimed water (Lucena et al., 2004; Harwood et al., 2005; Alcalde et al., 2003; Costan-
Longares et al., 2008).
Several studies have attempted to examine the relationship between the presence and
concentration of indicators and pathogens in the effluent produced during wastewater
treatment. Costan-Longares et al. (2008) monitored the removal and relationships among
different microbial indicators: total coliform, E. coli, enterococci, spores of sulphite reducing
clostridia, somatic coliphage, F-specific coliphage, phages infecting Bacteriodes fragilis,
phages infecting Bacteriodes tethaiotaomicron and two selected pathogens; cytopathogenic
enteroviruses and viable Cryptosporidium oocysts. The studies were conducted at four water
reclamation facilities in Spain. Samples were collected from secondary and tertiary effluents.
The results showed that in tertiary effluent compared with secondary effluent, the average
log reduction for bacterial indicators was in the range of 2.0 to 4.4 log10, whereas for
bacteriophages, the range was 2.2-2.7 log10. Enteric viruses showed 3.3 log10 reductions
whereas Cryptosporidium showed lowest reduction of 0.98 log10. Statistical analysis showed
that the concentration of bacteriophages was able to predict both the presence and
concentration of enteroviruses, whereas there was no predictive relationship between any of
the microbial indicators and viable Cryptosporidium oocysts. The results of this study
suggested that bacteriophages are good indicators for enteric viruses, but there were no
good indicators for Cryptosporidium oocysts. A combination of bacterial and bacteriophage
indicators was determined to be the best choice to ensure the microbial quality of reclaimed
water (Costan-Longares et al., 2008).
Harwood et al. (2005) assessed the validity of using coliform (total and faecal coliform)
bacteria and other microbial indicators; enterococci, Clostridium perfringens, F specific
coliphage and somatic coliphage to predict the presence or absence of pathogens in
effluent. Both influent and effluent samples were collected from six different wastewater
reclamation facilities in the US. The abovementioned indicators as well as pathogens;

45
enteric viruses, Giardia spp. and Cryptosporidium spp. in both influent and effluent were
quantified using different microbiological techniques. The authors also evaluated the
relationships among different pathogens and indicators by several statistical methods,
including binary logistic regression and discriminant analysis. The results showed that
pathogen concentrations in the influent were 4 to 5 orders of magnitude lower than indicator
microorganism concentrations. Statistical analysis showed no significant correlation between
concentrations of any combination of indicator microorganism and pathogens whereas
significant correlation was observed between indicator microorganism concentrations.
Descriptive analysis showed that no single indicator was most highly predictive of the
presence or absence of pathogens. The results from binary logistic regression analysis
showed a weak, but statistically significant relationship between the presence or absence of
enteric viruses and somatic coliphages whereas no significant correlation was found
between enteric viruses and F-specific coliphage (Harwood et al., 2005). An important
limitation of this study was that the authors did not include any bacterial pathogens to
compare with the bacterial indicators, nor any indicators applicable to protozoan pathogens,
eg: Giardia, Cryptosporidium oocysts.
These studies examined effluent rather than sludge, which is likely to demonstrate more
complex indicator-pathogen relationships due to its composition. However, Gibbs et al., 1995
and Eamens et al., 2006 investigated the survival and regrowth of pathogens and indicators
in wastewater sludge and in sludge-amended soil. Gibbs et al., 1995 quantified indicators
(faecal coliform; faecal streptococci) and pathogens (Salmonella spp., Giardia cysts) in
stockpiled sludge for 53 weeks of storage. Results showed that faecal coliforms and
Salmonella spp. were not detected after 34 weeks of storage but regrew after 52 and 53
weeks of storage in piled sludge taken from 20-40 cm. below the surface. Faecal
streptococci also regrew after 34 weeks of storage and Giardia cysts concentrations were
stable throughout the storage period. Faecal coliforms and streptococci reduced from 105
CFU/g to undetectable and 103 CFU/g respectively after 34 weeks of storage whereas the

46
initial concentration of Salmonella spp. was very low and was reduced to undetectable after
34 weeks. The regrowth occurred due to the sudden rainfall recorded in week 52, just before
sample collection (Gibbs et al., 1995). Eamens et al., 2006 also found different die-off and
regrowth patterns of E. coli and Salmonella spp. in biosolids after land application as the
initial concentration of E. coli and Salmonella spp. were different during land application. In
this study, mechanically dewatered biosolids were either incorporated or surface-applied on
agricultural land at three sites in Goulburn, NSW during summer and spring seasons. The
concentrations of E. coli and Salmonella spp. in soil were determined for up to 51-68 weeks
after land application. The results showed that in Goulburn 1 field test, during summer
application, E. coli and Salmonella spp. concentrations declined from 106 CFU/g to baseline
levels in 40 and 51 weeks respectively. In Goulburn 2 field test, during spring application,
Salmonella spp. showed a lower initial concentration (~102 CFU/g) and also regrowth in
weeks 10 and 39 for the incorporated plots whereas E. coli showed a high initial
concentration (106 CFU/g) and no regrowth pattern. Both species declined from initial
concentrations to baseline levels in weeks 64 and 65 respectively. In Goulburn 3 field test, E.
coli concentrations declined from >103 CFU/g to above baseline levels in week 44 and
showed regrowth between weeks 19 and 25 whereas Salmonella spp. declined from >102
CFU/g to the above baseline levels in week 52 and did not show any regrowth. It was
suggested that regrowth of different bacterial species in different sites was influenced by
environmental factors (Eamens et al., 2006). Although there has been some research on
pathogen-indicator relationships in stored sludge, more research is therefore needed to
assess the pathogen and indicator relationship in sludge during treatment processes.
2.6.1 Escherichia coli
E. coli is the member of the coliform group and also the family of Enterobacteriaceae. It can
be described as a facultative anaerobic, Gram-negative, non-spore-forming, rod-shaped
bacterium, with 99% of strains containing the β-glucuronidase enzyme.

47
E. coli is a normal inhabitant of the intestines of humans and warm-blooded animals. It is not
usually found in soil and water, unlike some other bacteria in the family of
Enterobacteriaceae. Human and animal faeces contain high concentrations of E. coli; about
109 CFU per gram (Edberg et al., 2000). Usually, E. coli multiplies within the host
environment (Sidhu and Toze, 2009). It is susceptible to environmental factors, such as
elevated temperature, sunlight exposure, and presence of different types of other microflora.
E. coli is considered as an ideal indicator of the potential presence of pathogens in biosolids
as it is present in large numbers in faeces, but in small numbers in general environment and
it has a degree of environmental tolerance compared to other enteric bacteria (Hurst et al.,
2002; Sidhu and Toze, 2009).
The assumption is that E. coli removal rates during wastewater treatment process should
follow a similar pattern of reduction to pathogenic bacteria because of the similar reaction of
the intestinal pathogenic bacteria and E. coli to environmental phenomena as the coliforms.
There are however, some differences in the reported correlation between the reduction of
indicator bacteria and pathogens in biosolids after land application (Gibbs et al., 1995;
Eamens et al., 2006).
2.6.2 Enterococcus spp.
Enterococci are facultative anaerobic, Gram-positive, catalase negative, non-spore forming
bacteria which are usually found in the alimentary tract of humans. They are also found in
environmental and animal sources. This genus includes several species; some are mainly
from humans and others mainly from animals. For example: Enterococcus faecalis,
Enterococcus faecium, Enterococcus durans, Enterococcus hirae are mainly of human
origin, but may also be found in animals. Some species show a high degree of specificity to
animals or birds, e.g. Enterococcus cecorum and Enterococcus columbae, Enterococcus
gallinarum (Horan, 2003). Enterococci can survive in very adverse environmental conditions,
such as extreme temperatures ranging from 5 to 65°C, pH ranging from 4.5 to 10 and
48
hypersaline conditions, which help them to grow in a wide range of niches (Fisher and
Philips, 2009).
Enterococcus spp, have a number of advantages over coliform bacteria as indicators of the
presence of faecal pathogens in biosolids. Enterococcus spp. are used as indicator
organisms for water quality measurement and also as an indicator for sewage treatment
because of their strong resistance against hostile environmental conditions compared to E.
coli as well as their general inability to multiply in the environment and limited host range
(Wheeler et al., 2002). Enterococci are also present in high numbers in wastewater,
biosolids and compost so that they can be easily detected (Harwood et al., 2005).
2.6.3 Bacteriophage
Bacteriophages are viruses that infect bacteria and are considered as effective indicators of
enteric viruses because of their similar morphology and replication (Grabow, 2001).
Coliphages are bacteriophages that infect E. coli. Somatic coliphages are a heterogenous
group and contain either a DNA or RNA genome. They infect different specific E. coli hosts,
depending on their surface proteins. F specific coliphages (e.g. MS2), also called male-
specific coliphage, are a subgroup of coliphage, which infect E. coli cells containing F or sex
pillus (Donnison and Ross, 1995; Havelaar and Nieuwstad, 1985). Bacteriophages which
infect Bacteroides fragilis, a Gram-negative rod, obligate anaerobe and the most abundant
bacterium in the colon of humans, are recognised as B. fragiis phages (Puig et al., 2001).
P22 bacteriophages are temperate bacteriophages containing a linear, double stranded DNA
genome which infect S. Typhimurium (Rhoades et al., 1968).
Bacteriophages have been used as indicators for enteric viruses in several studies of
wastewater sludge and water (Funderburg and Sorber, 1985; IAWPRC, 1991; Ueda and
Horan, 2000; Grabow, 2001; Lucena et al., 2004). Three types of bacteriophages, somatic
coliphages, F-specific coliphages, and B. fragilis phages have been used as indicators of

49
viruses (Havelaar and Nieuwstad, 1985; Jofre et al., 1989; Morinigo et al., 1992). Donnison
and Ross (1995) compared the relative proportion of different coliphages (somatic coliphage,
F-specific RNA and F-specific DNA phages) in lagoons treating human waste to those in
lagoons treating animal wastes. The results showed the consistent presence of F-RNA, F-
DNA and somatic coliphages in lagoons treating human waste whereas the lagoons treating
meat processing waste showed the consistent presence of F-RNA and somatic coliphage
(Donnison and Ross, 1995). The studies on potential usefulness of coliphage as indicators
for the decay of enteric viruses in biosolids are very limited. No studies have been done on
comparison of the levels of coliphage and enteric viruses in biosolids.
2.7 Inactivation Mechanisms and Factors of Pathogens and Indicators in Wastewater
Treatment System
After the entry of raw wastewater into the treatment system, primary sedimentation followed
by screening and grid chambers, most of the pathogens from the primary clarifier are
transferred to settleable solids through the mechanism of adsorption. Among the pathogens,
protozoan cysts and helminth eggs are removed more efficiently from primary clarifiers
during primary sedimentation because of their size and density (Gerardi and Zimmerman,
2005d). This is why; primary sludge contains high number of pathogens (Gerardi and
Zimmerman, 2005d). Secondary sludge coming from biological wastewater treatment
processes, including activated sludge process and trickling filters contains a high number of
pathogens due to the adsorption of pathogens into floc materials and biofilms and also the
secretions of ciliated protozoa, rotifiers and free-living nematodes, which change the surface
charge of pathogens and initiate their adsorption into floc materials and biofilm (Gerardi and
Zimmerman, 2005d; Pell and Worman, 2011). Primary and secondary sludge is then
transferred to the sludge treatment processes in which pathogens may be inactivated
through physical, chemical, biological and environmental means (Gerardi and Zimmerman,
2005d). Among these, anaerobic environment, competition for nutrients, dessication,
elevated temperature, depressed (<3) or elevated pH (>11), inability to find a suitable host

50
and long retention time are important factors that affect microbial numbers during sludge
treatment. Predation by higher life forms, entrapment in biological solids, inability to adapt to
a free living state in the aquatic environment and UV light penetration also affect the ability of
different microbes to survive during wastewater treatment (Gerardi and Zimmerman, 2005d).
Since UV light has limited ability to penetrate sludge and wastewater due to turbidity, it is
likely to have only a limited impact on the decay of pathogens in drying pans.
2.7.1 Factors Affecting Die-off of Pathogens During Wastewater Treatment System
2.7.1.1 Factors affecting pathogen inactivation during wastewater treatment
2.7.1.1.1 Predation
The effect of predation on the fate of bacteria during wastewater treatment, especially
biological treatment was investigated by several groups (Curds and Fey, 1969; Drift et al.,
1977; Chabaud et al., 2006). Among the protozoan populations, ciliated protozoa are the
most dominant in activated sludge. Ciliates can be classified into three forms; free-
swimming, crawling, attached or sedentary form (Curds, 1973). Curds and Fey (1969)
investigated the effect of ciliated protozoa on the removal of E. coli from the activated sludge
process. Two bench-scale activated sludge plants were constructed. E. coli was added to
autoclaved sludge in both plants and initially both plants were operated without any
protozoa. The results showed that the number of E. coli decreased in both effluent and
mixed liquor compared with influent with an overall reduction of 54%. A mixed population of
ciliated protozoa was then added to one of the plants and a considerable reduction of the E.
coli population (95.5%) in both mixed liquor and effluent was found. There was no significant
change in number of E. coli in another plant without any protozoa. The half-life of E. coli in
the plant without protozoa was 16.1 hr whereas in the presence of protozoa it was 1.8 hr.
These results suggested that ciliated protozoa play an important role for the removal of E.
coli in sewage sludge. As there was a reduction in numbers of E. coli in effluent and mixed

51
liquor in protozoa-free sludge, it is clear that other factors are involved in the reduction of E.
coli in sewage sludge (Curds and Fey, 1969).
Drift et al. (1977) studied the fundamental processes and mechanisms involved on removal
of E. coli in wastewater treated by the activated sludge process. Mixed liquor samples were
collected from the activated sludge plant and flocs were removed to obtain wastewater. Both
mixed liquor and aerated wastewater were seeded with a streptomycin-resistant strain of E.
coli. After appropriate time intervals, the numbers of E. coli in the free state and bound to the
sludge flocs were counted. E. coli cells with a fluroscent label were also prepared and added
to the mixed liquor. At different time intervals, the samples were examined by fluorescence
microscopy. The results demonstrated that the removal of E. coli occurred through a
biphasic process. There was a rapid sorption of E. coli to the sludge flocs in first hour of
seeding, as shown by a rapid decrease in numbers of free E. coli, while the total number of
E. coli decreased much more slowly during this period. After one hour, there was a rapid
removal of E. coli. After 21 hr after addition of fluorescent E. coli to the mixed liquor sample,
fluorescent food vacuoles appeared in ciliates and almost all fluorescent bacteria
disappeared. The authors concluded that the removal of bacteria in wastewater treated with
activated sludge process occured through a biphasic process. One is through rapid sorption
and the second is by predation by protozoa (Drift et al., 1977).
Chabaud et al. (2006) examined the effect of biofilm and protozoa on removal of bacteria
from a septic effluent. For this purpose, at first the removal of faecal coliforms, total coliforms
and aerobic bacteria was compared between septic effluents treated or untreated with an
inhibitor of protozoa (cycloheximide). The survival of endogenous faecal bacteria and total
coliforms in septic effluent in the presence of active and inactivated endogenous protozoa
was also examined. The removal of total coliforms, faecal coliforms and aerobic bacteria
was also investigated by applying septic effluent to glass slides with a biofilm-containing
active protozoa, or with a biofilm containing inactivated protozoa or without a biofim. After 3

52
days of contact with cycloheximide, most of the protozoa were inactivated. The rate of
removal of bacteria in septic effluent with inactivated endogenous protozoa was 10-fold
lower than in effluent containing active protozoa. In addition, protozoa within a biofilm were
responsible for greater bacterial removal than biofilm without protozoa in the absence of
biofilm (Chabaud et al., 2006). This research showed that predation by protozoa is an
important factor affecting bacterial die-off especially in the activated sludge process and in
septic tank systems.
From the above research, it can be concluded that predation by protozoa affects pathogen
removal during the activated sludge process and in septic tank systems. There are no
studies of predation by protozoa during sludge treatment process. However predation is
likely to occur during sludge treatment process before moisture content drops below levels
that cannot sustain the trophozoite form of the parasite and encystment occurs.
2.7.1.1.2 Adsorption
Other factors, such as, adsorption can affect pathogen removal from the liquid phase and
concentration in the solid phase. Adsorption of viral particles onto solids is one of the most
important factors affecting viral concentration in the solids phase of sewage sludge
(Chalapati Rao et al., 1981; Lewis et al., 1986; Ohgaki et al., 1986). Ohgaki et al. (1986)
examined the mechanism of adsorption-desorption of coliphage to suspended particulates.
For the adsorption-desorption experiment, a coliphage stock solution was inoculated into a
solution containing aerated microbial particulates. After further aeration, the bottles
containing the mixture were allowed to stand at room temperature for 21 hr and were
aerated again. Dissolved oxygen concentration, coliphage concentration in the liquid phase
and those adsorbed to the particulates were determined. The oxygen concentration
decreased over the experimental period. The adsorption of coliphage to microbial
particulates occurred in aerobic conditions whereas desorption was observed in anaerobic
conditions. This work shows that coliphage, and probably also enteric viruses, are

53
concentrated in the sludge layer of settlement ponds, attached to solid particles. Detachment
may occur when conditions become anaerobic. From the above research, it can be
concluded that adsorption is one of the factors affecting virus removal from the surface layer
of the oxidation pond system during wastewater treatment.
2.7.1.1.3 Photooxidation by sunlight and the effect of pH and dissolved oxygen
Sunlight effects bacterial decay during wastewater treatment, lagoon based treatment, but
has very limited ability to penetrate sludge. The effect of sunlight is modified by pH and
dissolved oxygen, which together are responsible for bacterial decay. The mechanism of
photooxidation is that the energy in light is absorbed by a chemical or sensitizer which
converts the oxygen into its excited state which is toxic. The toxic forms of oxygen include
singlet oxygen, superoxide, hydrogen peroxide and hydroxyl radicals. Microorganisms are
killed when the toxic form of oxygen enters cells and oxidizes vital cellular components. The
rate of photooxidation is increased with increasing dissolved oxygen and this process is also
increased with higher pH, because of the prolonged life of toxic forms of oxygen in higher pH
(Curtis et al., 1992; Maynard et al., 1999).
Curtis et al. (1992) investigated the effect of pH, oxygen and humic substances on the ability
of sunlight to damage faecal coliforms in a lagoon system, using simple beaker experiments
with filter devices having different absorbances. Beakers with wastewater from a maturation
pond were placed in the sun and in the dark. Wavelengths of up to 700 nm damaged faecal
coliforms whereas damage at wavelengths of <425 nm depended on the presence of
dissolved humic substances, which provided partial protection. The ability of light to damage
faecal coliforms was also dependent on dissolved oxygen and was elevated at pH 9.5
(Curtis et al., 1992). The criticism of this study is that as this experiment was done in
beakers using lagoon sludge, and the destruction of coliforms was examined only on the
surface.
54
Reinoso et al. (2008) evaluated the effect of sunlight, the depth and type of waste
stabilization ponds on Cryptosporidium parvum oocyst inactivation. This study was carried
out in a lagoon system consisting of two anaerobic ponds in parallel followed by a facultative
pond and a maturation pond. Three cellulose semi-permeable bags containing sterile water
and 106 C. parvum oocysts were placed at the surface of each pond and at the bottom of the
anaerobic and facultative ponds. There was a gradual decrease in viability of oocysts over 4
days in all ponds. The greatest loss of viability occurred at the surface, but some inactivation
of oocysts also occurred at the bottom of the facultative pond (Reinoso et al., 2008). Both
sunlight and anaerobic conditions appeared to contribute to loss of viability of
Cryptosporidium oocysts.
Ohgaki et al., 1986 examined the effect of sunlight on inactivation of coliphage in an
oxidation pond. Glass bottles containing buffer solution and coliphage were placed in the
pond from 9:30 am to 4:00 pm at different depths below the surface; 10 cm depth, 100 cm
depth. Half of the bottles were covered with aluminium foil to protect them from sunlight. The
results showed that Inactivation of coliphage occurred only at ≤10 cm from the surface of the
pond (Ohgaki et al., 1986).
Taken together, these studies suggest that sunlight is an important factor in removal of
suspended pathogens in the surface layer of ponds and lagoons but not the sludge layer at
the bottom, where other factors apparently come into play.
2.7.1.2 Factors affecting pathogen and indicator die-off during sludge treatment
Pathogen decay in biosolids occurs due to a combination of physical, chemical and
biological factors. Factors affecting pathogen removal depend on the type of treatment
processes used and the density and behaviours of the pathogens in sewage sludge. The
physical and chemical nature of sludge will determine whether the environmental conditions
are suitable for the survival of pathogens. In general, time of exposure, temperature, pH,

55
dissolved oxygen content, competition with indigenous flora, microbial antagonism, predation
and antimicrobial substances (VFAs, NH3) and desiccation are the most important factors
affecting pathogen removal (Ward et al., 1981; Yeager and Ward, 1981; Hussong et al.,
1985; Millner et al., 1987; Gaddad and Rodgi, 1987; Sidhu et al, 2001; Kato et al., 2003;
Smith et al, 2005; Lang and Smith, 2008; Popat et al., 2010; Ziemba and Peccia, 2011;
Chen et al., 2012).
2.7.1.2.1 Temperature
Temperature is one of the most important factors controlling bacterial removal during
sewage sludge treatment. Lang and Smith (2008) studied the effect of temperature (35ºC,
55ºC and 70ºC), relevant to sludge treatment processes, on inactivation of the enteric
bacteria, E. coli and Salmonella spp. Field and laboratory strains of E. coli and Salmonella
spp. were inoculated into tryptone soya broth (TSB) and centrifuged liquid raw sludge
supernatant (CLRS). At pasteurization temperature (70ºC), all of the enteric strains except
Salmonella Senftenberg were inactivated in both media after 10 sec. There was an 8 log10
reduction compared with the initial bacterial concentration. S. Senftenberg was killed within
10 sec in CLRS but survived for 40 sec in TSB. At 55ºC, all of the strains were inactivated
within 20-60 min in both media, but inter-strain differences in heat tolerance were detectable.
At 35ºC, the log removal for all of the strains was approximately 1.5 log10 after 20 days of
incubation in TSB and in CLRS. E. coli showed 1-1.5 log10 reduction and S. Senftenberg
showed 2.4 log10 reductions after 20 days of incubation. In summary, enteric bacteria
decayed rapidly at thermophillic and pasteurization temperatures, however, mesophilic
temperatures presented little challenge to their survival (Lang and Smith, 2008).
Ziemba and Peccia (2011) examined the effect of different temperatures (37ºC, 50ºC, 55ºC,
60ºC and 70ºC) on decay of E. coli, E. faecalis and MS2 bacteriophage in sewage sludge
collected from a mesophilic anaerobic digester. The sludge was autoclaved for 30 mins,
homogenized in a blender for 20 min at pH 7.5 and incubated anaerobically. After spiking

56
samples with bacteria, the decay coefficients were measured by culturing E. coli and E.
faecalis at intervals during the incubation. Decay coefficients of each microorganism
increased with increasing temperature. The decay coefficient at 50ºC was 1.4 log10/h for E.
coli and 1.0 log10/h for E. faecalis; at 55ºC the rate was 6.8/h for E. coli and 6.7 log10/h for E.
faecalis; at 60ºC, it was 650 log10/h for E. coli and 177 log10/h for E. faecalis; at 70ºC,
complete inactivation of both E. coli and E. faecalis was observed. For MS2 bacteriophage,
the decay coefficient was lower than that of E. coli and E. faecalis. At 60ºC and 70ºC, it was
6 log10/h and 36 log10/h respectively. As MS2 bacteriophage showed higher thermal
resistance, the authors suggested it could be considered as more conservative indicator at
thermophilic and pasteurization temperatures than faecal coliforms (Ziemba and Peccia,
2011).
Popat et al. (2010) examined the effect of temperature on inactivation of Ascaris suum and a
vaccine strain poliovirus type 1 (PVS-1) in thermophilic anaerobic digesters at temperatures
of 51.1°C, 53.3°C and 55.5°C. Inactivation was fastest at 55.5°C and slowest at 51.1°C.
Irrespective of temperature, there was > 2 log10 reduction of Ascaris suum and > 3 log10
reduction PVS-1 within 2 h of treatment (Popat et al., 2010). In this study, inactivation was
not studied at 35°C.
Kato et al. (2003) investigated the effect of different temperatures; 37°C, 47°C and 55°C on
the inactivation of Cryptosporidium oocysts and Ascaris eggs in sludge under the conditions
of aerobic and anaerobic digestion with 10 days retention time. More than 99% of the
oocysts were inactivated within 10 days at 37°C, 4 days at 47°C and 2 days at 55°C under
both conditions, whereas eggs were inactivated more quickly in anaerobic conditions than
aerobic conditions. At 55°C, >99% inactivation occurred within 1 hr. under both conditions.
At 47°C, 95% eggs were inactivated within 2 days and at 47°C, about 75% eggs were
inactivated within 10 days and at 37°C, 75% eggs were inactivated within 10 days under
anaerobic conditions whereas at 37°C, no inactivation of eggs was observed within 10 days

57
under aerobic conditions. This result suggests that raised temperature has a major effect on
inactivation of Cryptosporidium oocysts and Ascaris eggs but even at temperature of 37°C,
some inactivation occurs (Kota et al., 2003).
These studies show that temperatures used for thermophilic digestion and pasteurization are
effective in reducing the numbers of most microbes, microbial counts are also reduced at
temperatures used for MAD. Apart from specific mesophilic, thermophilic and pasteurization
treatment temperatures, ambient temperature has also an effect on pathogen reduction
during sludge treatment. According to US EPA (1989), air drying of sludge treatment at
ambient temperature is sanctioned. In this process, the partially digested sludge is
transferred to exposed beds <23 cm deep, at an average daily temperature of >0ºC for at
least 60 days of total 90 days of drying. It was estimated that about 1 log10 reduction of
pathogens occurred in this process (US EPA, 1989). At ambient temperature, the principal
process involved in pathogen inactivation during sludge treatment, especially in cold
climates, is the production of fatty acids and other antimicrobial substances, such as NH3
(Bitton, 2011b) and also the activity of microflora (Carrington, 2001).
2.7.1.2.2 Moisture content
Moisture availability is critical for microbial growth. Reducing the moisture content of sludge
reduces the suitability of the sludge matrix for pathogen survival (Ward et al., 1981; Yeager
and Ward, 1981).
Ward et al. (1981) determined the effect of moisture content on the survival of several
bacterial species (Klebsiella, Enterobacter, Proteus mirabilis, S. Typhimurium, E. coli and
Streptococcus faecalis) in sludge by evaporating the sterilized sludge at 21˚C in the
laboratory. Sterilized sludge containing 5% DS was spiked with different bacterial species
and growth was increased from 108 CFU/g to 109 CFU/g after 48 hr of incubation at 37˚C.
Sterilized sludge with grown levels of microorganisms were poured in glass drying pans of

58
about 1 cm deep and dewatered by natural evaporation at 21˚C. The result showed that the
levels of microorganisms initially increased followed by a continuous decrease in numbers
with further dewatering up to 95% DS after about 7 days. The decrease was one-half to one
order of magnitude for all of the bacterial species, except P. mirabillis in which it was four
orders of magnitude (Ward et al., 1981).
Yeager and Ward (1981) examined the effect of moisture content of sludge in long term
storage and regrowth potential of S. faecalis, P. mirabilis and S. Typhimurium. Raw sludge
samples were dried by natural evaporation at 21˚C, dehydrated at 80˚C, pulverized and
sterilized by ionizing radiation. The sterilized, powdered sludge was adjusted to different
moisture levels (10-95%) by addition of water and known concentrations of the different
bacteria were added. The samples were maintained in sealed containers at 21˚C. Bacterial
growth was monitored periodically. Populations of all the bacterial species were stable in
sludge containing 5% DS, whereas this stability was decreased in dried sludge containing
90% DS. Growth of each species occurred in samples containing <75% solids, whereas no
growth was observed in samples containing >85% solids (Yeager and Ward, 1981).
From this research, it is concluded that, with the increase of DS content of sludge, spiked or
indigenous bacteria cannot survive, which suggests that loss of moisture content in sludge
has an effect on bacterial survival. The critical moisture content values to prevent regrowth
and to reduce survival of pathogens should be considered in the context of the storage and
drying requirements.
2.7.1.2.3 Competition and predation
Different types of microorganisms including potential pathogens and indicators, as well as,
bacteria are involved with anaerobic digestion of sewage sludge. These bacteria are likely to
compete with each other for the same substrate (Bitton, 2011b). Predation by anaerobic
protozoa may also be one of the important factors affecting bacterial die-off during

59
mesophilic anaerobic digestion. Some evidence is available that protozoa survive in the
anaerobic environment during the MAD process (Narayanan et al., 2007; Finlay and
Fenchel, 1991). Narayanan et al. (2007) isolated the anaerobic ciliate Metopus sp. from an
anaerobic reactor, indicating that at least some protozoa can survive in MAD. Although a
different consortia of microorganisms are present in lagoons, similar interactions are likely to
occur. Therefore, bacterial predation by protozoa and competition among different
microorganisms may affect bacterial die-off during sewage sludge treatment. This could
occur due to competition among different microorganisms for the same substrate (Bitton,
2011b), nutrient depletion leading to microbial inactivation, or predation by protozoa.
The effect of indigenous microflora on the fate of S. Typhimurium in composted biosolids
was examined by Sidhu et al. (2001). Composted biosolids samples aged from two weeks to
2 years were collected and sterilized by autoclaving and gamma irradiation and provided
bioavailable nutrients. Both sterilizied and nonsterilized samples were seeded with a
rifampicin-resistant strain of S. Typhimurium which has a higher maximum growth rate
compared to other strains of Salmonella spp. and E. coli. In sterilized composted biosolids,
S. Typhimurium grew rapidly during 30 hr of incubation. This was attributed to killing of
native competitive/predatory flora by high temperature or pressure and release of nutrient
from the biomass. The growth rate was lower in sterilized composted biosolids stored for 33
and 117 weeks than in fresher materials. This was attributed to the increase of stability of
biosolids and consequent loss of nutrient availability during the storage period. The decay
rate of seeded S. Typhimurium in non-sterilized biosolids was significantly greater than in
sterilized biosolids. Moreover, the decay rate of seeded S. Typhimurium in non-sterilized
biosolids composted for two weeks was higher than that of composted biosolids stored for
117 weeks. It was concluded that in the absence of indigenous flora, S. Typhimurium growth
increased whereas in the presence of indigenous flora, growth was suppressed. Long term
storage of composted biosolids decreased the decay rate of S. Typhimurium because of the
decline of indigenous flora (Sidhu et al., 2001).

60
Although there has been research on microbial competition during sludge treatment, there
are still gaps in understanding the decay mechanisms of pathogens during sludge treatment,
especially mesophilic anaerobic digestion and air drying in pans.
2.7.1.2.4 Retention time
Retention time is one of the key factors affecting bacterial die-off during sewage sludge
treatment, although it is related with other factors, such as temperature, pH and presence of
indigenous flora. The retention time affects pathogen reduction for sludge treatment
processes, such as MAD, air drying in pans which are involved with low temperatures
(Carrington, 2001). During MAD, solid retention time is very important for the adaption of
microorganisms to toxic conditions by which anti-microbial substances; NH3, fatty acids will
be produced so that solid retention time should be long enough to produce these substances
by the process of hydrolysis, acidogenesis and methanogenesis (Sanin et al., 2011b). Solid
retention time may vary from 15 days (if it is short) to 75 days (if it is long), although more
than 8 days is required to achieve methanogenic conditions (Miron et al., 2000).
Chen et al. (2012) investigated the effect of solid retention time on pathogen removal during
MAD of sludge. A MAD digester was set up by feeding a mixture of primary and activated
sludge and using solid retention times of 11, 16 and 25 days at 35°C. E. coli and Salmonella
spp. were quantified in both feed sludge and effluent sludge. The results showed that the
removal of E. coli and Salmonella spp. increased with increasing retention time. The removal
of E. coli was 1.93, 2.98 and 3.01 log10 unit and the removal of Salmonella spp was 1.93,
2.76 and 3.72 log10 unit for the solid retention time of 11, 16 and 25 days respectively (Chen
et al., 2012).
In the case of sludge drying in beds, retention time varies from several weeks to several
months. Retention time depends on time required to achieve the desired DS value of sludge
and it also differs in different climatic and other environmental conditions (Sanin et al.,

61
2011c). Not much research has been done on the effect of retention time on pathogen
removal in sludge drying in beds.
From the review of the factors affecting pathogen inactivation during sludge treatment, it can
be concluded that although some research has been done in this area, more research is
required to understand the environmental factors and decay mechanisms especially during
MAD and air drying of sludge.
2.8 Removal of Indicators During Wastewater Treatment System
The factors described in the previous section influence the removal of pathogens and
indicators during wastewater and sludge treatment. Some evidence of pathogen and
indicator removal during wastewater and sludge treatment is given below.
2.8.1 Indicator Removal During Wastewater Treatment
Kazmi et al. (2008) investigated faecal coliform removal in activated sludge processes. Both
influent and effluent were collected from different treatment plants operating activated sludge
processes in India and faecal coliforms and total coliforms were quantified. Concentrations
of total coliforms and faecal coliforms in the influents were between 107 and 109 CFU/mL.
The overall removal of total coliforms and faecal coliform by the activated sludge process
was 2.2 log10 and 2.4 log10 respectively (Kazmi et aI., 2008).
Wen et al. (2009) operated a bench scale activated sludge reactor in a laboratory treatment
system using primary settled wastewater collected from a local wastewater treatment plant.
The native microflora; E. coli, enterococci and Clostridium perfringens spores and spiked
MS2 bacteriophage, poliovirus and Ascaris suum were quantified. There was about 2-3 log10
reduction of indicators including about 2 log10 reduction of MS2 bacteriophage. The average
removal of poliovirus (3.34 log10) was higher than that of MS2 bacteriophage (1.85 log10)
(Wen et al., 2009).

62
Zhang and Farahbakhsh (2007) investigated the efficacy of conventional activated sludge
processes with advanced tertiary treatment in removing total and faecal coliform, somatic
and F-specific coliphage by collecting samples from local wastewater treatment plants. The
results showed that conventational activated sludge process removed about 1.5-2.3 log10
unit of coliphage and 1.9-2.3 log10 unit of faecal coliform from wastewater (Zhang and
Farahbakhsh, 2007).
The research described in this section indicates that activated sludge process is responsible
for ~2-3 log10 reduction of bacterial and viral indicators.
2.8.2 Indicator Removal During Sludge Treatment
Although much research has investigated the inactivation of different pathogens by sewage
sludge treatment processes, most has been concerned with anaerobic digestion. Sahlstrom
et al. (2004) surveyed the presence of bacterial pathogens: Salmonella spp. L.
monocytogenes, C. jejuni, C. coli, E. coli O157 and also the sludge treated by mesophilic
and thermophilic anaerobic digestion. Salmonella spp. was found in 67% of raw sludge and
55% in treated sludge samples. About 49 different serotypes of Salmonella spp. were
detected in both raw and treated sludge. C. jejuni, C. coli, L. monocytogenes and E. coli
O157 were found in 9%, 20%, 12% and 2% of raw sludge respectively and 2%, 4%, 2% and
0% of treated sludge. There was a 4 log10 reduction of coliforms and 3 log10 reduction of
enterococci during thermophilic anaerobic digestion but only 1.4 log10 reduction of coliforms
and 1 log10 reduction of enterococci during mesophilic anaerobic digestion. Clostridium spp.
were not reduced by treatment. The authors concluded that conventional sewage sludge
treatment processes, operating in the surveyed wastewater treatment plants in Sweden are
effective in inactivating both pathogens and indicator organisms (Sahlstrom et al., 2004).
Watanabe et al. (1997) completed a field study and also a laboratory investigation of the
inactivation of pathogens during MAD and thermophilic anaerobic digestion of sewage

63
sludge. For the field study, 17 treatment plants were sampled in Japan and faecal coliform,
enterococci and Salmonella spp. were counted in raw and digested sludge. In raw primary
sludge, the number of faecal coliforms was 105 MPN/g and after dewatering using an
inorganic coagulant, drying and composting, the numbers were reduced to 103 MPN/g. The
laboratory simulation of anaerobic digestion of primary sludge showed that, the level of
faecal coliforms was about 102 to 104 MPN/g in MAD sludge and 100 MPN/g in thermophilic
anaerobic digestion sludge. Inactivation of enterococci and Salmonella spp. was greater in
thermophilic anaerobic digestion than in MAD. It was concluded that thermophilic anaerobic
digestion is the most effective method of treatment for pathogen inactivation (Watanabe et
al., 1997). This is expected due to the higher treatment temperature in thermophilic
anaerobic digestion.
Gantzer et al. (2001) monitored E. coli, enterococci, Salmonella spp. and viable nematode
eggs during various sludge treatment processes. Samples were collected from the entrance
and exit points for different treatment processes: MAD, aerobic thermophilic digestion,
composting, lime treatment, heat treatment (108˚C), storage of dehydrated sludge and
storage of limed sludge. Lime treatment and heat treatment were the most effective at
removing E. coli and enterococci (about 4-6 log10 reduction). Aerobic thermophilic digestion
was also effective and reduced E. coli and enterococci by 3-3.5 log10. In contrast,
composting resulted in about 2 log10 reduction and MAD treatment resulted in about 0.5 -1.5
log10 reduction of E. coli and enterococci. No Salmonella spp. were found after heat
treatment, lime treatment or composting, whereas Salmonella spp. were detected after MAD
(Gantzer et al., 2001).
Forster-Carneiro et al. (2010) investigated removal of Salmonella spp. and faecal coliforms
in a laboratory set up of MAD of raw sludge, as substrate and digested mesophilic sludge, as
inoculum. The experiments were conducted at 30 days of solid retention time for 45 days of
operation and at 20 days of solid retention time for 55 days of operation at 35ºC. MAD
64
removed 1-1.5 log10 of Salmonella spp. and faecal coliforms at 20 days of solid retention
time. The sludge obtained was classified as class B biosolids as the effluent showed 3
MPN/4 g DS of Salmonella spp. and less than 2×10⁶ MPN/g DS of faecal coliforms after
anaerobic digestion (Forster-Carneiro et al., 2010).
Han et al. (1997) performed a laboratory study to compare the performance of temperature-
phased anaerobic digestion. This process involved a two stage reactor system with the first
stage operated at thermophilic temperature (55ºC) and the second stage operated at
mesophilic temperature at 35ºC. There was a 1 log10 removal of faecal coliform from the
MAD phase and complete destruction of faecal coliforms in temperature-phased anaerobic
digestion over a range of solid retention time of 11-28 days (Han et al., 1997).
Horan et al. (2004) examined a two stage MAD process. The first stage involved MAD with
12 days hydraulic retention time at 35ºC and the second stage consisted of storage of
secondary sludge at 15ºC for 25 days. The log removal of indigenous E. coli and spiked S.
senftenberg, L. monocytogenes, C. jejuni was calculated. There was a 3.36-3.38 log10
removal of indigenous E. coli in the two stage MAD process in which 1.48-1.68 log10 was
removed in first stage of MAD and 1.7 log10 was removed in second stage. A 4 log10 removal
of S. senftenberg and L. monocytogenes was observed in which about 2 log10 was removed
in first stage and another 2 log10 was removed after 14 days of storage. No C. jejuni was
removed in first stage of MAD and only 0.36 log10 was removed during second stage of
storage (Horan et al., 2004).
Rubio-Loza and Noyola (2010) developed laboratory scale two-phase thermophilic–
mesophilic and thermophilic-thermophilic systems in which acidogenic thermophilic
digestion, the first phase of both mesophilic and thermophilic systems, operated at 55ºC with
a hydraulic retention time of 2-3 days. The second phase of methanogenic MAD operated at
35ºC with a hydraulic retention time of 10 days and methanogenic thermophilic digester
operated at 55ºC with a hydraulic retention time of 13 days. Over both phases, there was

65
about 5 log10 reduction of faecal coliforms (Class A biosolids) consisting of about 4 log10
reduction in the first stage of acidogenic thermophilic digestion and another 1 log10 in the
second stage of MAD.
Riau et al. (2010) performed temperature phased anaerobic digestion and compared that it
with MAD. The results suggested that temperature phased anaerobic digestion reduced the
faecal coliform density from 1.3×10⁵ MPN/g DS to <103 MPN/g DS, which is equivalent to
Class A biosolids. The faecal coliform density reduction was about 0.5 log10 by MAD system
after 15 days of residence time.
Tanji et al. (2003) studied seasonal variations of coliphages infecting non-pathogenic E. coli
O157:H7 ATCC 43888 strain and pathogenic E. coli O 157:H7 EDL933 strains in the influent
of an urban wastewater treatment plant in Japan. Coliphage infecting non-pathogenic E. coli
O157:H7 ATCC 43888 strain was detected for one year during the sampling period whereas
phage infecting pathogenic E. coli O 157:H7 EDL933 strains were detected intermittently
and the concentration of EDL phage was almost one-tenth of that of 43888-phage.
Anaerobic digestion was responsible for 2 log10 reduction of EDL phage and one log10
reduction of 43888-phage (Tanji et al., 2003).
Malack Muhammad et al. (2007) examined the fate of Salmonella spp. and faecal coliforms
in sludge sand drying beds at three cities of Saudi Arabia. After 7 to 14 days of drying, faecal
coliform density ranged between 4.97×10⁵ and 2.11×10⁶ MPN/g DS which was less than that
of untreated sludge (107 to 108 MPN/g DS). The levels of Salmonella spp. in dried sludge
ranged from 22 MPN/g DS to 127 MPN/g DS. These quantities do not meet the class A
biosolids requirements. The rate of inactivation was higher during summer season than in
winter (Malack Muhammad et al., 2007).
George et al. (2002) investigated faecal coliform removal in different treatment processes
from twelve wastewater treatment plants in France and Belgium. The aim of this work was to

66
determine the most effective steps in the treatment lines to remove faecal coliforms from
sewage. The results showed that raw sludge contained about 107-108 CFU/100 mL of faecal
coliforms. Lagooning with the retention period of 60 days was shown to be the most effective
biological treatment to remove faecal coliform from sludge by about 4 log10 (George et al.,
2002).
Amahmid et al. (2002) investigated the removal of Giardia spp. cysts and Ascaris spp. eggs
in a lagoon system in Morocco. Giardia cysts were detected in 50% of raw sludge samples
with an average concentration of 2.8×10³ cysts/L whereas Ascaris eggs were detected in
39.3% of raw samples with an average concentration of 1.7 eggs/L. After treatment in lagoon
(16 days retention time), no Ascaris eggs were found but 4.2% of treated sludge samples
contained Giardia cysts with the concentration of 21 cysts/L. 1.3×10³ cysts/g of Giardia cysts
and 29.6 eggs/g of Ascaris eggs were found in the sediment at the entrance of the system
whereas no Giardia or Ascaris were found in the sediment of the outlet of the lagoons. This
result suggested that lagoonss are effective in inactivation of Giardia cysts and Ascaris eggs
due to the phenomenon of sedimentation coupled with the role of retention time (Amahmid et
al., 2002).
The research described in this section represents the inactivation of different pathogens
during primary, secondary treatment of wastewater and also during sludge treatment at
different parts of the world. These studies show that the numbers of pathogens and
indicators entering wastewater treatment plant differ, relating to the population served and
the type of wastewater entering the plant. The log reduction values for pathogens and
indicators depend on the type of treatment as discussed in the previous sections. Several
studies showed ~1-2 log10 removal of coliphage or E. coli during field study and laboratory
simulation of anaerobic digestion. Some studies have shown the effectiveness of lagooning
in reducing indicator numbers, but there have been no research on indicator decay in drying
pans as practised in Victoria.

67
2.9 Conclusion
Application of biosolids in agriculture has a number of potential benefits. Biosolids contains
essential nutrients for the growth of plants and also has environmental and economic
benefits by reducing landfill disposal or disposal by incineration. However, it is very important
to assess biosolids characteristics carefully prior to land application. An important and
emerging issue for the safe land application of biosolids to ensure public health is the
dynamics of microbial die-off during sewage sludge treatment.
This research project, a part of a larger project was designed to answer the following
research questions:
1. Is the long term storage required by the Victorian guidelines to achieve T1 grade
biosolids appropriate?
2. What are the decay kinetics of pathogens during sewage sludge treatment?
3. What environmental factors influence the decay of microbial pathogens and
indicators during sludge treatment?

68
CHAPTER 3
General Materials and Methods

69
3.1 General Procedures
Glassware, pipette tips, bottle top dispenser and all solutions including media were sterilized
by autoclaving at standard conditions, 121°C for 20 min (15 psi). Culture media were
prepared using Reverse Osmosis (RO) water and all solutions were prepared using Milli-Q
water.
Solutions were dispensed using appropriate pipettes for volumes between 0.5-10 µl, 20-200
µl, 100-1000 µl and 10-100 µl, 1-5 mL. For large volumes, such as 10 mL, a 20 mL bottle top
dispenser was used to dispense.
Volumes of ≤1.5 mL were centrifuged using a microcentrifuge and volumes >1.5 mL but ≤50
mL was centrifuged using Sigma Laboratory centrifuge.
For amounts less than 1 g, a Mettler Toledo balance was used and for amounts less than
300 g, a EW-300 G balance was used.
Glassware was cleaned by soaking in detergent overnight, scrubbing with hot water, rinsing
twice in tap water and finally in RO water.
70
3.2 General Chemicals and Equipment
• API 20 E, Biomerieux, New South wales, Australia
• Base panel heater, Electrotherm Pty Ltd., Victoria, Australia
• Biological safety cabinet class l l, LAF Technologies Pty Ltd., Victoria, Australia
• Cavity displacement pump, CPII, MonoC, French
• Ceramic infrared heating system with steel bar, designed and made especially for
the project
• Colony counter, Thermoline Scientific, NSW, Australia
• Control unit for the heating system, Electrotherm Pty Ltd., Victoria, Australia
• Crucible
• Disposable microfill V funnels, Merck Millipore, Victoria, Australia
• Electronic pump controller, Extech Equipment Pty Ltd., Victoria, Australia
• Eppendorf biophotometer, Eppendorf AG, Hamburg, Germany
• Feed tank with a lid and stirrer, supplied by South East Water Limited
• Fume cupboard
• Heat-stir, Crown Scientific Pty Ltd., NSW, Australia
• Incubator shaker, Bioline Pty Ltd, NSW, Australia
• Kovac’s reagent, Sigma Aldrich, Victoria, Australia
• Laboratory furnace XLK15, France Etuves, Chelles, France
• Laboratory incubator, Thermoline Scientific, NSW, Australia

71
• Laboratory oven, S.E.M. Pty Ltd, South Australia, Australia
• MAD tank with stirrer, supplied by South East Water Limited
• Nitrile and latex gloves
• O-antigen, Sigma Aldrich, Victoria
• Pestle and mortar
• Peristaltic, positive displacement pump, Aquaplus, Victoria, Australia
• Petri dish
• pH meter, Hanna Instruments, Victoria, Australia
• Plastic containers (5 L)
• Plastic jerry cans (20 L)
• Sodium chloride
• Stainless steel tanks (25 L), designed and made especially for the project
• Thermo scientific multiskan ascent, Thermofisher Scientific, Victoria, Australia
• Triple head filtration apparatus: sartorious (steel funnels), Sartorious AG Goeftingen,
Germany
• Vortex mixer, Ratek Instruments, Victoria, Australia
• Water bath at 50°C, Ratek Instruments, Victoria, Australia
• Water bath at 60-100°C, Double R.D. Holdings Mt Kuring-gai, NSW, Australia
• 70% ethanol
• 0.22 µM filter, Millipore, Bedford, USA

72
• 0.45 µM filter, Millipore, Bedford, USA
• 96 well microtitre plate, Asahi Glass Co. Ltd., Japan
3.3 Stock Solutions
3.3.1 Ampicillin solution (30mg/mL), Sigma Aldrich, Victoria, Australia
Ampicillin 0.3 g
1M NaOH 2 mL
Milli Q water 8 mL
Ampicillin was dissolved in NaOH solution and MilliQ water was added and mixed properly.
1.5 mL was aliquoted in Eppendorf tubes and was stored at -20⁰C for no longer than 3
months.
3.3.2 2.5% (w/v) Azocasein solution, Sigma Aldrich, Victoria, Australia
Azocasein 2.5 g
Milli Q water 100 mL
2.5 g of azocasein was dissolved in 100 mL of MilliQ water and the solution was filter
sterilized.
3.3.3 0.5 M Ethylenediaminetetraacetic acid (EDTA), Sigma Aldrich, Victoria, Australia
Ethylenediaminetetraacetic acid (EDTA) 186.1 g
186.1 g of EDTA was dissolved in 800 mL of MilliQ water, pH was adjusted to 8 with ~20 g
NaOH pellets and the final volume adjusted to 1 L. The solution was autoclaved at 121⁰C for
15 mins.

73
3.3.4 Glucose-calcium chloride solution
CaCl2.H2O 30g
Glucose 10g
Milli Q water 100mL
After dissolving, the solution was filter sterilized (0.22 µm)
3.3.5 Maximum recovery diluent (MRD), Oxoid Ltd., Hampshire, England
Maximum Recovery Diluent 9.5 g
RO water 1 L
RO water was added to 9.5 g of MRD to make a volume of 1 liter and the mixture was
autoclaved at 121⁰C for 15 mins.
3.3.6 20 mM Magnesium-sulphate solution
MgSO4.7H2O 0.30g
Milli Q water 100 mL
After dissolving, the solution was filter sterilized (0.22µm)
3.3.7 Nalidixic acid solution (25 mg/mL), Sigma Aldrich, Victoria, Australia
Nalidixic acid 0.25 g
1M NaOH 2 mL
Milli Q water 8 mL
Nalidixic acid was dissolved in NaOH solution and Milli Q water was added and mixed
properly. 1.5 mL was aliquoted in Eppendorf tubes and was stored at -20⁰C for 3 months.

74
3.3.8 Phosphate buffered saline (PBS), Oxoid Ltd., Hampshire, England
Phosphate Buffered Saline 5 tablets
RO water 1 L
RO water was added to 5 tablets to make a volume of 1 liter and pH was adjusted to 7.2
+/-0.1. Then the mixture was autoclaved at 121⁰C for 15 mins.
3.3.9 Proteinase K (20 mg/mL), Sigma Aldrich, Victoria, Australia
Proteinase K 20 mg
Molecular grade water 1 mL
20 mg of proteinase K was dissolved in 1 mL of molecular grade water and the solution was
stored at -20⁰C.
3.3.10 2 M Sodium hydroxide (NaOH), Sigma Aldrich, Victoria, Australia
NaOH pellet 8 g
Milli Q water 100 mL
8 g of NaOH pellet was dissolved in 50 mL of autoclaved MilliQ water and the final volume
was adjusted to 100 mL.
3.3.11 0.5% (w/v) Sodium bicarbonate (NaHCO3) buffer (pH 8.3), Sigma Aldrich, Victoria,
Australia
Sodium Bicarbonate (NaHCO3) 0.5 g
RO water 100 mL
100 mL of RO water was dissolved to 0.5 g of NaHCO3 and pH was adjusted to 8.3. The
solution was autoclaved at 121⁰C for 15 mins.

75
3.3.12 1 M Tris-Cl (pH 8.0), Sigma Aldrich, Victoria, Australia
Tris base 121 g
121 g Tris base was dissolved in 800 ml of MilliQ water and the pH was adjusted to 8.0 with
conc. HCl. Then final volume was adjusted with water to 1 L. The solution was autoclaved at
121⁰C for 15 mins.
3.3.13 5% (v/v) Trichloroacetic acid (TCA) solution, Sigma Aldrich, Victoria, Australia
Trichloroacetic acid 5 mL
MilliQ water 45 mL
5 mL of TCA was added to 45 mL of autoclaved MilliQ water.
3.4 Bacteriological Culture Media
3.4.1 Bile aesculin agar (BAA), Oxoid Ltd., Hampshire, England
Bile aesculin agar 45 g
RO water 1 L
RO water was added to 45 g of bile aesculin agar to make a volume of 1 liter by heating
gently to dissolve it completely and pH was adjusted to 7.1±0.2. Then the mixture was
autoclaved at 121⁰C for 15 mins. After cooling to 50⁰C the agar was poured to petri dishes
and allowed to set.
3.4.2 Lactose peptone water, Oxoid Ltd., Hampshire, England
Bacteriological Peptone 10 g
Sodium Chloride 5 g
Lactose 19 g
Bromocresol purple (2% in ethanol) 4 mL

76
RO water 1 L
Ingredients were dissolved in water and 3.5 mL volumes were distributed into Bijoux bottles,
including Durham tubes and autoclaved at 110⁰C for 10 mins. The medium was stored at 2-
8⁰C for up to one month.
3.4.3 Luria bertani (LB) medium, Oxoid Ltd., Hampshire, England
Tryptone 10 g
Yeast extract 5g
Nacl 10 g
RO water was added to make a volume of 1 liter and adjusted pH to 7.5 and the mixture was
autoclaved at 121⁰C for 15 mins.
3.4.4 MacConkey agar (MCA), Oxoid Ltd., Hampshire, England
MacConkey agar 52 g
RO water 1 L
RO water was added to 52 g of MacConkey agar to make a volume of 1 liter and pH was
adjusted to 7.4± 0.2. Then the mixture was autoclaved at 121⁰C for 15 mins. After cooling to
50⁰C the agar was poured to petri dishes and allowed to set.
3.4.5 MacConkey agar (MCA) No. 2, Oxoid Ltd., Hampshire, England
MacConkey agar No. 2 52 g
RO water 1 L
RO water was added to 52 g of MacConkey agar no. 2 to make a volume of 1 liter and pH
was adjusted to 7.2 ± 0.2. Then the mixture was autoclaved at 121⁰C for 15 mins. After
cooling to 50⁰C the agar was poured to petri dishes and allowed to set.

77
3.4.6 Membrane lactose glucuronide agar (MLGA), Oxoid Ltd., Hampshire, England
Membrane Lactose Glucuronide agar 88 g
RO water 1 L
RO water was added to 88 g of MLGA to make a volume of 1 liter and pH was adjusted to
7.4± 0.2. Then the mixture was autoclaved at 121⁰C for 15 mins. After cooling to 50⁰C the
agar was poured to petri dishes and allowed to set. MLGA plates were stored in dark at 4⁰C
up to 1 week.
3.4.7 Motility–indole-lysine decarboxylase medium (MIL), Oxoid Ltd., Hampshire,
England
MIL medium 36. 5 g
RO water 1000 mL
RO water was added to 36.5 g MIL medium to make it 1 litre and the mixture was boiled for
1 minute to ensure complete dissolution of agar. After cooling it at 50⁰C, 8 mL of the mixture
was dispensed into 16 mm glass tubes using a glass funnel and then autoclaved at 110⁰C
for 10 mins.
3.4.8 Nutrient agar (NA), Oxoid Ltd., Hampshire, England
Nutrient agar 28 g
RO water 1 L
RO water was added to 28 g of nutrient agar to make a volume of 1 liter and pH was
adjusted to 7.4± 0.2. Then the mixture was autoclaved at 121⁰C for 15 mins. After cooling to
50⁰C the agar was poured to petri dishes and allowed to set.

78
3.4.9 Nutrient broth (NB), Oxoid Ltd., Hampshire, England
Nutrient broth 13 g
RO water 1 L
RO water was added to 13 g of nutrient broth to make a volume of 1 liter and pH was
adjusted to 7.4± 0.2. Then the mixture was autoclaved at 121⁰C for 15 mins.
3.4.10 Rappaport-vassiliadis soya peptone broth agar (RVSA), Oxoid Ltd., Hampshire,
England
Rappaport-Vassiliadis Soya Peptone broth 26.75 g
Agar bacteriological 12.5 g
RO water 1 L
RO water was added to all of the ingredients to make the volume of 1 litre and pH was
adjusted at 5.2±0.2. Then the mixture was autoclaved at 115⁰C for 15 mins. After cooling to
50⁰C the agar was poured to petri dishes and allowed to set.
3.4.11 Salt tolerance test broth (NB + 6.5% NaCl)
Nutrient broth 13 g
NaCl 65 g
RO water 1 L
RO water was added to 13 g of nutrient broth and 65 g of NaCl to make a volume of 1 liter.
Then the mixture was autoclaved at 121⁰C for 15 mins. The broth was allowed to cool down
before dispensing into Bijous bottles (3.5 mL each).

79
3.4.12 Semisolid tryptone yeast extract glucose agar (SS TYGA), Oxoid Ltd., Hampshire,
England
Tryptone 10 g
Yeast extract 1 g
Sodium chloride 8 g
Distilled water 1 L
Bacteriological agar 7 g
RO water was added to make volume of 1 liter and pH was adjusted to 7.2± 0.1. Then the
mixture was autoclaved at 121⁰C for 15 mins. After cooling to 50⁰C the agar was poured to
petri dishes and allowed to set.
3.4.13 Slanetz and bartley agar, Oxoid Ltd., Hampshire, England
Slanetz and bartley agar 42 g
RO water 1 L
Distilled water was added to 42 g of Slanetz and Bartley Agar to make the volume of 1 litre
and pH was adjusted at 7.2±0.2. The mixture was heated to boiling until agar was
completely dissolved. After cooling to 50⁰C the agar was poured to petri dishes and allowed
to set.
3.4.14 Todd-hewitt broth, Oxoid Ltd., Hampshire, England
Todd-hewitt broth 36 g
RO water 1 L
RO water was added to 36 g todd-hewitt broth to make the volume 1 L and pH was adjusted
at 7.8 +/- 0.2. Then the mixture was autoclaved at 115⁰C for 10 mins. The broth was

80
dispensed into 16 mm glass tubes (4.5 mL each) using bottle top dispenser aseptically prior
to subculturing.
3.4.15 Tryptone water, Oxoid Ltd., Hampshire, England
Tryptone water 15 g
RO water 1 L
RO water was added to 15 g tryptone water to make the volume 1 L and pH was adjusted at
7.5+/-0.2. 4.5 aliquots were dispensed into 16 mm glass tubes using bottle top dispenser
and autoclaved at 115⁰C for 10 min.
3.4.16 Tryptone yeast extract glucose agar (TYGA), Oxoid Ltd., Hampshire, England
Tryptone 10 g
Yeast extract 1 g
Sodium chloride 8 g
Distilled water 1 L
Bacteriological agar 14 g
RO water was added to make volume of 1 liter and pH was adjusted to 7.2± 0.1. Then the
mixture was autoclaved at 121⁰C for 15 mins. After cooling to 50⁰C the agar was poured to
petri dishes and allowed to set.
3.4.17 Tryptone yeast extract glucose broth (TYGB), Oxoid Ltd., Hampshire, England
Tryptone 10 g
Yeast extract 1 g
Sodium chloride 8 g

81
RO water 1 L
RO water was added to make volume of 1 liter and pH was adjusted to 7.2± 0.1. Then the
mixture was autoclaved at 121⁰C for 15 mins.
3.4.18 Xylose lysine desoxycholate agar (XLD), Oxoid Ltd., Hampshire, England
Xylose lysine desoxycholate agar 53 g
RO water 1 L
RO water was added to 53 g XLD agar to make the volume of 1 litre and pH was adjusted at
7.4±0.2. The mixture was autoclaved at 121⁰C for 15 mins. After cooling to 50⁰C the agar
was poured to petri dishes and allowed to set.
3.5 Bacterial Isolates
4. M34, field isolate of E. coli (Source: Drying pan, Mt Martha)
5. M1-1, isolate of E. coli (Source: Mesophilic Anaerobic Digester Output, Mt Martha)
6. MOA-5, isolate of E. coli (Source: Primary Sludge, Mt Martha)
7. MOA2-1, isolate of E. coli (Source: Primary Sludge, Mt Martha)
8. MOA2-5, isolate of E. coli (Source: Primary Sludge, Mt Martha)
9. E. coli ATCC 25922, Reference Strain
10. Enterococcus faecalis ATCC 29212, Reference Strain
11. Salmonella Birkenhead (Source: Cattle)

82
3.6 Equipment for The Field Trip
3.6.1 Sampling kit
3.6.1.1 MAD sampling kit
• Coloured buckets
• Orange funnel
• Red cap plastic containers (100 mL)
• Yellow cap plastic containers (500 mL)
3.6.1.2 Drying pan and stockpile sampling kit
• Harness
• Long handled spoon
• Spade and auger
• Straight extender
• White buckets
3.6.1.3 Safety kit
• Helmets
• Masks
• Overalls and safety vests
• Safety glasses
• Steel capped gumboots
3.6.1.4 Others
• Autoclave bags
• Disposable gloves

83
• Garbage bags
• Ice pack
• Ice box
• Roll paper towel
• RO water
• Twisty ties
• 70% ethanol
3.7 Dry Solid (DS) and Volatile Solid (VS) Measurement
The dry solids (DS) content of biosolids samples was assessed according to Rothamsted
(2004). The required numbers of empty crucibles with lids were weighed and the weights
were recorded. About 10 g of biosolids samples were weighed to determine the wet weight
of the samples. After weighing, the wet samples were placed in crucibles on a metallic tray
and transferred to the drying oven and incubated at 105⁰C for 24 hrs. After drying, crucibles
with samples were cooled and then weighed to determine the dry weight. Dry solid (DS) was
calculated using the following formula:
%DS = (Dry weight-Crucible weight)/wet weight×100
After measuring the DS content, the crucible containing dry sample was transferred to
furnace oven and incubated at 550ºC for 3 hr. for ignition. The crucible with the ignited
sample was cooled, weighed and the weight was recorded. Volatile solid (VS) was
calculated using the following formula:
% VS= (Dry weight-VS weight) / (Dry weight-crucible weight) ×100

84
The carbon content was calculated from volatile solid content using conversion factor 1.73
fractions (Rigby et al., 2010). The formula is as follows:
% Carbon=% VS/1.73.
Carbon content/DS was calculated using following formula: %Carbon/%DS×100
3.8 Preparation of Bacterial Inoculum
Bacteria for seeding biosolids were streaked on a nutrient agar plate from the stock culture
stored at -20°C and incubated overnight at 37°C, then a single colony was inoculated into 5
mL of nutrient broth and incubated at 37°C overnight. The overnight culture contained
approximately 109 CFU/mL. This was confirmed by plate counting on a nutrient agar plate.
The overnight culture was diluted into nutrient broth to give a concentration of approximately
107 CFU/mL. A volume of the diluted inoculum (which varied depending on sample volume)
was added to each biosolids sample to give a final concentration of approximately 105
CFU/mL.
3.9 Preparation of High Titre Stock Culture of MS2 (F-Specific RNA Bacteriophage)
0.5 mL of overnight culture of E. coli NZRM 4027 was added to 50 mL of TYGB in a 250 mL
flask and the culture was incubated with shaking at 37°C for 2 h ± 1 h until the OD600 nm of
the culture reached 0.40 which is equivalent to the cell density of approximately 4×10⁸
CFU/mL, according to the calibration curve previously prepared in our laboratory. After
recovery from -20°C storage, 10 fold serial dilutions of a glycerol stock of MS2
bacteriophage were prepared by transferring 0.1 mL aliquots into 0.9 mL of TYGB in a 1.5
mL microcentrifuge tube. 1 mL of each dilution and 0.25 mL of the host strain were added to
3.5 mL aliquots of melted SSTYGA and kept at 50°C in a water bath. The agar mixtures
were retrieved from the water bath, vortexed and gently poured into dried 90 mm TYGA
plates. The plates were inverted when the layers were solidified. The plates were incubated

85
at 37°C overnight. After incubation, the plate with highest dilution of MS2 bacteriophage
showing confluent lysis was selected and the soft agar layer was scrapped into a 50 ml
falcon tube using a sterile spatula. The plate was washed with 15 ml of TYGB and the
washings were transferred to the same falcon tube. After vortexing the mixture, it was
centrifuged at 1000 rpm for 25 minutes to sediment cellular debris and agar. Next the
supernatant was poured into a sterile 50 mL falcon tube and passed through a 0.22 µM filter
into a sterile container.15 % sterile glycerol was added to the suspension and the mixture
was distributed in 1 mL aliquots into 1.5 mL of microcentrifuge tubes and stored at -20◦C.
3.10 Preparation of High Titre Stock Culture of P22 Bacteriophage
The same method described in Section 2.9 was used for the preparation of P22
bacteriophage stock culture with the exception of using Salmonella Typhimurium host
culture.
3.11 Salmonella spp. Enumeration
A previously isolated Salmonella spp. from biosolids was further confirmed using
biochemical tests and serological tests and seeded into biosolids samples. Then it was
enumerated by membrane filtration performed by incubating Rappaport-Vassiliadis Soya
Peptone Broth agar (RVSA) plates for 16-20 h at 41.5 ºC followed by Xylose Lysine
Desoxycholate (XLD) agar plates for 18- 24 h at 37 ºC and Salmonella spp. was detected as
black coloured colonies on XLD.
3.12 Statistical Analysis
All of the statistical analysis was done by using Anova Single Factor and also regression
analysis within Data Analysis Tool Pack in Excel.

86
CHAPTER 4
Indicator Die-off During Drying Pan Treatment

87
4.1 Introduction
Faecal bacteria, such as total coliforms, faecal coliforms and faecal enterococci are widely
used as indicators of the presence of pathogens in water, wastewater, sewage sludge and
other environmental matrices (Harwood et al., 2005). Indicators are also used to establish
the efficacy of sewage sludge treatment processes at pathogen removal to establish an
essential barrier to the potential transmission of infective enteric diseases when sludge is
recycled as a fertilizer product to farmland. Considerable research has been completed on
indicator die-off for different sewage sludge treatment processes, such as, mesophilic
anaerobic digestion (MAD), thermophilic anaerobic digestion, mechanical dewatering,
composting, lime stabilization, heat stabilization, and storage (Gantzer et al. 2001; Sahlstrom
et al., 2004; Watanabe et al., 1997).
In Victoria, Australia, the main treatment process stream for sludge involves MAD followed
by pan drying and stockpiling. However, this process configuration has not been evaluated
for pathogen removal and Victorian guidelines require storage for 3 years for the sludge to
receive a T1 classification for unrestricted use. The time required to produce a T3 grade
material for use in broad acre agriculture, for instance, following multi-barrier principles and
including land use restrictions (eg: cropping and harvesting restrictions and waiting periods),
that rely on the natural attenuation of pathogens in soil and the environment, have not been
defined. Therefore, it is necessary to understand the decay kinetics of different indicators
during pan drying and stockpiling of anaerobically digested sewage sludge, to provide
confidence in the microbiological safety of the treated biosolids and to maximise the
efficiency of the treatment systems for biosolids production for use in agriculture, or as an
unrestricted product.
A previous field study in the summer season of 2007-2008 was performed by Rouch et al.,
2009 (SWF Project, Round 4, Project No. 419-003, 2007-2008). In that study, samples were

88
collected from two wastewater treatment plants; Eastern Treatment Plant (ETP), Melbourne
Water Corporation and Mt Martha Plant, South East Water Limited (SEWL). Samples
included primary sludge, dissolved air flotation (DAF) stream, MAD output and material
collected from drying pans and stockpiles. Samples were collected from drying pans in
November 2007, December 2007 and February 2008 which covered only the summer
season. The results from that study revealed that the concentration of Escherichia coli in
MAD output was 105-106 CFU/g DS which was reduced to T2 limit (1000 CFU/g DS) in
drying pans after 6-7 months and to T1 limit (100 CFU/g DS) after 8-9 months of drying.
Coliphage decay showed a similar pattern to E. coli. The number of coliphages in MAD
output (104 CFU/g DS) was reduced by 3 logs after 8 months of drying and reached the limit
of detection (20 PFU/g DS) after 11 months of drying. No E. coli or coliphage were detected
in stockpiles from aged 6 months to 3 years age. No Salmonella spp. were detected in MAD
output, selected drying pans or stockpiles (SWF Project, Round 4, Project No. 419-003,
2007-2008).
The number of indicator microorganisms present in sewage sludge depends on geographical
location of the wastewater receiving area, proportion of domestic and industrial waste, type
of trade waste, population size and the season (Saleem et al., 2001). There is some
evidence that seasonal variations resulting in a change of environmental conditions affect
the reduction of Salmonella spp. and E. coli O157:H7 during windrow composting
(Cekmecelioglu, et al., 2005). The reduction levels of Salmonella spp. and E. coli O157:H7
were higher during the summer season (from 377-483 MPN/g to <0.3 MPN/g) compared to
the winter season (from 377-483 MPN/g to 6-150 MPN/g). Data from a single specific
wastewater treatment over one season may therefore not provide representative data of all
similar wastewater treatment plants. Therefore, it is very important to understand the effect
of environmental factors as influenced by seasons on the time dependent decay kinetics. E.
coli is mostly used as an enteric bacterial indicator both in reclaimed water and wastewater
(Lucena et al., 2004; Harwood et al., 2005; Alcalde et al., 2003; Costan-Longares et al.,

89
2008). In the present study, an additional indicator, Enterococcus spp. was used as the use
of a single indicator does not allow prediction of all bacterial pathogens present in biosolids
(Straub et al., 1993). Enterococcus spp. is more resistant to environmental conditions; such
as; temperature and humidity than E. coli; rarely multiplies in the environment and has a
limited host range (Wheeler et al., 2002). Numbers of Enterococcus spp. are also high
enough to be easily detected in wastewater, biosolids and compost (Harwood et al., 2005). It
was therefore, decided to add another indicator, Enterococcus spp. in the field study. Enteric
viruses are present in variable numbers in sewage sludge. Moreover, quantification of
enteric viruses requires either cell culture methods which are time consuming and expensive
or qPCR methods which detect viral nucleic acid rather than live viruses and are not fully
validated. Coliphage was used as a potential indicator for enteric viruses, since
quantification methods are well established and simple.
The aims of the experimental procedures in this chapter are as follows:
1. To determine the die-off rates of the indicators, E. coli, Enterococcus spp. and
coliphage during pan drying treatment in both summer and winter seasons at
ETP.
2. To compare the decay rates of different indicators during pan drying
treatment in both summer and winter seasons at ETP.
3. To relate the die-off of indicators with the air and sludge temperature, rainfall
data and dry solid (DS) content of sludge.

90
4.2 Materials and Methods
4.2.1 Sample collection
Biosolids samples were collected from the ETP. Sampling was conducted at 4 to 8 weekly
intervals from March 2009 to March 2010 (Table 4.1).
Table 4.1: Sampling dates in 2009-2010
Year Sampling date Pan 23 Pan 41
2009 17 March, Tuesday √ X
2009 19 May, Tuesday √ X
2009 20 July, Monday √ X
2009 7 September, Monday √ X
2009 5 October, Monday X √
2009 9 November, Monday √ √
2009 14 December, Monday √ √
2010 1 February, Monday √ √
2010 1 March, Monday √ √
2010 22 March, Monday X √
2010 19 April, Monday √ √
2010 7 June, Monday √ √
***Data from first sampling point are not available due to technical problems.
X=Sampling not done, √=Sampling done
Over that period, the output from the pump of MAD output and material from two air-drying
pans and two stockpiles were sampled. The two pans sampled were Pan 23 (full year, 12
month pan, start of filling at 13 March, 2009, air dried from June, 2009 to April, 2010) and
Pan 41 (summer period, 6 month pan, start of filling at 31 August, 2009, air dried from
November, 2009 to April 2010) (Fig. 4.1).

91
Triplicate samples (~50 g of each sample) were taken from the pump output of anaerobic
digesters and three composite samples were taken from air-drying pans at every sampling
event (Fig. 4.2). Each composite sample (~50 g) comprised 10 subsamples which were
collected from different depths of at least 0.5 metre from the surface at a distance of one
metre apart. Pans were chosen for sampling according to the operator’s advice on their
availability. When material in drying pans reached ~40-45% DS, then it was stockpiled.
Stockpiles SP19, SP38, or SP45 were sampled at each sampling event. Sludge from pan 23
and 41 were lifted to form stockpile 40 and stockpile 16 respectively, and were also
subsequently included in the sampling programme. Stockpiles were sampled three times at
three different depths to provide composite samples at, 0-0.2 m (surface), 0.4-0.6 m, and
0.9-1.1 m using sterile auger (Fig. 4.2). Each individual stockpile sample consisted of ~50 g
of material collected aseptically in sterile plastic containers. Stockpiles were chosen
according to age and on the advice of operators.
Pan 23, 12 month drying since start of filling
Pan 41, 6 month drying since start of filling
Mesophilic anaerobic digestionStockpiling
Fig. 4.1: Sludge treatment process at ETP and sampling point over the study
period

92
For the purpose of the current investigation, the ages of pans and stockpiles were
determined as the time at the start of filling of the pan or, in the case of stockpiles, the time
of filling the associated pan. The operation process of MAD and pan drying at ETP was as
follows: The digester is continuously fed a mixture of primary and secondary sludge, heated
to 35ºC, and has holding time of 15 days. There is only one digestion stage. The feed
typically has 5-6 % dry solids and 80-85 % volatile solid content. Following digestion the
sludge with 1-2% DS is pumped to the drying pan where it is applied at ~1 m. depth. Pans
are serially filled, with settling and decanting over 5 to 10 weeks, until the DS value reaches
about 4% and then air dried for 6 to 10 months, leaving the pan open during the entire
process. In addition, pans are stirred vertically, about once per week, during the drying
phase. Thus, during the time of filling, new sludge with its organism load is added to the
sludge every 2-3 weeks over the period of 6-8 weeks.
Fig. 4.2: Sample collection from drying pan and stockpile
Drying pan
Stockpile

93
4.2.2 Sample analysis
Biosolids samples were transferred to a cool box and placed on an ice pack. They were
transported to the laboratory on the day of collection and stored in a temperature-controlled
incubator in the dark at 4°C and were analysed within 72 hr. Biosolids were diluted 1:10 in
maximum recovery diluent (MRD) in sterile glass bottles containing 10 g of sterile glass
beads. The bottles were placed on an orbital shaker at 200 rpm for 4 min. Following a series
of 10-fold dilutions in MRD, viable counts of E. coli and Enterococcus spp. were determined
by a membrane filtration technique. Diluted samples (1.0 mL) of were filtered in triplicate
using 0.45 μm 47 mm nitro-cellulose grid membranes and a triple-head filtration system.
Two types of filtration system (steel funnels or disposable funnels) were used for this
procedure. PBS (20 mL) was applied to each membrane to ensure even distribution of
bacteria. Prepared membranes were placed on the media appropriate to each bacterial
species and incubated as described below. Numbers of colonies were counted and the
concentration of microorganisms calculated as CFU/g DS. The DS content was determined
as described in Section 3.7
4.2.2.1 Enumeration of E. coli
Membrane lactose glucuronide agar (MLGA) plates were incubated at 30ºC for 2-3 h
followed by 44ºC for 18-24 h. This method was a modification of the standard method
detailed by the Environment Agency UK, 2003; 2009. The standard method was modified
because previous laboratory testing consisting of incubating MLGA plates at 30ºC for 4 h
followed by 37ºC for 14 h showed that the amount of background flora which may interfere
the growth of E. coli was higher at 37ºC than 44ºC and no difference in the presumptive
number of E. coli was observed at 44ºC. Plates were incubated in plastic containers, which
were left partly open to allow air to circulate efficiently around the plates and to prevent
condensation forming inside the plates, which can interfere with colony development. E. coli

94
was detected as green coloured colonies on MLGA after incubation. For each dilution, green
coloured colonies on three plates were counted using a colony counter. E. coli was
confirmed using a modification of standard methods detailed by the Environment Agency
UK, 2003; 2009. This modification was necessary due to the restricted availability of certain
media types in Australia. For E. coli confirmation a maximum of ten green-coloured colonies
was selected from MLGA plates and subcultured into tryptone water, incubated for 3-4 hrs at
37ºC. The culture in tryptone water was used for the following biochemical tests: (1) indole
production following the growth in tryptone water at 44ºC for 24 hrs, (2) acid and gas
production in lactose peptone water from the fermentation of lactose at 37ºC and 44ºC, (3)
appearance on Nutrient Agar (NA) and MacConkey Agar (MCA). An oxidase test was also
performed using the pure culture from NA plate. The colonies which showed a positive result
for the growth in tryptone water at 44ºC, indole production, acid and gas production in
lactose peptone water at both 37ºC and 44ºC, lactose fermentation on MCA and negative
result for the oxidase test were identified as E. coli. API 20E was done on selected isolates
for the further confirmation.
4.2.2.2 Enumeration of Enterococcus spp.
Enterococcus spp. were detected as red colonies in Slanetz and Bartley agar (SBM),
incubated at 37ºC for 2-3 hrs followed by 44ºC for 44 hrs (Environment Agency UK, 2010).
Enterococcus spp. was confirmed by the following biochemical tests. Ten red colonies were
subcultured into Todd-Hewitt broth (THB) and incubated for 2 hr. at 37ºC. The culture on
THB was used to inoculate bile aesculin agar (BAA) which was incubated at 44ºC for 18 hr,
NA at 37ºC for 24 hr. and MCA no.2 at 37ºC for 48 hr. The NA culture was used for the salt
tolerance test by incubating in salt tolerance test broth (STTB) at 37ºC for 48 hr. and also the
catalase test. Colonies showing a black or brown halo around the spotted colony in BAA,
turbidity in STTB, were catalase negative and red/pink colour on MCA-2 were identified as
Enterococcus spp.

95
4.2.2.3 Coliphage enumeration
The method for coliphage enumeration was as described by Souter et al. (2000). Coliphages
were enumerated using the E. coli NZRM 4027 strain, as the host strain. The host strain was
grown in tryptone yeast extract glucose broth (TYGB) media at 37ºC with shaking at 150 rpm
to an OD600 nm value of 0.4, then stored on ice until use. 2.5 ml of 20 mM MgSO4, 2.5 mL of
glucose-calcium chloride solution, 1.25 mL of nalidixic acid solution (25 mg/mL) and 1 mL of
ampicillin solution (30 mg/mL) were added to 250 mL of melted semisolid tryptone yeast
extract glucose agar (SSTYGA). 3.5 mL aliquots of SSTYGA media were distributed in test
tubes and kept at 50ºC until needed. 1 mL of biosolids sample and 0.25 mL of host were
added to each tube of SSTYGA. Each mixture was lightly mixed before pouring over a 90
mm plate of TYGA media. Plates were incubated at 37ºC for 16 h before plaques were
enumerated using a light source.
4.2.3 Collection of air temperatures, rainfall data and sludge temperatures
Air temperatures and rainfall data were collected from Frankston, Australian Weather Station
(AWS) and Mornington, AWS respectively over the monitoring period. Sludge temperatures
in two pans were also collected regularly over the monitoring period as part of the larger
study.
4.2.4 Statistical analysis
The CFU/g DS was calculated from CFU/mL and the DS content of the original sample by
using the formula of CFU/mL/ DS/mL. The average and standard deviation of CFU/g were
calculated for triplicate samples of MAD output, pan and stockpile at different sampling
periods.
Non-linear regression analysis (data analysis tool pack) was used to quantify the exponential
rate of pathogen decay over the time period using the relation: y=Aebx, where y is the

96
number of the pathogens at time x, x is the treatment time, A is a constant, e is the
exponential value and b is the decay coefficient. The R2 value (coefficient determination)
indicates the proportion of the total variance explained by the relationship. This value was
calculated to show the fitness of data to the trend line. The decay coefficient (b)
demonstrates the pattern of the slope of the exponential relationship. The Y-axis was
presented following log10 transformation of pathogen numbers and the X- axis was presented
by treatment time in days.
For regression analysis, CFU/g DS was transformed into natural log (LN) using the Microsoft
Excel regression analysis tool and the P value and confidence limits were calculated to show
statistical significance. The decay rates of pathogens were presented in the form of stock
chart in graphs by using 95% confidence limit of decay coefficient. Decay coefficients for
stock charts were calculated using the first threshold, close to the limit of detection, as the
last data point, while for non-linear regression analysis, all data were included.
4.3 Results
4.3.1 Decay of E. coli
In case of Pan 23 (full year pan, start of filling date 13 March, 2009 and end of filling date 21
May, 2009), the starting material (MAD output), contained 1.6×10⁶ CFU/g DS of E. coli. As
shown in Fig. 4.3, there was a consistent decline in numbers over the monitoring and drying
period. The number of E. coli declined to a value (4.2×10² CFU/g DS) close to the Victorian
T2 Grade for biosolids (1000 CFU/g DS) after approximately 240 days. The T1 Grade (100
CFU/g DS) was attained after about 280 days of drying when actual numbers of E. coli
declined to 1.5×10² CFU/g DS. At the time of stockpiling (18 March 2010) following the
period of drying for approximatley 350 days, the number of E. coli was very low and
equivalent to 1.6×101 CFU/g DS which was close to the limit of detection (10 CFU/g DS).
Numbers remained small in the stockpile and were also close to the limit of detection,
equivalent to 5.35×101 CFU/g DS after a period of 100 days of stockpiling. The total

97
reduction of E. coli after 350 days of drying was equivalent to a decrease in concentration of
approximately 5 log10 in Pan 23. Raw data of E. coli decay in Pan 23 is presented in
Appendix 1.1.
Fig. 4.3: Decrease in numbers of E. coli with drying time (days) in Pan 23 (full year
pan) and Pan 41 (summer pan) at ETP. The first data point was MAD output. Error bars
(+/-) show the standard deviation.
In the case of Pan 41 (summer pan, start of filling date 31 August, 2009, end of filling date
11 November, 2009), the starting material (MAD output), contained an average number of
9.01×10⁵ CFU/g DS of E. coli. As shown in Fig. 4.3 there was 2 phase decay with a rapid
initial phase for approximately 80 days, followed by a rate of decline consistent with Pan 23
throughout the summer period. The number of E. coli reached to about T2 Grade (7.04×10²
y = 689431e-0.025x R² = 0.91, P<0.05
y = 83632e-0.025x R² = 0.73, P<0.05
1.0E+00
1.0E+01
1.0E+02
1.0E+03
1.0E+04
1.0E+05
1.0E+06
1.0E+07
0 100 200 300 400 500
CFU
/g
Drying time (days)
Removal of E. coli in Pan 23 and Pan 41
Pan 23
Pan 41
Expon. (Pan 23)
Expon. (Pan 41) T2 grade
Limit of detection (10 CFU/g)
End of filling
T1 grade
Stockpiling

98
CFU/g DS) after approximately 180 days of drying and T1 Grade (1.91×10² CFU/g DS) after
about 230 days of drying. Pan 41 contained T1 Grade of E. coli when it was stockpiled (3
May, 2010) and after stockpiling the numbers remained steady. The total reduction of E. coli
was achieved after 230 days of drying and was 3.7 log10 units in pan 41. Raw data of E. coli
decay in Pan 41 is presented in Appendix 2.1.
The results show a consistent decline in the number of E. coli for a full year drying but 2
phase decay for summer drying. Both pans had similar input of bacterial concentrations from
MAD but background numbers were reached significantly sooner for summer Pan 41. T2
grade was reached after about 6 months in summer drying and about 8 months in full year
drying. T1 Grade was reached after about 8 months in summer drying and about 10 months
in full year drying.
4.3.2 Decay of Enterococcus spp.
In Pan 23 (full year pan), the number of Enterococcus spp. declined from 1.27×10⁶ CFU/g
DS (MAD content) to 2.3×10³ CFU/g after about 350 days of drying (Fig. 4.4). Numbers
further decreased to 4.3×101 CFU/g DS after stockpiling and were close to the limit of
detection. The overall reduction measured in Enterococcus spp. was 4.4 log10 in stockpiled
sludge from Pan 23. Raw data of Enterococcus spp. decay in Pan 23 is presented in
Appendix 1.2.
In Pan 41 (summer pan), Enterococcus spp. declined from 6.73×10⁵ CFU/g to 3.1×10² after
230 days of drying and numbers decreased further to close to the limit of detection in the
stockpile. The overall reduction of Enterococcus spp. was 4.1 log10 in stockpiled sludge from
Pan 41. Raw data of Enterococcus spp. decay in Pan 41 is presented in Appendix 2.2.
The rate of decay of Enterococcus spp. was similar to E. coli in Pan 23 (Fig. 4.3, 4.4). In
contrast to E. coli in Pan 41; however, Enterococcus spp. decay followed a pattern more
consistent with log-linear inactivation. For Pan 41, which was filled during the warmer

99
summer period, the overall decay rate of Enterococcus spp was faster than for Pan 23.
Thus, the results demonstrated faster decay overall of Enterococcus spp during the summer
season than in a pan that was filled during the cooler autumn period.
Fig. 4.4: Decrease of Enterococcus spp. with drying time (days) in Pan 23 (full year
pan) and Pan 41 (summer pan) at ETP. The first data point was MAD output. Error bars
(+/-) show the standard deviations.
y = 2E+06e-0.024x R² = 0.93, P<0.05
y = 661445e-0.032x R² = 0.95, P<0.05
1.00E+00
1.00E+01
1.00E+02
1.00E+03
1.00E+04
1.00E+05
1.00E+06
1.00E+07
0 100 200 300 400 500
CFU
/g
Drying time (days)
Enterococcus spp. removal in Pan 23 and Pan 41
Pan 23
Pan 41
Expon. (Pan 23)
Expon. (Pan 41)
End of filling Stockpiling
Limit of detection (10 CFU/g)

100
4.3.3 Decay of coliphage
During 12 month drying (Pan 23), the number of coliphage declined from 1.1×10⁴ PFU/g DS
(MAD output) to 2.7×10 PFU/g DS, and approached the limit of detection after 325 days of
drying. Numbers remained consistently small, equivalent to 2.1×10 PFU/g DS in samples of
biosolids collected from the stockpile (Fig. 4.5). Raw data of coliphage decay in Pan 23 is
presented in Appendix 1.3.
During summer drying (Pan 41), the number of coliphage declined from 8.4×10³ PFU/g DS
(MAD output) to 5.3×10 PFU/g DS, after 180 days of drying. Samples collected after 230
days of drying, at the point when the sludge was transferred to the stockpile, numbers had
decreased to a consistent value of 5.1×10 PFU/g DS (Fig. 4.5). In Pan 41, 2 phase decay of
coliphage with rapid decline within the first 100 days following slower decline for the
remainder of the drying period was observed. The decline in numbers of coliphage in Pan 23
was more variable, thus it could not be determined whether or not the pattern was biphasic.
The total, overall reduction in coliphage numbers during drying and stockpiling after a total
period of 450 days was 2.3 log10 units in Pan 23 and 2.2 log10 units in Pan 41 after a total
period of 280 days. Raw data of coliphage decay in Pan 41 is presented in Appendix 2.3.
The T2 treatment grade for enteric virus (<2/10 PFU/g) DS is 100 fold below the limit of
detection level for coliphage and the T1 Grade of enteric virus (<1/100 PFU/g) is 1000 fold
below the level of limit of detection of coliphage. Extrapolation of these data for coliphage
suggests that T1 and T2 Grades for enteric virus could be reached after approximately 450
days of full year drying and 275 days of summer drying.

101
Fig. 4.5: Decrease of coliphage numbers with drying time (days) in Pan 23 (full year
pan) and Pan 41 (summer pan) at ETP. Error bars (+/-) show the standard deviations.
y = 4219.4e-0.012x R² = 0.80, P<0.05
y = 3436.2e-0.019x R² = 0.84, P<0.05
1.0E+00
1.0E+01
1.0E+02
1.0E+03
1.0E+04
1.0E+05
0 100 200 300 400 500
PFU
/g
Drying time (days)
Coliphage removal in Pan 23 and Pan 41
Pan 23
Pan 41
Expon. (Pan 23)
Expon. (Pan 41)
Limit of detection (10 PFU/g)
End of filling Stockpiling

102
4.3.4 Comparison of the decay rates of different indicators
No statistically significant differences were detected between the decay rate constants of
each of the two indicators between the two pans, but there were differences in decay rates
of coliphage (Fig. 4.6). The decay rate of E. coli in both pans were similar ranging from -
0.023 to -0.031, although Pan 23 showed a slightly higher decay rate of E. coli than Pan 41
(Table 4.2). The decay rate was greater in summer pan than in full year pan for
Enterococcus spp. and coliphage. Enterococcus spp. showed higher decay rate – (0.032) in
Pan 41 than Pan 23 (-0.026) but the difference between two pans was not statistically
significant. Coliphage showed lower decay rate (-0.012) in Pan 23 than the decay rate (-
0.025) in Pan 41, but the difference was statistically significant. The decay coefficients
presented in Table 4.2 and Fig. 4.6 are not identical to those shown in Fig. 4.3, 4.4 or 4.5 as
only the first values close to the limit of detection were used to determine decay coefficients.
In addition, the graphs present log10 values, as used by industry, whereas the decay
coefficients were calculated using natural logarithm (loge).
Table 4.2: Decay rate coefficients of different indicators in different pans
Name of indicator Name of the pan Decay coefficient
E. coli Pan 23 -0.031
Pan 41 -0.023
Enterococcus spp. Pan 23 -0.026
Pan 41 -0.032
Coliphage Pan 23 -0.012
Pan 41 -0.025

103
Fig. 4.6: Comparison of decay coefficients of different indicators in Pan 23 (full year
pan) and 41 (summer pan). Mean values and 95% confidence limits are displayed.
Note that more negative value indicates the greater rate of decay. The decay rate
coefficients are not identical to those shown in Fig. 4.3, 4.4 or 4.5 as only first value
close to the limit of detection were used for the present analysis.
-0.04
-0.035
-0.03
-0.025
-0.02
-0.015
-0.01
-0.005
0
Dec
ay c
oeffi
cien
t
Indicators with specific Pan
Decay rate of different indicators in different pans
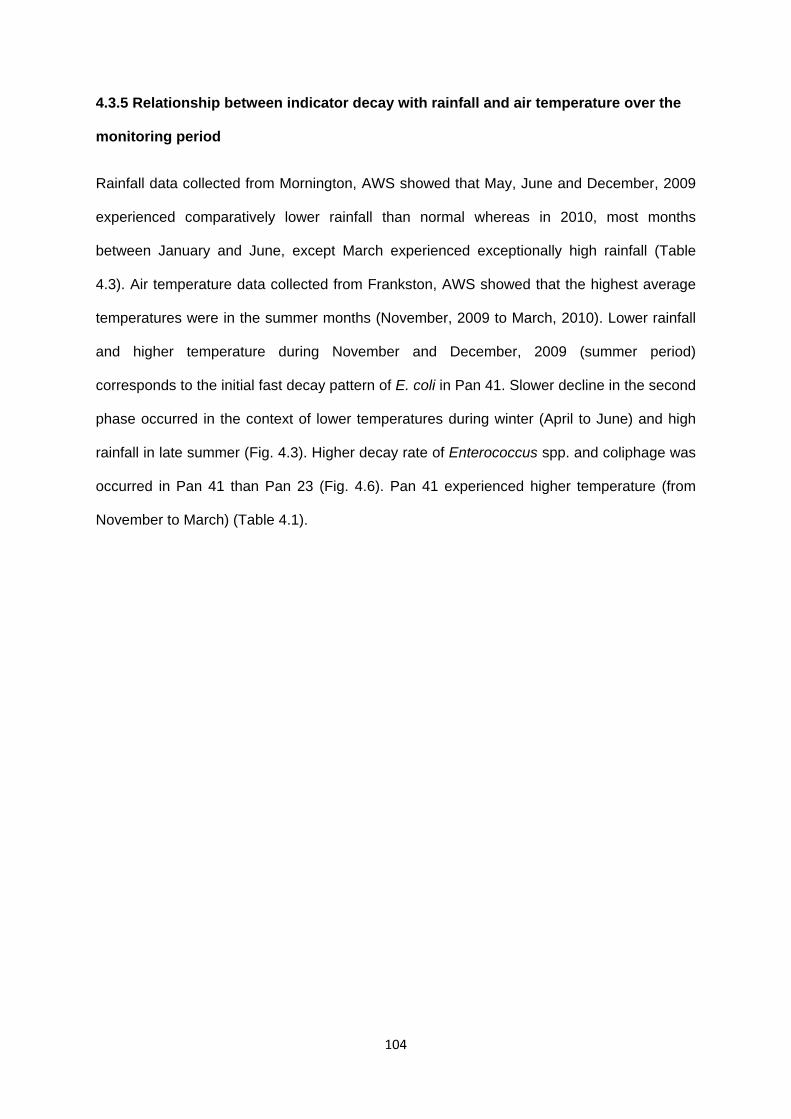
104
4.3.5 Relationship between indicator decay with rainfall and air temperature over the
monitoring period
Rainfall data collected from Mornington, AWS showed that May, June and December, 2009
experienced comparatively lower rainfall than normal whereas in 2010, most months
between January and June, except March experienced exceptionally high rainfall (Table
4.3). Air temperature data collected from Frankston, AWS showed that the highest average
temperatures were in the summer months (November, 2009 to March, 2010). Lower rainfall
and higher temperature during November and December, 2009 (summer period)
corresponds to the initial fast decay pattern of E. coli in Pan 41. Slower decline in the second
phase occurred in the context of lower temperatures during winter (April to June) and high
rainfall in late summer (Fig. 4.3). Higher decay rate of Enterococcus spp. and coliphage was
occurred in Pan 41 than Pan 23 (Fig. 4.6). Pan 41 experienced higher temperature (from
November to March) (Table 4.1).

105
Table 4.3 Average monthly rainfall data from Mornington Weather Station and air
temperature data from Frankston Weather Station, Melbourne over the monitoring
period
Rainfall (mm) Mean maximum air
temperature (ºC)
Month Year Year
2009 2010 2009 2010
January 91.4 24.9
February 114.2 26.5
March 45.9 43.2 22.5 23.5
April 82.2 70.4 19 20.9
May 21 97.9 16 16.5
June 39.2 55 14.2 13.3
July 88 13.4
August 76.8 14.5
September 110.2 16.3
October 62.2 17.5
November - 24.1
December 34.6 23.2
Notes: Numbers in bold showing lower rainfall and higher temperatures over the
monitoring period. Lower rainfall and higher temperatures were considered by
comparing with those of other months over the monitoring period.

106
4.3.6 Sludge temperatures in two different pans over the monitoring period
There were no major differences in sludge temperatures over the monitoring period, except
for one with very high reading for Pan 23 (full year pan) in March, 2010. In Pan 23, sludge
temperatures ranged from 10ºC in July, 2009 to 41ºC in March, 2010. In Pan 41 (summer
pan), sludge temperatures ranged from 13ºC in October, 2009 to 27ºC April, 2010 (Fig. 4.7).
Fig. 4.7: Sludge temperature over the study period
0.0
5.0
10.0
15.0
20.0
25.0
30.0
35.0
40.0
45.0
5/17/2009 8/15/2009 11/13/2009 2/11/2010 5/12/2010 8/10/2010
Slud
ge te
mpe
ratu
re (º
C)
Monitoring date
Sludge temperature in two pans over the monitoring period
Pan 23
Pan 41
Stockpiling point

107
4.3.7 Relationship between dry solid (DS) contents and drying time
Dry solid content increased with increasing time in both Pan 23 (full year Pan) and Pan 41
(summer Pan). In Pan 23, the highest DS value (48.1%) was observed after 350 days of
drying although after that the value decreased in stockpiled sludge during the winter period.
The DS value increased slowly from 2.3 to 7.2 after 280 days of drying during winter, spring
and early summer period whereas during the high summer period, it was suddenly increased
from 7.2% to 48.1%. In Pan 41, the highest DS value was observed in stockpiled sludge
after 280 days (230 days drying and 50 days stockpiled). A Consistent increase of DS value
was observed in Pan 41 over the time period although in late summer period, a sudden
increase was observed (Fig. 4.8).
Fig. 4.8: Dry solid content (DS) of Pan 23 and Pan 41 over the drying period. Blue and
red dashes indicate the beginning of fast drying in Pan 23 and Pan 41 respectively.
0.0
10.0
20.0
30.0
40.0
50.0
60.0
0 100 200 300 400 500
% D
S
Drying time (Days)
DS value of Pan 23 and Pan 41 over the drying period
Pan 23
Pan 41
After stockpiling

108
4.3.8 Indicator decay in relation to sludge dry solids
The survival values of E. coli, Enterococcus spp. and coliphages showed an inverse
relationship to the DS contents of the biosolids in both pans (Fig. 4.9, 4.10). After an initial
rapid decline at DS values of 5 to 10%, the number of indicators declined more slowly.
Similar trends were observed in both pans.
Fig. 4.9: Dry solids versus indicator removal in Pan 23, full year pan. Error bars (+/-)
show the standard deviations.
y = 2E+06x-3.127 R² = 0.81, P<0.05
y = 4E+06x-2.777 R² = 0.75, P<0.05
y = 9536.8x-1.6 R² = 0.83, P<0.05
1.0E+00
1.0E+01
1.0E+02
1.0E+03
1.0E+04
1.0E+05
1.0E+06
1.0E+07
0.0 10.0 20.0 30.0 40.0 50.0 60.0
CFU
/g
% DS
%DS versus indicator removal in Pan 23
E. coli
Enterococci
Coliphage

109
Fig. 4.10: Dry solids versus indicator removal in Pan 41, summer pan. A power trend
line is used to show the fitness of data in it. Error bars (+/-) show the standard
deviations.
y = 449359x-2.189 R² = 0.70, P<0.05
y = 4E+06x-2.667 R² = 0.82, P<0.05
y = 11438x-1.663 R² = 0.77, P<0.05
1.00E+00
1.00E+01
1.00E+02
1.00E+03
1.00E+04
1.00E+05
1.00E+06
1.00E+07
0.0 5.0 10.0 15.0 20.0 25.0 30.0 35.0 40.0 45.0
CFU
/g
% DS
%DS versus indicator removal in Pan 41
E. coli
Entrococci
Coliphage

110
4.4 Discussion
In a drying pan, which was air dried for one year in open pans at ambient temperatures
ranging from 10ºC to 41ºC (Fig. 4.7), there was a reduction in the numbers of E. coli to below
detection limits (101CFU/g) after 350 days of drying. In contrast, levels of E. coli observed in
the ‘summer pan’, which was dried at ambient temperature from 13ºC to 27ºC (Fig. 4.7),
were slightly higher (102 CFU/mL) than full year pan after 230 days of drying. The results
indicate a >4 log10/g DS (3.7-5 log10) reduction of E. coli during the air drying phase. These
indicator organism reductions help to ensure that the processes of MAD, pan drying, and
stockpiling have reduced microbial pathogen levels to below the detection limit and no
regrowth of indicator or pathogenic bacteria has occurred. Thus the sludge processing is in
compliance with the T1 treatment grade in Victoria and Class A biosolids in the USA for
unrestricted use. The findings of the previous year (2007-2008) showed that in pan 33, full
year pan, T1 grade was achieved after about 300 days of drying. This decay rate was
consistent with the decay rate achieved in Pan 23, a full year pan. Malack Mohammad et al.,
2007 reported ~2 log10 reduction of faecal coliforms from initial levels of 105 to 106 MPN/g
DS was achieved after 7 to 14 days of drying in sand beds at three cities of Saudi Arabia.
This rapid log10 reduction is most likely due to the higher temperatures and drier atmospheric
conditions encountered in Saudi Arabia than in Victoria. The levels found by Malack
Mohammad et al., 2007 failed to meet Class A biosolids criteria and this may be due to a
shorter retention period of sludge in sand drying beds compared to the present study.
The 2 phase decline of E. coli in Pan 41 (summer pan) (Fig. 4.3) suggests that the initial fast
decline was due to the warm conditions during filling and the initial phase of drying
(September to November) which may have increased the rate of decay when large and
variable populations of indigenous flora were involved in competition and predation. It is also
due to the high temperature and low rainfall experienced over the initial fast decay phase
(Table 4.3). The second slower decay pattern corresponded to hotter conditions and high
rainfall over January and February (Table 4.3) and a sudden increase in DS content (Fig.

111
4.8). This suggests that factors such as dryness and associated increases in salt
concentrations (Chapter 7) could have contributed this decay. The finding that Pan 41
reached T1 Grade of biosolids more rapidly (after 230 days of drying) than Pan 23 (350 days
of drying) (Fig. 4.3) is consistent with the overall higher temperature and possible
consequent change to a more active and variable indigenous flora experienced by Pan 41.
In contrast, Pan 23 initially experienced low air temperatures in the cooler winter months and
later experienced higher temperatures during the summer season, which together influenced
consistent decline of E. coli over a full year. As the environmental conditions, such as,
temperature and humidity may vary from year to year, these results are not identical for
every year.
Levels of Enterococcus spp. decreased in a similar way to E. coli in both pans indicating that
Enterococcus spp. are suitable indicators to measure the pathogen die-off in wastewater.
The slightly greater decay rate of Enterococcus spp. in Pan 41 compared to E. coli did not
quite reach statistical significance (Fig. 4.6). Enterococcus spp. may be more sensitive to
warm dry conditions during the summer season. Pan 23, (full year pan) showed a slightly
lower decay of Enterococcus spp. than E. coli but the difference was not statistically
significant (Fig. 4.6). This slight difference could be related to the resistance behaviour of
Enterococcus spp against fluctuation of environmental parameters over a whole year. These
results also suggest that selection of indicators could depend on their behaviour in different
environmental conditions, such as, temperature and humidity. Gantzer et al. (2001) also
found similar patterns of reductions of E. coli and enterococci in other types of treatment
processes; composting, lime treatment and drying by heat treatment at 108˚C although the
residual concentration of enterococci in each case was higher than E. coli which indicates
their resistance behaviour to environmental conditions (Gantzer et al., 2001).
Coliphage numbers also decreased substantially during the air-drying phase, suggesting that
enteric viruses are also destroyed during this phase. For the full year pan (Pan 23), the

112
decay coefficients for coliphage were significantly lower than that of E. coli and
Enterococcus spp. (Fig. 4.6). In contrast, the decay coefficients of these three indicators
were not significantly different over the summer drying period (Fig. 4.6). A possible reason
influencing coliphage decay is variation in the protease activity due to fluctuating
temperatures throughout the year. Fluctuating temperatures could affect the composition of
the indigenous flora, which produce proteases and other enzymes. It is possible that
proteases produced by indigenous bacteria could potentially destroy virus coats (refer to
Chapter 8). The significantly greater decay of coliphages in Pan 41 could be related to
greater protease activity over the spring and early summer before significant drying
occurred. The decay rates of coliphages than E. coli and enterococci were similar to the
findings of Lucena et al. (2004), who reported higher log reduction of faecal coliform and
enterococci than coliphage in a lagooning system.
The indicator decay in relation to DS content (Fig. 4.9, 4.10) suggests that moisture content
is one of the most important factors affecting indicator die-off as DS content increased with
time (Fig. 4.8). These findings are comparable with the findings of Ward et al. (1981) in
which a continuous decrease (one-half to one order magnitude) in spiked bacterial species
(S. Typhimurium, E. coli, Streptococcus faecalis, Klibsiella, Enterobacter) occurred with
increasing DS content of sterilized sludge from 5% to 95% caused by natural evaporation at
21˚C in the laboratory after about 7 days. The amount of decrease of bacterial species in this
study was lower than found in the present study and this may be due to the other factors
present in raw sludge. Therefore, indicator die-off during air drying treatment is likely to be
due to multiple factors. The initial rapid decline of indicators in comparatively liquid sludge
containing 5-10% DS suggests that this decay phase may be due to other factors, such as,
predation, competition, nutrient depletion. Other factors affecting indicator die-off include
environmental conditions (VFA toxicity, ammonia toxicity), moisture availability, chemical
contents, nutrient depletion, predation by protozoa and competition with other indigenous
flora (Rudolfs et al., 1950; Sidhu et al,. 2001; Zaleski et al., 2005). Although this chapter did

113
not attempt to examine these factors, there was a difference in the removal coefficients
between summer and full year drying for E. coli, Enterococcus spp. and coliphage (Fig. 4.6).
Possible explanations are the difference in temperature and time of drying between the two
pans and increased predation or competition in the relatively fresh sludge of the summer pan
during increased environmental temperatures. Other factors that may affect decay in both
types of pans include increased concentration of salts or other chemicals or greater
exposure to air at the end of drying.

114
CHAPTER 5
Laboratory Simulation of Mesophilic Anaerobic Digestion

115
5.1 Introduction
Anaerobic digestion is a complex technique by which organic material is transformed into
methane and carbon-dioxide by the activity of a series of anaerobic microbial communities in
absence of molecular oxygen (Sanin et al., 2011b). The main aim of anaerobic digestion is
to stabilize raw sludge by reducing the solid content, odour and microbial content of the
sludge (Gerardi, 2003a). Anaerobic digestion consists of four steps; hydrolysis,
acidogenesis, acetogenesis and methanogenesis (Fig. 5.1) and is mostly accomplished by
four catagories of micromicroorganisms; hydrolytic bacteria, fermentative acidogenic
bacteria, acetogenic bacteria and methanogens (Bitton, 2011b). In the hydrolysis step,
insoluble organic substances and high molecular weight compounds, such as, proteins,
lipids, polysaccharides and nucleic acids are broken down into soluble organic components.
The process of hydrolysis is done by extracellular enzymes, such as, cellulases, proteases
and lipases secreted by hydrolytic bacteria (Gerardi, 2006a; Bitton, 2011b). In the second
step, acidogenesis, the substances produced during hydrolysis are further degraded and
volatile fatty acids with ammonia, carbon-dioxide, hydrogen sulphide and other by-products
are produced by the activity of acidogenic bacteria. In third step of acetogenesis, higher
organic acids and alcohols formed during acidogenesis are further degraded to form acetic
acid, carbon-dioxide and hydrogen with the help of acetogenic bacteria. In the final step of
methanogenesis, methanogens produce methane and carbon-di-oxide from acetate (Apples
et al., 2008). Therefore, a symbiotic relationship among different bacteria persists in an
anaerobic digester (Eckenfelder and Santhanam, 1981a). Methanogens, also called
methane forming bacteria, are strict anaerobes grouped in the domain of Archeabacteria,
which require a very limited number of substrate and possess a very long generation time.
Methanogens are very sensitive to temperatures between 40ºC and 50ºC and pH values
between <6.8 and >7.2. Alkaline conditions resulting in the production of toxic substances;
ammonia, long chain fatty acids by fermentative facultative anaerobic bacteria which inhibit
the activity of methanogens (Gerardi, 2006b). Efficient anaerobic digestion therefore

116
depends on maintaining a dynamic relationship among the different microorganisms involved
in the process.
Of the different types of anerobic digestion, mesophilic anaerobic digestion (MAD) at
temperatures ranging from 30°C to 38°C is the most common as it requires low energy and
the process is highly stable (Gavala et al., 2003). There are some important parameters
which can affect the rates of different steps of the digestion process; pH, temperature,
retention times, chemical composition of wastewater, microbial competition, the presence of
toxicants, improper mixing (Eckenfelder and Santhanam, 1981a; Sanin et al., 2011b; Bitton,
2011b).
Fig. 5.1: Different steps of anaerobic digestion process (Bitton, 2011b)

117
Most studies (Han et al., 1997; Horan et al., 2004; Forster-Carneiro et al., 2010; Rubio-Loza
and Noyola, 2010) using laboratory scale of MAD have demonstrated a 1-2 log10 reduction in
indigenous or spiked bacteria.
Although research on laboratory scale of MAD was done to investigate the bacterial indicator
and pathogens removal, there is no work on viral indicator removal during MAD simulation.
More research is needed to investigate bacterial and viral indicator removal under conditions
operating in Victorian MAD systems.
The aim of this chapter was to determine the decay of E. coli and coliphage in a simulated
anaerobic digester using locally produced primary sludge. The data obtained was used as
part of the validation of the laboratory scale anaerobic digester that has been setup in our
laboratory.
Note: The simulated anaerobic digester was obtained from South East Water Ltd., set up
and modified by Dr. Duncan Rouch and Florian Gauche. My part in this project was to study
the decay of indigenous E. coli and coliphage, and analysis of physical parameters in the
simulated process.
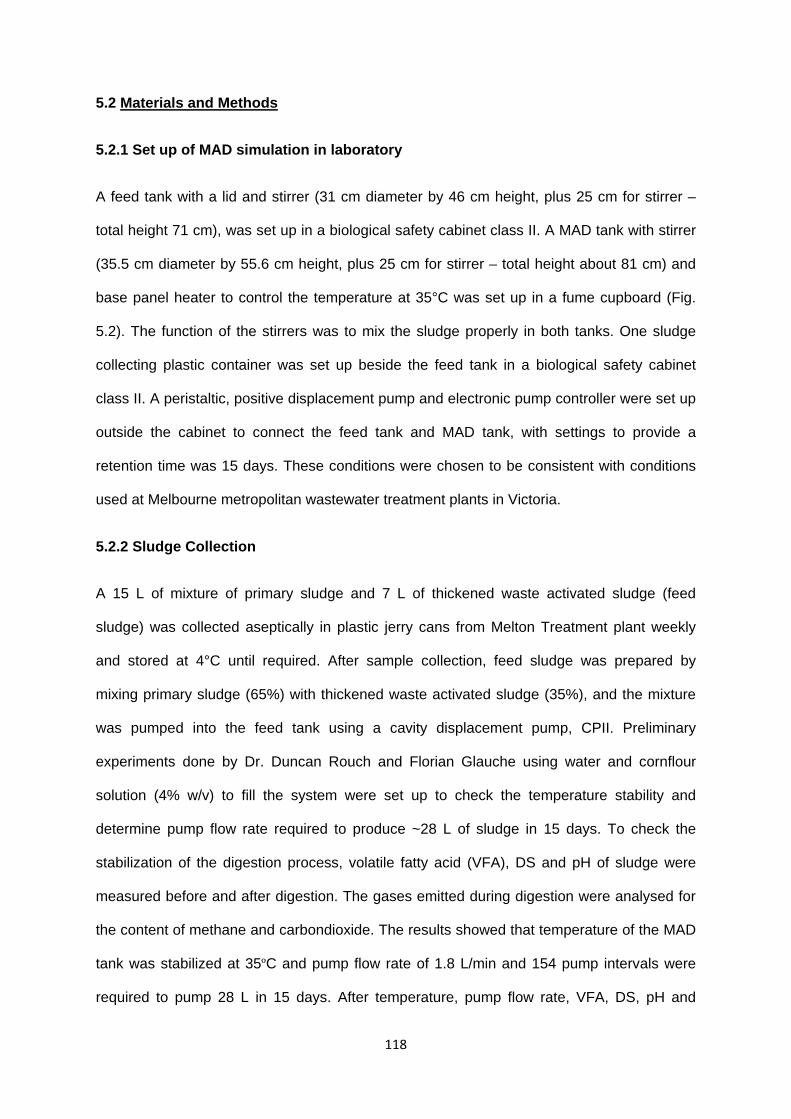
118
5.2 Materials and Methods
5.2.1 Set up of MAD simulation in laboratory
A feed tank with a lid and stirrer (31 cm diameter by 46 cm height, plus 25 cm for stirrer –
total height 71 cm), was set up in a biological safety cabinet class II. A MAD tank with stirrer
(35.5 cm diameter by 55.6 cm height, plus 25 cm for stirrer – total height about 81 cm) and
base panel heater to control the temperature at 35°C was set up in a fume cupboard (Fig.
5.2). The function of the stirrers was to mix the sludge properly in both tanks. One sludge
collecting plastic container was set up beside the feed tank in a biological safety cabinet
class II. A peristaltic, positive displacement pump and electronic pump controller were set up
outside the cabinet to connect the feed tank and MAD tank, with settings to provide a
retention time was 15 days. These conditions were chosen to be consistent with conditions
used at Melbourne metropolitan wastewater treatment plants in Victoria.
5.2.2 Sludge Collection
A 15 L of mixture of primary sludge and 7 L of thickened waste activated sludge (feed
sludge) was collected aseptically in plastic jerry cans from Melton Treatment plant weekly
and stored at 4°C until required. After sample collection, feed sludge was prepared by
mixing primary sludge (65%) with thickened waste activated sludge (35%), and the mixture
was pumped into the feed tank using a cavity displacement pump, CPII. Preliminary
experiments done by Dr. Duncan Rouch and Florian Glauche using water and cornflour
solution (4% w/v) to fill the system were set up to check the temperature stability and
determine pump flow rate required to produce ~28 L of sludge in 15 days. To check the
stabilization of the digestion process, volatile fatty acid (VFA), DS and pH of sludge were
measured before and after digestion. The gases emitted during digestion were analysed for
the content of methane and carbondioxide. The results showed that temperature of the MAD
tank was stabilized at 35ºC and pump flow rate of 1.8 L/min and 154 pump intervals were
required to pump 28 L in 15 days. After temperature, pump flow rate, VFA, DS, pH and

119
biogas had stabilized; the system was run continuously with a retention time of 15 days and
addition of fresh feed material weekly for eight weeks. The two trials were run sequentially
using the same parameters. The third trial was planned, but industry required the period to
concentrate on simulation of pan drying.
5.2.3 Sample analysis for microorganisms and physical parameters
Feed sludge and MAD output, collected aseptically every week were analysed for E. coli and
coliphage following methods described in sections 4.2.2.1 and 4.2.2.3. Physical parameters;
dry solids (DS), volatile solids (VS), pH and biogas (methane and carbondioxide) were also
measured. DS, VS and pH were measured every one or two weeks. The methods for
determining DS and VS were described in Section 3.7 and pH was measured from MAD
output using a pH meter. Biogas was measured regularly by Dr. Duncan Rouch using a
custom-made gas collector and a gas analyser.
Fig. 5.2: Set up of MAD simulation (drawing by Duncan Rouch).
Feed tank & stirrer
Collection tank
Biological safety cabinet class II (1.8 m) Fume cupboard
Methane exhaust line
Controls: Pump (rate), MAD (temperature), Stirrers (rate)
MAD tank, heater & stirrer
Pump
Base panel heater

120
5.3 Results
5.3.1 Decay of E. coli and coliphage during MAD simulation
Table 5.1 shows the result of the numbers of E. coli and coliphage in both feed sludge and
MAD output in two trials. In the first trial, the average number of E. coli in the feed sludge
was 4.97E+06 CFU/g whereas the number was reduced to 2.02E+04 CFU/g at 15 days
retention time for eight weeks operation. The overall reduction of E. coli in the first trial was
2.39 log10 unit (Table 5.1). The overall reduction of E. coli in the second trial was 0.8 log10
unit at 15 days retention time for eight weeks operation (Table 5.1).
In the first trial, the number of coliphage was reduced from 7.68E+03 PFU/g to 2.23E+03
PFU/g but in the second trial no coliphage was detected in feed sludge and MAD output. The
overall reduction of coliphage in first trial was 0.54 log10 unit (Table 5.1).

121
Table 5.1 Levels of E. coli and coliphage in feed sludge and MAD output
Source Trial No E. coli
(CFU/g)
Standard
deviation
Log reduction Coliphage
(PFU/g)
Standard
deviation
Log reduction
Feed sludge First 4.97E+06
9.32E+06 2.39 7.68E+03 1.82E+03 0.54
MAD output 2.02E+04 1.89E+04 2.23E+03 9.50E+02
Feed sludge
MAD output
Second 1.05E+06
1.64E+05
9.21E+05 0.8 No Coliphage N/A N/A
1.91E+05
This table was made using the mean value and standard deviations of E. coli and coliphage numbers, collected every week over the monitoring
period. Mean values for the first and second trial were calculated from 5 and 6 sets of data collected respectively. For each sets of data,
triplicate tests were performed. Raw data of the levels of E. coli and coliphage in feed sludge and MAD output were presented in Appendix 3.1
and 3.2.
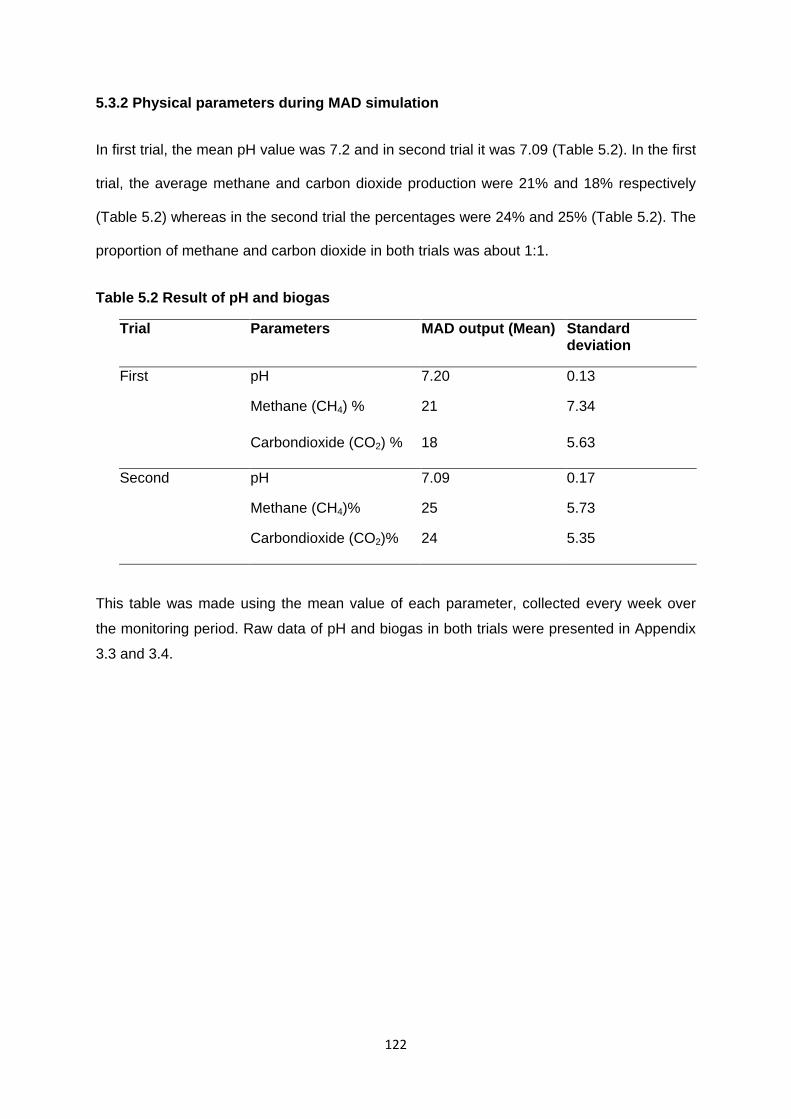
122
5.3.2 Physical parameters during MAD simulation
In first trial, the mean pH value was 7.2 and in second trial it was 7.09 (Table 5.2). In the first
trial, the average methane and carbon dioxide production were 21% and 18% respectively
(Table 5.2) whereas in the second trial the percentages were 24% and 25% (Table 5.2). The
proportion of methane and carbon dioxide in both trials was about 1:1.
Table 5.2 Result of pH and biogas
Trial Parameters MAD output (Mean) Standard deviation
First pH 7.20 0.13
Methane (CH4) % 21 7.34
Carbondioxide (CO2) % 18 5.63
Second pH 7.09 0.17
Methane (CH4)% 25 5.73
Carbondioxide (CO2)% 24 5.35
This table was made using the mean value of each parameter, collected every week over
the monitoring period. Raw data of pH and biogas in both trials were presented in Appendix
3.3 and 3.4.

123
In first and second trials, the average DS content of the feed material was 4.3% and 3.4%
respectively which were decreased to 1.5% at a retention period of 15 days (Table 5.3). In
first and second trial, the average VS content of feed sludge was 81.9% and 83.8%
respectively and it decreased to 76.2% and 71.9% respectively at a retention period of 15
days of MAD (Table 5.3).
Table 5.3 Results for DS and VS
Source Trial No %DS (Mean) Standard
deviation
%VS (Mean) Standard
deviation
Feed sludge First 4.3 1.86 81.9 2.77
MAD output 1.5 0.30 76.2 2.92
Feed sludge Second 3.4 1.36 83.8 2.44
MAD output 1.5 0.52 71.9 2.83
This table was made using the mean value of each parameter, collected every week over
the monitoring period. Raw data of DS and VS in both trials were presented in Appendix 3.5
and 3.6.

124
5.4 Discussion
In this laboratory simulation of MAD, there was a 1-2 log10 reduction of E. coli and about half
log10 reduction of coliphage (Table 5.1) suggesting that MAD in this simulation was effective
in removing E. coli and coliphage from primary sludge. As E. coli and coliphage are
indicators of bacteria and enteric viruses respectively, the results suggest that bacterial and
viral pathogens would also be removed at similar rate. In the second run, no coliphage was
found in the primary sludge, which suggests that bacteriophage were being removed from
primary and waste-activated sludge from Melton treatment Plant. This may happen as the
activated sludge process is a very effective process of virus removal by the mechanisms of
predation by protozoa and antiviral activity of some bacteria (Bitton, 2011b). Some studies
showed that 90-99% coliphage can be removed by this process (Safferman and Morris,
1976). A reduction of E. coli numbers from 106 CFU/g to 104-105 CFU/g is consistent with
class B biosolids, according to US guidelines and T3 Grade, according to Victorian guideline
(EPA, 2004). Reasons for finding lower log reduction of E. coli in the second trial compared
with the first trial may be a lack of proper mixing or different composition of feed sludge
material.
The log10 reduction observed in the present study are consistent with these found in the
literature. A 1-2 log10 reduction of E. coli by MAD simulation is consistent with the findings of
both field and laboratory simulation of MAD. Field studies of MAD by Mandilara et al. (2010),
Watanabe et al. (1997) and Gantzer et al. (2001) resulted in 1-2 log10 reduction of E. coli.
Laboratory simulation done by Han et al. (1997), Horan et al. (2004), Smith et al. (2005),
Rubio-Loza and Noyola (2010), Forster-Carneiro et al. (2010) resulted in about 1-2 log10
removal of E. coli after about 10-20 days of retention time. A field study by Mandilara et al.
(2010) found 0.98 to 2 log10 reduction of coliphage which is greater than the findings of the
present study. The variation between the results of field studies and those of laboratory
studies may due to the variability in conditions during MAD treatment.

125
The methane production (Table 5.2) during MAD simulation in both trials showed that the
proportion of methane to carbon dioxide was about 1:1 whereas in the field it is usually 6:4
(Gerardi, 2003b). Unsatisfactory methane production might be due to the lack of proper
mixing during MAD simulation. Poor mixing could reduce the activity of methanogenic
microorganisms in some parts of the tank as proper mixing facilitates contact between
substrate and different microorganisms as well as uniform environmental conditions (Sanin
et al., 2011b). Another possibility was lack of proper sealing on the lid of the simulation tank
that would make the tank less anaerobic and again inhibit methanogens, which are strict
anaerobes (Gerardi, 2006b).
The average pH value of 7.0 to 7.2, DS reduction of 1.9 to 2.8%, VS reduction of 5.7 to
11.9% during 15 days residence time for trials 1 and 2 respectively, are very similar to the
findings of Horan et al. (2004). In their laboratory simulation, the pH ranged from 6.8-7.8;
there was 3.3% reduction in DS and 15-20% reduction of VS in simulated MAD during 21
days of operation. The higher pH, %DS and %VS reduction reported by Horan et al. (2004)
may be due to the longer retention time used in their study than in the present study.
In conclusion, the simulated MAD set up was successful in demonstrating die-off of microbial
indicators during 15 days of retention period. The die-off rates reported here were similar to
those reported by others and similar to field studies, although methane production was not
optimal. More work is needed to determine whether the low amounts of methane produced
were the results of poor mixing, leaking or other factors. It was intended to extend this study
with other microbial indicators and pathogens, but it was not continued because the industry
supporting this research wished more effort to be given to the pan drying and stockpiling
phases of wastewater treatment.

126
CHAPTER 6
Laboratory Simulation of Drying Pan and Stockpiling

127
6.1 Introduction
In metropolitan Melbourne, Victoria, following anaerobic digestion, sludge is further stabilised
by dewatering either by belt pressing or air drying in a pan. Most of the large metropolitan
treatment plants in Melbourne, such as Eastern Treatment Plant (ETP), SEWL (Mt Martha),
use air drying in open pans although some small treatment plants, such as Melton WWTP
use belt pressing. Regrowth after dewatering by these processes has not been reported.
The results of the field studies (Chapter 4) at ETP showed that number of E. coli consistent
with T1 grade of biosolids was reached after about 8 to 10 months of air drying in summer
and full year pans respectively and the number of somatic coliphage reached close to the
limit of detection after about 6 to 10 months of drying in summer and full year pans
respectively. Two phase decay of both E. coli and coliphage was observed in summer pan.
There has been only a limited amount of research on the die-off of pathogens during
laboratory simulation of solar drying of sludge in beds (Salihoglu et al., 2007).
Salihoglu et al. (2007) investigated sludge management problems in Bursa city, Turkey.
Open and covered solar sludge drying plants, which were constructed in a pilot scale for
experimental purposes were compared. Faecal coliforms, dry solids and climate conditions
were measured regularly in both systems. Mechanically dewatered sludge was used for the
open and covered sludge drying bed simulation. The covered sludge drying system was
more effective in faecal coliform reduction than the open system. The mechanically
dewatered sludge contained 107 CFU/g DS which was reduced to 106 CFU/g (pathogen
requirement for Class B biosolids) after 45 days of drying in the covered system during the
summer period. In the open system, rainfall was thought to hinder constant coliform
reduction (Salihoglu et al., 2007).

128
This study has not fully addressed the question of the time required to reach levels of E. coli
indicative of safe levels of microbial pathogens after pan drying. No research has been done
on the study of microbial decay in simulated pan drying.
A laboratory simulation of pan drying and stockpiling was set up in our laboratory to examine
the decay of selected microbial pathogens. These experiments could not be conducted in
the field due to the low and variable levels of most pathogens in sludge. Spiking field
samples was not an option for both practical and safety reasons. In order to validate the
laboratory simulation, the same indicators that were examined in field studies were
examined in the simulation. This chapter describes the work on bacteriophage decay. The
aims are as follows:
1. To examine the levels of somatic coliphage, seeded MS2 coliphage and seeded P22
bacteriophage in laboratory simulation of pan drying and stockpiling of MAD output.
2. To compare the data of coliphage die-off with the data previously obtained in field
trials at a WWTP in Melbourne (Chapter 4).

129
6.2 Materials and Methods
6.2.1 Sludge collection
300 L of MAD sludge in 22×15 L in 20 L plastic jerry cans and also 1 Kg of mature pan
sludge aged >6 months were collected from ETP. The mixture of MAD sludge and mature
pan sludge was used as the starting material for drying pan simulation. Mature sludge was
included in the mixture according to the practice in the field, in order to provide an inoculum
of suitable microorganisms to initiate the degradation process.
6.2.2 Settling and decanting of sludge
After sample collection, biosolids samples were allowed to settle at 20°C until dry solids (DS)
value of the settled material reached about 3.3%. Based on the preliminary experiments
(Table 6.1) the required DS value was reached after 2 days. 10 L of supernatant was
removed from the top of each jerry can, leaving 5 L of settled sludge.
Table 6.1 Dry solids value of settled sludge
Settling time DS (%)
24 hr 3.0
48 hr 3.3
72 hr 3.5
96 hr 3.4

130
6.2.3 Laboratory set up of drying pan
To set up the drying pan simulation, three stainless steel tanks (25 L) and three plastic
containers (5 L) were placed in a biological safety cabinet class II (Fig. 6.1). Ceramic infrared
heating systems supported by steel bars were fitted on the top of each biological safety
cabinet so that homogenous heating could be provided to both containers and tanks. 25 L of
settled MAD output containing 250 g of mature pan biosolids was pumped into each tank.
4.5 L of settled MAD output containing 45 g of matured pan sludge was pumped into each
plastic container. A control unit for the heating system was placed outside the cabinet to
maintain the temperature for the required time. The external incubation temperature was
20°C to simulate the average temperature during the summer period in Melbourne. The
surface temperature of the heating elements was set at 190° C. A timer was run for 7.6 hr
per day for 7 days. The material was stockpiled once the DS reached 15-20%. When the DS
value of the stockpile reached 50-75%, drying and heating were halted to stabilise the DS
values, as per field data. Three separate trials were run. In ETP, the short time of pan drying
treatment occurs during the summer season is ~12 weeks and the average temperature
during January in the South climate zone in Victoria is 20.05ºC. Summer pan drying was
simulated in the first trial for 21 weeks by imitating the short pan drying treatment time (7
weeks) followed by 14 weeks of stockpiling at 20ºC. In the first trial, the DS content reached
the required value at week seven, at which time stockpiling of both tanks and containers was
completed. For simulations two and three, the drying period was extended to correspond
with field conditions where the average drying period of sludge is approximately 16 weeks.
Simulation 2 and 3 were performed by 12 weeks of pan drying followed by 9 weeks of
stockpiling. The decision was made to slow the drying rate after discussion with industry. It
was considered that a longer drying time was more representative of conditions in the field.
The short drying time used in the first simulation represented worst-case conditions.
Therefore, the heating system and air flow was run every second week in simulation 2 and 3

131
to make the drying rate slower. The required DS content was reached in week 13 and 14
respectively, when stockpiling occurred.
6.2.4 Inoculation of MS2 and P22 bacteriophage
High titres of MS2 coliphage and P22 stock were prepared following the protocol described
in Section 3.9 and 3.10. After demonstrating that numbers of somatic coliphage were too low
to show log reductions, it was decided to add MS2 coliphage to containers in week 5 for
each of the three trials of dying pan simulation. Bacteriophage P22 was added to containers
only in the first drying pan simulation. Stock concentrations of bacteriophages were diluted to
109 PFU/mL and the diluted inoculum was added to samples in specific containers to make
the final concentration of 106 PFU/mL.
Fig. 6.1: Set up of drying-pan simulation in biological safety cabinet (drawn by Dr.
Duncan Rouch)
Biological safety cabinet class II (Safemate 1.8 m)
Control unit for heating system: temperature and time
Biosolids in 25 L steel containers
Ceramic Infrared heating system supported by steel bars
Working height under infrared heaters in cabinet: 55 cm

132
6.2.5 Sample collection during simulations
Samples were collected aseptically from tanks (triplicate) and also containers (triplicate)
immediately after set-up and every second week thereafter. Before sample collection, sludge
in the containers and tanks was stirred well using a sterile spoon. The same sample was
used for microbial analysis, DS and VS measurements. 2 g of sample was used for microbial
analysis and 1 g was used for DS and VS measurements. After stockpiling, the sludge
reached up to 50-75% DS and consisted of small granules. A mortar and pestle were used
to break up the dried sludge after collection. Samples from tanks were used for indigenous
(somatic) coliphage analysis and samples from containers were used for MS2 and P22
analysis.
6.2.6 DS and VS measurement
DS and VS were measured following the standard procedure described in Section 3.7.
6.2.7 Bacteriophage analysis
Somatic coliphage, inoculated MS2 coliphage and P22 were analysed following standard
protocol described in Section 4.2.2.3 with the exception is that for P22, the host strain S.
Typhimurium was used. For coliphage analysis, triplicate samples were used and triplicate
tests were done from each dilution.
6.2.8 Statistical analysis
Mean and standard deviations were calculated from PFU/g achieved from triplicate samples
of triplicate tanks and containers. Statistical analysis was done using regression analysis to
obtain the equation for the correlation coefficient, R value and the confidence interval, decay
coefficient and P value. To compare different sets of data, stock charts were used.
Calculations, parameters obtained from graphs and stock charts were described in Section
4.2.4.

133
6.3 Results
6.3.1 Fate of somatic coliphage during simulated pan drying and stockpiling
Figs. 6.2, 6.3 and 6.4 show the numbers of native somatic coliphage during treatment in
drying pan simulations 1, 2 and 3. The initial concentration of somatic coliphage in each
simulation was about 103 PFU/g and this was reduced about 101 PFU/g (limit of detection)
within 90 days in both drying pan simulation 2 and 3, whereas in drying pan simulation 1, the
same log reduction occurred within 50 days of drying. Raw data for the removal of somatic
coliphage in drying pan simulation 1, 2 and 3 are presented in Appendix 4.1.1, 4.2.1 and
4.3.1 respectively.
Fig. 6.2: Somatic coliphage die-off in drying pan simulation 1. The R2 value of 0.70
indicates intermediate fitness of data in the trend line. Error bars show the standard
deviation. The arrow shows the date of stockpiling at day 44 (week 7).
y = 7909.7e-0.106x R² = 0.7099
1.00E+00
1.00E+01
1.00E+02
1.00E+03
1.00E+04
1.00E+05
0 20 40 60 80
PFU
/g
Days
Removal of somatic coliphage in drying pan simulation 1
Limit of detection stockpiling

134
Fig. 6.3: Somatic coliphage die-off in drying pan simulation 2. Error bars show the
standard deviation. The arrow shows the date of stockpiling at day 91 (week 13).
y = 2078.6e-0.039x R² = 0.9224, P<0.05
1.00E+00
1.00E+01
1.00E+02
1.00E+03
1.00E+04
0 50 100 150 200
PFU
/g
Days
Removal of somatic coliphage in drying pan simulation 2
Limit of detection Stockpiling
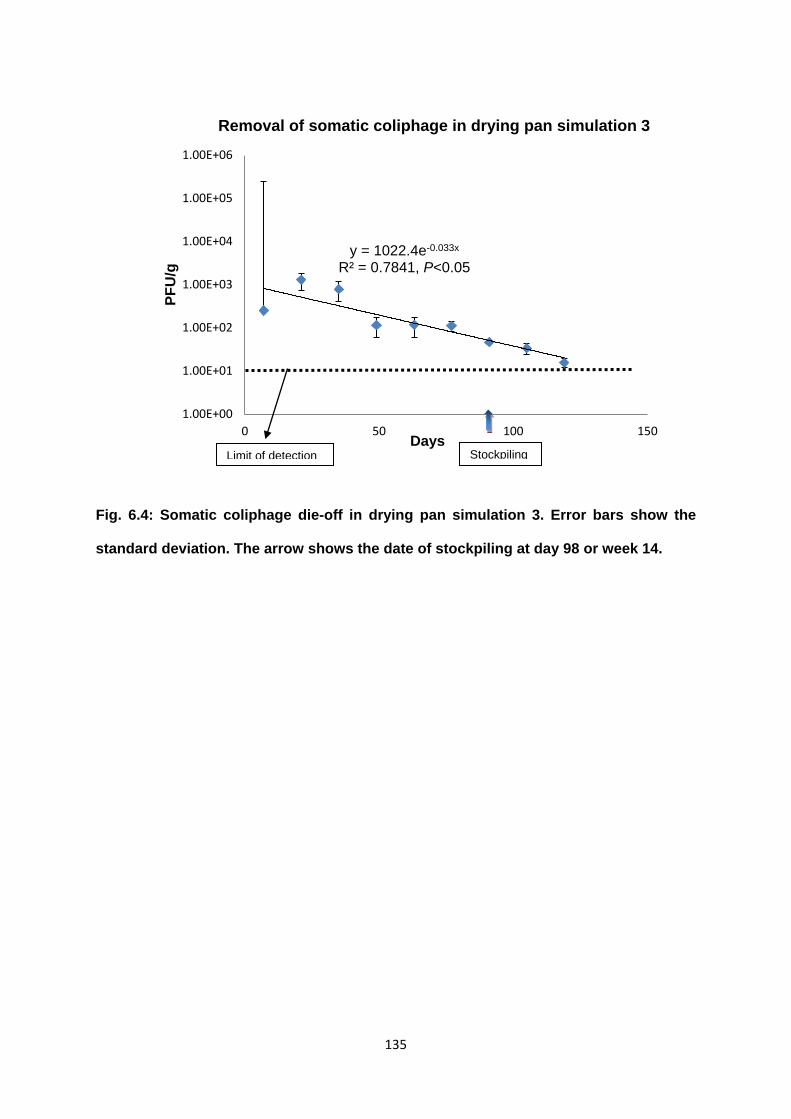
135
Fig. 6.4: Somatic coliphage die-off in drying pan simulation 3. Error bars show the
standard deviation. The arrow shows the date of stockpiling at day 98 or week 14.
y = 1022.4e-0.033x R² = 0.7841, P<0.05
1.00E+00
1.00E+01
1.00E+02
1.00E+03
1.00E+04
1.00E+05
1.00E+06
0 50 100 150
PFU
/g
Days
Removal of somatic coliphage in drying pan simulation 3
Limit of detection Stockpiling

136
6.3.2 Fate of MS2 coliphage during pan drying and stockpiling
Fig. 6.5, 6.6 and 6.7 show the decay of seeded MS2 coliphage in drying pan simulations 1, 2
and 3. The initial concentration of seeded MS2 coliphage was 106 PFU/g, and the numbers
decreased to 101 PFU/g within about 50 days of drying for drying pan simulation 1 and about
60 days of drying for drying pan simulations 2 and 3. In all three simulations, the numbers of
MS2 decreased very rapidly after seeding. Raw data for the removal of MS2 bacteriophage
in drying pan simulation 1, 2 and 3 are presented in Appendix 4.1.2, 4.2.2 and 4.3.2
respectively.
Fig. 6.5: MS2 coliphage die-off in drying pan simulation 1. Error bars show the
standard deviations. The arrow shows the date of stockpiling at day 44 or week 7.
First data point was from day 14, as MS2 coliphage was seeded in containers in week
2 during drying pan simulation 1.
y = 3E+06e-0.179x R² = 0.8683
1.00E+00
1.00E+01
1.00E+02
1.00E+03
1.00E+04
1.00E+05
1.00E+06
1.00E+07
0 20 40 60 80 100
PFU
/g
Days
Removal of MS2 bacteriophage in drying pan simulation 1
Limit of detection stockpiling

137
Fig. 6.6: MS2 coliphage die-off in drying pan simulation 2. Error bars show the
standard deviations. The arrow shows the date of stockpiling at day 91 or week 13.
First data point was from day 35, as MS2 coliphage was seeded in containers in week
5 during drying pan simulation 2.
y = 3E+08e-0.129x R² = 0.8815, P<0.05
1.00E+00
1.00E+01
1.00E+02
1.00E+03
1.00E+04
1.00E+05
1.00E+06
1.00E+07
1.00E+08
1.00E+09
0 50 100 150 200
PFU
/g
Days
Removal of MS2 coliphage in drying pan simulation 2

138
Fig. 6.7: MS2 coliphage die-off in drying pan simulation 3. Error bars show the
standard deviations. The arrow shows the date of stockpiling at day 98 or week 14.
First data point was from day 49, as MS2 coliphage was seeded in containers in week
7 during drying pan simulation 3.
y = 2E+09e-0.163x R² = 0.9498, P<0.05
1.00E+00
1.00E+01
1.00E+02
1.00E+03
1.00E+04
1.00E+05
1.00E+06
1.00E+07
0 50 100 150
PFU
/g
Days
Removal of MS2 coliphage in DP3 simulation

139
6.3.3 Fate of P22 during pan drying and stockpiling
Fig. 6.8 shows the levels of P22 bacteriophage in drying pan simulation 1. From an initial
concentration of added P22 of 106 PFU/g, a level of 101 PFU/g was reached within 70 days
of drying. Raw data for the removal of P22 in drying pan simulation 1 are presented in
Appendix 4.1.3.
Fig. 6.8: P22 die-off in drying pan simulation 1. Error bars show the standard
deviations. The arrow shows the date of stockpiling at day 44 or week 7. First data
point was from day 1, as P22 was seeded in containers in week 1 during drying pan
simulation 1.
y = 2E+07e-0.17x R² = 0.8854
1.00E+00
1.00E+01
1.00E+02
1.00E+03
1.00E+04
1.00E+05
1.00E+06
1.00E+07
0 20 40 60 80 100
PFU
/g
Days
Removal of P22 in drying pan simulation 1
Stockpiling Limit of detection

140
6.3.4 Comparison between field study described in Chapter 4 and laboratory
simulation for different bacteriophages
A stock chart comparing the removal coefficients of all bacteriophages in the laboratory
simulation and somatic coliphage in the field (result obtained from Chapter 4) is presented in
Fig. 6.9. There was no statistically significant difference between the decay rates of somatic
coliphage obtained in second and third simulations as the confidence limits overlap, but first
simulation showed differences. The removal rate of somatic coliphage in drying pan
simulation 1 (-0.066) was greater than that of drying pan simulation 2 (-0.038) and 3 (-
0.027).
There was no statistically significant difference in removal coefficients between the three
simulations for MS2 coliphage or for P22 (simulation 1) as 95% confidence limits
overlapped.
The removal coefficients of somatic coliphage in three simulations did not overlap with those
of MS2 coliphage or P22, so that the rates of somatic coliphage are statistically significantly
different from MS2 coliphage and P22. The decay rates of MS2 coliphage and P22 were not
statistically significantly different.
The removal coefficients obtained for the field study in Chapter 4 were not significantly
different from the laboratory simulation 2 and 3; whereas those of drying pan simulation 1
was significantly greater than in the field. The removal rate of somatic coliphage in drying
pan simulation 1 (-0.027 to -0.066) was higher than the field (-0.012 to -0.026).
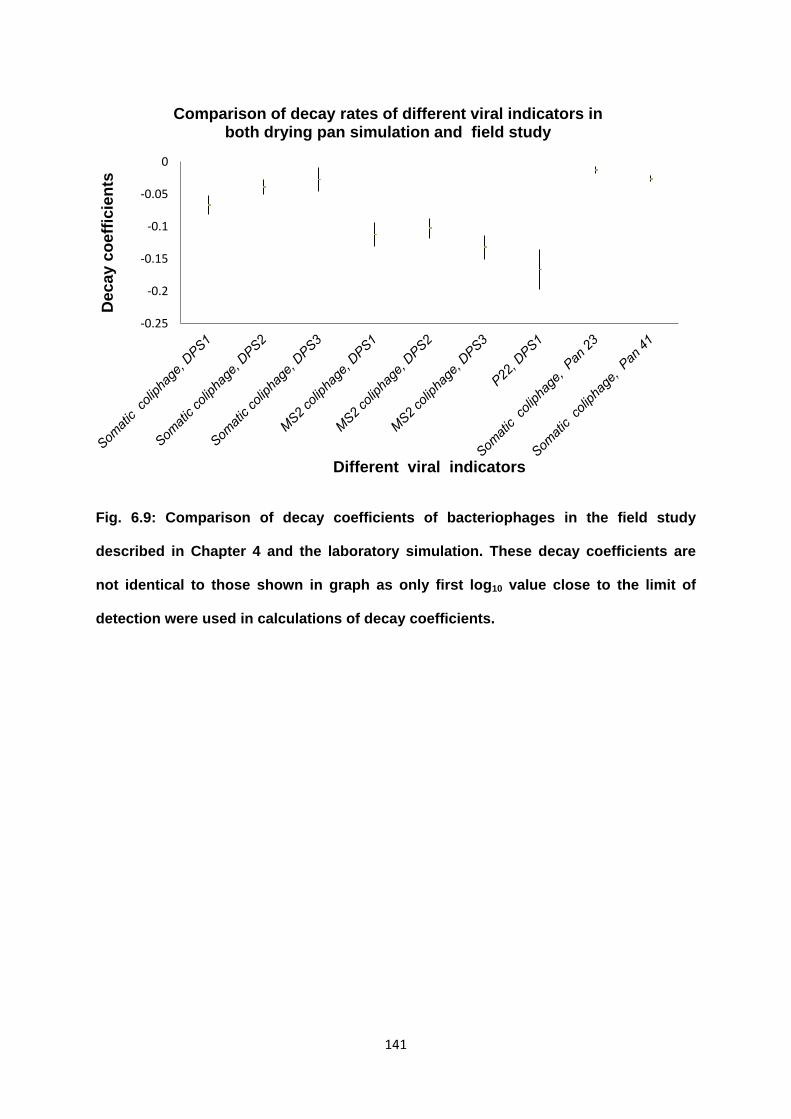
141
Fig. 6.9: Comparison of decay coefficients of bacteriophages in the field study
described in Chapter 4 and the laboratory simulation. These decay coefficients are
not identical to those shown in graph as only first log10 value close to the limit of
detection were used in calculations of decay coefficients.
-0.25
-0.2
-0.15
-0.1
-0.05
0
Dec
ay c
oeffi
cien
ts
Different viral indicators
Comparison of decay rates of different viral indicators in both drying pan simulation and field study

142
6.4 Discussion
The results of drying pan simulation suggest that solar drying is effective in coliphage
removal. The initial concentration in the sludge mixture was 103 PFU/g to 104 PFU/g which is
very close to the field study in which the initial concentration of MAD product was about 104
PFU/g. These results are similar to those of another study performed by Zhang and
Farahbakhsh (2007) in which the initial concentration of somatic and F-specific coliphage in
raw sludge was about 103 PFU/mL. In the present study, the somatic coliphage removal was
faster in the first drying pan simulation than in the second and third simulations. This slower
decline was most likely because of adjustment of the heating system and air flow during the
last two simulations, in order to slow the drying rate. This suggested that the DS content or
rate of drying has an effect on removal of somatic coliphage during sewage sludge
treatment. Similar findings were obtained from the field study which showed faster decay
over the summer period than the winter month (Chapter 4, Fig. 4.5, 4.6). Since coliphages
are used as the indicators of enteric viruses, the DS content and rate of drying may also be
important in decay of enteric viruses in drying pan. Ward and Ashley (1977) provided
support for the notion that dewatering of sludge affects the survival of Poliovirus,
Coxsackievirus and Reovirus. These viruses were seeded into raw sludge containing 5%
solids and the sludge was placed in a shallow pan to facilitate air drying at 21°C. Inactivation
of these viruses increased with increasing dry solid content. There was a ~4 log10 reduction
of each virus by the time the dry solid content reached to 80-90%.
The findings of slightly higher decay rate of MS2 coliphage in drying pan simulation 3
compared to 1 and 2 suggests that MS2 coliphage decay be less affected by increasing
dryness. It may be due to other biological factors, such as antiviral activity of the bacterial
population or predation by protozoa (Bitton, 2011a).

143
Comparison of the decay rates of different phages, showed that the decay rate of MS2
coliphage and P22 bacteriophage were greater than those of somatic coliphage. This result
supports the findings by Alcalde et al. (2003) and Lucena et al. (2004), although these
studies compared the decay kinetics of different viral indicators in different types of
wastewater treatment systems. Alcalde et al. (2003) measured somatic coliphages and F-
specific coliphages in a lagoon system consisting of three anaerobic ponds in parallel,
followed by a facultative pond, a maturation pond, a two stage rock filter, stabilization
reservoirs and seasonal storage reservoir. The decay rate of F specific coliphage was higher
than that of somatic coliphage in this treatment system and it was suggested that F-specific
bacteriophage is a less adequate viral indicator for the lagoon treatment system (Alcalde et
al., 2003). Lucena et al. (2004) compared various bacterial and viral indicators to assess the
removal of faecal microorganisms by different treatment processes; primary sedimentation,
flocculation aided sedimentation, activated sludge digestion, anaerobic digestion and
lagooning. The results showed that the removal rate of F-specific coliphage was significantly
greater than somatic coliphage in flocculation-aided sedimentation with lime. In the lagoon
system, there was a higher rate of inactivation of F-specific bacteriophage than phages
infecting B. fragilis. The authors suggested that F-specific coliphage is a poor indicator for
lime-aided flocculation and also lagoon systems (Lucena et al., 2004).
There are some possible reasons for differences in decay kinetics for somatic coliphage,
MS2 and P22. Somatic coliphage is heterogeneous in nature and it interacts with
heterogeneous types of E. coli hosts. It is attached by somatic antigens which continue to
infect susceptible E. coli, until the host is destroyed, whereas MS2 requires a specific type of
E. coli carrying the F-pillus, which is less likely to be present in large amounts in sludge.
Free MS2 would likely to be vulnerable to bacterial proteases present in the sludge.
Similarly, P22 requires the host S. Typhimurium, which is likely to be present in extremely
small numbers in sludge. The reasons for the very rapid early decline of MS2 but not P22

144
are that it is most likely that the MS2 capsid proteins are more sensitive to proteases than
other bacteriophages, such as, P22.
Other studies in our laboratory performed under Smart Water Grant (SWF Round 6, Project
No. 611-001, 2009-2011) showed that the decay coefficients for Adenovirus (-0.023 to -
0.043) are similar to those reported here for somatic coliphage (-0.027 to -0.066), suggesting
that somatic coliphages are good indicators for enteric viruses. Research performed by Wen
et al. (2009) found that MS2 coliphage is a poor indicator for Poliovirus removal in a
laboratory simulation of secondary treatment processes.
The decay rate of somatic coliphage in the first drying pan simulation was significantly
different from the decay rate in the field study while there was no significant difference
between simulation 2, 3 and decay in the field. The rate of drying in simulations 2 and 3 was
designed to mimic field conditions during summer. This difference between simulation 1 and
the field study could have been due to fluctuation in temperature and other environmental
factors, such as, rainfall in field study during summer and winter whereas in drying pan
simulation 1, the heating system and air flow rate was kept constant. In addition, the rate of
drying used in simulation 1 was faster than the drying rate in the field. The affect of
environmental conditions on pathogen decay is illustrated by the findings of Salihoglu et al.
(2007) who compared the performance of open solar drying beds and covered solar drying
beds in which temperature, air flow, radiation were controlled. There was a greater rate of
inactivation of faecal coliforms in the covered system whereas fluctuation in coliform
numbers in the open system was attributed to increasing moisture content due to rainfall
(Salihoglu et al., 2007).
A possible reason behind a 2 phase decay pattern observed for coliphages in the field
(Fig.4.5) but not in the laboratory simulations was the constant controlled environmental
conditions present during laboratory simulation of pan drying. The variable conditions in the

145
field could possibly support a more varied indigenous bacterial flora, contributing to enzyme
production, resulting in an initial burst of rapid decay.
The findings of no statistical difference between the decay rate of somatic coliphage in the
second and third drying pan simulation in which drying rate mimicked field conditions
validates this laboratory simulation following the decay of indigenous bacteriophages.
Possible reasons for the removal of bacteriophage during pan drying are protease activity in
sludge and also predation by protozoa or metazoans.
The findings of this research suggest that drying time plays one of the most important roles
in coliphage decay during drying pan of sludge. Differences among the decay rates of
different bacteriophages during the simulation suggest that some other factors, such as;
different enzyme activity produced by bacterial indigenous flora is most likely to be
responsible for this decay. This research also suggests that MS2 bacteriophage is a poor
indicator due to its very rapid decay whereas somatic coliphage would be a good indicator
for the presence of enteric viruses. Coliphage has advantages over adenovirus as an
indicator for enteric viruses as the culture and quantification techniques for adenovirus (PCR
which quantifies both viable and non-viable virus) are difficult and time consuming.

146
CHAPTER 7
Factors Affecting Bacterial Die-Off During
Sewage Sludge Treatment

147
7.1 Introduction
The field study described in Chapter 4 showed that the selected indicator organisms (E. coli,
E. faecalis and coliphage) die-off during pan drying and suggested that both dryness and
time are involved in this die-off as the inactivation rate of indicators increased with the
increase in dry solid (DS) content over the time period. The 2-phase decay pattern that was
observed in some experiments (Fig. 4.3, 4.5) suggested that different factors are involved
during early and late phases of pan drying. Factors that have been suggested to cause
pathogen decay or loss of viability during sewage sludge treatment include both biotic and
abiotic factors: temperature, pH, dryness, retention period, microbial competition and
predation by indigenous flora (Ward et al., 1981; Pike and Carrington, 1986; Fernandez et
al., 1992; Sidhu et al. 2001; Smith et al. 2005; Lang and Smith, 2008). These factors are
unlikely to act alone but are interrelated with each other. The contribution of each to the die-
off of microbial pathogens during anaerobic digestion and pan drying is not well understood.
Lang and Smith (2008) investigated the effect of time and temperatures (35°C, 55°C, 70°C),
on the inactivation of enteric E. coli and Salmonella spp. in a small scale of laboratory
experiment using TSB broth. The results of this study suggested that time-temperature
kinetics are mainly responsible for the bacterial decay in TSB and that E. coli is more heat
resistant than Salmonella spp. Detailed results of this study were described in Chapter 2.
Smith et al. (2005) examined the effect of temperature and other factors on the inactivation
of E. coli and Salmonella spp. during mesophilic anaerobic digestion (MAD) of sludge. This
study also demonstrated that E. coli is more heat resistant than Salmonella spp. Moreover,
efficient mixing and organic matter stabilization are more important than the mesophilic
temperature in affecting the rate of inactivation during anaerobic digestion.
Fernandez et al. (1992) studied on the effect of pH on the elimination of faecal coliform
bacteria in vitro in the lagoons of an urban wastewater treatment plant in Spain. E. coli was

148
seeded into lagoon wastewater with pH controlled at 8.2 and into distilled water with pH
controlled at 9.0. Cultures were incubated at 22°C for 28 days to simulate the field
conditions. Controls consisted of wastewater samples and distilled water without controlling
the pH. In wastewater at pH 8.2, the E. coli concentration decreased to about 6 log10 within
28 days whereas about 1 log10 E. coli was eliminated at pH 9.0 in distilled water over the
same period. In control wastewater, E. coli was reduced by about 5 log10 over 28 days while
in controlled distilled water, the numbers remained stable. The authors concluded that both
pH and competition with predation play an important role in the elimination of E. coli in
lagoon treatment as there was greater reduction of E. coli in lagoon wastewater than in
distilled water with slightly greater reduction under pH controlled conditions (Fernandez et
al., 1992), however wastewater at pH 9.0 and distilled water at pH 8.2 were not examined.
During air drying treatment, dryness is thought to be as one of the most important factors
affecting bacterial die-off. Ward et al. (1981) found that sludge containing 95% DS may
cause 0.5 to 4 log10 reduction of bacterial pathogens. The results described in Chapter 4
suggested that sludge containing about 50% DS is responsible for 4-5 log10 reduction of
bacterial indicators after 8 to 10 months of drying (Fig. 4.3). Other factors other than dryness
are likely to be responsible for bacterial pathogen reduction during air drying treatment. As
different types of salts are present in MAD output (Park et al., 2006), it is possible that, with
decreasing moisture content during the air drying phase, increasing salt concentration may
affect the bacterial inactivation.
Other factors that may contribute to pathogen die-off during drying pan treatment include
substrate limitation and indigenous flora content. This data is needed to understand decay
processes in drying pans and storage and to inform improved treatment for required
microbial quality.

149
The aims of this study were as follows:
1. As salt concentrations may increase as biosolids dry during pan drying
process, the hypothesis is that salt concentrations contribute to bacterial die-
off. The first aim was, therefore, to examine the effect of increasing salt
mixture levels on E. coli levels in laboratory cultures.
2. A second hypothesis is that indigenous flora present in MAD output and
drying pan sludge contribute to the decay of bacterial pathogens during MAD
and pan drying. The second aim was therefore to determine the effect of
indigenous flora on the fate of a field strain of Salmonella spp. in MAD output
and drying pan samples of biosolids.

150
7.2 Materials and Methods
7.2.1 Bacterial isolates and culture conditions
To determine whether field isolates differed from laboratory strains in their resistance to
environmental factors, both field isolates and reference strains were used in this study. Five
field isolates of E. coli (M34, M1-1, MOA-5, MOA2-1, and MOA2-5), E. coli ATCC 25922 and
E. faecalis ATCC 29212 were used. Salmonella Birkenhead (source: cattle) was also used.
Of the field isolates, M34 was from a drying pan, M1-1 from MAD output, MOA-5, MOA2-1
and MOA2-5 were from primary sludge. All of these isolates were obtained from Mt Martha
treatment plant in a laboratory study conducted during 2007-2008. Environmental isolates
and reference strains were stored in 90% glycerol at -20 ºC.
7.2.2 Confirmation of isolates of E. coli and S. Birkenhead
The identity of the E. coli isolates was confirmed using the following conventional
biochemical tests: production of acid and gas from lactose at 37ºC and 44ºC, indole
production, oxidase production, lactose fermentation on MacConkey agar and also by
API20. S. Birkenhead was confirmed using conventional biochemical tests: motility test,
indole production, lysine decarboxylase activity, inability to hydrolyse urea and agglutination
with Salmonella specific O antisera. This isolate had previously been identified as S.
Birkenhead by a reference laboratory (Microbiological Diagnostic Unit, University of
Melbourne).
7.2.3 Effect of different salt mixtures on the fate of E. coli
This experiment was set up to examine the tolerance of field isolates of E. coli and to
determine whether they differed from a reference strain of E. coli in tolerance to salt
mixtures. E. faecalis ATCC 29212 was used as a control as it is known to be more salt
tolerant than E. coli.

151
7.2.3.1 Preparation and inoculation of salt mixture
Salt mixtures were prepared for this experiment based on the average concentration of
soluble cations (Na+, K+, NH4+, Mg+, Ca+) in sludge following anaerobic digestion for 30 days
as reported by Park et al. (2006) (Table 7.1 and 7.2). The expected salt concentrations in
pan samples were extrapolated based on the DS content of biosolids obtained during field
sampling. Luria Bertani (LB) broth was modified with salt mixtures (KCl, ammonium acetate,
MgCl2.6H20 and CaCl2) such as the final salt content ranged from 3 to 11 g/100 mL (Table
7.3). Since the estimated total salt concentrations in pans (from >100 days to >300 days of
drying since the start of filling) were in the range of ~3 to 11 g/100 mL, the same range of
concentrations was used in Luria broth. 100 µl of each bacterial culture (107CFU/mL) was
added to 10 mL of LB containing different salt mixtures (3%, 5%, 7%, 9% and 11%) to make
the final concentration of bacteria at 105CFU/mL. Cultures were incubated overnight at 37º
C. LB without any salt was used as a control. After incubation, colony counts were
performed using the spread plate method and the number of CFU/mL was calculated.
Triplicate tests were performed and the experiment was repeated twice and the means and
standard deviations of CFU/mL were recorded.

152
Table 7.1 Chemical content of sludge, collected from seven WWTPs following
anaerobic digestion at 35ºC for 30 days (Park et al., 2006)
Soluble components
Salt concentrations (mg/L)
Sludge samples DS Na+ K+ NH4+ Mg2+ Ca2+
(g/100 mL) A 1.53 601 104 359 4.5 23.9
B1 0.65 1120 110 22.4 16.8 48.4
B2 0.80 1003 135 52.5 14.9 55.4
C 0.50 69.4 86.2 367 6.9 22.7
D 0.52 95.8 45.4 189 16.9 45.6
E 0.65 332 67.5 313 50.1 167
F1 0.42 72.7 44.8 193 11.4 28.2
G 0.49 125 72.2 253 7.4 33.8
Average 0.7h 427.4b 83.1b 218.6b 16.1b 53.1b
Minimum 0.417 69.4 44.8 22.4 4.5 22.7
Maximum 1.534 1120 135 367 50.1 167
b, h=refer to Table 7.2

153
Table 7.2 Salt concentration in sludge containing different % DS levels (calculated
from data in Table 7.1)
Estimated salt concentrations (g/L)
DS (g/100 mL)
Type of sludge with approximateage (days) NaCl KCl AA MgCl2.6H20 CaCl2 Total salt
Total salt (%)
0.7 j MAD 1.09a 0.16a 0.93a 0.14a 0.19a 2.51d 0.25c
5 Pan, ~140 7.76 1.13 6.67 0.97 1.39 17.92 1.79
10 Pan, ~280 15.52 2.26 13.34 1.93 2.78 35.84 3.58
20 Pan,~320 31.04 4.53 26.69 3.86 5.57 71.69 7.17
30 Pan,~350 46.56 6.79 40.03 5.79 8.35 107.53 10.75
AA= Ammonium acetate
j =The first cell of the first column shows the average g DS/100 mL in output of MAD from
Table 7.1. All other values in this column were based on the DS content of pan sludge found
in the field study. Salt concentrations were calculated from the average cation content from
Table 7.1 using the formula of g/L=mM/1000*mw, mM=mg/L/aw. Salt percentagec was
calculated from g/Ld, used in Luria broth.

154
Table 7.3 Individual and total Salt concentrations in Luria broth
Salt concentrations (g/100 mL)
CaCl2 MgCl2.6H20 AA KCl NaCl Total Salt
0.23 0.16 1.12 0.19 1.30 3
0.39 0.27 1.86 0.32 2.16 5
0.54 0.38 2.61 0.44 3.03 7
0.70 0.48 3.35 0.57 3.90 9
0.85 0.59 4.10 0.69 4.76 11

155
7.2.4 Effect of indigenous flora on the growth of S. Birkenhead in biosolids
S. Birkenhead was chosen for this experiment because in the field study low numbers of
Salmonella spp. were detected in MAD output and Salmonella spp. were rarely isolated from
pan or stockpile samples. Factors affecting the fate of Salmonella spp. in MAD output and
pan samples of different ages were investigated.
7.2.4.1 Sample collection and preparation
Output from MAD and samples from drying pans (74 days after the start of filling for early
pan, 188 days for middle pan and 262 days for late pan) were collected from ETP. All
samples were collected aseptically and transported to the laboratory on an ice pack. The dry
solid content of samples was determined as described in Section 3.7.
Each sample was divided into three subsets, each of 500 g. One subset was autoclaved to
remove indigenous flora, another was sent for gamma irradiation in order to remove
indigenous flora without the possibility of changing the chemical composition of biosolids and
third one was left untreated. Samples for autoclaving were transferred to 200 mL glass
bottles and autoclaved at 121°C for 40 min. For gamma irradiation, 500g samples were
placed in 500 mL plastic containers with lids. The plastic containers were placed in a sealed
foam box (27.5×17×15.5 cm), in a cardboard carton, and sent to Steritech, Dandenong
South, Victoria 5566 for gamma irradiation at 50 Kgy.
7.2.4.2 Inoculation of samples
50 mL aliquots of gamma irradiated, autoclaved or unautoclaved sludge samples were
transferred to 100 mL sterile plastic containers aseptically. Each sample was inoculated with
107 CFU/mL of S. Birkenhead to give the final bacterial concentration of 105 CFU/mL.
Nutrient broth with 105 CFU/mL of S. Birkenhead was used as a positive control. After
inoculation, the MAD samples were incubated at 37ºC for 24 hrs. Pan samples were

156
incubated for both 24 hrs and 48 hrs at 20ºC. The different temperatures and different
incubation periods in pan samples were used to simulate the field conditions.
7.2.4.3 Enumeration of S. Birkenhead
S. Birkenhead was enumerated described as Section 3.11.
7.2.5 Contribution of added nutrients and indigenous flora to the growth of S.
Birkenhead in biosolids
To further explore the contribution of nutrients and indigenous flora to the ability of S.
Birkenhead to grow in biosolids, untreated and autoclaved biosolids with and without an
added carbon source were compared for their ability to support the growth of S. Birkenhead.
7.2.5.1 Sample collection and preparation
Samples from the output from MAD were collected from the wastewater treatment plant at
Mt Martha, South East Water Limited (SEWL). This treatment plant follows mesophilic
anaerobic digestion, pan drying and stockpiling, which is similar to ETP. All of the samples
were collected aseptically and transported to the laboratory using on ice pack.
To determine whether nutrient deprivation or indigenous flora affect the growth of S.
Birkenhead, four different mixtures were set up; autoclaved MAD, untreated MAD, untreated
MAD with added carbon source and nutrient broth as a control. Samples of untreated
biosolids were enriched with nutrient broth (×10 concentrations) to make the carbon content
equivalent to that of MAD sample. Each mixture was setup in triplicate.
7.2.5.2 Determination of dry solid, volatile solid and carbon content of biosolid
Dry solid, volatile solid and carbon content of MAD output were determined described in
Section 3.7.

157
7.2.5.3 Inoculation of MAD output with field isolates of S. Birkenhead
20 mL of the autoclaved, untreated and untreated samples with added nutrient broth were
aliquoted in a 50 mL sterile falcon tube aseptically. Each tube was inoculated with 107
CFU/mL of S. Birkenhead to give the final bacterial concentration of 105 CFU/mL. Nutrient
broth containing the same carbon content spiked with 105 CFU/mL was used as a control.
After inoculation, all of samples were incubated at 37°C for 24 hrs.
7.2.5.4 Enumeration of S. Birkenhead
S. Birkenhead was enumerated described as Section 3.11.

158
7.3 Results
7.3.1 Effect of different salt mixtures on the growth and decay of E. coli in biosolids
The growth of all field isolates of E. coli and the reference strains decreased with increasing
salt concentration (Fig. 7.1). For each isolate, the difference in the growth in different salt
mixtures was statistically significant (P<0.05). No growth occurred in mixtures containing 9%
salt. All field isolates except M34 (~0.5 log10) decreased in number by ~1 log10 in mixture
containing 11% salt whereas E. coli ATCC 25922 and E. faecalis ATCC 29212 numbers
increased by <0.5 log10 and >1 log10 respectively in 11% salt concentration. Most field
isolates grew in mixtures containing 7% salt, but E. coli ATCC 25922 and MOA-5 failed to
grow at this concentration. As expected, E. faecalis ATCC 29212 was more salt tolerant than
E. coli isolates. Raw data for the effect of different salt mixtures on the growth and decay of
E. coli in biosolids are presented in Appendix 5.1.
Fig. 7.1: Growth and decay of field isolates of E. coli and two reference strains, E. coli
ATCC 25922 and E. faecalis 29212 in different salt mixtures. Error bars showed the
standard deviations.
1.00E+00 1.00E+01 1.00E+02 1.00E+03 1.00E+04 1.00E+05 1.00E+06 1.00E+07 1.00E+08 1.00E+09 1.00E+10
M34 M1-1 Moa-5 MOa2-1 MOa2-5 E. coli ATCC 25922
E. faecalis ATCC 29212
CFU
/mL
Name of the isolates
Effect of different salt mixtures on the fate of different isolates of E. coli
LB
3% TS
5% TS
7% TS
9% TS
11% TS
Inoculum 1E+5 CFU/mL

159
7.3.2 Effect of indigenous flora on the growth of S. Birkenhead in biosolids
7.3.2.1 MAD output
Growth of S. Birkenhead in autoclaved, gamma irradiated and nonautoclaved MAD output
was significantly different (P<0.05). In autoclaved MAD output, S. Birkenhead grew to ~107
CFU/mL, compared with ~108 CFU/mL in gamma irradiated MAD and about 109 CFU/mL in
NB. In nonautoclaved MAD, there was no growth (Fig. 7.2). In summary, compared with the
nonautoclaved control, there was a ~2 log10 increase in growth in autoclaved MAD, ~3 log10
increase in gamma irradiated MAD and >3 log10 increase in the control NB. Raw data for the
effect of indigenous flora on the growth of S. Birkenhead in MAD output are presented in
Appendix 5.2.1.
Fig. 7.2: Growth of S. Birkenhead after 24 hr of incubation in anaerobic digester
sludge (MAD) collected from ETP. Error bars showed the standard deviations.
1.00E+01 1.00E+02 1.00E+03 1.00E+04 1.00E+05 1.00E+06 1.00E+07 1.00E+08 1.00E+09
Salm
onel
la c
onte
nt (C
FU/m
L)
Sample type
Growth of Salmonella Birkenhead in anerobic digester at ETP
Inoculum 1E+5 CFU/mL

160
7.3.2.2 Pan samples, 24 hr incubation period
Growth of S. Birkenhead in autoclaved, gamma irradiated and untreated pan samples after
24 hrs at 20°C was significantly different (P<0.05). No growth occurred in untreated
samples, indeed some die-off was observed. Some growth (<1 log increase) occurred in
some autoclaved samples collected from medium aged and late pans. S. Birkenhead grew
to ~107CFU/mL (about 2 log10 increase) in gamma irradiated samples from early, middle and
late drying pans (Fig. 7.3). There was no difference in the amount of growth in early, medium
and late pan samples. Raw data for the effect of indigenous flora on the growth of S.
Birkenhead in pan samples are presented in Appendix 5.2.2 and 5.2.3.
Fig. 7.3: Fate of S. Birkenhead in pan samples after 24 hr incubation period at 20ºC.
Error bars showed the standard deviations.
UEP= Untreated Early Pan, UMP=Untreated Middle Pan, ULP= Untreated Late Pan, AEP=
Autoclaved Early Pan, AMP=Autoclaved Middle Pan, ALP= Autoclaved Late Pan, GEP=
Gamma irradiated Early Pan, GMP= Gamma irradiated Middle Pan, GLP=Gamma irradiated
Late Pan
1.00E+00
1.00E+01
1.00E+02
1.00E+03
1.00E+04
1.00E+05
1.00E+06
1.00E+07
1.00E+08
UEP UMP ULP AEP AMP ALP GEP GMP GLP
CFU
/mL
Type of sample
The fate of Salmonella in differently treated pan sludge after 24 hrs
Inoculum 1E+5CFU/mL

161
7.3.2.3 Pan samples, 48 hr incubation
Growth of S. Birkenhead in autoclaved, gamma irradiated and untreated pan samples after
48 hrs at 20°C was significantly different (P<0.05). Incubation for a further 24 hr resulted in
another 1-2 log10 increase in the cell numbers present in the biosolids treated by autoclaving
and gamma irradiation but not in the untreated biosolids (Fig. 7.4). After 48 hr of incubation
at 20°C, in gamma irradiated pan samples, Salmonella grew to about 108CFU/mL in all pan
samples (a further increase of 1 log10). In autoclaved middle and late pan samples, there
was about 1 log10 additional increase in CFU/mL; however there was no growth in early pan
samples that were autoclaved or in untreated pan samples.
Fig. 7.4: Fate of Salmonella in differently treated different aged pan samples after 48hr
incubation period at 20ºC. Error bars showed the standard deviations.
UEP= Untreated Early Pan, UMP=Untreated Middle Pan, ULP= Untreated Late Pan, AEP=
Autoclaved Early Pan, AMP=Autoclaved Middle Pan, ALP= Autoclaved Late Pan, GEP=
Gamma irradiated Early Pan, GMP= Gamma irradiated Middle Pan, GLP=Gamma irradiated
Late Pan
1.00E+00 1.00E+01 1.00E+02 1.00E+03 1.00E+04 1.00E+05 1.00E+06 1.00E+07 1.00E+08 1.00E+09
UEP UMP ULP AEP AMP ALP GEP GMP GLP
CFU
/mL
Type of sample
The fate of Salmonella Birkenhead in differently treated pan sludge after 48 hrs
Inoculum 1E+5CFU/mL

162
7.3.3 Effect of nutrients on the growth of S. Birkenhead in biosolids
The characteristics of the MAD samples used in this investigation are presented in Table
7.4.
Table 7.4 Characteristics of MAD sample
Dry Solid
(%DS)
Volatile Solid
(%VS)
Carbon content
(%/DS)
2 76 0.9
MAD=Mesophilic anaerobic digester

163
The growth pattern of S. Birkenhead was significantly different in autoclaved and
nonautoclaved MAD output (P<0.05) (Fig. 7.5). There was no growth of S. Birkenhead in
untreated biosolids whereas in autoclaved biosolids and nonautoclaved biosolids enriched
with nutrient broth, there was about 2 log10 increase in the numbers of S. Birkenhead. In
nutrient broth containing the same amount of carbon, there is about 4 log10 increase in the
numbers of S. Birkenhead. In nonautoclaved biosolids without added S. Birkenhead, no
Salmonella spp. was detected (data not shown). Raw data for the effect of nutrients on the
growth of S. Birkenhead in biosolids are presented in Appendix 5.3.
Fig. 7.5: Effect of nutrient supplementation of MAD on growth of S. Birkenhead. Error
bars showed the standard deviations.
1.00E+00
1.00E+01
1.00E+02
1.00E+03
1.00E+04
1.00E+05
1.00E+06
1.00E+07
1.00E+08
1.00E+09
1.00E+10
Nonautoclaved (NA) Autoclaved NA+Nutrient broth Nutrient broth
CFU
/mL
Type of Treatment
Effect of nutrient supplementation of MAD on growth of Salmonella Birkenhead
Innoculum 1E+5 CFU/mL

164
7.4 Discussion
The aim of the first part of this study was to determine whether increasing salt concentration
could be one factor affecting die-off of indicator organisms.
In the absence of biosolids, field isolates of E. coli were able to grow in broth containing
concentrations of salt estimated to be present in pan samples aged ~100-300 days. At
concentrations of salt (9-11%) equivalent to those found in late pans, E. coli either failed to
grow or the number decreased by ~1 log10 (Fig. 7.1). These results suggest that high salt
concentration could contribute to the decay of E. coli in late pans.
With one exception (MOA-5), all field isolates of E. coli grew in broth containing 7% salt
mixture, whereas the reference strain either failed to grow or showed minimal growth at 7%,
9% and 11% salt concentrations. These findings suggested that field isolates have adapted
to salt mixtures found in drying pans. The growth of reference strain E. coli ATCC 25922 at
the levels of 11% salt mixture could have been due to some contamination. The reference
strain of E. faecalis grew at levels of 11% salt mixture, confirming that enterococci are more
salt tolerant than E. coli and may survive better than E. coli as pans dry out and salt levels
increase.
There are two possible explanations to the observation that gamma irradiation and
autoclaving supported growth of Salmonella Birkenhead while no growth occurred in
untreated MAD (incubated at 37ºC) and pan sludge (incubated at 20ºC) (Fig. 7.2, 7.3, 7.4).
One possible explanation is that untreated sludge contains indigenous flora leading to
competition and predation, whereas the indigenous flora was killed by autoclaving or gamma
irradiation. Another possible explanation is that through autoclaving, available nutrients
increased either due to release from dead cells, or degradation of macromolecules. Neither
of these possibilities explains why there was no growth in autoclaved early pan samples.

165
There was slightly more growth in gamma irradiated biosolids, than autoclaved biosolids.
The different growth patterns in biosolids treated with two sterilization processes could be
due to the difference in the mechanism of gamma irradiation and autoclaving, possibly
resulting in differences in nutrient availability following the two methods.
The 2 log10 increase in growth observed in autoclaved and untreated biosolids enriched with
nutrient broth (Fig. 7.5) supports the hypothesis that macromolecules were degraded into
smaller compounds or nutrients were released from dead cells during autoclaving, thus
releasing available nutrients. In contrast to the findings of this study, Sidhu et al. (2001)
found that the bioavailable nutrients in compost stored for two years were sufficient for
Salmonella spp. to attain a maximum population density of more than 106/g. Consequently,
availability of nutrients did not appear to be a growth limiting factor in composted biosolids.
Similarly, Hussong et al. (1985) found that the majority of composted biosolids provided
nutrients for Salmonella spp. regrowth. These differences could be due to differences in
nutrient availability or in indigenous populations between composted and anaerobically
digested biosolids. These results are consistent with these of Smith et al. (2005) who
suggested both substrate limitation and microbial competition are responsible for pathogen
destruction during mesophilic anaerobic digestion of biosolids.
The results presented in this chapter suggest that the die-off of bacterial pathogens
depends on several factors including competition or predation by indigenous flora, nutrient
deprivation, increasing salt levels. Although this work was done on bacteria seeded into
biosolids, it is likely that similar findings would apply to bacteria naturally present in the
sludge. Alternatively, natural inhabitants of sludge may have developed adaptive strategies
to enable them to survive better than seeded organisms. The findings of this research will
help the managers of the wastewater treatment plants to better manage their plants or even
help design of new plants.

166
CHAPTER 8
Factors Affecting Coliphage Die-Off During Sewage Sludge
Treatment

167
8.1 Introduction
Sewage sludge contains a wide range of microorganisms. Among them enteric viruses that
have caused public health concerns because of several waterborne diseases outbreaks
(Dongdem et al., 2009). Enteric viruses in sewage sludge are a heterogeneous group that
can be divided into two main groups: enterovirus group, including Poliovirus, Coxsackievirus,
and Echovirus, and a heterogeneous group including Adenovirus, Hepatitis A viruses,
human Rotavirus and human caliciviruses including Norovirus and Astrovirus. These viruses
contain a protein coat surrounding a single stranded or double stranded DNA or RNA
genome. The structure and composition can vary (Percival et al., 2004c).
Enteroviruses are small, nonenveloped, icosahedral particles approximately 27 nm in
diameter with a protein capsid enclosing a single strand genome of positive sense RNA. The
capsid of enteroviruses is an icosahedron with 20 faces and 12 apices, composed of 60
protomers, each containing a single copy of each of the proteins; VP1, VP2, VP3 and VP4.
The enteroviruses are stable at pH values ranging from 3 to 10, resistant against quaternary
ammonium compounds, 70% ethanol, ether, and chloroform and stable in many detergents.
They are sensitive to chlorine, sodium hypochlorite, formaldehyde, gluteraldehyde and UV
radiation (Percival et al., 2004c).
Adenoviruses are nonenveloped, icosahedral particles, approximately 70-100 nm in
diameter consisting of protein coat and a genome of double stranded DNA. The protein coat
or capsid is composed of 252 capsomers of which 250 are hexons and 12 are pentons.
Adenoviruses are stable at pH 3 and more resistant to the action of UV light than
enteroviruses (Percival et al., 2004a; Nemerow et al., 2009). Astroviruses appear as round
structures approximately 28 nm in diameter. These viruses contain a protein coat and
positive sense single stranded RNA genome. Astroviruses are stable at pH 3, resistant to
chloroform, detergents and lipid solvents (Percival et al., 2004b). Rotaviruses are large,

168
icosahedral virus particles, approximately 75 nm in diameter with a triple layer of protein and
a double stranded RNA genome (Percival et al., 2004d).
Bacteriophages are a heterogenous group of viruses that infect bacteria, classified into 13
families. Bacteriophages consist of a single or double stranded DNA or RNA genome
surrounded by a protein coat (Lucena and Jofre, 2010). Bacteriophages have been used as
indicators of the presence of viruses because of the difficulty in enumeration and isolation of
enteric viruses. Bacteriophages are suitable as indicators because they have the similar
structure, morphology, size and behaviour to the enteric viruses. Among bacteriophages, the
most commonly used indicators are somatic coliphages and F specific RNA phages
(Donnison and Ross, 1995; Jinling et al., 2010). The somatic coliphages are a heterogenous
group of bacteriophages that infect E. coli via specific surface antigens. MS2 bacteriophages
are F-specific RNA phages, which infect only the E. coli cells that produce the F-pillus
(Lucena and Jofre, 2010). MS2 bacteriophages are icosahedral, single stranded RNA
bacteriophages, approximately 24 nm of head diameter and contain a capsid composed of
180 proteins and positive sense RNA genome (Plevka et al., 2009; Elsawy et al., 2010).
Although not much work was done on the mechanism of phage reduction during sludge
treatment, some work has been done on the mechanism of reduction in wastewater
treatment processes. Factors reported to be responsible for phage reduction in wastewater
include adsorption of phage onto solid particles, elevated temperature, pH level, sunlight,
dryness, and predation by protozoa or metazoa (Tanji et al., 2002; Feng et al., 2003;
Templeton et al., 2005; Nappier et al., 2006).
Nappier et al. (2006) has shown that MS2 coliphage rapidly loses viability in raw wastewater.
The rates of inactivation of total F specific coliphages in raw wastewater at 51°C and 53°C
were examined. There was a 2 log10 reduction of the initial coliphage concentration within 2
hr at each temperature and further reduction was observed over the next 22 hr. There were

169
no major differences in the inactivation rate at 51°C and 53°C. Bacteriophages representing
five catagories of F+ DNA; M13, Fd and F1 and group 1 F+ RNA (MS2), group iii F+ RNA
(Qβ), were isolated from biosolids, and compared for their susceptibility to inactivation by
heat by incubation in TSB medium at 53°C for 60 min. The MS2 phage and F+ DNA
coliphages were more resistant to thermal inactivation than other group coliphages (Nappier
et al., 2006). These authors did not report on the inactivation of bacteriophages at
temperatures relevant to mesophilic anaerobic digestion (MAD) or pan drying.
Feng et al. (2003) investigated the effects of pH and temperature on MS2 and Qβ coliphage
survival and inactivation under specific environmental conditions to determine the most
suitable viral indicator for water and wastewater studies. RNA F-specific coliphages; MS2 or
Qβ stock solutions were added, to two types of buffer solutions (pH 3-8 and pH 9-11) at
different temperatures (5°C, 15°C, 25°C and 35°C). The inactivation rate of both coliphages
increased when pH was decreased below 6 or increased above 8, however biosolids
generally have pH values within this range. The inactivation rates of both phages increased
with increasing temperature. MS2 survived better in acidic conditions than in alkaline
conditions whereas Qβ survived better in alkaline condition than in acidic condition (Feng et
al., 2003). These findings are consistent with variable behaviour of different bacteriophages
in biosolids.
Tanji et al. (2002) investigated the fate of coliphage in a wastewater treatment plant in Japan
from March to December, 2001. Sewage sludge was collected from different stages of
wastewater treatment; influent, supernatant of primary settling tank, anaerobic tank, aerobic
tank, returned sludge, supernatant from the final settling tank and the effluent. After
centrifugation, phages in the supernatant and in the solid particles were enumerated. The
solid particles were resuspended in elution buffer containing NaCl and boric acid, vortexed
and kept at room temperature for 90 min to release the phage from the solid particles. Then
the sludge was again centrifuged and the supernatant was used for the enumeration of

170
phage attached to solid particles. The results suggested that anaerobic and aerobic
treatment enhanced adsorption of the phage by the solid particles (Tanji et al., 2002).
These studies revealed the effect of pH, temperature on inactivation of coliphage during
different wastewater treatment processes, and showed that bacteriophages adhere to the
solid particles in the sludge, resulting in concentrating of the phage in the solid phage. The
results did not explain the early rapid decline of coliphage numbers observed in field drying
pans over the summer period (Fig. 4.5).
Different types of microorganisms in sewage sludge participate in the degradation of organic
matter during wastewater treatment and the microbial populations in sewage sludge change
during stabilization of the sludge. During this process, complex organic molecules are
broken into smaller units through a series of hydrolytic reactions with the help of different
groups of bacteria. These smaller units can be taken up by bacterial cells and used for their
intracellular metabolism. Different types of enzymes are produced by various bacteria during
the process of organic matter decomposition of sewage sludge treatment (Dueholm et al.,
2000; Gessesse et al., 2003; Gerardi, 2006a). Among the enzymes, proteases are
commonly produced by both Gram positive and Gram negative bacteria. These enzymes
can catalyse the cleavage of peptide bonds (Wandersman, 1989). Since coliphages and
enteric viruses have a protective protein coat, proteases may affect coliphage die-off during
sewage sludge treatment (Cliver and Hermann, 1972; Nasser et al., 2002).

171
The hypothesis to be tested in this section is that bacterial proteases contribute to the
inactivation of coliphage in sewage sludge.
The aims of this chapter are:
1. To measure protease activity in biosolids samples collected from different stages of the
treatment process (MAD, drying pan).
2. To observe the effect of temperature and pH on protease activity of sludge extracts.
3. To investigate whether the sludge extracts (protease source) are responsible for the
removal of MS2 bacteriophage.

172
8.2 Materials and Methods
8.2.1 Sample collection
Samples of MAD output were collected from both Eastern Treatment Plant (ETP); EMADa,
EMADb and Melton Treatment Plant; MMAD. Pan samples of different ages, early pan; 2.7
month (EPa), 1 month (EPb) and late pan; 14 month (LPb), 13 month (LPb) since the start of
filling were also collected from ETP. After collection, samples were transported to the
laboratory using an icepack and stored at 4º C. Dry solid (DS) and volatile solids (VS) were
measured following standard protocol (Section 3.7).
8.2.2 Enzyme extraction and detection in biosolids
Enzyme extraction was performed as described by Gessesse et al., 2003. Each MAD or pan
sample was split and transferred into three sterile falcon tubes (40 mL) and kept in ice. 0.5%
(v/v) of Triton X-100 was added to each sample and the mixtures were stirred at 200 rpm for
1.5 hr at 4ºC using a rotary shaker. This step was done to release the enzymes bound to the
cell surface or adsorbed into the extracellular polymeric substances (EPS). After shaking,
the samples were centrifuged at 4700 rpm for 10 mins at 4ºC. The supernatant was used as
the enzyme source.
A calibration curve was set up using concentrations of proteinase K ranging from 30 to 1000
µg/mL and incubation at 37ºC for 30 min. Supernatants prepared as described in Section
8.2.2 from MAD, early pan (EP) and late pan (LP) samples were used to obtain an indication
of the amount of enzyme activity in biosolids samples.
8.2.3 Enzyme assay
The method for determination of protease activity was a modification of the method
described by Gessesse et al. (2003). The substrate used to determine protease activity was
2.5% (W/V) azocasein in 0.50% (W/V) sodium bicarbonate buffer at pH 8. 2.5 mL of
substrate and 1.5 mL of buffer were mixed and kept at 37ºC for 30 min for temperature

173
equilibration. To initiate the reaction, 1 mL of sludge extract was added to the substrate and
buffer mixture and incubated at 37ºC for 0.5 hr, 2 hr, 20 hr, 48 hr or 96 hr. A blank tube was
set up by adding 2.5 mL of azocasein substrate and 2.5 mL of buffer without any enzyme
source. After incubation, a 1 mL of aliquot of the mixture was transferred into another tube
and 4 mL of 5% (v/v) trichloroacetic acid was added to terminate the reaction. The mixture
was centrifuged at 4700 rpm for 1 min at 4ºC. 1 mL of supernatant was mixed with 3 mL of
500 mM sodium hydroxide solution. A 350 µl aliquot of the mixture was transferred to a
microtitre plate and absorbance of the resulting orange coloured compound was measured
at 407 nm against a blank using a Thermo Scientific Multiskan Ascent. One unit of protease
activity was defined as the amount of enzyme causing an absorbance increase of 0.01 at
407 nm. Triplicate tests were performed and experiments were done twice.
8.2.4 Effect of pH and temperature on protease activity of sludge from ETP
Sludge extracts from MAD, EP and LP samples collected from ETP were used for this
purpose. Stock solutions of 0.5% (W/V) sodium bicarbonate buffer at different pH values (4,
5, 6, 7, 8, 9 and 10) were prepared. Alliquots of buffer (1.5 mL) were mixed with substrate
(2.5 mL) and sludge extract (1mL). The mixture was incubated at two different temperatures,
20ºC and 37ºC for 24 hr to simulate temperatures used in MAD and pan drying. A 24 hr
incubation period was selected as this corresponded with the maximum activity of proteinase
K (Fig. 8.2). Protease activity was measured following the protocol described in Section
8.2.3, to evaluate the effect of different pH values and temperatures on protease activity of
sludge extract. Triplicate tests were performed and experiments were done twice.
8.2.5 Effect of sludge extract on the fate of coliphage
Enzyme was extracted from MAD samples collected from Melton TP and ETP, EP and LP
samples collected from ETP following the method described in Section 8.2.2. The
supernatant of the centrifuged sludge was filtered using 0.45 µM filter to remove any
bacterial cells and the filtered sludge extract was used as the enzyme source. A stock

174
concentration (1011PFU/mL) of MS2 bacteriophage (prepared following the method
described in Section 3.9) was diluted to 107 PFU/mL and the diluted bacteriophage was
added to 1 mL of the filtered sludge extract and sodium bicarbonate buffer, pH 8 to give a
final concentration at 105 PFU/mL. The reaction mixture contained 900 µl of sludge extract,
90 µl of buffer (NaHCO3, pH 8.0) and 10 µl of 107 PFU/mL of MS2 bacteriophage. The
mixture was incubated at 37ºC and MS2 bacteriophage in the sludge extract was quantified
at 0 hr, 4 hr, 8 hr, 22 hr and 26 hr. Proteinase K (Sigma) was used as a positive control
and TYGB without any enzyme source was used as a negative control. In the case of PK,
100 mM Tris HCl and 100 mM CaCl2 solution was added to proteinase K and MS2
bacteriophage (total volume of 1 mL) to give a calcium concentration of 5 mM, pH 8.0 and
MS2 concentration of 106 PFU/mL. According to the instructions from Sigma Aldrich, PK is
optimally active in these conditions. Sludge extracts were set up in triplicate and the
experiment was repeated twice.
8.2.6 Statistical analysis
Protease activity, PA (U/mL) was calculated using the formula of OD407-Blank/0.01. Means
and standard deviations of PA (U/mL) were calculated using the replicates of each
experiment. Statistical analysis was done by using single factor anova to achieve a P value.
Stock chart (decay coefficients) was calculated according the description in Section 4.2.4.

175
8.3 Results
8.3.1 Calibration curve
The results of the calibration curve (Fig. 8.1) show a linear relationship between enzyme
concentration and protease activity. Based on the calibration curve, MAD output, early pan
(EP) and late pan (LP) sludge showed protease activity of less than 20 µg/mL with higher
levels in MAD than pan samples.
Fig. 8.1: Calibration curve for Proteinase K after 30 min incubation with azocasein
substrate at 37°C. MAD, EP and LP samples were used to obtain an indication of
protease in biosolids. Protease activity was based on the rate of azocasein substrate
degradation and expressed in unit/mL.
PA=Protease activity, EMADa=Samples collected from mesophilic anaerobic digester
at ETP, EPa= Samples collected from early pan, LPa= Samples collected from late
pan.
0
20
40
60
80
100
120
140
PA (U
/mL)
Enzyme concentration
Enzyme concentration versus protease activity

176
8.3.2 Demonstration of protease activity of supernatants prepared from different
sludge samples
Sludge extracts from MAD output, early and late pans, showed protease activity at 37ºC
(Fig. 8.2). This temperature was chosen to maximize the substrate degradation. The highest
protease activity was observed in MAD sludge from ETP and the lowest activity was from a
late pan sample. The DS contents of MMAD, EMADa, EPa and LPa are 2%, 3%, 4% and
12% respectively. The test samples, all showed increasing levels of activity after 20 hr and
this is probably due to the continuous secretion of protease by indigenous bacteria in the
sludge extract, which was not filtered before use. The control, PK showed peak protease
activity after 20 hr incubation, after which the observed levels of activity stabilized, probably
due to degradation of PK. Raw data for this experiment are presented in Appendix 6.2.

177
Fig. 8.2: Protease activity in mesophilic anaerobic digester output (EMADa), early pan
(EPa), late pan (LPa) samples, collected from ETP and MAD output (MMAD), collected
from Melton. 30 µg/mL of proteinase K (PK) used as a control. Protease activity is
based on the rate of azocasein substrate degradation over the time period. Error bars
showed the standard deviation.
0
10
20
30
40
50
60
70
80
90
100
0.5 hr. 2 hr. 20 hr. 48 hr. 96 hr.
PA (U
/mL)
Incubation Time
Protease activity in different sludge samples
EMADa
Epa
Lpa
MMAD
control (PK)

178
8.3.3 Effect of pH and temperature on protease activity of different sludges
At 20ºC and after overnight incubation, the protease activity detected at different pH values
was statistically significantly different (P<0.05) (Fig. 8.3). All sludge samples showed the
highest protease activity at pH 8, although there was some variability. The early pan showed
the highest activity and the MAD sample showed the lowest activity at 20ºC. Raw data for
the effect of pH on protease activity of EMADb, EPb and LPb at 20ºC are presented in
Appendix 6.3.1, 6.3.3 and 6.3.5 respectively.
Fig. 8.3: The effect of pH on protease activity of different sludge extracts incubated at
20ºC for 24 hr. Error bars showed the standard deviations.
EMADb=Samples collected from mesophilic anaerobic digester at ETP, EPb= Samples
collected from early pan, LPb= Samples collected from late pan.
0
5
10
15
20
25
pH 4 pH 5 pH 6 pH 7 pH 8 pH 9 pH 10
PA(U
/mL)
Different pH
Effect of pH on protease activity in different sludge from ETP at 20˚C
EMADb
Epb
LPb

179
Protease activity of all samples was greater at 37°C than at 20°C (Fig. 8.3 and 8.4). All
sludge samples showed highest activity at pH 8, although there was some variation. The
difference in protease activity at 37°C after 24 hr incubation at different pH values was
statistically significant (P<0.05). The response to pH of different sludge extracts also differed
at 20ºC and 37ºC. Early pan samples again showed the greatest protease activity but there
was little difference in activity between late pan and MAD. Raw data for the effect of pH on
protease activity of EMADb, EPb and LPb at 37ºC are presented in Appendix 6.3.2, 6.3.4
and 6.3.6 respectively.
Fig. 8.4: The effect of pH on protease activity of different sludge incubated at 37ºC for
24 hr. Error bars showed the standard deviations.
EMADb=Samples collected from mesophilic anaerobic digester at ETP, EPb= Samples
collected from early pan, LPb= Samples collected from late pan.
0
10
20
30
40
50
60
pH 4 pH 5 pH 6 pH 7 pH 8 pH 9 pH 10
PA (U
/mL)
Different pH
Effect of different pH on protease activity of different sludge from ETP at 37˚C
EMADb
Epb
LPb
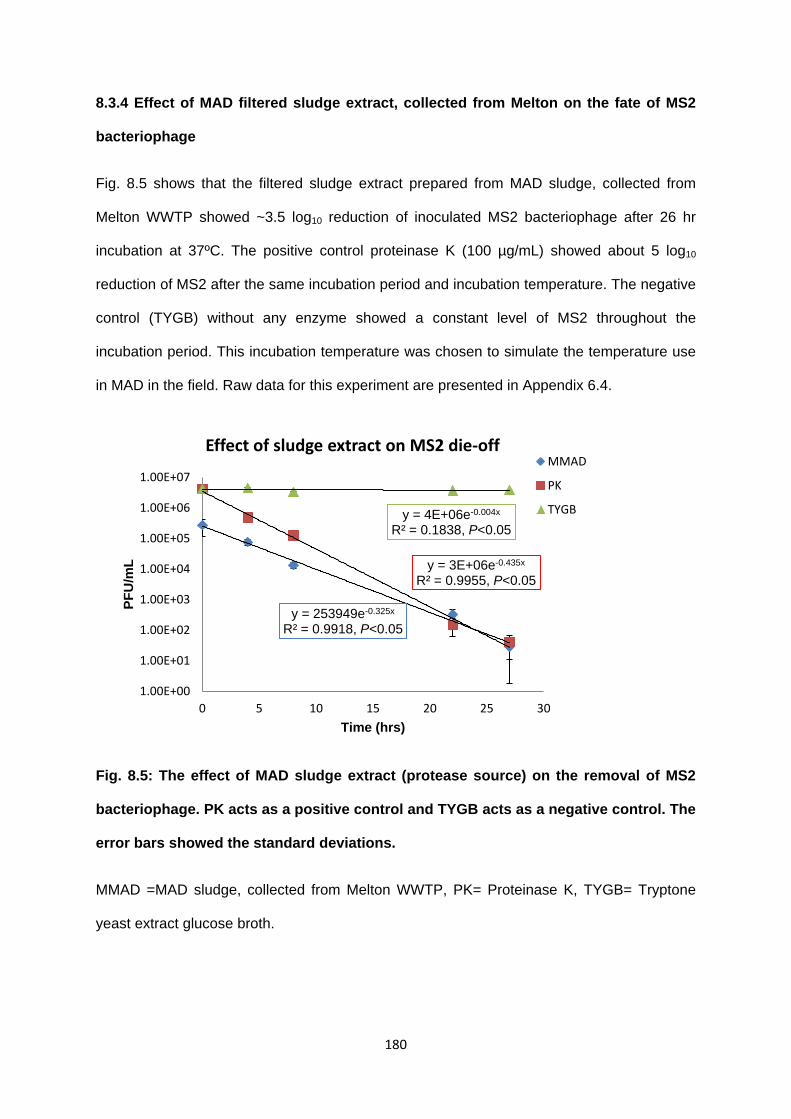
180
8.3.4 Effect of MAD filtered sludge extract, collected from Melton on the fate of MS2
bacteriophage
Fig. 8.5 shows that the filtered sludge extract prepared from MAD sludge, collected from
Melton WWTP showed ~3.5 log10 reduction of inoculated MS2 bacteriophage after 26 hr
incubation at 37ºC. The positive control proteinase K (100 µg/mL) showed about 5 log10
reduction of MS2 after the same incubation period and incubation temperature. The negative
control (TYGB) without any enzyme showed a constant level of MS2 throughout the
incubation period. This incubation temperature was chosen to simulate the temperature use
in MAD in the field. Raw data for this experiment are presented in Appendix 6.4.
Fig. 8.5: The effect of MAD sludge extract (protease source) on the removal of MS2
bacteriophage. PK acts as a positive control and TYGB acts as a negative control. The
error bars showed the standard deviations.
MMAD =MAD sludge, collected from Melton WWTP, PK= Proteinase K, TYGB= Tryptone
yeast extract glucose broth.
y = 253949e-0.325x R² = 0.9918, P<0.05
y = 3E+06e-0.435x R² = 0.9955, P<0.05
y = 4E+06e-0.004x R² = 0.1838, P<0.05
1.00E+00
1.00E+01
1.00E+02
1.00E+03
1.00E+04
1.00E+05
1.00E+06
1.00E+07
0 5 10 15 20 25 30
PFU
/mL
Time (hrs)
Effect of sludge extract on MS2 die-off MMAD
PK
TYGB

181
8.3.5 Effect of different types of filtered sludge extract collected from ETP on MS2
bacteriophage
Fig. 8.6 shows that the filtered sludge extract prepared from MAD sludge and late pan
sludge collected from ETP showed about 3 log10 reduction of inoculated MS2 bacteriophage
after 25 hr incubation, at 37ºC whereas the early pan showed about 4 log10 reduction of MS2
over the same incubation period and same incubation temperature. Raw data for this
experiment are presented in Appendix 6.5.
Fig. 8.6: The effect of different types of sludge extract (protease source) on the
removal of MS2 bacteriophage. The error bars showed the standard deviations.
EMADb=Samples collected from mesophilic anaerobic digester at ETP, EPb= Samples
collected from early pan, LPb= Samples collected from late pan.
y = 219998e-0.259x R² = 0.9844, P<0.05
y = 244310e-0.346x R² = 0.9867, P<0.05
y = 214027e-0.294x R² = 0.9886, P<0.05
1.00E+00
1.00E+01
1.00E+02
1.00E+03
1.00E+04
1.00E+05
1.00E+06
0 5 10 15 20 25 30
PFU
/mL
Time (hr)
Effect of sludge extract (ETP) on MS2 bacteriophage die-off EMADb
Epb
LPb

182
8.3.6 Comparison between decay rates of MS2 coliphage in different sludge extracts
No statistically significantly differences were observed between decay coefficients of MS2
coliphage in different sludge extracts (Fig. 8.7). Coliphage MS2 showed the highest decay
rate (-0.345) in early pan sludge and the lowest rate (-0.258) in MAD output from ETP.
Fig. 8.7: Comparison among decay coefficients of MS2 coliphage in different sludge
extracts. EMADb=Samples collected from mesophilic anaerobic digester at ETP, EPb=
Samples collected from early pan, LPb= Samples collected from late pan, MMAD
=MAD sludge, collected from Melton WWTP.
-0.45
-0.4
-0.35
-0.3
-0.25
-0.2
-0.15
-0.1
-0.05
0
EMADb Epb LPb MMAD
Dec
ay c
oeffi
cien
ts
Different sludge extract
Decay rates of MS2 coliphage in different sludge extract

183
8.4 Discussion
The results described in this chapter suggest that incubation time (Fig. 8.2), temperature and
pH (Fig. 8.3, 8.4) have the effect on protease activity of different sludge samples. The
highest protease activity in all types of sludge was observed after 96 hrs of incubation. This
was in contrast to the control (PK) which showed peak activity at 20 hr. This difference is
likely to be due to the degradation of proteases with time and the continued secretion of
proteases by indigenous bacteria in the sludge extract. Two temperatures; 20°C and 37°C,
were chosen for this experiment to simulate field conditions in drying pan and MAD sludge
respectively. The highest protease activity was observed at 37°C and pH 8.0, although the
activity was also high at 37ºC, pH 9.0 and 10.0. Protease activity in sludge reached
maximum activity at pH 8.0. This findings support those of other researchers (Lenhard,
1965; Gessesse et al., 2003; Bezawada et al., 2011).
Using centrifugation and ultrafiltration Bezawada et al. (2011) recovered an alkaline protease
from Bacillus licheniformis from fermented wastewater sludge. Maximum protease activity
occurred at pH 8-10 and temperature at 60°C. The protease activity increased between
temperatures of 30°C to 60°C after which it sharply decreased.
Lenhard (1965) found the highest protease activity in the samples from sediment of lagoons
at pH 8.6 and temperatures above 50°C. Protease activity also increased with increasing
incubation period.
In the present study, sludge collected from different stages in the treatment process and also
from different treatment plants differed in protease activity (Fig. 8.3). This finding is also
similar to that of Lenhard (1965) who found different levels of protease activity in different
types of samples; raw sewage, sediment and effluent from lagoons. The highest activity was
found in the sediment and lowest activity in the effluent. The finding of the present study of
the highest protease activity in early pan sludge and low activity in late pan sludge suggests

184
that the highest concentration of enzyme secreting microorganisms is in the early pans (Fig.
8.3 and 8.4). Differences in the amount of activity between MAD samples from different
WWTPs and different samples from ETP is difficult to explain, but could reflect input material
or treatment processes of the two plants.
The demonstration of a 3-4 log10 reduction of MS2 bacteriophage in all filtered sludge
extracts after 25 hr of incubation at 37ºC (Fig. 8.5, 8.6) suggests that protease activity
produced by indigenous microorganisms, was responsible for MS2 bacteriophage die-off.
These findings could be explained if the proteases secreted by different microorganisms
were active early in wastewater treatment processes in degrading the protein coat of
bacteriophages leading to their lysis. These findings are comparable with the findings of
Nasser et al. (2002) who determined the effect of the proteinase pronase on the inactivation
of MS2 bacteriophage, Coxsackie virus A9, Poliovirus1 and Hepatitis A viruses by incubating
for 30 min at 37°C. The results showed that Coxsackie virus A9 was sensitive to the
protease whereas there was very little effect on MS2 bacteriophage, Hepatitis A or
Poliovirus. The limitation of the work on the proteinase pronase was very short incubation
period (30 min) used which may not be long enough for the enzyme to react with the specific
site in the capsid of MS2 bacteriophage. In contrast, there was a 2 log10 reduction of MS2
bacteriophage in soil saturated with secondary effluent after incubation at 30°C within 2 days
whereas Coxsackie virus A9 was reduced by 2 log10 under the same condition within 0.3
days. The authors concluded that 2 log10 reduction of MS2 bacteriophage occurred due to
the interaction of components of microbial activity effluent and soil, and could be due to other
proteases produced by different microbial populations.
There was no statistically significant difference among the decay rates of MS2 coliphage in
different sludge extracts (Fig. 8.7), suggesting that all of the sludge extracts examined were
similar in factors that influence the decay of coliphage. Early pan sludge extracts
demonstrated the highest and MAD sludge extract from ETP showed lowest decay rate of

185
coliphage (Fig. 8.7). This corresponds to the highest and lowest protease activity observed
in EPb and EMADb respectively (Fig. 8.3, 8.4). The observation that the decay rate of
coliphage was higher in MMAD than in EMADb could be due to different bacterial
populations expressing different ranges of protease activity in samples from the two
treatment plants (Fig. 8.2, 8.4).
The results of the present study suggest that enteric viruses could also be degraded by
proteases but direct testing is needed to confirm the effect of proteases on enteric viruses.

186
CHAPTER 9
General Discussion and Conclusions

187
This study focused on the decay of bacterial and viral indicators during sewage sludge
treatment at one WWTP in Victoria, Australia (ETP). Results obtained in the field were
supported be a laboratory simulation of mesophilic anaerobic digestion (MAD), pan drying
and stockpiling. The findings from both field and laboratory investigations reported in this
thesis, together with results of a companion study (SWF Round 6, Project No. 611-001,
2009-2011 and SWF Round 4, 2007-2008, unpublished) that investigated the decay of
adenovirus, Salmonella spp. and parasites, suggested that microbiologically safe biosolids,
suitable for land application can be produced by MAD and pan drying as primary and
secondary treatment stages for sewage sludge. This study also examined different factors
affecting bacterial and viral indicator die off during pan drying and stockpiling. These data
add to an understanding of the mechanisms of microbial decay during sewage sludge
treatment and will aid managers of wastewater treatment plants to produce microbiologically
safe biosolids with greater efficiency.
The data from the field study described in Chapter 4 showed ~4 log10 reduction (~106-102
CFU/g DS) of E. coli after about 8 months of summer drying in Pan 41 and 11 months of
drying in Pan 23. A ~3 log10 reduction of E. coli was observed after 6 months of summer
drying in Pan 41 and 8 months of drying in Pan 23 (Fig. 4.3). According to the EPA Victorian
guidelines, biosolids must contain <100 CFU/g and <1000 CFU/g of E. coli to achieve T1
(unrestricted use) and T2 (restrictions applied) Grade of biosolids, respectively (EPA
Victoria, 2004). The field study showed that levels of E. coli consistent with T1 Grade
(equivalent to P1 Grade according to national guidelines in Australia and Class A biosolids in
US EPA) were achieved after 8 to 11 months of drying. Levels of E. coli consistent with T2
Grade (equivalent to P2 Grade of biosolids according to national guidelines in Australia)
were achieved after 6 to 8 months of drying (Fig. 4.3). The starting material was MAD output
which contained ~106 CFU/g of E. coli, which is equivalent to T3 Grade in Victoria and Class
B biosolids in USA (USEPA, 1993). Although numbers of E. coli consistent with T1 Grade
biosolids were achieved within 11 months of pan drying (without a three year period in

188
stockpiles), further testing for enteric viruses, Salmonella spp. and Ascaris eggs would be
required for approval as a T1 Grade material for land application. This is because the
Victorian guidelines also require levels of Salmonella spp., enteric viruses and Ascaris eggs
to reach specified levels in the case of alternative processes (eg: pan drying) before they
can be certified as T1 Grade biosolids (EPA Victoria, 2004). The results reported here,
together with those of SWF Round 6, Project No. 611-001, Final Report, 2009-2011 on other
indicators and pathogens, suggest that biosolids produced from ETP meet T1 requirements
and is microbiologically safe for public health and could therefore be used for agricultural
application.
There is only one report in the literature on microbial die-off during air drying in uncovered
pans (Rouch et al., 2011b), but other workers have reported on microbial decay rates in
covered solar beds, following anaerobic digestion and mechanical dewatering. Shanahan et
al. (2010) failed to achieve stabilization Grade A biosolids according to EPA NSW guidelines
(equivalent to P1 Grade in Australia and Class A biosolids in USA) through a solar sludge
drying process following anaerobic digestion of the thickened primary and secondary sludge
and centrifuge dewatering at Maroochydore sewage treatment plant (STP) in Brisbane,
Queensland. The solar drying process consisted of two parallel sludge drying beds covered
with a plastic film roof and plastic sheet walls which did not block the solar radiation. Both
beds contained sludge turning mechanisms which increased the sludge drying rate. Levels
of E. coli, Salmonella spp., enteric viruses and eggs of Ascaris spp., consistent with P1
Grade of biosolids were achieved at the end of drying after 18 days but the level of faecal
coliforms did not meet the criteria for Grade A biosolids. It was concluded that as the short
wavelength UV light cannot pass through the plastic film roof of the solar dryer, faecal
coliforms seemed to be the most sensitive microorganisms to sunlight compared with the
other microorganisms (Shanahan et al., 2010); however sunlight exposure is unlikely to be a
major decay factor for sludge as penetration is limited. Moreover, It is likely that numbers of

189
Ascaris spp. and Salmonella spp. met the standards because they were present at low
levels initially.
Mallack Muhammad et al. (2007) failed to achieve Class A biosolids through sludge sand
drying. This is most likely because of the low retention period of only 14 days. High
concentrations of faecal coliforms (105 to 106 MPN/g) and Salmonella spp. (22 MPN/g DS)
were recorded after 14 days of treatment in a sand drying bed. These levels were consistent
with Class B biosolids (Mallack Muhammad et al., 2007).
Although Class A biosolids can be achieved through lime treatment and heat treatment
(Gantzer et al., 2001), the process of air drying is cost effective from the industrial point of
view, provided space is available. In the context of Victoria, it is cost effective because of the
large amount of land available to WWTPs. Stockpiles also occupy large areas of land for a
long period of time, however, the results of this study suggested that biosolids produced by
pan drying could reach E. coli levels consistent with T1 Grade without the need for
stockpiling.
Other than air-drying, Class A biosolids can also be produced by low cost, low technology
processes, such as lagoon storage and cake storage (Farrell et al., 2004). In the city of
Chicago, Tata et al., 2000 took sludge samples from four stages of solid processing trains at
the Stickney and Calumet Water Reclamation Plants of the Metropolitan Water Reclamation
District of Greater Chicago, Illinois (District) and statistical analysis was developed to
analyse the results of enteric virus and viable Helminth egg densities. The results showed
that Class A biosolids can be achieved through solid processing trains in the District of
Greater Chicago (Tata et al., 2000). In another situation and much more recently, the
Wenatchee Wastewater Treatment Plant, Washington, USA utilizes a relatively simply
approach to achieve a Class A biosolids. Annually, the city produces about 600 dry tons of
biosolids. Their approach, which was recently demonstrated to the USEPA’s satisfaction,

190
does not involve any specialized equipment or chemical addition. Anaerobically-digested
and dewatered biosolids in the range of 10 to 20% total solids are spread on asphalt beds
and turned weekly for 35 days. During this time, the biosolids are exposed to an average
temperature of 20ºC, low humidity, sunlight and wind. At the end of the process, the total
solids are typically greater than 90% and pathogens are well below acceptable Class A
concentrations (Frazier et al., 2012).
Although there is no mention in the Victorian guidelines to use Enterococcus spp. and
coliphage as indicators, they were used in this study as possible alternative indicators for
bacterial pathogens, e.g. Salmonella spp. and enteric viruses respectively. These indicators
were used because it was not possible to demonstrate the required log reduction for
Salmonella spp. according to the Victorian guidelines in the field, due to the normally small
numbers present in sludge. One advantage of coliphage enumeration is that the methods
are simple and less time consuming compared to enteric viruses. Enterococcus spp. was
used as an alternative indicator to E. coli for Salmonella spp.
The number of Enterococcus spp. decreased by 2.7 log10 after about 11 months of full year
drying and 3.3 log10 after about 8 months of summer drying (Fig. 4.4). Gantzer et al. (2001)
achieved about 2.5 log10 of Enterococcus spp. through aerobic thermophilic digestion, about
4 log10 reduction by heat treatment at 108°C and 5-6 log10 reduction by lime treatment,
whereas only 1 log10 reduction was achieved through composting. After MAD, the number of
Enterococcus spp. was about 106 CFU/g which was similar to the findings of the present
study. As there is no treatment grade available in the Victorian guidelines or internationally
for Enterococcus spp., the log10 reductions that were achieved cannot be compared with the
guidelines.
A 2.2 log10 reduction of coliphage numbers was achieved after 8 months of summer drying
and 2.7 log10 reduction was achieved after 11 months of drying (Fig. 4.5). The data from the
present study of E. coli, Enterococcus spp. and coliphage showed that air drying pan

191
treatment is capable of removing these potential indicators after 8-11 months of pan drying.
Assuming that E. coli, Enterococcus spp. and coliphage are suitable indicators of the
presence of bacterial and viral pathogens, the data presented in this thesis together with
(SWF Round 6, Project No. 611-001, Final Report, 2009-2011) using adenovirus and
parasites suggests that biosolids produced are microbiologically safe after drying for 8 to 11
months of summer/ full year drying.
There were no significant differences between the decay coefficients of E. coli and
Enterococcus spp. over summer pan drying and full year pan drying, However, coliphage
decay was significantly higher in the summer pan (Fig. 4.6) compared to full year pan. One
possible explanation for this finding could be greater activity of bacterial proteases during the
warmer period. These results contrast with the findings of Lucena et al. (2004) which
showed consistently greater persistence of different indicators in the winter season in a
lagoon system compared to the summer period. Thus, higher decay rates of faecal coliforms
were found in the summer season compared with the winter season, somatic coliphage
showed slightly higher decay rate in winter, but Enterococcus spp. and phage infecting B.
fragilis did not show any significant differences over two different seasons. These results
suggest that factors other than season, e.g. different treatment processes affect the
behaviour of indicators. Lucena et al. (2004) therefore suggested that the different indicators
would be more suitable depending on treatment process conditions and also for different
seasons, however this suggestion would not be practical for WWTP operation. One possible
reason why the findings in this thesis are different from those of Lucena et al. (2004) is that
the latter investigated the decay of microorganisms in a lagoon system of wastewater which
is environmentally different from sludge drying in pans.
In a previous study performed by Rouch et al. (2009), slightly higher log reductions of both
E. coli (5 log10) and coliphage (3 log10) were achieved in a full year pan (Pan 33) after 11
months of drying compared with Pan 23, full year pan in 2009-2010, but the differences in

192
the decay rates of E. coli and coliphage in two different pans were not statistically significant.
The data presented in this thesis indicate the consistent decay of different indicator
organisms for different batches of sludge at different times and seasons. These provide
confidence in the overall effectiveness and consistency of pan-drying at the removal of
enteric microorganisms.
The aim of the next part of the project was to validate a laboratory scale MAD process using
physical and biological parameters as a simulation of MAD in the field. The raw feed sludge
collected from Melton WWTP contained ~106 CFU/g of E. coli and after MAD treatment the
number was reduced to ~104 CFU/g after 15 days of retention period. The sludge obtained
from Melton WWTP showed lower numbers of E. coli compared with sludge from ETP,
presumably due to the different source of feed sludge. Feed sludge from Melton WWTP
contained about 7×10³ PFU/g DS of coliphage which was reduced to 2×10² PFU/g DS after
simulated MAD treatment; a log reduction of about 0.5 log10. The log reduction values are
lower than those reported in other field studies and laboratory simulations. For example, in a
field study, Mandilara et al. (2010) found 0.98 to 2 log10 reduction of coliphage during MAD
at 28 days retention period which is greater than the findings of the present study. The
difference in log reduction could be due to the lower retention period used in the present
study. Mandilara et al. (2010) also reported a lower log reduction of somatic coliphage than
E. coli (about 2 to 2.3 log10). About 1.5 to 1.7 log10 reduction of E. coli was achieved by
Horan et al. (2004) after 12 days retention time of laboratory simulation of MAD. Han et al.
(1997) and Rubio-Loza and Noyola (2010) achieved 1 log10 reduction of faecal coliforms
after 10 to 11 days retention time of laboratory simulation of MAD. The assessment of log
reductions from published sources with the data presented here suggest retention time
during MAD has a significant influence on decay, but overall, decay rates achieved by MAD
are modest with maximum values of approximately 2 log10. Nevertherless, together, these
findings demonstrate that T3 Grade (<2,000,000 E. coli MPN/g DS) or Class B (<2,000,000
faecal coliforms MPN/g DS) biosolids can be achieved through MAD which is consistent with

193
the field study investigation reported in Chapter 4. This result is consistent with the a field
study by Mandilara et al. (2010) which showed biosolids treatment by MAD at 35°C for 28
days achieved Class B microbiological status.
In the laboratory simulation of MAD by Horan et al. (2004) reported, pH ranged from 6.8 to
7.8, and there was 3.3% DS reduction and 15-20% VS reduction were achieved during 21
days of retention time. These values are greater than those of the present study. This
difference may be due to the lower retention period or lack of proper mixing during MAD
simulation in the present study. Compared with the results of log reduction of E. coli and
coliphage, taken together with other physical parameters found in other studies (both field
and laboratory simulation of MAD), it is concluded that the data presented in this study
validated the MAD simulation in laboratory although lower methane production, DS and VS
reduction occurred probably due to lack of proper mixing or leaking during simulation.
Ideally, the technical issues would have been resolved and the work repeated but this was
not possible as the focus was directed towards indicator decay in pan drying and stockpiling
by the industrial steering group in this instance.
.
The laboratory simulation of pan drying and stockpiling was designed to follow the decay of
potential indicators and pathogens present in only low numbers in sludge. The data on the
decay of coliphage in the field presented in this project was used to validate the laboratory
simulation. In addition, since indigenous coliphage was present in low numbers in MAD
output, bacteriophage kinetics were determined by seeding samples with other phages; MS2
bacteriophage and P22 bacteriophage.
The data on somatic coliphage, obtained from laboratory simulation of pan drying showed a
faster decay rate in the first simulation than the second and third simulations (Fig. 6.9). This
may be explained by the reduction of exposure to air flow and heating system used in the

194
last two simulations to extend the drying period to simulate the drying conditions in the field
rather than a ‘worst case’ drying process represented in the first simulation. Very fast decay
of MS2 and P22, compared with somatic coliphage in the three simulations may be due to
the physical nature of the different bacteriophages in sludge and their interaction with
specific hosts. Another possible reason is that MS2 is more sensitive to some of the
proteases present in biosolids than other coliphages. The decay rate of somatic coliphage in
field pans, 23 and 41 were similar to the second and third runs of the laboratory simulation
experiments, but, as may be expected, the rates of decay in the field were signficantly
different and slower than for the first run of the laboratory simulation experiment. This
difference is probably due to more rapid drying conditions established during first laboratory
simulation. These data therefore also provided a validation for the laboratory simulated pan-
drying technique.
The findings of the bacterial and viral indicator die-off in the field study and laboratory
simulation of MAD, pan drying and stockpiling led to an investigation of factors affecting
pathogen die-off during these process steps. The results suggested that the presence of
indigenous flora and nutrient deprivation were important factors affecting bacterial (E. coli
and Enterococcus spp.) die-off when material had a low DS content (3-4%). High salt
concentration associated with dryness of sludge, also appeared to contribute to bacterial die-
off as drying continued.
Salmonella Birkenhead failed to grow in untreated MAD sludge at 37ºC (Fig. 7.2, 7.5).
Growth of S. Birkenhead was restored by autoclaving, gamma irradiation or provision of
additional nutrients (Fig. 7.2, 7.5) in MAD sludge at 37ºC. The ability to grow in sterilized
sludge may be due to the release of available nutrients from the dead cells during
autoclaving and also due to the elimination of competeting microorganisms. Conversely,
failure to grow in non-autoclaved MAD could be due to nutrient depletion following
consumption by indigenous flora, since supplementation of non-autoclaved MAD nutrient

195
broth, allowed the growth to occur possibly due to removal of microbial competetion (Fig.
7.5). These observations are similar to the findings of Chen et al. (2011) who observed more
growth of faecal coliforms in both liquid and dewatered non-sterile biosolids samples
supplemented with substrate than in non-sterile liquid and dewatered biosolids after 24 hr
incubation at 35°C. Taken together, these findings suggested that lack of growth of bacteria
in nonsterilized sludge was due to the substrate limitation linked to competition among
different types of indigenous flora. Assuming some protozoan cysts survived in MAD
process, predation may also contribute to bacterial die-off.
Salmonella Birkenhead failed to grow in untreated early pan (EP), middle pan (MP) and late
pan (LP) sludge at 20ºC (Fig. 7.3, 7.4). Failure to grow is likely to be due to competition with
indigenous bacteria and predation by protozoa (liquid material) and increasing dryness and
salinity with drying since growth occurred in sterilized pan samples. Growth was restored in
gamma irradiated (2 log10 increase) and in autoclaved MP (2 log10 increase) and LP (1 log10
increase) after 48 hr incubation, but not in EP sludge (Fig. 7.4). This may be due to the
release of more nutrients after gamma irradiation than autoclaving or some destruction of
available nutrients occurred by autoclaving especially in the EP sample. Lack of growth in
EP sludge may be explained by the chemical environment, which may be more aggressive
to survival than later pan samples owing to high NH3 and VFA contents which have
antimicrobial properties. This is most likely that factors affecting removal of seeded S.
Birkenhead will be the same as for any Salmonella spp. naturally present in untreated
sludge; however the removal may also depend on the initial concentration of Salmonella
spp. in raw sewage sludge and on differences in survival between strains.
The differences in growth patterns of untreated and sterilized sludge observed here are
similar to those of Fernandez et al. (1992); Sidhu et al. (2001); Yeager and Ward (1981).
Fernandez et al. (1992) found no growth of faecal coliforms in non-sterilized wastewater
collected from waste stabilization ponds. Sidhu et al., 2001 found about a 5 log10 increase in

196
the growth of seeded S. Typhimurium in sterilized composted biosolids after 30 hr of
incubation at 37°C whereas, only limited growth was observed in non-sterilized biosolids.
Yeager and Ward (1981) also found strong growth (about 4.5 log10 increase) of seeded S.
Typhimurium in sterilized liquid and dewatered sludge after 2 days of incubation at 37°C
whereas in non-sterilized biosolids the growth was much less. Although these studies
examined growth patterns in different materials, they all showed that indigenous flora
inhibited growth of introduced bacteria. The results of these studies together with the
findings of the present study suggested that negligible or no growth of seeded or nonseeded
bacteria in non-sterilized biosolids were due to the presence of indigenous flora and the
limited availability of growth substrates since competition and nutrient availability are
intrinsically linked of course. Differences in the growth of Salmonella spp. in sterilized
composted, MAD and pan sludge are probably related to the substrate availability in these
types of biosolids samples. Another possibility to explain the differences observed in the
growth of the microorganisms could be the activity of indigenous flora (eg, predation,
production of antimicrobial compounds). These findings taken together demonstrate that
microbial competition and nutrient depletion in different types of sludge affect the die-off of
pathogens in sludge.
To investigate the reason behind rapid reduction of coliphage in both field and laboratory
simulation, protease activity in MAD and pan sludge was investigated and the effect of the
sludge extract, as a source of protease, on the inactivation of MS2 coliphage was observed.
All types of sludge (MAD, EP, and LP) revealed protease activity. The amount of activity was
dependent mainly on incubation period, temperature and pH; the greatest activity was
measured at pH 8.0 (Fig. 8.2, 8.3, 8.4). Increased protease activity in sludge over the
incubation period could be due to the continuous secretion of proteases by the indigenous
bacteria.

197
A 3-4 log10 reduction of MS2 coliphage in filtered sludge extracts (MAD and drying pan) after
25 hr of incubation at 37°C (Fig. 8.5, 8.6) suggested that proteases and possibly other
enzymes produced by indigenous flora could be responsible for this decay. A great variety of
microorganisms present in sludge are likely to produce a variety of proteases and other
enzymes. These enzymes could be responsible for the decay of MS2 coliphage in the
sludge, due to cleavage of specific sites in the capsid protein coat of MS2 coliphage. This
result, along with of other studies, suggested that proteases produced by different types of
microorganisms in sludge could also be responsible for the inactivation of enteric viruses,
although the inactivation rate may vary for different types of enteric viruses and also with the
types of proteases (Nasser et al., 2002; Cliver and Hermann, 1972).
In conclusion, the major findings and impacts of this research are that T1 Grade biosolids
with respect to E. coli removal can be achieved after 8 to 11 months of pan-drying treatment
in Victoria. Biosolids reach levels of E. coli consistent with T1 Grade after MAD and pan
drying without a further storage requirement. Other impacts of this research are, therefore, to
reduce the costs of maintaining stockpiles, release land for other purposes, reduce the need
for chemical fertilizers and expand recycling of a valuable resource.
Decay patterns of Enterococcus spp. and coliphage suggested that they could provide
alternative bacterial and enteric virus indicators in air drying treatment, respectively.
However the decay profiles of Enterococcus spp. were similar to E coli. It could therefore be
an alternative to E coli, but it is not an improved replacement indicator to E coli. However,
more work comparing decay of coliphage with decay of adenovirus (the most resistant of the
enteric viruses) is needed.
The decay of coliphages and also enteric viruses in sludge was correlated with protease
activity in sludge although more research is needed to investigate the effect of protease on
enteric viruses. Other factors responsible for the decay of bacterial indicators are microbial
competition, predation and nutrient deprivation. A high DS content together with high salt

198
concentration may be responsible for bacterial inactivation in late drying pans. These results
suggest an understanding of the process conditions that maximize enzyme yields by
indigenous flora in sludge would be valuable.
Future work should investigate the pathogen and indicator die-off in biosolids collected from
other metropolitan and rural treatment plants in Victoria to expand the beneficial use of
Victorian biosolids for land application. It is also necessary to investigate the assessment of
sludge treatment management to maximize enzyme production and virus inactivation by the
indigenous flora. Other possible future work could be to investigate the effect of protozoa on
bacterial pathogens in laboratory culture to better understand the mechanisms of predation
which operate in sludge treatment environments. It is also important to extend the use of the
pan-drying laboratory simulation technique, for example to assess the impact of the chemical
environment in sludge, particularly during the early stages of drying, on enteric organism
decay.

199
References

200
ACMSF (Advisory Committee on the Microbiological Safety of Food). 2002. Food
standards agency position on the recycling of sewage aludge to agricultural land.
ADAS (Agricultural Development and Advisory Service). 2001. Guidelines for the
application of sewage sludge to agricultural land.
Albert, M. J., V. O. Rotimi, R. Dhar, S. Silpikurian, A. S. Pacsa, A. M. Molla, and G.
Szucs. 2009. Diarrhoegenic Escherichia coli are not a significant cause of diarrhoea
in hospitalised children in Kuwait. BMC Microbiology 9 (62).
Alcalde, L., G. Oron, L. Gillerman, M. Salgot, and Y. Manor. 2003. Removal of fecal
coliforms, somatic coliphages and F-specific bacteriophages in a stabilization pond
and reservoir system in arid regions. Water Science and Technology 3 (4): 177-184.
Amahmid, O., S. Asmama, and K. Bouhoum. 2002. Urban wastewater treatment in
stabilization ponds: occurrence and removal of pathogens. Urban Water 4: 255-262.
Appels, L., J. Baeyens, J. Degrève, and R. Dewil. 2008. Principles and potential of the
anaerobic digestion of waste-activated sludge. Progress in Energy and Combustion
Science 34: 755-781.
Arimi, S. M., C. R. Fricker, and R. W. A. Park. 1988. Occurrence of ‘thermophilic’
Campylobacters in sewage and their removal by treatment processes. Epidemiology
and Infection 101: 279-286.
Ashbolt, N. J., A. Ball, M. Dorsch, C. Turner, P. Cox, A. Chapman, and S. M. Kirov.
1995. The identification and human health significance of environmental
Aeromonads. Water Science and Technology 31: 263-269.

201
Bastian, R. K. 1997. The biosolids (sludge) treatment, beneficial use and disposal situation
in the USA. European Water Pollution Control 7 (2): 62-79.
Benedict, A. H., E. Epstein, and J. Alpert, 1988. Composting Municipal sludge: A
Technology Evaluation. Noyes Data Corporation, Park Ridge, New Jersey.
Bezawada, J., S. Yan, R.P. John, R. D. Tyagi, and R. Y. Surampalli. 2011. Recovery of
Bacillus Licheniformis alkaline protease from supernatant of fermented wastewater
sludge using ultrafiltration and its characterization. Biotechnology Research
International doi:,10.4061/2011/238549, 1-11.
Brennhovd, O., G. Kapperud, and G. Langeland. 1992. Survey of thermotolerant
Campylobacter spp. and Yersinia spp. In three surface water sources in Norway.
International Journal of Food Microbiology 15: 327-338.
Bitton, G. 2011a. Part B - Public health microbiology, p. 119-217, Wastewater Microbiology
(Fourth Edition). John Wiley & Sons, Inc., Hoboken, Newjersey.
Bitton, G. 2011b. Part C - Microbiology of wastewater treatment, p. 267-437, Wastewater
Microbiology (Fourth Edition). John Wiley & Sons, Inc., Hoboken, Newjersey.
Caccio, S. M., M. De Giacomo, F. A. Aulicino, and E. Pozio. 2003. Giardia cysts in
wastewater treatment plants in Italy. Applied Environmental Microbiology 69: 3393-
3398.
Carey, C. M., H. Lee, J. T. Trevers. 2004. Biology, persistence and detection of
Cryptosporidium parvum and Cryptosporidium hominis oocyst. Water Research 38:
818-862.

202
Carmena, D., X. Aguinagalde, C. Zigorraga, J. C. Fernandez-Crespo, and J. A. Ocio.
2006. Presence of Giardia cysts and Cryptosporidium oocysts in drinking water
supplies in Spain. Journal of Applied Microbiology 102 (2007): 619-629.
Carrington, E. G. 2001. Evaluation of sludge treatments for pathogen reduction-final report.
Study contact no B4-3040/2001/322179/MAR/A2 for the European Commission
Directorate-General Environment.
CDC (Centers for Disease Control and Prevention). 2011.Trends in foodborne illness,
1996-2010.
Cekmecelioglu, D., A. Demirci, R. E. Graves, N. H. Davitt. 2005. Optimization of windrow
food waste composting to inactivate pathogenic microorganisms. American Society
of Agricultural and Biological Engineers 48 (5): 2023-2032.
Chalapati Rao V., S. B. Lakhe, and S. V. Waghmare. 1981. Virus removal in waste
stabilization ponds in India. Water Research 15: 773-778.
Chabaud, S., Y. Andres, A. Lakel, and P. Le Cloirec. 2006. Bacteria removal in septic
effluent: Influence of biofilm and protozoa. Water Research 40: 3109-3114.
Chen, Y., B. Fu, Y. Wang, Q. Jiang, and H. Liu. 2012. Reactor performance and bacterial
pathogen removal in response to sludge retention time in a mesophilic anaerobic
digester treating sewage sludge. Bioresource Technology 106: 20-26.
Chen, Y. C., M. J. Higgins, S. M. Beightol, S. N. Murthy, and W. E. Toffey. 2011.
Anaerobically digested biosolids odor generation and pathogen indicator regrowth
after dewatering. Water Research 45: 2616-2626.

203
Clark, C. G., L. Price, R. Ahmed, D. L. Woodward, P. L. Melito, F. D. Rodgers, F.
Jamieson, B. Ciebin, A. Li and A. Ellis. 2003. Characterization of waterborne
outbreak -associated Campylobacter jejuni, Walkerton, Ontario. Emerging Infectious
Diseases 9 (10): 1232-1241.
Cliver, D. O., and J. E. Hermann. 1972. Proteolytic and microbial inactivation of
enteroviruses. Water Research 6: 797-805.
Costán-Longares, A., M. Montemayor, A. Payán, J. Méndez, J. Jofre, R. Mujeriego, and
F. Lucena. 2008. Microbial indicators and pathogens: Removal, relationships and
predictive capabilities in water reclamation facilities. Water Research 42: 4439-4448.
Curds, C. R. 1973. The role of protozoa in the activated sludge process. American Zoologist
13: 161-169.
Curds, C. R., and G. J. Fey. 1969. The effect of ciliated protozoa on the fate of Escherichia
coli in the activated-sludge process. Water Research 3: 853-867.\
Curtis T. P., D. D. Mara, and S. A. Silva. 1992. Infuence of pH, oxygen, and humic
substances on ability of sunlight to damage faecal coliforms in waste stabilization
pond water. Applied Environmental Microbiology 58 (4): 1335-1343.
DEFRA. 2010. Fertilizer manual (RB 209), 8th edition. TSO Ireland. www.defra.gov.uk.
Department of Environmental Protection, Water and River Commission, Department of
Health. 2002. Western Australian guidelines for direct land application of biosolids
and biosolids products.

204
Department of Health and Ageing. 2012. National notifiable diseases surveillance system.
Number of notifications for all diseases, ACT, 1991 to 2011 and year-to-date
notifications for 2012.
Department of Primary Industry, Water and Environment. 1999. Tasmanian biosolids
reuse guidelines.
Dongdem, J. T., I. Soyiri, and A. Ocloo. 2009. Public health significance of viral
contamiation of drinking water. African Journal of Microbiology Research 3(12):
856-861.
Donnison, A. M., and C. M. Ross. 1995. Somatic and F-specific coliphages in New Zealand
waste treatment lagoons. Water Research 29: 1105-1110.
Drift, C. V. D., E. V. Seggelen, C. Stumm, W. Hol, and J. Tuinte. 1977. Removal of
Escherichia coli in wastewater by activated sludge. Applied and Environmental
Microbiology 34 (3): 315-319.
Dueholm, T.E., K.H. Andreasen, and P. H. Nielsen. 2000. Conceptual model for the
transformation of long chain fatty acids and triglyceride in activated sludge. Water
Science Technology 43: 165-172.
Dumontet, S., H. Dinel, and S. B. Baloda. 1999. Pathogen reduction in sewage sludge by
composting and other biological treatments: a review. Biological Agriculture and
Horticulture 16: 409-430

205
Eamens, G.J., A.M. Waldron, and P.J. Nicholls. 2006. Survival of pathogenic and indicator
bacteria in biosolids applied to agricultural land. Australian Journal of Soil Research
44: 647–659.
Eckenfelder, W.W., and C. J. Santhanam. 1981a. Chapter 7- Anaerobic digestion, p: 211-
278, Sludge treatment. Marcel Dekker Inc., New York.
Eckenfelder, W.W., and C. J. Santhanam. 1981b. Chapter 6- Dewatering of sludges, p:
139-209, Sludge treatment. Marcel Dekker Inc., New York.
Edberg, S.C., E.W. Rice, R.J. Karlin, and M.J. Allen. 2000. Escherichia coli: the best
biological drinking water indicator for public health protection. Journal of Applied
Microbiology - Symposium Supplement. 88: 106S–116S.
Elsawy, K. M., L. S. D. Caves, ad R. Twarock. 2010. The impact of viral RNA on the
association rates of capsid protein assembly: bacteriophage MS2 as a case study.
Journal of Molecular Biology 400: 935-947.
Environment Agency UK. 2003. Part 3 – Methods for the isolation and enumeration of
Escherichia coli including verocytotoxigenic Escherichia coli Method A. The
Microbiology of Sewage Sludge. Environment Agency (ed.)
Environment Agency UK. 2009. Part 4 – Methods for the isolation and enumeration of
coliform bacteria and Escherichia coli (including E. coli 0157:H7), Method B. The
Microbiology of Drinking Water. Environment Agency (ed.)
Environment Agency, UK. 2010. Part 5 -The isolation and enumeration of enterococci by
membrane filtration. The Microbiology of Drinking Water - Environment Agency (ed.)

206
EPA, DH, PIRSA, CSIRO, SA Water and United Water. 2009. South Australian biosolids
guidelines for the safe handling and reuse of biosolids.
EPA Victoria 2004. Guidelines for environmental management Biosolids: land application.
Epstein, E. 2003. Chapter 7- Pathogens in wastewater and biosolids, p. 103-122, Land
Application of Sewage Sludge and Biosolids. Lewis Publishers, USA.
Espigares, E., A. Bueno, M. Espigares, and R. Gálvez. 2006. Isolation of Salmonella
serotypes in wastewater and effluent: Effect of treatment and potential risk.
International Journal of Hygiene and Environmental Health 209: 103-107.
Farrell, J., D.T. Merrill, and P. L. Shafer. 2004. Producing Class A Biosolids With Low-
Cost, Low-Technology Treatment Processes. WERF 95-REM-2, Alexandria, Virginia.
FDA. 2011. Bad Bug Book 1st Edition: Foodborne Pathogenic Microorganisms and Natural
Toxins Handbook . U.S. Department of Health and Human Services.
Feng, Y. Y., S. L. Ong, J. Y. Hu, X. L. Tan, and W. J. Ng. 2003. Effects of pH and
temperature on the survival of coliphage MS2 and Qβ. Journal of Industrial
Microbiology and Biotechnology 30: 549-552.
Fernandez A., C. Tejedor, and A. Chordi. 1992. Influence of pH on the elimination of
faecal coliform bacteria in waste stabilization ponds. Water, Air, and Soil Pollution 63:
317-320.
Finlay, B. J., and T. Fenchel. 1991. An anaerobic protozoan with symbiotic methanogens,
living in municipal landfill material. FEMS Microbiology Ecology 85: 169-180.

207
Fisher, K., and C. Philips. 2009. The ecology, epidemiology and virulence of Enterococcus.
Journal of Microbiology. 155: 1749-1757.
Forster-Carneiro, T., V. Riau, and M. Pérez. 2010. Mesophilic anaerobic digestion of
sewage sludge to obtain class B biosolids: Microbiological methods development.
Biomass and Bioenergy 34: 1805-1812.
Frazier, D., J. Shaw, P. Moser, City of Wenatchee, WA, K. Sattler, Anatek Labs, R.
Danielson, BioVir Laboratories, Inc. 2012. Demonstration of a Process to Further
Reduce Pathogens in biosolids: Wenatchee Biosolids Treatment Method. WEF
Residuals and Biosolids Conference, Raleigh, NC.
Funderburg, S. W., and C. A. Sorber. 1985. Coliphages as indicators of enteric viruses in
activated sludge. Water Research 19: 547-555.
Gaddad, S. M., and S. S. Rodgi. 1987. The effect of temperature on the growth and
biochemical activities of Escherichia coli in sewage. Environmental Pollution 43: 313-
321.
Gantzer, C., P. Gaspard, L. Galvez, A. Huyard, N. Dumouthier, and J. Schwartzbrod.
2001. Monitoring of bacterial and parasitological contamination during various
treatment of sludge. Water Research 35: 3763-3770.
Gavala, H. N., U. Yenal, I. V. Skiadas, P. Westermann, and B.K. Ahring. 2003.
Mesophilic and thermophilic anaerobic digestion of primary and secondary sludge.
Effect of pre-treatment at elevated temperature. Water Research. 37: 4561-4572.

208
George, I., P. Crop, and P. Servais. 2002. Fecal coliform removal in wastewater treatment
plants studied by plate counts and enzymatic methods. Water Research 36: 2607-
2617.
Gerardi, M. H. 2003a. Part I- Overview, p. 1-51, The Microbiology of Anaerobic Digesters,
John wiley and Sons, Inc., New York.
Gerardi, M. H. 2003b. Part II- Substrates, products and biogas, p. 59-73, The Microbiology
of Anaerobic Digesters. John Wiley and Sons, Inc., New York.
Gerardi, M. H., and M. C. Zimmerman. 2005a. Part II- Viruses, bacteria and fungi, p. 21-69,
Wastewater Pathogens. Wastewater Microbiology Series. John Wiley and Sons, Inc.,
New Jersey.
Gerardi, M. H., and M. C. Zimmerman. 2005b. Part III- Protozoans and helminths, p. 73-85,
Wastewater Pathogens. Wastewater Microbiology Series. John Wiley and Sons, Inc.,
New Jersey.
Gerardi, M. H., and M. C. Zimmerman. 2005c. Part VI- Diseases transmission and the
body's defenses, p. 123-129, Wastewater Pathogens. Wastewater Microbiology
Series. John Wiley and Sons, Inc., New Jersey.
Gerardi, M. H., and M. C. Zimmerman. 2005d. Part VII- Removal, inactivation, and
destruction of pathogens, p. 135-145, Wastewater Pathogens. Wastewater
Microbiology Series. John Wiley and Sons, Inc., New Jersey.
Gerardi, M. H. 2006a. Part I- Bacteria and their environment, p. 3-49, Wastewater Bacteria.
John Wiley and Sons, Inc., New Jersey.

209
Gerardi, M. H. 2006b. Part V- Fermentation and methane production, p. 153-161,
Wastewater Bacteria. John Wiley and Sons, Inc., New Jersey.
Gessesse, A., T. Dueholm, S. B. Petersen, and P. H. Nielsen. 2003. Lipase and protease
extraction from activated sludge. Water Research 37: 3652-3657.
Gibbs, R., C. J. Hu, G.E. Ho, I. Unkovivich, and P. Phillips. 1995. Pathogen die-off in
stored wastewater sludge. Water Science and Technology 31: 91-95.
Gibbs, R. A., C. J. Hu, G. E. Ho, and I. Unkovich. 1997. Regrowth of faecal coliforms and
Salmonellae in stored biosolids and soil amended with biosolids. Water Science and
Technology 35: 269-275.
Glass, R. I., and J. S. Bresee. 2011. Chapter 63 - Astroviruses, enteric Adenoviruses, and
other gastroenteritis viral infections, p. 416-419, Tropical Infectious Diseases:
Principles, Pathogens and Practice (Third Edition). W.B. Saunders, Edinburgh.
Godfree, A., and J. Farrell. 2005. Processes for managing pathogens. Journal of
Environmental Quality 34 (1): 105-13.
Grabow, W.O.K. 2001. Bacteriophages: update on application as models for viruses in
water. Water South Africa 27 (2): 251–268.
Grant, E. J., and S. R. Smith. 2010. Estimating pathogen risks and concentrations in
sewage sludge from disease incidence data in Australia and Mexico. Department of
Civil and Environmental Engineering, Imperial College London.

210
Gray, N. F. 2010. Chapter 12- Pathogens and their removal, p. 360-400, Water Technology
(Third Edition). Butterworth-Heinemann, Oxford.
Grist, N. R., E. J. Bell, and F. Assaad. 1978. Enteroviruses in human disease. Progress in
Medical Virology 24: 114-157.
Gutteridge, Haskins and Davey. 1997. Biosolids 2040: A long term strategy for the
management of Perth's wastewater biosolids. Water Corporation of Western
Australia, Leederville.
Hall, J. E., and S. R. Smith. 1997. Cairo Sludge Disposal Study. Water and Environment
Journal 11: 373-376.
Han, Y., S. Sung, and R. R. Dague. 1997. Temperature-phased anaerobic digestion of
wastewater sludges. Water Science and Technology 36: 367-374.
Harwood, V. J., A. D. Levine, T. M. Scott, V. Chivukula, J. Lukasik and S. R. Farrah.
2005. Validity of the indicator organism paradigm for pathogen reduction in reclaimed
water and public health protection. Applied Environmental Microbiology 71 (60):
3163-3170.
Havelaar, A.H., and T.J., Nieuwstad. 1985. Bacteriophages and fecal bacteria as indicators
of chlorination of efficiency of biologically treated wastewater. Journal of Water
Pollution Control Federation 57 (11): 1084–1088.
Higgins, M. J., Y. C. Chen, S. N. Murthy, D. Hendrickson, J. Farrel, and P. Schafer.
2007. Reactivation and growth of non-culturable indicator bacteria in anaerobically
digested biosolids after centrifuge dewatering. Water Research 41: 665-673.

211
Horan, N. J. 2003. 7 - Faecal indicator organisms, p. 105-112, Handbook of Water and
Wastewater Microbiology. Academic Press, London.
Horan, N. J., L. Fletcher, S. M. Betmal, S. A. Wilks, and C. W. Keevil. 2004. Die-off of
enteric bacterial pathogens during mesophilic anaerobic digestion. Water Research
38: 1113-1120.
Hurst, C., J. R. I. Crawford, G. R. Knudsen, M. J. Mclnerney and L.D. Stezenbach. 2002.
Manual of Environmental Microbiology. 2nd ed. Washington, D.C.: ASM Press.
Hussong D., W. D. Burger and N. K. Enkiri. 1985. Occurance, growth and suppression of
Salmonella in composted sewage sludge. Applied Environmental Microbiology 50 (4):
887-893.
Iranpour, R., H. H. J. Cox, R.J. Kearney, J. H. Clark, A. B. Pincince, and G. T. Daigger.
2004. Regulations for biosolids land application in U.S. and European Union. Journal
of Residuals Science and Technology 1 (4): 209-222.
IAWPRC. 1991. Bacteriophages as model viruses in water quality controlag. Water
Research 25: 529-545.
Jimenez, B., C. Maya, E. Sanchez, A. Romero, L. Lira, and J. A. Barrios. 2002.
Comparison of the quantity and quality of the microbiological content of sludge in
countries with low and high content of pathogens. Water Science and Technology 46
(10): 17-24.

212
Jinling, W., L. Haitao, H. Xia. 2010. Indigenous somatic coliphage removal from a real
municipal wastewater by a submerged membrane bioreactor. Water Research 44:
1853-1862.
Jofre, J., M. Blasi, A. Bosch, and F. Lucena. 1989. Occurrence of bacteriophages
infecting bacteroides fragilis and other viruses in polluted marine sediments. Water
Science and Technology 21: 15–19.
Kato, S., E. Fogarty, and D. Bowman. 2003. Effect of aerobic and anaerobic digestion on
the viability of Cryptosporidium parvum oocysts and Ascaris suum eggs. International
Journal of Environmental Health Research 13 (2): 169-179.
Kator, H., and M. Rhodes. 2003. 8- Detection, enumeration and identification of
environmental microorganisms of public health significance, p. 113-144, Handbook of
Water and Wastewater Microbiology. Academic Press, London.
Kazmi, A. A., V. K. Tyagi, R. C. Trivedi, and A. Kumar. 2008. Coliforms removal in full-
scale activated sludge plants in India. Journal of Environmental Management 87:
415-419.
Lang, N. L., and S. R. Smith. 2008. Time and temperature inactivation kinetics of enteric
bacteria relevant to sewage sludge treatment processes for agricultural use. Water
Research 42: 2229-2241.
Leblanc, R. J., P. Matthews, and P. R. Richard. 2008. Global Atlas of excreta, wastewater
sludge and biosolids management: moving forward the sustainable and welcome uses
of a global resource. UN-HABITAT. Kenya.

213
Lenhard, G. 1965. Determination of protease activity in bottom deposits of sewage
stabilization ponds. National Institute of Water Research, South African Council for
Scientific and Industrial Reseach 67-79.
Lewis G. D., F. J. Austin, M. W. Loutit, and K. Sharples. 1986. Enterovirus removal from
sewage. Water Research 20 (10): 1291-1297.
Lucena, F., A. E. Duran, A. Moron, E. Calderon, C. Campos, C. Gantzer, S. Skraber,
and J. Jofre. 2004. Reduction of bacterial indicators and bacteriophages infecting
faecal bacteria in primary and secondary wastewater treatments. Journal of Applied
Microbiology 97: 1069-1076.
Lucena, F., and J. Jofre. 2010. 6- Potential use of bacteriophages as indicators of water
quality and wastewater treatment processes p:103-118, In Sabour, P. M., and M. W.
Griffiths (eds) Bacteriophages in the control of food and waterborne pathogens. ASM
press, Washington, DC.
Malack Muhammad, H., A. Bukhari Alaadin, and S. Abuzaid Nabil. 2007. Fate of
pathogens in sludge sand drying beds at Qateef, Khobar and Dammam: a case
study. International Journal of Environmental Research 1(1): 19-27.
Mandilara, G., A. Mavridou, M. Lambiri, A. Vatopoulos, and F. Rigas. 2010. The use of
bacteriophages for monitoring the microbiological quality of sewage sludge.
Environmental Technnology 27: 367-375.
Maynard, H. E., S. K. Ouki, and S. C. Williams. 1999. Tertiary lagoons: a review of
removal mecnisms and performance. Water Research 33: 1-13.
Melbourne Water. 2011. Sewerage. www.melbourne.com.au.

214
Millner P. D., K. E. Powers, N. K. Enkiri and W. D. Burge. 1987. Microbially mediated
growth suppression and death of Salmonella in composted sewage sludge. Microbial
Ecology 14: 225-265.
Miron, Y., G. Zeeman, J. B. Van Lier, and G. Lettinga. 2000. The role of sludge retention
time in the hydrolysis and acidification of lipids, carbohydrates and proteins during
digestion of primary sludge in CSTR systems. Water Research 34: 1705-1713.
Morinigo, M. A., D. Wheeler, C. Berry, C. Jones, M. A. Munoz, R. Cornax, and J. J.
Borrego. 1992. Evaluation of different bacteriophage groups as faecal indicators in
contaminated natural waters in southern England. Water Research 26 (3): 267–271.
Nappier, S. P., M. D. Aitken, and M. D. Sobsey. 2006. Male-specific coliphages as
indicators of thermal inactivation of pathogens in biosolids. Applied Environmental
Microbiology 72 (4): 2471-2475.
Narayanan, M., M. Priya, A. Haridas, and V. B. Manila. 2007. Isolation and culturing of a
most common anaerobic ciliate, Metopus sp. Anaerobe 23: 14-20.
Nasser, A. M., R. Glozman, and Y. Nitzan. 2002. Contribution of microbial activity to virus
reduction in saturated soil. Water Research 36: 2589-2595.
Negole, V., S. Mpuchane, and O. Totolo. 2006. Survival of faecal coliforms in four different
types of sludge-amended soils in Botswana. European Journal of Soil Biology 42:
208-218.
Nemerow, G. R., L. Pache, V. Reddy, and P. L. Stewart. 2009. Insights into adenovirus
host cell interactions from structural studies. Virology 384: 380-388.

215
Ng, W. J., T. S. Sim, S. L. Ong, K. Y. Ng, M. Ramasamy, and K. N. Tan. 1993. Fate of
coliforms and coliphages in the sequencing batch reactor (SBR). Bioresource
Technology 46: 197-205.
NRC (National Research Council) of the National Academies. 2002. Biosolids Applied to
Land: Advancing Standards and Practices, The National Academies Press,
Washington D.C.
NRE (Department of National Resources and Environment), EPA Victoria, and
Victorian Water Industry Association Inc. 2002. Moving towards sustainable
biosolids management. www.nre.vic.gov.au.
NRMMC (National Resource Ministerial Management Council). 2004. Guidelines for
sewerage systems biosolids management.
Ohgaki S., A., Ketratanakul and U. Prasertsom. 1986. Effect of sunlight on coliphages in
an oxidation pond. Water Science Technology 18 (10): 37-46.
P
Palmer, J. L., J. C. Celedon, S. T. Welss, B. Wang, Z. Fang, and X. Xu. 2002. Ascaris
lumbricoides infection is associated with increased risk of childhood asthma and
atopy in rural China. American Journal of Respiratory and Critical Care Medicine
165: 1489-1493.
Park, C., M. M. Abu-Orf, and J. T. Novak. 2006. The digestibility of waste activated
sludges. Water Environment Research 78(1): 59-68.
Pell, M., and A. Wörman. 2011. 6.24 - Biological Wastewater Treatment Systems, p. 275-
290, Comprehensive Biotechnology (Second Edition). Academic Press, Burlington

216
Percival, S., R. Chalmers, M. Embrey, P. Hunter, J. Sellwood, and P. Wyn-Jones.
2004a. 27 - Adenovirus, p. 379-386, Microbiology of Waterborne Diseases.
Academic Press, London.
Percival, S., R. Chalmers, M. Embrey, P. Hunter, J. Sellwood, and P. Wyn-Jones.
2004b. 28 - Astrovirus, p. 387-399, Microbiology of Waterborne Diseases. Academic
Press, London.
Percival, S., R. Chalmers, M. Embrey, P. Hunter, J. Sellwood, and P. Wyn-Jones.
2004c. 29 - Enterovirus: Poliovirus, coxsackievirus, echovirus, p. 401-418,
Microbiology of Waterborne Diseases. Academic Press, London.
Percival, S., R. Chalmers, M. Embrey, P. Hunter, J. Sellwood, and P. Wyn-Jones.
2004d. 33 - Rotavirus, p. 445-452, Microbiology of Waterborne Diseases. Academic
Press, London.
Pike, E. B., and E. G. Carrington. 1986. Stabilisation of sludge by conventional and novel
processes-a healthy future. Agricultural Use of Sewage Sludge-Is There a Future?
The Institute of Water Pollution Control, North Eastern Branch.
Plevka, P., K. Tars, and L. Liljas. 2009. Structure and stability of icosahedral particles of a
covalent coat proteindimer of bacteriophage MS2. Protein Science 18:1653-1661.
Popat, S. C., M. V. Yates, and M. A. Deshusses. 2010. Kinetics of inactivation of indicator
pathogens during thermophilic anaerobic digestion. Water Research 44:5965-5972.
217
Puig, A., R. Araujo, J. Jofre, and J. Frias-Lopez. 2001. Identification of cell wall proteins of
Bacteroides fragilis to which bacteriophage B40-8 binds specifically. Microbiology
147: 281-288.
Qi, Y., S. K. Dentel, and D. S. Herson. 2007. Increases in fecal coliform bacteria resulting
from centrifugal dewatering of digested biosolids. Water Research 41:571-580.
Reed, S. C., E. J. Middlebrooks, and R. W. Crites. 1988. Natural systems for wastewater
management and treatment. McGraw-Hill, New York.
Reinoso, R., L. A. Torres, and E. Bécares. 2008. Efficiency of natural systems for removal
of bacteria and pathogenic parasites from wastewater. Science of The Total
Environment 395: 80-86.
Rhoades, M., L. A. MacHattie, and C. A. Thomas Jr. 1968. The P22 bacteriophage DNA
molecule: I. The mature form. Journal of Molecular Biology 37: 21-40.
Riau, V., M. Á. De la Rubia, and M. Pérez. 2010. Temperature-phased anaerobic digestion
(TPAD) to obtain class A biosolids: A semi-continuous study. Bioresource
Technology 101: 2706-2712.
Rigby, H., D. Pritchard, D. Collins, K. Walton, D. Allen, and N. Penney. 2010. Improving
guidelines for the plant available nitrogen value of biosolids from wastewater
treatment. Journal of residuals science and technology 7 (1): 13-19.
Rinsoz, T., S. Hilfiker, and A. Oppliger. 2009. Quantification of thermotolerant
Campylobacter in Swiss water treatment plants by real-time quantitative polymerase
chain reaction. Water Environmental Research 81 (9): 929-933

218
Robertson, L. J., L. Hermansen, and B. K. Gjerde. 2006. Occurance of Cryptosporidium
oocysts in sewage in Norway. Applied Environmental Microbiology 72: 5297-5303.
Rothamsted. 2004. Soil dry matter content and water holdig capacity.
http://www.rothamsted.ac.uk/aen/smbweb1/methods.php?id=896.
Rouch, D., M. Deighton, V. A. Fleming, and S. R. Smith. 2009. Pathogen risks and
nutrient status of air dried and stored biosolids. Final Evaluation Report, Smart Water
Fund.
Rouch, D. A., V. A. Fleming, S. Pai, M. Deighton, J. Blackbeard, and S. R. Smith.
2011a. Nitrogen release from air-dried biosolids for fertilizer value. Soil Use and
Management 27: 294-304.
Rouch, D. A., T. Mondal, V. Flemming, F. Glauche, S. R. Smith, J. Blackbeard, and M.
Deighton. 2011b. Microbial safety of air-dried and rewetted biosolids. Journal of
Water and Health 9: 403-414.
Rubio-Loza, L. A., and A. Noyola. 2010. Two-phase (acidogenic–methanogenic) anaerobic
thermophilic/mesophilic digestion system for producing Class A biosolids from
municipal sludge. Bioresource Technology 101: 576-585.
Rudolfs W., L.L. Falk and R.A. ragotzkie. 1950. Literature review on the occurrence and
survival of enteric, pathogenic and relative organisms in soil, water, sewage and
sludges and on vegetation. 1. Bacterial and virus diseases. Sewage Industry Wastes
22 (10): 1261-1281.

219
Safferman, R. S., and M. E. Morris. 1976. Assessment of virus removal by a multi-stage
activated sludge process. Water Research 10: 413-420.
Sahlström, L., A. Aspan, E. Bagge, M. L. D. Tham, and A. Albihn. 2004. Bacterial
pathogen incidences in sludge from Swedish sewage treatment plants. Water
Research 38: 1989-1994.
Saleem, M., M. H. Al-Malack, and A. A. Bukhari. 2001. Seasonal variations in the microbial
population density present in biological sludge. Environmental Technology 22: 255-
259.
Salihoglu, K. N., V. Pinarli, and G. Salihoglu. 2007. Solar drying in sludge management in
Turkey. Renewable Energy 32: 1661-1675.
Sánchez-Monedero, M. A., C. Mondini, M. de Nobili, L. Leita, and A. Roig. 2004. Land
application of biosolids. Soil response to different stabilization degree of the treated
organic matter. Waste Management 24: 325-332.
Sanin F. D., W. W. Clarkson, and P. A. Vesilind. 2011a. Chapter 1 - Sludge sources,
quantities and management, p: 1-62, Sludge engineering. The treatment and
disposal of wastewater sludge. DEStech Publications, Inc., Lancaster.
Sanin F. D., W. W. Clarkson, and P. A. Vesilind. 2011b. Chapter 3 - Sludge stabilization,
p: 63-114, Sludge engineering. The treatment and disposal of wastewater sludge.
DEStech Publications, Inc., Lancaster.

220
Sanin F. D., W. W. Clarkson, and P. A. Vesilind. 2011c. Chapter 6 - Sludge dewatering, p:
177-250, Sludge engineering. The treatment and disposal of wastewater sludge.
DEStech Publications, Inc., Lancaster.
Sanin F. D., W. W. Clarkson, and P. A. Vesilind. 2011d. Chapter 2 - Sludge
characteristics, p: 25-62, Sludge engineering. The treatment and disposal of
wastewater sludge. DEStech Publications, Inc., Lancaster.
Shanahan, E. F., A. Roiko, N. W. Tindale, M. P. Thomas, R. Walpole, and D. I. Kurtboke.
2010. Evaluation of pathogen removal in a solar sludge drying facility using microbial
indicators. International Journal of Environmental Research and Public Health 7:
565-582.
Sidhu, J., R. A. Gibbs, G. E. Ho, and I. Unkovich. 2001. The role of indigenous
microorganisms in suppression of Salmonella regrowth in composted biosolids.
Water Research 35: 913-920.
Sidhu, J. P. S., and S. G. Toze. 2009. Human pathogens and their indicators in biosolids: A
literature review. Environment International 35: 187-201.
Simmons, F. J., D. H. W. Kuo, and I. Xagoraraki. 2011. Removal of human enteric viruses
by a full-scale membrane bioreactor during municipal wastewater processing. Water
Research 45: 2739-2750.
Simmons, F. J., and I. Xagoraraki. 2011. Release of infectious human enteric viruses by
full-scale wastewater utilities. Water Research 45: 3590-3598.

221
Singh, R. P., and M. Agrawal. 2008. Potential benefits and risks of land application of
sewage sludge. Waste Management 28: 347-358.
Smith, H.M., R. G. Dekaminsky, S. Niwas, R. J. Soto, and P. E. Jolly. 2001.
Prevalence and intensity of infections of Ascaris lumbricoides and Trichuris trichiura
and associated socio-demographic variables in four rural honduran communities.
Mem Inst Oswaldo Cruz, Reo di Janeiro 96 (3): 303-314.
Smith, S. R., N. L. Lang, K. H. M. Cheung, and K. Spanoudaki. 2005. Factors controlling
pathogen destruction during anaerobic digestion of biowastes. Waste Management
25: 417-425.
Sommers, L. E. 1977. Chemical Composition of Sewage Sludges and Analysis of Their
Potential Use as Fertilizers. Journal of Environmental Quality 6 (2): 225-232.
Souter, F., N. Ashbolt, and D. Roser. 2000. Methods for assaying bacteriophages for
faecal indicator bacteria in environmental waters. School of Civil and Environmental
Engineering UNSW 2052.
Spinosa, L. 2007. Wastewater sludge: a global overview of the current status and future
prospects. IWA Publishing. London.
Spinosa, L. 2011. Wastewater sludge: a global overview of the current status and future
prospects. 2nd edition. IWA Publishing. London.

222
Straub, T. M., I. L. Pepper, and C. P. Gerba. 1993. Hazards from pathogenic
microorganisms in land disposed sewage sludge. Reviews of Environmental
Contamination and Toxicology 132: 55-91.
Stuetz, R., and T. Stephenson. 2009a. Unit 2- Flowsheeting, p: 23-44, Principles of water
and wastewater treatment processes. IWA Publishing, London.
Stuetz, R., and T. Stephenson. 2009b. Unit 8- Sludge treatment and utilization, p: 165-185,
Principles of water and wastewater treatment processes. IWA Publishing, London.
Tanji, Y., K. Mizoguchi, M. Yoichi, M. Morita, N. Kijima, H. Kator, and H. Unno. 2002.
Fate of coliphage in a wastewater treatment process. Journal of Bioscience and
Bioengineering 94 (2): 172-174.
Tanji, Y., K. Mizoguchi, M. Yoichi, M. Morita, N. Kijima, H. Kator, and H. Unno. 2003.
Seasonal change and fate of coliphages infected to Escherichia coli O157:H7 in a
wastewater treatment plant. Water Research 37: 1136-1142.
Tata, P., C., Lue-Hing, G.J., Knafl. 2000. Statistical evaluation of pathogen inactivation for
a conventional low-cost technology class A biosolids process. Water Environment
Research 72(4): 423-431.
Tchobanoglous, G., Burton, F. L., Metcalf& Eddy. 1991. Chapter 12- Design of facilities
for the treatment and disposal of sludge, p: 765-915, Wastewater engineering :
treatment, disposal, and reuse. Metcalf & Eddy, Inc. McGraw-Hill, New York .
Templeton, M. R., R. C. Andrews, and R. Hofmann. 2005. Inactivation of particle-
associated viral surrogates by ultraviolet light. Water Research 39: 3487-3500.

223
Toze, S., and J. Sidhu. 2011. Biosolids: Human Health Impacts, p. 394-402 , Encyclopedia
of Environmental Health. Elsevier, Burlington.
Tsang, K. R., and J. E. Smith. 2005. Challenges in sludge stabilization: Regulatory
compliance in the design and operation of facilities. Journal of Environmental
Engineering 131 (6): 834-837.
Turki, Y., H. Ouzari, I. Mehri, A. B. Ammar, and A. Hassen. 2012. Evaluation of a cocktail
of three bacteriophages for the biocontrol of Salmonella of wastewater. Food
Research International 45 (2): 1099-1105.
Ueda, T., and N. J. Horan. 2000. Fate of indigenous bacteriophage in a membrane
bioreactor. Water Research 34: 2151-2159.
US EPA (United States Environmental Protection Agency). 1989. Environmental
Regulations and Technology: Control of pathogens in municipal wastewater sludge.
Report EPA 625 10-89 006, US EPA, Cincinnati OH.
US EPA (United States Environmental Protection Agency). 1999. Environmental
Regulations and Technology: Control of pathogens and vector attraction in sewage
sludge. Report EPA 625/R-92/013, US EPA, Washington DC.
US EPA (United States Environmental Protection Agency). 2003. Environmental
Regulations and Technology: Control of pathogens and vector attraction in Sewage
Sludge. Report EPA 625/R-92/013, US EPA, Cincinnati OH.
Wandersman, C. 1989. Secretion, processing and activation of bacterial extracellular
proteases. Molecular Microbiology 3 (12): 1825-1831.

224
Ward, R. L., and C. S. Ashley. 1977. Inactivation of enteric viruses in wastewater sludge
through dewatering by evaporation. Applied and Environmental Microbiology 34 (5):
564-570.
Ward, R. L., J. G. Yeager, and C. S. Ashley. 1981. Response of bacteria in wastewater
sludge to moisture loss by evaporation and effect of moisture content on bacterial
inactivation by ionizing radiation. Applied and Environmental Microbiology 41 (5):
1123-1127.
Watanabe, H., T. Kitamura, S. Ochi, and M. Ozaki. 1997. Inactivation of pathogenic
bacteria under mesophilic and thermophilic conditions. Water Science and
Technology 36: 25-32.
Wen, Q., C. Tutuka, A. Keegan, and B. Jin. 2009. Fate of pathogenic microorganisms and
indicators in secondary activated sludge wastewater treatment plants. Journal of
Environmental Management 90: 1442-1447.
Wheeler A. I., P. G. Hartel, D. G. Godfery, J.I. Hill and W. I. Segars. 2002. Potential of
Enterococcus faecalis as a human faecal indicator for microbial source tracking,
Environmental Quality 31: 1286-93.
WHO (World Health Organization). 1987. Prevention and control of intestinal parasitic
infections. WHO Technical Report Series 749, Geneva.
Xu, L. Q., S. H. Yu, Z. X. Ziang, J. L. Yang, L. Q. Lai, X. J. Zhang, and C. Q. Zheng.
1995. Soil transmitted helminthiases: nation wide survey in China. Bulletin of the
World Health Organization 73: 507-513.

225
Yeager, J. G., and R. L. Ward. 1981. Effects of moisture content on long-term survival and
regrowth of bacteria in wastewater sludge. Applied and Environmental Microbiology
41 (5): 1117-1122.
Zaleski, K. J., K. L. Josephson, C. P. Gerba, and I. L. Pepper. 2005. Survival, growth and
regrowth of enteric indicator and pathogenic bacteria in biosolids, compost, soil and
land applied biosolids. Journal of Residuals Science and Technology 2(1): 49-63.
Zhang, K., and K. Farahbakhsh. 2007. Removal of native coliphages and coliform bacteria
from municipal wastewater by various wastewater treatment processes: Implications
to water reuse. Water Research 41: 2816-2824.
Ziemba, C., and J. Peccia. 2011. Net energy production associated with pathogen
inactivation during mesophilic and thermophilic anaerobic digestion of sewage
sludge. Water Research 45: 4758-4768.

226
Appendix

227
Raw data
1. Indicator decay in Pan 23, full year pan
1.1 E. coli
Sample type Sampling date
Drying time (days) CFU/g DS
MADLine1 19/05/2009 67 1.7E+06 MADLine1 19/05/2009 67 2.0E+06 MADLine1 19/05/2009 67 2.8E+06 MADLine5 19/05/2009 67 6.3E+06 MADLine5 19/05/2009 67 5.9E+06 MADLine5 19/05/2009 67 5.4E+06 Pan 23 19/05/2009 67 1.7E+05 Pan 23 19/05/2009 67 1.1E+05 Pan 23 19/05/2009 67 1.1E+05 MAD Line 1 21/07/2009 130 3.4E+06 MAD Line 1 21/07/2009 130 2.8E+06 MAD Line 1 21/07/2009 130 2.0E+05 MAD Line 5 21/07/2009 130 4.4E+05 MAD Line 5 21/07/2009 130 2.4E+06 MAD Line 5 21/07/2009 130 3.4E+04 Pan 23 21/07/2009 130 7.0E+03 Pan 23 21/07/2009 130 2.6E+04 Pan 23 21/07/2009 130 5.1E+04 MAD Line 1 7/09/2009 178 2.3E+06 MAD Line 1 7/09/2009 178 2.2E+06 MAD Line 1 7/09/2009 178 3.4E+06 MAD Line 5 7/09/2009 178 2.6E+06 MAD Line 5 7/09/2009 178 4.4E+06 MAD Line 5 7/09/2009 178 5.5E+06 Pan 23 7/09/2009 178 2.2E+04 Pan 23 7/09/2009 178 1.5E+04 Pan 23 7/09/2009 178 1.5E+04 MAD Line 1 9/11/2009 241 6.95E+04 MAD Line 1 9/11/2009 241 6.28E+04 MAD Line 1 9/11/2009 241 1.33E+05 Pan 23 9/11/2009 241 2.30E+02 Pan 23 9/11/2009 241 5.21E+02 Pan 23 9/11/2009 241 5.19E+02 MAD line 1 14/12/2009 276 3.98E+05 MAD line 1 14/12/2009 276 3.69E+05 MAD Line 1 14/12/2009 276 3.00E+05 Pan 23 14/12/2009 276 9.74E+01 Pan 23 14/12/2009 276 2.26E+02 Pan 23 14/12/2009 276 1.34E+02 MAD Line 1 1/02/2010 325 1.09E+06 MAD Line 1 1/02/2010 325 2.39E+06 MAD Line 1 1/02/2010 325 2.17E+06 Pan 23 1/02/2010 325 3.06E+02 Pan 23 1/02/2010 325 6.48E+01 Pan 23 1/02/2010 325 2.01E+02 MAD Line5 1/03/2010 353 9.17E+05 MAD Line5 1/03/2010 353 6.46E+05

228
MAD Line5 1/03/2010 353 6.54E+05 Pan 23 1/03/2010 353 2.00E+01 Pan 23 1/03/2010 353 7.16E+00 Pan 23 1/03/2010 353 2.00E+01 MAD Line5 19/04/2010 402 5.60E+05 MAD Line5 19/04/2010 402 5.21E+05 MAD Line5 19/04/2010 402 6.77E+05 Pan 23 19/04/2010 402 3.54E+01 Pan 23 19/04/2010 402 4.40E+01 Pan 23 19/04/2010 402 5.09E+01 MAD Line5 7/06/2010 451 1.51E+06 MAD Line5 7/06/2010 451 1.42E+06 MAD Line5 7/06/2010 451 1.49E+06 Pan 23 7/06/2010 451 5.34E+01 Pan 23 7/06/2010 451 5.33E+01 Pan 23 7/06/2010 451 5.38E+01
1.2 Enterococcus spp.
Sample type Sampling date
Drying time (days)
CFU/g DS
MAD Line 1 19/05/2009 67 3.16E+06 MAD Line 1 19/05/2009 67 3.42E+06 MAD Line 1 19/05/2009 67 3.84E+06 MAD Line 5 19/05/2009 67 2.69E+06 MAD Line 5 19/05/2009 67 2.38E+06 MAD Line 5 19/05/2009 67 2.19E+06 Pan 23 19/05/2009 67 6.33E+05 Pan 23 19/05/2009 67 7.12E+05 Pan 23 19/05/2009 67 5.45E+05 MAD Line 1 20/07/2009 129 1.48E+06 MAD Line 1 20/07/2009 129 2.01E+06 MAD Line 1 20/07/2009 129 2.02E+06 MAD Line 5 20/07/2009 129 2.69E+06 MAD Line 5 20/07/2009 129 2.38E+05 MAD Line 5 20/07/2009 129 1.79E+06 Pan 23 20/07/2009 129 3.80E+04 Pan 23 20/07/2009 129 1.24E+05 Pan 23 20/07/2009 129 5.03E+04 MAD Line 1 7/09/2009 178 2.39E+06 MAD Line 1 7/09/2009 178 2.31E+06 MAD Line 1 7/09/2009 178 2.13E+06 MAD Line 5 7/09/2009 178 1.55E+06 MAD Line 5 7/09/2009 178 1.78E+06 MAD Line 5 7/09/2009 178 3.79E+04 Pan 23 7/09/2009 178 3.24E+04 Pan 23 7/09/2009 178 3.95E+04 Pan 23 7/09/2009 178 2.43E+05 MAD Line 5 9/11/2009 241 1.40E+05 MAD Line 5 9/11/2009 241 5.38E+05 MAD Line 5 9/11/2009 241 5.69E+05 Pan 23 9/11/2009 241 2.53E+03 Pan 23 9/11/2009 241 4.95E+03
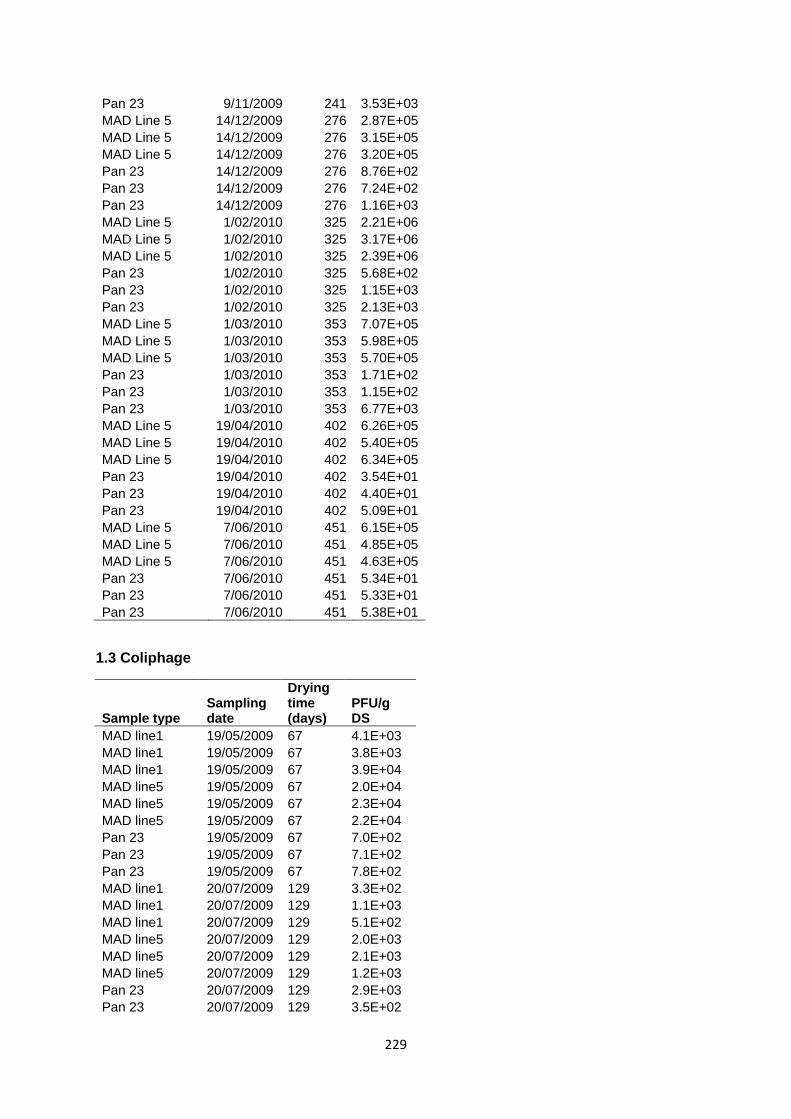
229
Pan 23 9/11/2009 241 3.53E+03 MAD Line 5 14/12/2009 276 2.87E+05 MAD Line 5 14/12/2009 276 3.15E+05 MAD Line 5 14/12/2009 276 3.20E+05 Pan 23 14/12/2009 276 8.76E+02 Pan 23 14/12/2009 276 7.24E+02 Pan 23 14/12/2009 276 1.16E+03 MAD Line 5 1/02/2010 325 2.21E+06 MAD Line 5 1/02/2010 325 3.17E+06 MAD Line 5 1/02/2010 325 2.39E+06 Pan 23 1/02/2010 325 5.68E+02 Pan 23 1/02/2010 325 1.15E+03 Pan 23 1/02/2010 325 2.13E+03 MAD Line 5 1/03/2010 353 7.07E+05 MAD Line 5 1/03/2010 353 5.98E+05 MAD Line 5 1/03/2010 353 5.70E+05 Pan 23 1/03/2010 353 1.71E+02 Pan 23 1/03/2010 353 1.15E+02 Pan 23 1/03/2010 353 6.77E+03 MAD Line 5 19/04/2010 402 6.26E+05 MAD Line 5 19/04/2010 402 5.40E+05 MAD Line 5 19/04/2010 402 6.34E+05 Pan 23 19/04/2010 402 3.54E+01 Pan 23 19/04/2010 402 4.40E+01 Pan 23 19/04/2010 402 5.09E+01 MAD Line 5 7/06/2010 451 6.15E+05 MAD Line 5 7/06/2010 451 4.85E+05 MAD Line 5 7/06/2010 451 4.63E+05 Pan 23 7/06/2010 451 5.34E+01 Pan 23 7/06/2010 451 5.33E+01 Pan 23 7/06/2010 451 5.38E+01
1.3 Coliphage
Sample type Sampling date
Drying time (days)
PFU/g DS
MAD line1 19/05/2009 67 4.1E+03 MAD line1 19/05/2009 67 3.8E+03 MAD line1 19/05/2009 67 3.9E+04 MAD line5 19/05/2009 67 2.0E+04 MAD line5 19/05/2009 67 2.3E+04 MAD line5 19/05/2009 67 2.2E+04 Pan 23 19/05/2009 67 7.0E+02 Pan 23 19/05/2009 67 7.1E+02 Pan 23 19/05/2009 67 7.8E+02 MAD line1 20/07/2009 129 3.3E+02 MAD line1 20/07/2009 129 1.1E+03 MAD line1 20/07/2009 129 5.1E+02 MAD line5 20/07/2009 129 2.0E+03 MAD line5 20/07/2009 129 2.1E+03 MAD line5 20/07/2009 129 1.2E+03 Pan 23 20/07/2009 129 2.9E+03 Pan 23 20/07/2009 129 3.5E+02
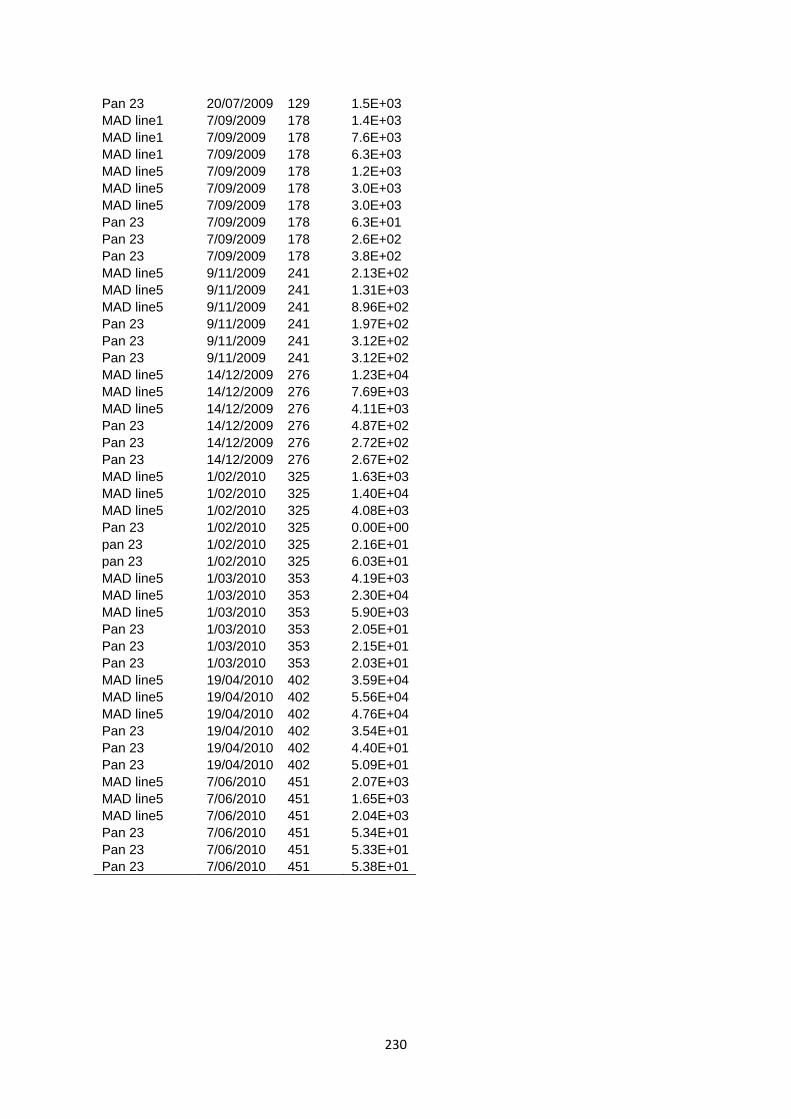
230
Pan 23 20/07/2009 129 1.5E+03 MAD line1 7/09/2009 178 1.4E+03 MAD line1 7/09/2009 178 7.6E+03 MAD line1 7/09/2009 178 6.3E+03 MAD line5 7/09/2009 178 1.2E+03 MAD line5 7/09/2009 178 3.0E+03 MAD line5 7/09/2009 178 3.0E+03 Pan 23 7/09/2009 178 6.3E+01 Pan 23 7/09/2009 178 2.6E+02 Pan 23 7/09/2009 178 3.8E+02 MAD line5 9/11/2009 241 2.13E+02 MAD line5 9/11/2009 241 1.31E+03 MAD line5 9/11/2009 241 8.96E+02 Pan 23 9/11/2009 241 1.97E+02 Pan 23 9/11/2009 241 3.12E+02 Pan 23 9/11/2009 241 3.12E+02 MAD line5 14/12/2009 276 1.23E+04 MAD line5 14/12/2009 276 7.69E+03 MAD line5 14/12/2009 276 4.11E+03 Pan 23 14/12/2009 276 4.87E+02 Pan 23 14/12/2009 276 2.72E+02 Pan 23 14/12/2009 276 2.67E+02 MAD line5 1/02/2010 325 1.63E+03 MAD line5 1/02/2010 325 1.40E+04 MAD line5 1/02/2010 325 4.08E+03 Pan 23 1/02/2010 325 0.00E+00 pan 23 1/02/2010 325 2.16E+01 pan 23 1/02/2010 325 6.03E+01 MAD line5 1/03/2010 353 4.19E+03 MAD line5 1/03/2010 353 2.30E+04 MAD line5 1/03/2010 353 5.90E+03 Pan 23 1/03/2010 353 2.05E+01 Pan 23 1/03/2010 353 2.15E+01 Pan 23 1/03/2010 353 2.03E+01 MAD line5 19/04/2010 402 3.59E+04 MAD line5 19/04/2010 402 5.56E+04 MAD line5 19/04/2010 402 4.76E+04 Pan 23 19/04/2010 402 3.54E+01 Pan 23 19/04/2010 402 4.40E+01 Pan 23 19/04/2010 402 5.09E+01 MAD line5 7/06/2010 451 2.07E+03 MAD line5 7/06/2010 451 1.65E+03 MAD line5 7/06/2010 451 2.04E+03 Pan 23 7/06/2010 451 5.34E+01 Pan 23 7/06/2010 451 5.33E+01 Pan 23 7/06/2010 451 5.38E+01

231
2. Indicator decay in Pan 41, summer pan
2.1 E. coli
Sample type
Sampling date
Drying time (days) CFU/g DS
MAD Line 1 5/10/2009 35 2.45E+04 MAD Line 1 5/10/2009 35 2.01E+04 MAD Line 1 5/10/2009 35 3.95E+04 MADLine 5 5/10/2009 35 2.15E+06 MADLine 5 5/10/2009 35 2.30E+06 MADLine 5 5/10/2009 35 2.05E+06 Pan41 5/10/2009 35 5.64E+04 Pan41 5/10/2009 35 6.33E+04 Pan41 5/10/2009 35 5.64E+04 MAD Line 5 9/11/2009 70 6.95E+04 MADLine 5 9/11/2009 70 6.28E+04 MADLine 5 9/11/2009 70 1.33E+05 Pan 41 9/11/2009 70 1.70E+03 Pan41 9/11/2009 70 9.81E+02 Pan41 9/11/2009 70 5.30E+02 MADLine 5 14/12/2009 105 3.98E+05 MADLine 5 14/12/2009 105 3.69E+05 MADLine 5 14/12/2009 105 3.00E+05 Pan 41 14/12/2009 105 1.77E+03 Pan 41 14/12/2009 105 1.90E+03 Pan 41 14/12/2009 105 2.14E+03 MADLine 5 1/02/2010 154 1.09E+06 MADLine 5 1/02/2010 154 2.39E+06 MADLine 5 1/02/2010 154 2.17E+06 Pan 41 1/02/2010 154 2.44E+03 Pan 41 1/02/2010 154 1.10E+03 Pan 41 1/02/2010 154 1.08E+03 SP 45 1/02/2010 154 0.00E+00 MAD Line 5 1/03/2010 182 9.17E+05 MAD Line 5 1/03/2010 182 6.46E+05 MAD Line 5 1/03/2010 182 6.54E+05 Pan41 1/03/2010 182 8.60E+02 Pan41 1/03/2010 182 3.75E+02 Pan41 1/03/2010 182 8.77E+02 MAD Line 5 22/03/2010 203 7.86E+05 MAD Line 5 22/03/2010 203 7.27E+05 MAD Line 5 22/03/2010 203 8.38E+05 Pan41 22/03/2010 203 9.04E+02 Pan41 22/03/2010 203 5.44E+02 Pan41 22/03/2010 203 5.42E+02 MAD Line 5 19/04/2010 231 5.60E+05 MAD Line 5 19/04/2010 231 5.21E+05 MAD Line 5 19/04/2010 231 6.77E+05 Pan41 19/04/2010 231 5.21E+02 Pan41 19/04/2010 231 2.59E+01 Pan41 19/04/2010 231 2.54E+01 MAD Line 5 7/06/2010 280 1.51E+06 MAD Line 5 7/06/2010 280 1.42E+06

232
MAD Line 5 7/06/2010 280 1.49E+06 Pan41 7/06/2010 280 2.40E+01 Pan41 7/06/2010 280 3.34E+02 Pan41 7/06/2010 280 5.95E+02
2.2 Enterococcus spp.
Sample type Sampling date
Drying time (days) CFU/g DS
MAD Line 1 5/10/2009 35 9.00E+04 MAD Line 1 5/10/2009 35 5.35E+04 MAD Line 1 5/10/2009 35 1.22E+05 MADLine 5 5/10/2009 35 3.64E+05 MADLine 5 5/10/2009 35 9.95E+05 MADLine 5 5/10/2009 35 1.34E+06 Pan41 5/10/2009 35 1.36E+05 Pan41 5/10/2009 35 1.45E+05 Pan41 5/10/2009 35 1.65E+05 SP 45 5/10/2009 35 7.06E+03 MAD Line 1 9/11/2009 70 1.40E+05 MAD Line 1 9/11/2009 70 5.38E+05 MAD Line 1 9/11/2009 70 5.69E+05 Pan 41 9/11/2009 70 1.39E+05 Pan41 9/11/2009 70 1.32E+05 Pan41 9/11/2009 70 4.65E+04 SP45 9/11/2009 70 3.33E+01 MAD line 1 14/12/2009 105 2.87E+05 MAD line 1 14/12/2009 105 3.15E+05 MAD Line 1 14/12/2009 105 3.20E+05 Pan 41 14/12/2009 105 2.66E+04 Pan 41 14/12/2009 105 1.81E+04 Pan 41 14/12/2009 105 1.85E+04 SP 45 14/12/2009 105 1.39E+01 MAD Line 1 1/02/2010 154 1.09E+06 MAD Line 1 1/02/2010 154 2.39E+06 MAD Line 1 1/02/2010 154 2.17E+06 Pan 41 1/02/2010 154 2.44E+03 Pan 41 1/02/2010 154 1.10E+03 Pan 41 1/02/2010 154 1.08E+03 SP 45 1/02/2010 154 0.00E+00 MAD Line 5 1/03/2010 182 7.07E+05 MAD Line 5 1/03/2010 182 5.98E+05 MAD Line 5 1/03/2010 182 5.70E+05 Pan41 1/03/2010 182 3.48E+03 Pan41 1/03/2010 182 3.80E+03 Pan41 1/03/2010 182 3.96E+03 MAD Line 5 22/03/2010 203 5.12E+05 MAD Line 5 22/03/2010 203 6.13E+05 MAD Line 5 22/03/2010 203 4.93E+05 Pan41 22/03/2010 203 3.46E+03 Pan41 22/03/2010 203 3.89E+03 Pan41 22/03/2010 203 3.54E+03 MAD Line 5 19/04/2010 231 6.26E+05

233
MAD Line 5 19/04/2010 231 5.40E+05 MAD Line 5 19/04/2010 231 6.34E+05 Pan41 19/04/2010 231 4.75E+02 Pan41 19/04/2010 231 3.62E+02 Pan41 19/04/2010 231 9.31E+01 MAD Line 5 7/06/2010 280 6.15E+05 MAD Line 5 7/06/2010 280 4.85E+05 MAD Line 5 7/06/2010 280 4.63E+05 Pan41 7/06/2010 280 4.81E+01 Pan41 7/06/2010 280 5.01E+01 Pan41 7/06/2010 280 5.10E+01
2.3 Coliphage
Sample type Sampling date
Drying time (days) PFU/g DS
MAD Line 1 5/10/2009 35 4.75E+03 MAD Line 1 5/10/2009 35 1.84E+03 MAD Line 1 5/10/2009 35 2.23E+03 MADLine 5 5/10/2009 35 4.68E+03 MADLine 5 5/10/2009 35 6.68E+03 MADLine 5 5/10/2009 35 1.10E+04 Pan 41 5/10/2009 35 2.11E+03 Pan 41 5/10/2009 35 5.55E+03 Pan 41 5/10/2009 35 2.22E+03 MAD Line 1 9/11/2009 70 2.13E+02 MAD Line 1 9/11/2009 70 1.31E+03 MAD Line 1 9/11/2009 70 8.96E+02 Pan 41 9/11/2009 70 6.02E+02 Pan 41 9/11/2009 70 5.35E+02 Pan 41 9/11/2009 70 2.94E+02 MAD line 1 14/12/2009 105 1.23E+04 MAD line 1 14/12/2009 105 7.69E+03 MAD Line 1 14/12/2009 105 4.11E+03 Pan 41 14/12/2009 105 5.45E+02 Pan 41 14/12/2009 105 2.72E+02 Pan 41 14/12/2009 105 1.38E+02 MAD Line 1 1/02/2010 154 1.63E+03 MAD Line 1 1/02/2010 154 1.40E+04 MAD Line 1 1/02/2010 154 4.08E+03 Pan 41 1/02/2010 154 1.68E+02 Pan 41 1/02/2010 154 7.59E+01 Pan 41 1/02/2010 154 1.24E+02 MADLine5 1/03/2010 182 4.19E+03 MADLine5 1/03/2010 182 2.30E+04 MADLine5 1/03/2010 182 5.90E+03 Pan 41 1/03/2010 182 5.27E+01 Pan 41 1/03/2010 182 4.50E+01 Pan 41 1/03/2010 182 6.12E+01 MADLine5 22/03/2010 203 4.71E+03 MADLine5 22/03/2010 203 7.86E+03 MADLine5 22/03/2010 203 8.38E+02 Pan 41 22/03/2010 203 3.87E+01 Pan 41 22/03/2010 203 3.71E+01

234
Pan 41 22/03/2010 203 4.28E+01 MADLine5 19/04/2010 231 3.59E+04 MADLine5 19/04/2010 231 5.56E+04 MADLine5 19/04/2010 231 4.76E+04 Pan 41 19/04/2010 231 5.48E+01 Pan 41 19/04/2010 231 5.17E+01 Pan 41 19/04/2010 231 5.08E+01 MADLine5 7/06/2010 280 2.07E+03 MADLine5 7/06/2010 280 1.65E+03 MADLine5 7/06/2010 280 2.04E+03 Pan 41 7/06/2010 280 4.81E+01 Pan 41 7/06/2010 280 5.01E+01 Pan 41 7/06/2010 280 5.10E+01
3. Laboratory simulation of mesophilic anaerobic digestion
3.1 Levels of E. coli and coliphage in feed sludge and MAD output in trial 1
E. coli Coliphage
Date Feed Output Feed Output
(cfu/g DS) (cfu/g DS) (pfu/g DS) (pfu/g DS)
21/12/2009 4.04E+05 4.55E+04 9.37E+03 3.70E+03
4.68E+05 1.42E+03 5.04E+03 1.42E+03
4.25E+05 3.13E+04 8.65E+03 1.42E+03
16/02/2010 2.03E+05 1.25E+04 7.44E+03 1.87E+03
2.17E+05 1.56E+04 9.47E+03 1.87E+03
2.03E+05 1.87E+04 6.09E+03 3.12E+03
23/02/2010 2.78E+05 2.22E+03 ND ND
3.94E+05 1.66E+03
2.24E+05 5.54E+02
10/03/2010 2.41E+07 6.05E+04 ND ND
2.36E+07 4.93E+04
2.31E+07 3.59E+04
18/03/2010 3.19E+05 1.20E+04 ND ND
2.97E+05 6.02E+03
2.81E+05 9.03E+03
Mean 4.97E+06 2.02E+04 7.68E+03 2.23E+03
SD 9.32E+06 1.89E+04 1.82E+03 9.50E+02
Log10 mean 6.696 4.304 3.885 3.349

235
Mean Log10 reduction -2.39 0.54
ND=Not done
3.2 Levels of E. coli and coliphage in feed sludge and MAD output in trial 2
E. coli Coliphage
Date Feed Output Feed Output
(cfu/g DS) (cfu/g DS) (pfu/g DS) (pfu/g DS)
06/05/2010 2.49E+06 3.62E+04 NC NC
2.37E+06 4.61E+04
5.49E+05 3.19E+04
13/05/2010 6.08E+05 1.18E+05 NC NC
6.29E+05 9.91E+04
6.91E+05 1.24E+05
21/05/2010 1.13E+06 3.99E+05 ND ND
1.28E+06 5.98E+05
1.49E+06 5.60E+05
27/05/2010 2.26E+06 2.55E+05 ND ND
2.23E+06 2.60E+05
2.34E+06 3.13E+05
04/06/2010 9.96E+03 1.21E+04 ND ND
2.49E+04 1.21E+04
1.99E+04 1.16E+04
07/06/2010 2.12E+05 2.81E+04 NC NC
2.86E+05 2.91E+04
2.79E+05 2.71E+04
Mean 1.05E+06 1.64E+05
SD 9.21E+05 1.91E+05
Log10 mean 6.02 5.22
Mean Log Decay -0.80

236
3.3 pH and biogas in trial 1
Gasses (%)
Sample date
pH CH4 C02
10/02/2010 7.27 15.7 13.4
15/02/2010 25.1 22.6
19/02/2010 28 24.1
23/02/2010 7.27 29.2 24.3
26/02/2010 21.6 17.8
03/03/2010 17.7 12
10/03/2010 7.05 8.7 12.1
Mean 7.20 21 18
3.4 pH and biogas in trial 2
Gasses (%)
Sample date
pH CH4 C02
14/04/2010 7.06 16.3 15.3
23/04/2010 30.8 30.2
27/04/2010 20.5 19.3
03/05/2010 26.3 24.8
06/05/2010 7.12
07/05/2010 24.4 23.1
20/05/2010 6.88
31/05/2010 24.8 26.7
04/06/2010 7.30 33.1 29.2
Mean 7.09 25 24

237
3.5 Dry solid and volatile solid in trial 1
Date %DS %VS
Feed Output Feed Output
21/12/2009 3.3 1.4 83.3 73.7
16/02/2010 6.2 1.5 80.6 78.6
23/02/2010 1.7 1.1 78 73.5
10/03/2010 4.4 1.8 ND ND
18/03/2010 5.9 1.8 ND ND
Mean 4.3 1.5 81.9 76.2
Difference 2.8 5.7
ND=Not Done
3.6 Dry solid and volatile solid in trial 2
Date % DS % VS
Feed Output Feed Output
06/05/2010 4.0 1.4 81.8 71.5
12/05/2010 1.4 0.6 82.4 77.4
19/05/2010 5.3 1.3 82.6 69.5
26/05/2010 2.7 1.9 88.5 71.2
02/06/2010 4.0 1.8 84.1 71.6
08/06/2010 2.7 2.0 83.4 70.1
Mean 3.4 1.5 83.8 71.9
Difference 1.9 11.9
.

238
4. Laboratory simulation of drying pan and stockpiling
4.1 Decay of bacteriophage in drying pan simulation 1
4.1.1 Somatic coliphage
week Coliphage (pfu/g)
1 7.45E+02 1 4.80E+02 1 6.13E+02 1 5.38E+02 1 8.33E+02 1 9.61E+02 2 2.65E+04 2 3.52E+03 2 3.63E+03 2 1.35E+03 2 2.00E+03 2 2.07E+03 3 3.61E+02 3 1.93E+02 3 2.69E+02 3 2.60E+02 3 1.07E+02 3 1.70E+02 4 1.77E+02 4 1.12E+02 4 1.88E+02 5 7.02E+02 5 2.52E+03 5 1.32E+03 6 3.50E+01 6 5.51E+02 6 3.80E+02 8 2.44E+01 8 3.39E+01 8 1.51E+01
10 1.13E+01 10 1.65E+01 10 1.18E+01 11 1.22E+01 11 1.42E+01 11 1.20E+01 12 9.90E+00 12 1.37E+01 12 1.17E+01

239
4.1.2 MS2 bacteriophage
week
MS2 bacteriophage (pfu/g)
3 2.34E+06 3 1.63E+06 3 1.62E+06 4 1.71E+03 4 5.61E+03 4 8.67E+03 5 2.44E+03 5 1.30E+03 5 1.36E+03 6 2.28E+02 6 8.85E+02 6 6.71E+02 8 4.03E+01 8 2.40E+01 8 4.02E+01 10 1.15E+01 10 1.02E+01 10 2.02E+01 11 1.03E+01 11 1.10E+01 11 1.87E+01 12 1.11E+01 12 1.07E+01 12 1.21E+01
4.1.3 P22 bacteriophage
week
P22 bacteriophage (pfu/g)
1 3.E+06 1 5.E+04 1 2.E+06 2 7.51E+05 2 4.01E+05 2 1.21E+06 3 1.38E+05 3 2.65E+05 3 2.85E+05 4 1.11E+06 4 8.50E+05 4 9.58E+05 5 3.23E+04 5 3.46E+04 5 7.78E+04 6 1.76E+04 6 1.34E+05 6 7.48E+04 8 9.13E+03

240
8 1.34E+04 8 1.23E+04 10 5.75E+01 10 1.02E+01 10 2.36E+01 11 1.03E+01 11 1.10E+01 11 3.74E+00 12 7.68E+00 12 7.69E+00 12 8.12E+00 17 7.94E+00 17 8.45E+00 17 7.52E+00 21 5.57E+00 21 5.37E+00 21 5.46E+00
4.2 Decay of bacteriophage in drying pan simulation 2
4.2.1 Somatic coliphage
week Coliphage (pfu/g)
1 3.29E+02 1 1.03E+03 1 1.60E+03 1 8.56E+02 1 6.88E+02 1 3.84E+02 3 3.10E+03 3 1.23E+03 3 9.89E+02 3 2.18E+02 3 1.77E+03 3 1.53E+03 5 9.94E+02 5 1.52E+03 5 2.46E+02 5 1.44E+02 5 1.38E+02 5 1.86E+02 7 4.56E+02 7 7.58E+02 7 1.24E+03 9 1.39E+02 9 1.68E+02 9 1.63E+02
11 1.18E+02 11 7.32E+01 11 1.09E+02 13 3.03E+01 13 1.88E+01 13 2.01E+01

241
15 2.42E+01 15 2.29E+01 15 3.87E+01 17 1.62E+01 17 1.56E+01 17 1.72E+01 19 1.07E+01 19 9.05E+00 19 1.07E+01 21 1.10E+01 21 9.68E+00 21 1.08E+01
4.2.2 MS2 bacteriophage
Week
MS2 bacteriophage (pfu/g)
5 4.47E+07 5 1.82E+08 5 1.61E+08 7 3.14E+04 7 1.07E+05 7 1.04E+05 9 1.56E+04 9 7.60E+03 9 1.13E+04 11 9.84E+03 11 2.86E+03 11 1.55E+04 13 3.92E+03 13 3.40E+03 13 3.49E+03 15 9.48E+02 15 4.15E+02 15 8.05E+02 17 4.41E+00 17 4.27E+00 17 4.36E+01 19 2.80E+00 19 1.59E+01 19 1.02E+01 21 9.06E+00 21 8.95E+00 21 9.15E+00

242
4.3 Decay of bacteriophage in drying pan simulation 3
4.2.3 Somatic coliphage
week Coliphage (pfu/g)
1 3.29E+02 1 2.23E+02 1 1.94E+02 3 1.54E+03 3 1.67E+03 3 6.54E+02 5 6.31E+02 5 1.21E+03 5 4.93E+02 7 1.69E+02 7 5.64E+01 7 1.21E+02 9 5.02E+01 9 1.44E+02 9 1.57E+02
11 1.05E+02 11 1.41E+02 11 8.42E+01 13 4.89E+01 13 4.94E+01 13 4.18E+01 15 3.37E+01 15 4.20E+01 15 2.44E+01 17 1.60E+01 17 1.87E+01 17 1.16E+01
4.2.4 MS2 bacteriophage
week
MS2 bacteriophage (pfu/g)
7 6.30E+05 7 2.45E+06 7 3.03E+06 9 2.18E+04 9 6.08E+03 9 1.13E+04 11 5.26E+03 11 2.14E+03 11 6.79E+03 13 7.90E+02 13 3.87E+02 13 1.06E+03 15 2.77E+01 15 2.51E+01 15 4.78E+01 17 1.30E+01

243
17 1.23E+01 17 1.25E+01
5. Factors affecting bacterial die-off during sewage sludge treatment
5.1 Effect of different salt mixtures on the growth and decay of E. coli in biosolids
Strain ID CFU/mL
3% TS 5% TS 7% TS 9% TS 11% TS LB M34 1.68E+09 3.70E+07 1.19E+07 1.04E+05 8.70E+04 1.93E+09
2.30E+09 9.50E+07 1.53E+07 1.20E+05 9.00E+04 2.24E+09
1.26E+09 7.40E+07 1.18E+07 8.30E+04 1.02E+05 1.53E+09
5.30E+08 5.60E+07 9.00E+06 7.00E+04 1.05E+04 6.00E+08
4.30E+08 5.00E+07 7.90E+06 7.90E+04 1.29E+04 8.00E+08
5.90E+08 4.50E+07 8.50E+06 8.10E+04 9.20E+03 7.30E+08
M1-1 1.19E+09 1.13E+08 6.70E+06 1.25E+05 1.10E+04 1.53E+09
1.19E+09 1.13E+08 5.30E+06 1.16E+05 2.00E+04 1.59E+09
1.23E+09 1.01E+08 5.10E+06 1.00E+05 3.70E+04 1.92E+09
4.50E+08 3.30E+07 5.70E+06 5.30E+04 8.00E+03 8.40E+08
4.00E+08 4.00E+07 5.30E+06 6.00E+04 6.00E+03 6.50E+08
5.70E+08 4.40E+07 5.00E+06 5.10E+04 5.90E+03 6.90E+08
MOA-5 9.90E+08 1.55E+07 1.00E+05 3.70E+04 5.70E+03 1.27E+09
1.16E+09 1.80E+07 8.50E+04 2.80E+04 5.40E+03 1.24E+09
8.40E+08 2.60E+07 7.00E+04 3.10E+04 6.90E+03 9.60E+08
2.60E+08 4.00E+06 2.00E+05 5.50E+04 5.70E+03 5.10E+08
3.60E+08 6.00E+06 3.00E+05 5.40E+04 5.40E+03 6.00E+08
3.10E+08 8.00E+06 1.00E+05 6.10E+04 6.00E+03 6.20E+08
MOA2-1 1.73E+09 2.07E+08 1.61E+07 9.40E+04 3.20E+04 1.85E+09
1.90E+09 2.23E+08 1.52E+07 8.70E+04 1.80E+04 2.20E+09
1.50E+09 1.24E+08 1.63E+07 7.50E+04 3.40E+04 2.18E+09
2.30E+08 7.90E+07 1.51E+07 4.90E+04 6.90E+03 6.90E+08
3.30E+08 5.90E+07 1.62E+07 5.10E+04 5.10E+03 7.00E+08
3.80E+08 6.00E+07 1.53E+07 5.50E+04 5.50E+03 6.10E+08
MOA2-5 2.01E+09 5.40E+07 1.50E+06 1.11E+05 3.00E+04 3.02E+09
2.09E+09 1.71E+08 8.30E+06 7.50E+04 3.20E+04 2.33E+09
1.80E+09 1.52E+08 6.30E+06 9.70E+04 2.90E+04 2.74E+09
4.50E+08 4.90E+07 8.53E+06 6.20E+04 9.00E+03 6.30E+08
3.30E+08 5.20E+07 8.30E+06 5.10E+04 1.10E+04 7.00E+08
4.00E+08 6.10E+07 7.30E+06 4.50E+04 8.20E+03 5.30E+08
E. Coli ATCC 25922 1.21E+09 8.90E+07 4.00E+05 1.60E+05 2.40E+04 1.54E+09
1.80E+09 9.00E+07 1.00E+05 1.70E+05 3.00E+03 1.64E+09
1.02E+09 8.00E+07 2.00E+05 1.37E+05 9.00E+03 1.64E+09
3.70E+08 6.00E+06 5.00E+05 3.30E+04 4.30E+03 6.10E+08
3.60E+08 8.00E+06 3.00E+05 5.40E+04 4.40E+03 5.00E+08
4.50E+08 5.00E+06 2.00E+05 6.00E+04 2.50E+06 7.10E+08
E. faecalis ATCC 29212 2.02E+09 6.90E+08 6.50E+08 1.00E+07 5.50E+06 3.00E+09
1.80E+09 1.01E+09 1.21E+09 7.60E+06 4.80E+06 2.90E+09
2.32E+09 8.90E+08 7.20E+08 6.00E+06 3.50E+06 3.05E+09
6.10E+08 2.50E+08 4.00E+07 2.23E+05 3.50E+06 1.27E+09
7.40E+08 2.00E+08 3.00E+07 2.00E+05 2.90E+06 1.15E+09
7.30E+08 1.90E+08 3.00E+07 2.10E+05 2.50E+06 1.00E+09

244
5.2 Effect of indigenous flora on the growth of Salmonella Birkenhead in biosolids
5.2.1 MAD output
CFU/mL Autoclaved MAD
Gammairradiated MAD
Non Autoclaved MAD
Nutrient broth
2.20E+07 7.70E+07 1.37E+05 3.60E+08 2.28E+07 9.00E+07 1.27E+05 4.00E+08 2.10E+07 7.90E+07 1.25E+05 4.70E+08 2.60E+07 7.90E+07 1.46E+05 4.50E+08 2.90E+07 8.60E+07 1.30E+05 3.90E+08 2.10E+07 7.30E+07 1.28E+05 3.80E+08
5.2.2 Pan samples, 24 hr. incubation
CFU/mL UEP UMP ULP AEP AMP ALP GEP GMP GLP 5.60E+04 1.70E+04 5.00E+04 2.60E+04 5.00E+05 4.10E+05 1.20E+07 1.30E+07 1.60E+07 5.30E+04 1.00E+04 3.90E+04 2.00E+04 4.50E+05 3.00E+05 1.40E+07 1.50E+07 1.50E+07 5.10E+04 1.00E+04 4.50E+04 2.50E+04 5.80E+05 3.90E+05 1.20E+07 1.70E+07 1.40E+07 1.00E+05 1.70E+04 2.90E+04 1.20E+04 6.80E+05 3.30E+05 1.60E+07 1.30E+07 1.20E+07 1.80E+05 1.80E+04 3.50E+04 1.00E+04 7.30E+05 2.10E+05 1.50E+07 1.60E+07 1.40E+07 1.00E+05 1.30E+04 4.60E+04 5.00E+03 6.20E+05 3.00E+05 1.60E+07 1.70E+07 1.60E+07
5.2.3 Pan samples, 48 hr. incubation
CFU/mL UEP UMP ULP AEP AMP ALP GEP GMP GLP 6.00E+04 1.20E+04 1.15E+05 4.30E+04 5.20E+06 1.00E+07 1.90E+07 1.85E+07 2.00E+07 6.20E+04 1.40E+04 1.20E+05 3.50E+04 4.90E+06 1.02E+07 1.80E+07 1.75E+07 2.00E+07 5.00E+04 1.50E+04 1.05E+05 5.50E+04 4.30E+06 9.00E+06 1.84E+07 1.78E+07 2.00E+07 2.60E+05 1.50E+04 3.40E+05 2.10E+05 1.04E+07 1.02E+07 1.00E+08 1.04E+08 1.27E+08 2.00E+05 2.10E+04 3.60E+05 1.50E+05 9.30E+06 8.40E+06 1.04E+08 1.03E+08 8.90E+07 3.00E+05 2.70E+04 4.00E+05 1.70E+05 1.06E+07 6.40E+06 9.40E+07 9.90E+07 9.90E+07
5.3 Effect of nutrients on the growth of Salmonella Birkenhead in biosolids
CFU/mL
NA A
NA+NB NB 2.40E+05 4.40E+07 5.60E+07 1.12E+09 2.00E+05 5.00E+07 4.60E+07 1.24E+09 2.80E+05 4.30E+07 4.50E+07 1.27E+09 1.80E+05 2.60E+07 6.10E+07 7.50E+08 1.62E+05 3.00E+07 5.20E+07 9.50E+08 1.50E+05 2.10E+07 4.70E+07 9.50E+08 2.30E+05 2.60E+07 1.80E+07 8.00E+08 2.00E+05 3.00E+07 1.90E+07 7.10E+08 2.60E+05 3.10E+07 1.80E+07 6.70E+08 2.40E+05 2.40E+07 1.20E+07 6.50E+08

245
3.00E+05 2.50E+07 1.30E+07 7.30E+08 2.50E+05 3.00E+07 1.40E+07 8.00E+08 3.10E+05 1.30E+07 1.90E+07 6.20E+08 2.20E+05 1.50E+07 2.00E+07 8.50E+08 2.30E+05 2.10E+07 1.20E+07 7.00E+08
6. Factors affecting coliphage die-off during MAD and pan drying
6.1 Enzyme concentration versus protease activity (PA) (U/mL)
Proteinase K concentration
PA (U/mL)
30µg/mL 30.3 30.7 30.9 30.3 30.7 31 50µg/mL 50 51.9 50.7 49.8 51.6 51.2 100µg/mL 67.5 69 69.3 67.8 69.5 76.9 500µg/mL 90.9 96.4 102.7 91.9 96.2 92.8 1000 µg/mL 100.8 104.6 112.9 110.8 114.4 119.6 EMADa 9.8 9.6 9.1 10 9.7 9.8 EPa 0.3 2 0.9 1.3 0.8 1 LPa 0.9 0.7 0.4 1 0.6 0.6
6.2 Protease activity (U/mL) in different sludge
Incubation time EMADa EPa LPa MMAD control (PK) 30 min 9.8 0.3 0.9
30.3
9.6 2 0.7
30.7
9.1 0.9 0.4 ND 30.9
10 1.3 1
30.3
9.7 0.8 0.6
30.7
9.8 1 0.6
31 Mean 10 1 1
31
STD 0.3 0.6 0.2
0.3 2 hr. 9.8 2.1 1.6 4.6 42.7
9.8 2 0.5 4.7 43.9
9.8 2 0.7 5 44.2
9.7 2 1.3 5 42.5
10.1 2.2 0.8 5 44.1
9.3 1.5 0.3 5 43.7
Mean 10 2 1 5 44 STD 0.3 0.2 0.5 0.2 0.7 20 hr. 37.9 27.3 13.3 16.3 83.5
37.8 28.1 13.4 16.5 90
35.3 27.5 13.2 16 88.9
38 28.3 13.4 16 83.6
38.8 28.5 13.5 16 89.9
35.6 27.6 13.2 16 88.9
Mean 37 28 13 16 87 STD 1.4 0.5 0.1 0.3 3.1 48 hr 57.1 44.7 18.3 29 87.9
59.3 47 22.7 29 88
59.5 49.8 21.4 29 90.4
58 44.7 18.3 28 87.9

246
59.6 47 22.7 28 88
60.5 49.8 21.4 28 90.4 Mean 59 47 21 29 89 STD 1.2 2.3 2.0 0.5 1.3 96 hr. 66.5 70.1 52.1 49 81.2
69.2 74.3 56.1 49.8 85.8
72.2 77.6 60.2 49.5 93
66.9 71.1 55.6 49 81.2
69.2 74.5 55.6 51 85.8
72.3 78 59.2 49 93
Mean 69 74 56 50 87 STD 2.5 3.2 2.9 0.6 5.3
6.3 Effect of pH and temperature on protease activity of different sludge extract
6.3.1 EMADb at 20ºC
pH value PA (U/mL) Mean STD
pH 4 3.90 4 0.89
3.10
3.30
5.10
5.20
4.40
pH 5 4.00 4 0.53
3.70
3.70
4.70
4.60
3.40
pH 6 4.00 5 1.43
3.90
3.60
7.20
6.10
4.80
pH 7 3.80 5 1.54
4.20
4.20
7.20
6.60
6.70
pH 8 7.50 7 1.23
6.60
7.20
6.00
9.50
8.10
pH 9 6.00 5 1.30
4.00
3.50
5.60
6.70

247
6.30
pH 10 3.90 5 0.90
4.00
3.80
4.80
5.10 6.10
6.3.2 EMADb at 37ºC
pH value PA(U/mL) Average STD pH 4 16.00 17 0.53
16.50
16.80
17.40
17.40
16.90
pH 5 17.80 18 0.26
17.50
17.60
17.80
17.40
17.10
pH 6 19.00 20 1.24
18.50
18.70
21.80
20.30
19.80
pH 7 22.00 22 0.78
21.10
22.00
23.20
23.10
22.20
pH 8 23.80 25 1.66
23.00
24.80
26.80
26.90
26.40
pH 9 20.40 23 1.66
21.50
21.70
24.10
24.60
23.50
pH 10 18.20 18 1.05
19.10
18.10
16.10
17.10

248
17.20
6.3.3 EPb at 20ºC
pH value PA (U/mL) Average STD
pH 4 14.70 14.00 1.037304
14.90
15.20
13.00
13.20
13.00
pH 5 13.70 11.65 1.85661
13.10
13.20
10.10
9.90
9.90
pH 6 14.60 13.13 2.21961
15.10
15.70
11.00
11.20
11.20
pH 7 15.40 13.13 3.04412
16.20
16.10
10.30
10.30
10.50
pH 8 21.10 16.40 5.11312
21.00
21.10
11.90
11.60
11.70
pH 9 17.80 14.52 3.209621
17.60
16.90
11.60
11.70
11.50
pH 10 16.60 13.37 3.506945
16.70
16.40
10.20
10.10 10.20

249
6.3.4 EPb at 37ºC
pH value PA(U/mL) Average STD pH 4 34.30 33.18 1.610486
34.60
34.90
31.90
32.30
31.10
pH 5 35.10 38.45 2.464752
36.90
37.00
39.70
41.20
40.80
pH 6 35.20 41.27 3.55115
40.00
40.30
43.50
43.90
44.70
pH 7 41.20 42.43 0.930949
42.60
42.80
41.40
43.10
43.50
pH 8 43.70 47.35 3.337514
45.00
44.30
50.00
50.70
50.40
pH 9 38.00 44.93 7.792732
38.90
38.80
45.00
54.00
54.90
pH 10 40.90 42.85 1.505656
41.30
42.80
43.50
43.80 44.80

250
6.3.5 LPb at 20ºC
pH value PA(U/mL) Average STD pH 4 7.60 9 0.87
9.80
9.30
9.90
9.50
9.80
pH 5 10.20 9 1.98
10.30
10.40
6.50
7.10
6.50
pH 6 7.70 7 0.35
7.80
7.50
7.10
7.40
6.90
pH 7 7.80 8 0.29
8.20
8.00
7.40
8.00
7.60
pH 8 10.50 11 0.19
10.60
10.70
10.80
10.30
10.80
pH 9 8.20 9 0.36
8.30
8.60
9.00
8.10
8.80
pH 10 9.60 9 0.55
9.30
9.30
8.70
8.10
9.30

251
6.3.6 LPb at 37ºC
pH value PA(U/mL) Average std pH 4 22.60 22 0.176068
22.30
22.60
22.20
22.40
22.60
pH 5 22.50 23 0.649359
23.40
22.80
23.70
22.10
22.20
pH 6 24.00 24 0.216795
23.80
24.20
24.20
24.40
24.30
pH 7 24.90 25 0.285774
25.50
25.70
25.10
25.30
25.40
pH 8 25.70 27 1.052616
26.00
26.00
27.20
27.60
28.30
pH 9 21.30 22 0.625033
22.20
22.60
21.30
22.70
21.70
pH 10 23.70 24 0.483391
24.10
23.70
24.10
22.80
23.90

252
6.4 Effect of MAD sludge extract, collected from Melton on MS2 die-off
Sample Time(hr.) PFU/mL PFU/mL PFU/mL PFU/mL PFU/mL PFU/mL 0 1.45E+05 1.28E+05 1.27E+05 3.85E+05 3.80E+05 4.70E+05 MMAD 4 5.05E+04 6.40E+04 8.20E+04 7.70E+04 8.80E+04 9.45E+04 8 8.15E+03 1.32E+04 1.53E+04 1.35E+04 1.48E+04 1.50E+04 22 1.50E+02 1.50E+02 5.00E+02 2.50E+02 4.00E+02 5.00E+02 27 0.00E+00 5.00E+01 0.00E+00 1.50E+01 6.00E+01 4.50E+01 Positive control 0 4.20E+06 3.75E+06 4.35E+06
Proteinase K 4 4.05E+05 5.35E+05 5.25E+05
8 1.36E+05 1.19E+05 1.24E+05 22 2.00E+02 5.00E+01 2.00E+02 27 5.00E+01 0.00E+00 5.00E+01 Negative
control 0 4.15E+06 4.15E+06 4.15E+06 TYGB 4 4.55E+06 4.55E+06 4.55E+06 8 3.40E+06 3.40E+06 3.40E+06 22 3.75E+06 3.75E+06 3.75E+06 27 3.80E+06 3.80E+06 3.80E+06
6.5 Effect of different sludge extract, collected from ETP on MS2 die-off
Sample Time PFU/mL PFU/mL PFU/mL PFU/mL PFU/mL PFU/mL EMADb 0 hr 1.10E+05 1.13E+05 1.10E+05 1.63E+05 1.61E+05 1.67E+05
4 hr 7.95E+04 6.00E+04 7.55E+04 1.03E+05 1.08E+05 1.02E+05
7 hr 3.80E+04 4.80E+04 4.20E+04 8.15E+04 8.55E+04 6.85E+04
22 hr 9.45E+02 7.80E+02 8.80E+02 5.25E+02 5.75E+02 6.25E+02
25 hr 4.30E+02 3.75E+02 4.20E+02 1.90E+02 1.75E+02 1.75E+02
EPb 0 hr 9.65E+04 1.13E+05 1.12E+05 1.82E+05 1.75E+05 1.77E+05
4 hr 5.00E+04 2.95E+04 4.25E+04 9.30E+04 8.65E+04 8.55E+04
7 hr 2.75E+04 2.80E+04 2.75E+04 6.35E+04 5.75E+04 5.65E+04
22 hr 1.35E+02 2.10E+02 1.35E+02 6.50E+01 6.50E+01 9.50E+01
25 hr 3.00E+01 5.00E+01 7.50E+01 2.00E+01 1.00E+01 3.00E+01
LPb 0 hr 1.09E+05 1.01E+05 1.05E+05 1.50E+05 1.76E+05 1.55E+05
4 hr 5.15E+04 5.90E+04 4.95E+04 9.10E+04 1.20E+05 1.00E+05
7 hr 3.95E+04 3.30E+04 3.20E+04 4.40E+04 5.90E+04 5.20E+04
22 hr 6.00E+02 5.80E+02 5.95E+02 7.00E+01 7.00E+01 8.00E+01
25 hr 1.85E+02 1.95E+02 1.80E+02 1.50E+01 5.00E+01 6.50E+01

253
List of Publications
Conference Proceedings
Oral Presentation
1. Mondal, T., D. A. Rouch, S. R. Smith, S. Ajami and M. Deighton. Evaluating factors in
the fate of pathogens during wastewater treatment. AWA Biosolids Specialty V Conference
June 2-4, 2010, Sydney.
2. Mondal, T., D. A. Rouch, V. Fleming, N. Thurbon, S. R. Smith, and M. Deighton.
Salmonella prevalence during sewage sludge treatment. Australia’s National Water
Conference and Exhibition, AWA, Ozwater May 9-11, 2011, Adelaide.
Poster Presentation
1. Mondal, T., D. A. Rouch, S. R. Smith, and M. Deighton. Protease activity in sewage
sludge and the effect of proteases on die-off of MS2 bacteriophages during sludge
treatment. Higher Degrees by Research Student Conference, October 21, 2011, RMIT
University.
Journal Paper
1. Rouch, D. A., T. Mondal, V. Flemming, F. Glauche, S. R. Smith, J. Blackbeard, and
M. Deighton. 2011. Microbial safety of air-dried and rewetted biosolids. Journal of Water
and Health 9: 403-414.

254