
Indicator A2 - OECD A2 (eng).pdf · Indicator A2 How many students are expected to complete upper...
21
2014 Education at a Glance 2014 OECD INDICATORS Education at a Glance 2014: OECD Indicators For more information on Education at a Glance 2014 and to access the full set of Indicators, visit www.oecd.org/edu/eag.htm. This work is published on the responsibility of the Secretary-General of the OECD. The opinions expressed and arguments employed herein do not necessarily reflect the official views of the Organisation or of the governments of its member countries. This document and any map included herein are without prejudice to the status of or sovereignty over any territory, to the delimitation of international frontiers and boundaries and to the name of any territory, city or area. You can copy, download or print OECD content for your own use, and you can include excerpts from OECD publications, databases and multimedia products in your own documents, presentations, blogs, websites and teaching materials, provided that suitable acknowledgement of OECD as source and copyright owner is given. All requests for public or commercial use and translation rights should be submitted to [email protected]. Requests for permission to photocopy portions of this material for public or commercial use shall be addressed directly to the Copyright Clearance Center (CCC) at [email protected] or the Centre français d’exploitation du droit de copie (CFC) at [email protected]. Indicator A2 How many students are expected to complete upper secondary education? Please cite this Indicator as: OECD (2014), “Indicator A2: How many students are expected to complete upper secondary education?”, in Education at a Glance 2014: OECD Indicators, OECD Publishing. http://dx.doi.org/10.1787/888933115122
Transcript of Indicator A2 - OECD A2 (eng).pdf · Indicator A2 How many students are expected to complete upper...

2014
Education at a Glance 2014OECD inDiCatOrs
Education at a Glance 2014: OECD IndicatorsFor more information on Education at a Glance 2014 and to access
the full set of Indicators, visit www.oecd.org/edu/eag.htm.
This work is published on the responsibility of the Secretary-General of the OECD. The opinions expressed and arguments employed herein do not necessarily reflect the official views of the Organisation or of the governments of its member countries.
This document and any map included herein are without prejudice to the status of or sovereignty over any territory, to the delimitation of international frontiers and boundaries and to the name of any territory, city or area.
You can copy, download or print OECD content for your own use, and you can include excerpts from OECD publications, databases and multimedia products in your own documents, presentations, blogs, websites and teaching materials, provided that suitable acknowledgement of OECD as source and copyright owner is given. All requests for public or commercial use and translation rights should be submitted to [email protected]. Requests for permission to photocopy portions of this material for public or commercial use shall be addressed directly to the Copyright Clearance Center (CCC) at [email protected] or the Centre français d’exploitation du droit de copie (CFC) at [email protected].
Indicator A2How many students are expected to complete
upper secondary education?
Please cite this Indicator as:
OECD (2014), “Indicator A2: How many students are expected to complete upper secondary education?”, in Education at a Glance 2014: OECD Indicators, OECD Publishing.http://dx.doi.org/10.1787/888933115122

IndIcator A2
Education at a Glance 2014: OECD Indicators © OECD 201454
How many students are expected to complete upper secondary education? • Based on current patterns, it is estimated that an average of 84% of today’s young people in
OECD countries will complete upper secondary education over their lifetimes; in G20 countries, some 80% of young people will.
• Young women are now more likely than young men to graduate from upper secondary programmes in almost all OECD countries, a reversal of the historical pattern.
• More than 10% of upper secondary graduates in Denmark, Finland, the Netherlands and Norway are 25 or older, while in Iceland nearly 20% are.
contextUpper secondary education, which consolidates students’ basic skills and knowledge through either an academic or a vocational pathway, aims to prepare students for entry into tertiary education or the labour market, and to become engaged citizens. In many countries, this level of education is not compulsory and can last from two to five years. What is crucial, however, is that these two pathways are of equal quality and that both ensure that students can make those transitions successfully.
Graduating from upper secondary education has become increasingly important in all countries, as the skills needed in the labour market are becoming more knowledge-based and as workers are progressively required to adapt to the uncertainties of a rapidly changing global economy. While graduation rates give an indication of the extent to which education systems are succeeding in preparing students to meet the labour market’s minimum requirements, they do not capture the quality of education outcomes.
By the end of lower secondary education in many OECD countries, students can exit or disengage from the education system, meaning, in turn, that they can leave school without an upper secondary qualification. These young people tend to face severe difficulties entering – and remaining in – the labour market. Leaving school early is a problem, both for individuals and society. Policy makers are examining ways to reduce the number of early school-leavers, defined as those students who do not complete their upper secondary education. Internationally comparable measures of how many students successfully complete upper secondary programmes – which also imply how many students do not complete those programmes – can assist efforts to that end.
100908070605040302010
0
% Total ≥25 years old <25 years old
Slov
enia
Icel
and
Ger
man
y
Net
herl
ands
Hun
gary
Uni
ted
Kin
gdom
Irel
and
Japa
n
Spai
n
Finl
and
Den
mar
k
Kor
ea
Nor
way
Cana
da1
Isra
el
Slov
ak R
epub
lic
New
Zea
land
Pola
nd
Chi
le
Ital
y
OEC
D a
vera
ge
Czec
h R
epub
lic
Uni
ted
Stat
es
Swed
en
Chi
na
Gre
ece
Luxe
mbo
urg
Aus
tria
2
Turk
ey
Mex
ico
Note: Only first-time graduates in upper secondary programmes are reported in this chart.1. Year of reference 2011.2. Programmes spanning ISCED levels 3 and 4 (Höhere berufsbildende Schule) not included.Countries are ranked in descending order of the upper secondary graduation rates in 2012.Source: OECD. Tables A2.1a and A2.1b. See Annex 3 for notes (www.oecd.org/edu/eag.htm).1 2 http://dx.doi.org/10.1787/888933115255
Chart A2.1. Upper secondary graduation rates (2012)

IndIcator A2
Education at a Glance 2014: OECD Indicators © OECD 2014 55
other findings• In 25 of 31 countries with available data, first-time upper secondary graduation rates equal
or exceed 75%. In Denmark, Finland, Germany, Hungary, Iceland, Ireland, Japan, Korea, Latvia, the Netherlands, Slovenia, Spain and the United Kingdom, graduation rates equal or exceed 90%.
• On average across OECD countries, students graduate for the first time at upper secondary level at the age of 19, from the age of 17 in Israel, New Zealand, Turkey and the United States, to the age of 22 or older in Iceland and Norway.
• More young women are graduating from vocational programmes than ever before. Their graduation rates from these programmes are now approaching those of young men.
• Most young men in upper secondary vocational programmes choose to study engineering, manufacturing and construction, while young women in such programmes opt for several different fields of study, notably business, law, social sciences, health and welfare, and services.
• This edition marks the third time that comparable data have been published from 29 countries that participated in a special survey on the successful completion of upper secondary programmes. The data show that 72% of students who begin upper secondary education complete the programmes they entered within the theoretical duration of the programme. However, there are large differences in completion rates, depending on gender and type of programme.
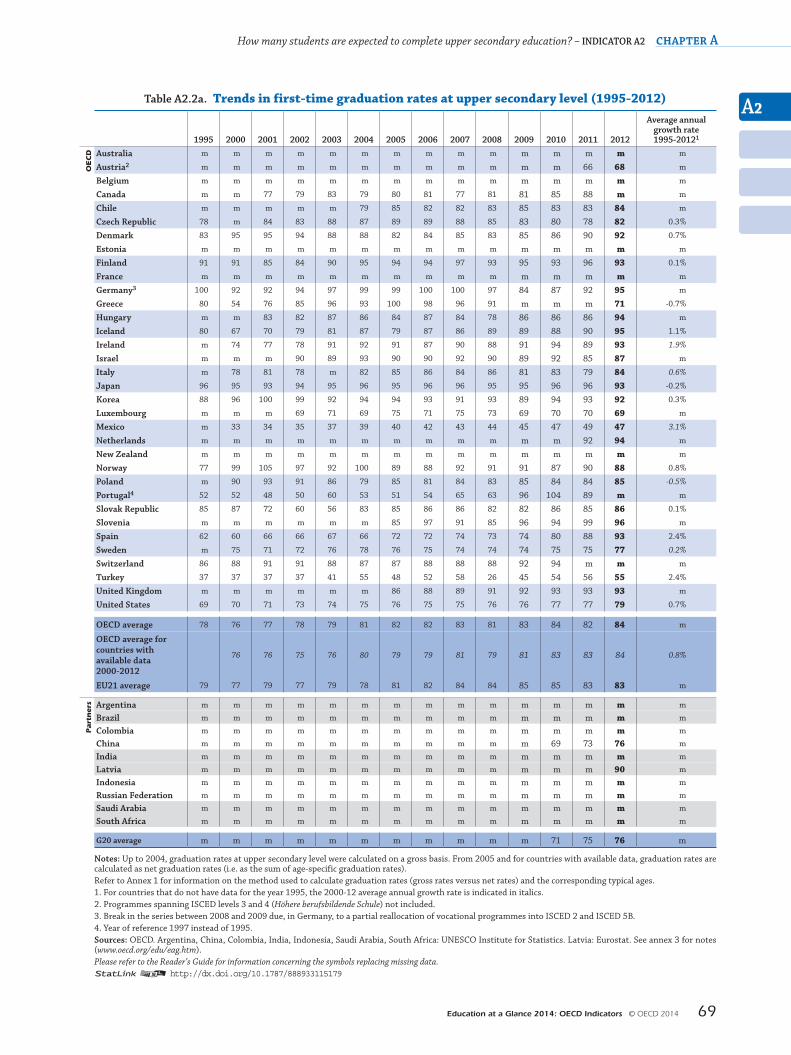
trendsSince 2000, upper secondary graduation rates have increased by an average of 8 percentage points among OECD countries with comparable data. The greatest increase occurred in Mexico, which showed an annual growth rate of 3% between 2000 and 2012.
noteGraduation rates represent the estimated percentage of people from a given age cohort that is expected to graduate at some point during their lifetime. This estimate is based on the number of graduates in 2012 and the age distribution of this group. Graduation rates are based on both the population and the current pattern of graduation, and are thus sensitive to any changes in the education system, such as the introduction of new programmes, and the lengthening or shortening of programme duration. Graduation rates can be very high – even above 100% – during a period when an unexpected number of people goes back to school. This happened in 2010 in Portugal, for example, when the “New Opportunities” programme was launched to provide a second chance for those individuals who left school early without a secondary diploma.
In this indicator, the age refers generally to the age of the students at the beginning of the calendar year; students could be one year older than the age indicated when they graduate at the end of the school year. Twenty-five is regarded as the upper age limit for completing initial education. Among OECD countries, more than 90% of first-time graduates from upper secondary programmes in 2012 were younger than 25. People who graduate from this level at age 25 or older are usually enrolled in specific programmes, e.g. second-chance programmes.

chapter A The Output of Educational Institutions and the Impact of Learning
A2
Education at a Glance 2014: OECD Indicators © OECD 201456
analysis
Graduation from upper secondary programmes
A snapshot of upper secondary graduation ratesSince 2000, first-time upper secondary graduation rates increased by 8 percentage points. Current estimates indicate that 84% of people will complete upper secondary education over their lifetime across OECD countries (Table A2.1a). Attaining an upper secondary education is often considered to be the minimum credential for successful entry into the labour market and needed to continue to further education. The costs, to both individuals and society, of not completing this level of education on time can be considerable (see Indicators A6 and A7).
Graduation rates offer an indication of whether government initiatives have been successful in increasing the number of people who graduate from upper secondary education. The great differences in graduation rates between countries reflect the variety of systems and programmes available.
In Denmark, Finland, Germany, Hungary, Iceland, Ireland, Latvia, Japan, Korea, the Netherlands, Slovenia, Spain and the United Kingdom, more than 90% of people are expected to graduate from upper secondary school during their lifetime; in Mexico and Turkey, less than 60% of people are expected to do so (Table A2.1a). Yet Mexico, Spain and Turkey show the highest average annual growth rates (from 1995 or 2000 to 2012) for upper secondary graduation – considerably above the OECD average of 0.8%. The annual growth rate in Spain and Turkey exceeds 2%, while in Mexico the annual increase is more than 3% (Table A2.2a). For some countries, the annual growth rate is low because they had earlier made it a priority to increase access to upper secondary education to a larger number of students. Thus, graduation rates in Japan, Korea and Norway had already reached 90% in 2000 and have remained at this level since then.
Vocational education and training (VET) is an important part of upper secondary education in many OECD countries (see Indicator A1). Between 2005 and 2012, graduation rates for pre-vocational and vocational programmes kept pace with overall upper secondary rates, increasing by about 3 percentage points, on average. However, countries vary considerably in these trends. In Germany, for example, upper secondary VET graduation rates shrunk by 15 percentage points during the period, while in Portugal they increased by 37 percentage points (Table A2.2b, available on line).
In addition, graduation rates do not imply that all graduates will pursue a tertiary degree or enter the labour force immediately. Indeed, the number of graduates who wind up neither employed nor in education or training (NEET) has been growing throughout OECD countries (see Indicator C5). For this reason, it is important to have quality upper secondary programmes that provide individuals with the right mix of guidance and education opportunities to ensure that there are no dead-ends once students have graduated.
Upper secondary graduation rates, by ageGraduation rates also vary according to the age of the graduates. As indicated in the note section above, a student’s age at graduation can be related to changes in the education system. For example, opportunities available to complete upper secondary education later on in life or the duration of general and vocational programmes can lead to differences in the typical age of graduates.
The average age of a first-time upper secondary graduate in OECD countries is 19; more than 90% of first-time graduates are 25 or younger. However, the age at which students graduate from upper secondary education varies between countries, sometimes significantly. In Israel, New Zealand, Turkey and the United States, the average age of a first-time graduate is 17 – the youngest age among all OECD countries. Iceland and Norway are at the opposite extreme, with an average age of 22 or higher (Tables A2.1a and b).
Variations in the age of graduates are found within countries as well. As shown in Chart A2.2, there are marked differences between the ages of students graduating from vocational programmes and those graduating from general programmes within the same country. On average, the age at graduation is higher for vocational graduates (22 years old) than for graduates of general programmes (19 years old). However, in Belgium, Brazil, Denmark, Finland, Iceland, Ireland, the Netherlands and Norway, the average age of graduates from vocational programmes is 25 or older; in Australia, it reaches 31 (Chart A2.2).
The average age of first-time graduates also reflects specific national contexts. In some countries, systems are flexible enough to allow students who left the education system early to re-enter later on. That is why graduation rates for students 25 years or older are relatively high in Denmark, Finland, the Netherlands and Norway, where

A2
How many students are expected to complete upper secondary education? – IndIcAtor A2 chapter A
Education at a Glance 2014: OECD Indicators © OECD 2014 57
at least 10% of graduates are older than 25, while in Iceland, 20% of upper secondary graduates are older than 25. Likewise, the fact that the proportion of graduates outside the typical age at graduation varies between countries and programmes may also be related to the availability of “second-chance” programmes. These types of programmes help to improve skills for the labour market. In Portugal, for example, the “New Opportunities” programme, launched in 2005, was introduced to provide a second chance to individuals who left school early or were at risk of doing so, and to assist those in the labour force who want to acquire further qualifications. As a result of this initiative, graduation rates rose by more than 40 percentage points between 2008 and 2010. In 2010, more than 40% of the students concerned were older than 25.
1 2 http://dx.doi.org/10.1787/888933115274
Chart A2.2. Average age1 of upper secondary graduation (2012)
General programmes Vocational programmes
32
30
28
26
24
22
20
18
16
Age
Port
ugal
Icel
and
Pola
nd
Braz
il
Swit
zerl
and
Finl
and
Hun
gary
Den
mar
k
Nor
way
Irel
and
Chi
le
Czec
h R
epub
lic
OEC
D a
vera
ge
Slov
ak R
epub
lic
Belg
ium
Ital
y
Swed
en
Luxe
mbo
urg
Slov
enia
Esto
nia
Cana
da2
Aus
tria
3
Mex
ico
Indo
nesi
a
New
Zea
land
Fran
ce
Arg
enti
na2
Uni
ted
Stat
es
Net
herl
ands
Turk
ey
Isra
el
Aus
tral
ia2
1. �e average age refers generally to the age of the students at the beginning of the calendar year; students could be one year older than the age indicated when they graduate at the end of the school year.2. Year of reference 2011.3. Programmes spanning ISCED levels 3 and 4 (Höhere berufsbildende Schule) not included.Countries are ranked in descending order of the average age for upper secondary graduation in general programmes in 2012.Source: OECD. Table A2.1a. See Annex 3 for notes (www.oecd.org/edu/eag.htm).
Upper secondary graduation rates, by genderIn most OECD countries, first-time upper secondary graduation rates also vary significantly between men and women. On average, graduation rates for women (87%) are higher than those for men (81%). In Denmark, Greece, Iceland, Israel and Norway, graduation rates for women are at least 10 percentage points higher than those for men. Only in Austria and Germany is the proportion of male graduates higher than that of female graduates (Table A2.1a).
This tendency is even starker among students younger than 25 who graduate from general programmes. In 2012, graduation rates from general upper secondary programmes were 54% for women and 43% for men, on average across OECD countries. In Austria, the Czech Republic, Italy, Poland, the Slovak Republic and Slovenia, women outnumber men as graduates by at least three to two (Table A2.1b).
Traditionally, men have had higher graduation rates than women for pre-vocational and vocational programmes, although in some countries this is not the case. On average, graduation rates from these programmes are higher for men than for women by 3 percentage points (50% and 46%, respectively). This tendency has been changing in many countries, including Belgium, Denmark, Finland, Ireland, the Netherlands and Spain, where graduation rates for women are at least 5 percentage points higher than those for men. However, vocational programmes are not available to the same extent in all countries, thus graduation rates can differ substantially. Pre-vocational and vocational graduation rates are over 70% in Austria, Finland, France, Ireland, the Netherlands, Slovenia and Switzerland; but in Argentina, Brazil, Canada, Estonia, Hungary, Indonesia, Japan, Korea, Latvia, Mexico and Turkey, the rates are below 30% (Table A2.1a).

chapter A The Output of Educational Institutions and the Impact of Learning
A2
Education at a Glance 2014: OECD Indicators © OECD 201458
Upper secondary graduation and field of educationGender differences are also apparent in young people’s choice of field of study when pursuing vocational education. These differences can be attributed to traditional perceptions of gender roles and identities as well as the cultural values sometimes associated with particular fields of education. On average across OECD countries, the largest share of students in upper secondary vocational education graduates from engineering, manufacturing and construction programmes (34%), and, most of the graduates from those programmes are men (Tables A2.3a and b, available on line). In the Czech Republic, Hungary and Norway, 70% or more of graduates from this field are men. By contrast, female graduates are more dispersed among social sciences, business and law (24%), health and welfare (19%) and services (19%) (Table A2.3a).
Graduation from post-secondary non-tertiary programmes
Various kinds of post-secondary non-tertiary programmes are offered in OECD countries. These programmes straddle upper secondary and post-secondary education and may be considered either as upper secondary or post-secondary programmes, depending on the country concerned. Although the content of these programmes may not be significantly more advanced than upper secondary programmes, they broaden the knowledge of individuals who have already attained an upper secondary qualification.
Students in these programmes tend to be older than those enrolled in upper secondary schools. These programmes usually offer trade and vocational certificates, and include nursery-teacher training in Austria and vocational training in the dual system for those who have attained general upper secondary qualifications in Germany. Apprenticeships designed for students who have already graduated from an upper secondary programme are also included among these programmes (Table A2.1c, available on line).
First-time graduation rates from post-secondary non-tertiary education are low compared with those from upper secondary programmes. On average, it is estimated that 9% of today’s young people in OECD countries will complete post-secondary non-tertiary programmes over their lifetime. The rate for women (9%) is slightly higher than that for men (8%). The highest graduation rates for these programmes are in Austria (26%), the Czech Republic (28%) and New Zealand (33%); and in these three countries, graduation rates are considerably higher among women (32%, 32% and 39%, respectively) than men (20%, 24% and 27%, respectively) (Table A2.1c, available on line).
Transitions following upper secondary education or post-secondary non-tertiary programmes
The vast majority of students who graduate from upper secondary education graduate from programmes designed to provide access to tertiary education (ISCED 3A and 3B). Programmes that facilitate direct entry into tertiary-type A education (ISCED 3A) are preferred by students in all countries except Austria, Slovenia and Switzerland, where the education systems are more strongly oriented towards vocational education and thus more young people graduate from an upper secondary education that leads to tertiary-type B programmes. For long upper secondary programmes that lead to the labour market or to post-secondary non-tertiary education (ISCED 3C long), graduation rates in 2012, averaged 18% in OECD countries (Table A2.1a).
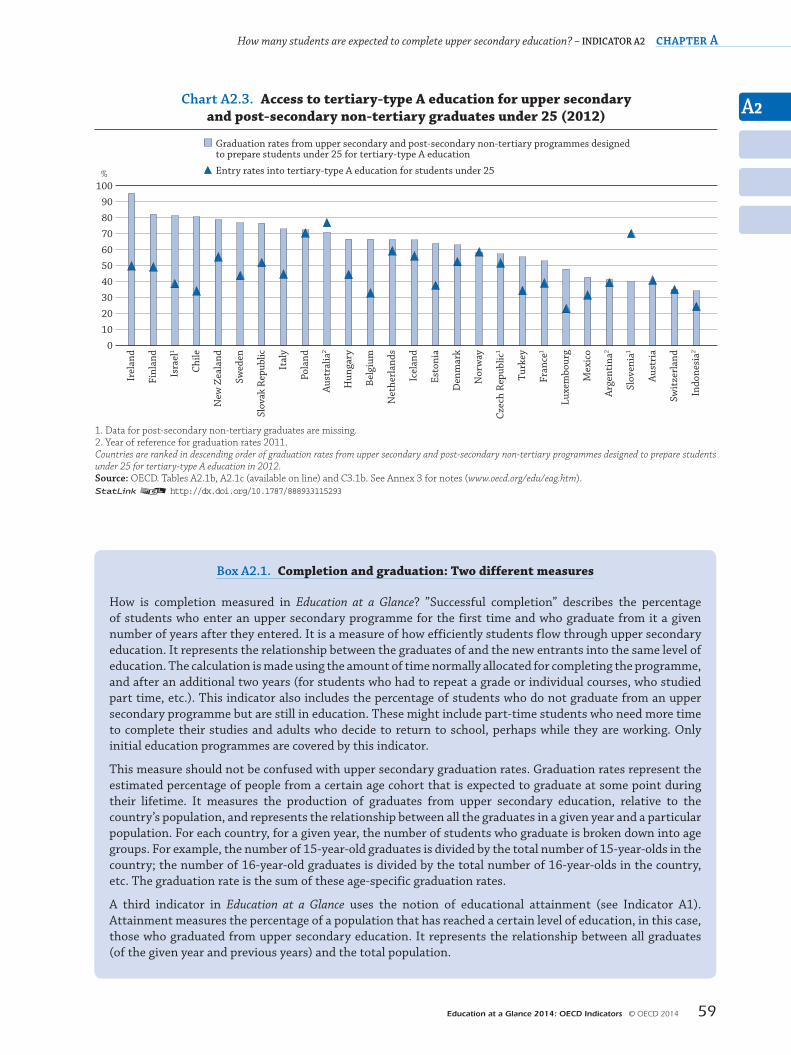
Chart A2.3 shows how countries vary when the proportion of students who graduate from programmes designed as preparation for entry into tertiary-type A programmes (ISCED 3A and 4A) are compared with the proportion of students who actually enter these programmes under the age of 25. In Belgium, Chile, Finland, Ireland, Israel and Sweden, there is at least a 30 percentage-point difference between these two groups. This suggests that many students who attain qualifications that would allow them to enter tertiary-type A programmes do not do so, although upper secondary programmes in Belgium and Israel also prepare students for tertiary-type B programmes. Much like the decision to continue on to upper secondary education, students’ decision to enter tertiary education might depend on various factors, including the opportunity cost of investing in tertiary education compared to entering the labour market (Zapata, forthcoming) (see Indicator A7).
In Finland, upper secondary education includes vocational training, and many graduates enter the labour market immediately after completing this level, without any studies at the tertiary level. There is also a numerus clausus system in Finnish higher education, which means that the number of entry places is restricted. Therefore, graduates from upper secondary general education may have to take a break of two to three years before obtaining a place in a university or polytechnic institution. In Ireland, the majority of secondary students take the “Leaving Certificate Examination” (ISCED 3A). Although this is designed to allow students to enter tertiary education, not all of the students who take this examination intend to do so. Until the onset of the global economic crisis, school-leavers in Ireland could benefit from a strong labour market, and this also may have had an impact on the difference.
A2
How many students are expected to complete upper secondary education? – IndIcAtor A2 chapter A
Education at a Glance 2014: OECD Indicators © OECD 2014 59
Box A2.1. Completion and graduation: Two different measures
How is completion measured in Education at a Glance? ”Successful completion” describes the percentage of students who enter an upper secondary programme for the first time and who graduate from it a given number of years after they entered. It is a measure of how efficiently students flow through upper secondary education. It represents the relationship between the graduates of and the new entrants into the same level of education. The calculation is made using the amount of time normally allocated for completing the programme, and after an additional two years (for students who had to repeat a grade or individual courses, who studied part time, etc.). This indicator also includes the percentage of students who do not graduate from an upper secondary programme but are still in education. These might include part-time students who need more time to complete their studies and adults who decide to return to school, perhaps while they are working. Only initial education programmes are covered by this indicator.
This measure should not be confused with upper secondary graduation rates. Graduation rates represent the estimated percentage of people from a certain age cohort that is expected to graduate at some point during their lifetime. It measures the production of graduates from upper secondary education, relative to the country’s population, and represents the relationship between all the graduates in a given year and a particular population. For each country, for a given year, the number of students who graduate is broken down into age groups. For example, the number of 15-year-old graduates is divided by the total number of 15-year-olds in the country; the number of 16-year-old graduates is divided by the total number of 16-year-olds in the country, etc. The graduation rate is the sum of these age-specific graduation rates.
A third indicator in Education at a Glance uses the notion of educational attainment (see Indicator A1). Attainment measures the percentage of a population that has reached a certain level of education, in this case, those who graduated from upper secondary education. It represents the relationship between all graduates (of the given year and previous years) and the total population.
1 2 http://dx.doi.org/10.1787/888933115293
Chart A2.3. Access to tertiary-type A education for upper secondary and post-secondary non-tertiary graduates under 25 (2012)
100
90
80
70
60
50
40
30
20
10
0
%
Irel
and
Finl
and
Isra
el1
Chi
le
New
Zea
land
Swed
en
Slov
ak R
epub
lic
Ital
y
Pola
nd
Aus
tral
ia2
Hun
gary
Belg
ium
Net
herl
ands
Icel
and
Esto
nia
Den
mar
k
Nor
way
Czec
h R
epub
lic1
Turk
ey
Fran
ce1
Luxe
mbo
urg
Mex
ico
Arg
enti
na2
Slov
enia
1
Aus
tria
Swit
zerl
and
Indo
nesi
a2
1. Data for post-secondary non-tertiary graduates are missing.2. Year of reference for graduation rates 2011.Countries are ranked in descending order of graduation rates from upper secondary and post-secondary non-tertiary programmes designed to prepare students under 25 for tertiary-type A education in 2012.Source: OECD. Tables A2.1b, A2.1c (available on line) and C3.1b. See Annex 3 for notes (www.oecd.org/edu/eag.htm).
Graduation rates from upper secondary and post-secondary non-tertiary programmes designed to prepare students under 25 for tertiary-type A education
Entry rates into tertiary-type A education for students under 25

chapter A The Output of Educational Institutions and the Impact of Learning
A2
Education at a Glance 2014: OECD Indicators © OECD 201460
In contrast, in Slovenia, the upper secondary and post-secondary non-tertiary graduation rate is markedly lower – by 30 percentage points – than entry rates into tertiary-type A programmes. Although many students in Slovenia are more likely to graduate from upper secondary programmes leading to tertiary-type B programmes, some may choose to pursue university studies later, and can do so because of the flexible pathways between the two types of tertiary programmes in the country.
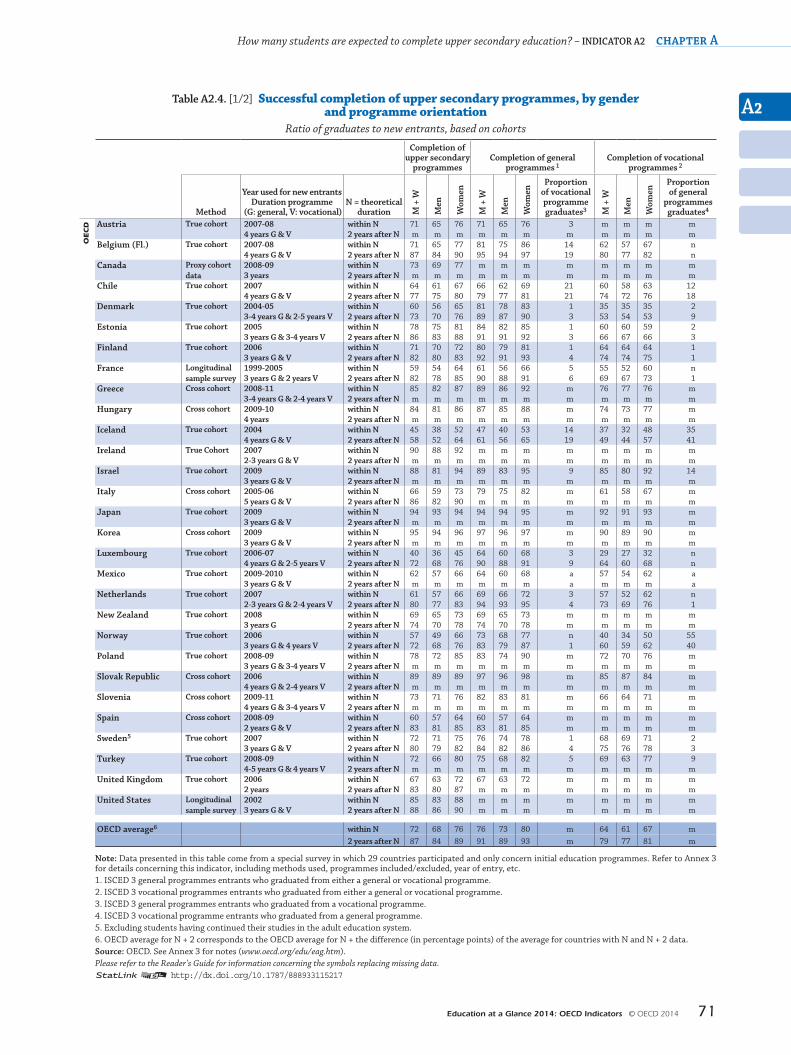
Successful completion of upper secondary programmes
This edition of Education at a Glance presents, for the third time, an indicator to measure the successful completion of upper secondary programmes and, thus, the pathways between programmes. The indicator sheds light on the time needed to complete these programmes and the proportion of students still in education after the theoretical duration of programmes. It allows for an estimation of the number of students who drop out and a comparison of completion rates by gender and programme orientation. Thus, like the graduation rate, the completion rate does not indicate the quality of upper secondary education; it does, however indicate to a certain extent the capacity of this education level to engage students to complete upper secondary programmes within a specific period.
The majority of students who start upper secondary education complete the programmes they entered. It is estimated that 72% of young men and women who begin an upper secondary programme graduate within the theoretical duration of the programme. However, in some countries, it is relatively common for students and apprentices to take a break from their studies and leave the education system temporarily. Some return quickly to their studies, while others stay away for longer periods of time, which can increase students’ risk of not completing upper secondary education. In other countries, it is also common for students to repeat a grade or to change programmes; by doing so, their graduation is delayed. System-level policies, such as grade repetition, can undermine equity in the education system (OECD, 2012a).
The proportion of students who complete their education in the stipulated time varies considerably among countries, with Korea having the highest share (95%), and Luxembourg the lowest share (40%). In Greece, Hungary, Ireland, Israel, Japan, Korea, the Slovak Republic and the United States, over 80% of students complete their education in the stipulated time. Giving two extra years to students to complete their upper secondary programmes, 87% of students successfully complete programmes two years after the stipulated time of graduation, on average across OECD countries – 15 percentage points more than the proportion of students who complete their programme within its theoretical duration (Table A2.4). With the extra two years, eight more countries pass the upper secondary completion bar of 80%: the Flemish Community of Belgium, Estonia, Finland, France, Italy, the Netherlands, Spain and the United Kingdom. Iceland has the smallest proportion of students (58%) who complete upper secondary education after two extra years.
1 2 http://dx.doi.org/10.1787/888933115312
Chart A2.4. Successful completion of upper secondary programmes
Completion after N years Completion after N+2 years
100908070605040302010
0
%
Kor
ea1
Japa
n1
Irel
and1
Slov
ak R
epub
lic1
Isra
el1
Uni
ted
Stat
es
Gre
ece1
Hun
gary
1
Esto
nia
Pola
nd1
Slov
enia
1
Cana
da1
Swed
en
Turk
ey1
OEC
D a
vera
ge
Aus
tria
1
Belg
ium
(Fl.)
Finl
and
New
Zea
land
Uni
ted
Kin
gdom Ital
y
Chi
le
Mex
ico1
Net
herl
ands
Spai
n
Den
mar
k
Fran
ce
Nor
way
Icel
and
Luxe
mbo
urg
Note: Please refer to Annex 3 for details concerning this indicator, including methods used, programmes included/excluded, year of entry, etc.1. N+2 information missing.Countries are ranked in descending order of the successful completion of upper secondary programmes.Source: OECD. Table A2.4. See Annex 3 for notes (www.oecd.org/edu/eag.htm).
(N = theoritical duration of the programmes)

A2
How many students are expected to complete upper secondary education? – IndIcAtor A2 chapter A
Education at a Glance 2014: OECD Indicators © OECD 2014 61
Within countries, the difference in rates between completion within the stipulated time and within two additional years is partly due to the fact that in most OECD countries, students may attend regular educational institutions for additional years to complete their upper secondary education, whereas in some other countries, older students must attend special programmes designed specifically for them. The difference in the proportion of students who completed their programmes within the stipulated time and that of students who completed after two additional years is 32 percentage points in Luxembourg, where it is common for students to repeat one or more years of school. In contrast, among countries with available data, the difference in New Zealand and in the United States is as low as five and three percentage points, respectively (Chart A2.4). In the United States, it is highly unusual for students over the age of 20 to be enrolled in a regular high school programme; students who do not graduate within the stipulated time can obtain an equivalent high school qualification by successfully passing the General Educational Development (GED) test.
Successful completion of upper secondary education also depends on how accessible these programmes are. In all of the countries with available data, except Mexico and Turkey, upper secondary entry rates for students under age 20 are around or over 90%. It is reasonable to expect that a higher percentage of students will graduate from upper secondary education in countries with limited access to this level than in countries that have nearly universal access. In other words, countries where students have to pass an examination or are academically selected to enter upper secondary programmes may have a larger share of higher-achieving students moving on to these programmes, which could produce a higher completion rate (Table A2.4). The selectivity of programmes can hinder equity in the education as access to programmes might be limited.
Successful completion by genderIn all countries with available data, young men are more likely than young women to not complete their upper secondary education on time. On average, 76% of young women complete their upper secondary education within the stipulated time, compared to 68% of young men. Only in Finland, Greece, Ireland, Japan, Korea, the Slovak Republic and Sweden is the difference in the proportions of young men and women who do not complete their upper secondary education less than five percentage points. In Iceland, Italy, Norway and Turkey, young women outnumber young men who successfully completed upper secondary education by more than 14 percentage points (Chart A2.5). The gender differences seen in Norway are likely due to the fact that young women tend to have better academic performance than young men in lower secondary school. Controlling for performance in lower secondary school, there is no gender difference, or just a small advantage for young men (Falch et al., 2010).
1 2 http://dx.doi.org/10.1787/888933115331
Chart A2.5. Successful completion of upper secondary programmes, by gender
100
80
60
40
20
0
%
Kor
ea1
Japa
n
Isra
el1
Irel
and1
Slov
ak R
epub
lic1
Uni
ted
Stat
es
Gre
ece1
Hun
gary
1
Pola
nd1
Esto
nia
Turk
ey1
Belg
ium
(Fl.)
Cana
da1
Slov
enia
1
Aus
tria
1
OEC
D a
vera
ge
Swed
en
Ital
y
New
Zea
land
Finl
and
Uni
ted
Kin
gdom
Chi
le
Net
herl
ands
Nor
way
Mex
ico1
Den
mar
k
Fran
ce
Spai
n
Icel
and
Luxe
mbo
urg
1. N+2 information missing. Countries are ranked in descending order of the successful completion of girls in upper secondary programmes (after N years).Source: OECD. Table A2.4. See Annex 3 for notes (www.oecd.org/edu/eag.htm).
Girls completion after N years Boys completion after N yearsGirls completion after N+2 years Boys completion after N+2 years
(N = theoritical duration of the programmes)

chapter A The Output of Educational Institutions and the Impact of Learning
A2
Education at a Glance 2014: OECD Indicators © OECD 201462
The gender gap narrowed slightly, to an average of five percentage points, when completion was delayed by two years. The difference in completion rates between the stipulated time and the two additional years is larger among young men (16 percentage points) than among young women (13 percentage points). The narrowing of the gender gap could be related to a high incidence of grade repetition or transfer to a different programme, or to economic and socio-cultural factors that could extend the time needed by young men to complete a degree beyond a programme’s stipulated duration (OECD, 2012b).
The gender gap also varies depending on the programme: 80% of young women complete general programmes, compared to 73% of young men; 67% of young women complete vocational programmes, compared to 61% of young men. In vocational programmes in Iceland, this gender gap widens to more than 16 percentage points, in favour of young women. Only in Estonia, Greece and the Slovak Republic, young women in vocational programmes are not as successful as young men in completing their upper secondary education within the normal duration of the programmes (Table A2.5).
Many studies, including the OECD Programme for International Student Assessment (PISA) analyses, confirm that young women in OECD countries are more likely to perform better and less likely than young men to leave school early (OECD, 2012a; OECD, 2012b; OECD, 2014). That said, young women who do leave school early tend to have poorer outcomes than their male counterparts, despite their higher average attainment (see Indicators A1 and C5). The completion rate for upper secondary programmes and engagement of students in education are also linked to many other issues, such as social pressures from family and friends, prior academic experiences, and physical and emotional changes (OECD, 2012a; Zapata, forthcoming) as well as to their parents’ educational attainment and immigrant background (Box A2.2).
Successful completion by programme orientationStudents enter general or vocational programmes at different points in their educational careers, depending on the country. In countries with a comprehensive system, students follow a common core curriculum until the start of upper secondary education at the age of 16 (e.g. the Nordic countries); in countries with a highly differentiated system, the choice of a particular programme or type of school can be made during lower secondary education from the age of 10-13 onwards (e.g. Luxembourg).
1 2 http://dx.doi.org/10.1787/888933115350
Chart A2.6. Successful completion of upper secondary programmes, by programme orientation and duration
100
80
60
40
20
0
%
Note: Please refer to Annex 3 for details concerning this indicator, including methods used, programmes included/excluded, year of entry, etc.1. N+2 information missing.2. 2 years programmes instead of 3 for vocational programmes.3. 2 years programmes instead of 3 for general programmes.Countries are ranked in descending order of the successful completion of upper secondary general programmes (after N years).Source: OECD. Table A2.5. See Annex 3 for notes (www.oecd.org/edu/eag.htm).
Completion general progammes 3 yearsCompletion general progammes 3 years (N+2)
Completion vocational progammes 3 years Completion vocational progammes 3 years (N+2)
Completion general progammes 4 years Completion vocational progammes 4 years
(N: �eoritical duration of the programmes)
Completion general progammes 4 years (N+2) Completion vocational progammes 4 years (N+2)
Slov
ak R
epub
lic1
Japa
n1
Isra
el1
Gre
ece1
Hun
gary
1
Esto
nia
Pola
nd1
Slov
enia
1
Belg
ium
(Fl.)
Den
mar
k
Finl
and
Swed
en
Turk
ey1
Nor
way
Aust
ria1
Net
herla
nds
New
Zea
land
Chile
Mex
ico1
Luxe
mbo
urg
Fran
ce2
Spai
n3

A2
How many students are expected to complete upper secondary education? – IndIcAtor A2 chapter A
Education at a Glance 2014: OECD Indicators © OECD 2014 63
In several countries, general and vocational programmes are organised separately and students have to opt for one or the other. This is the case for such countries as Germany and France, where upper secondary pathways are clearly differentiated. In other countries, upper secondary education is comprehensive and there is less separation between general and vocational programmes, such as in Sweden. Despite the arrangement of upper secondary programmes, countries offer students opportunities to change pathways, such as in Finland and the Netherlands. Flexibility between vocational and general pathways can accommodate those students who might want to change orientation and pursue a different upper secondary programme (OECD, 2012a).
Students who enter general programmes are more likely to graduate than those who are enrolled in vocational programmes. Among the 26 countries with available data, 76% of students completed their general programme within the theoretical duration of the programme, and that proportion increased by 15 percentage points among students who completed their programme two years after its stipulated duration.
In contrast, only 64% of students completed their vocational programme within the theoretical duration; that proportion increased by 15 percentage points two years after the stipulated time. While the average difference between completion rates for general and vocational upper secondary programmes is 13 percentage points, differences ranges from more than 40 percentage points in Denmark, to 5 percentage points or less in Chile, Israel and Japan (Table A2.5).
The large difference in completion rates between upper secondary general and vocational programmes among countries can be explained by the fact that in some countries, low-achieving students may be oriented (or reoriented) into vocational programmes, while higher-achieving students go into general programmes. Some students may also have difficulty determining which vocational programme is best for them and thus may have to repeat one or more grades at this level of education. They may also face difficulties finding an employer who will agree to offer an apprenticeship programme, may have to wait for a place in such a programme to become available, or may give up trying.
Pathways between these two types of education are well developed in some countries. In Norway, for example, among the 40% of students who entered a vocational programme and graduated within the stipulated time, 45% graduated with a vocational degree and 55% changed programmes and graduated with a general diploma. In Chile, of the 66% of students who entered a general programme and graduated within the stipulated time, 79% graduated with a general degree, and 21% changed programmes and graduated with a vocational diploma (Table A2.5).
Some students who begin a vocational programme may leave the education system to enter the labour market directly. The attractiveness of employment opportunities can play a role in students’ disengagement from the education system, particularly those students in the later grades of upper secondary education (Stearns et al., 2006 in Zapata, forthcoming). Access to employment for people with low educational attainment could also affect successful completion rates and the incidence of dropping out.
Among students who do not complete their programmes within the stipulated time, 56% of those who follow a general programme are still in education, compared to only 43% of those who follow a vocational programme. There is large variation among countries: in Belgium (Flemish Community), Finland, France and Luxembourg, 80% or more of students who had not graduated after the theoretical duration of general programmes are still in education, compared to 10% in Israel and only 7% in Korea (Table A2.5).
The picture is slightly different when it comes to completion of upper secondary programmes (general and vocational) by programme duration. The duration of upper secondary programmes varies among countries: from two years in the Netherlands and Spain for general programmes to five years in Luxembourg for vocational programmes (Table A2.5). One would assume that completion rates for programmes of longer duration will be lower than those for programmes of shorter duration. However, Chart A2.6 shows that this assumption does not hold. For example, the duration of general upper secondary programmes in Spain is two years, while in other OECD countries it is between three and four years. With a successful completion rate of 60% after N years, Spain has a low completion rate (which increases substantially after two years to 83%). In contrast, the duration of general programmes in Hungary is four years, and the successful completion rate of 87% for that country is one of the highest. The accessibility of the programmes and the academic selectivity of the education system might explain the high completion rates for programmes of longer duration. The engagement of students and the quality of upper secondary teaching and learning environments are also key for completion.
chapter A The Output of Educational Institutions and the Impact of Learning
A2
Education at a Glance 2014: OECD Indicators © OECD 201464
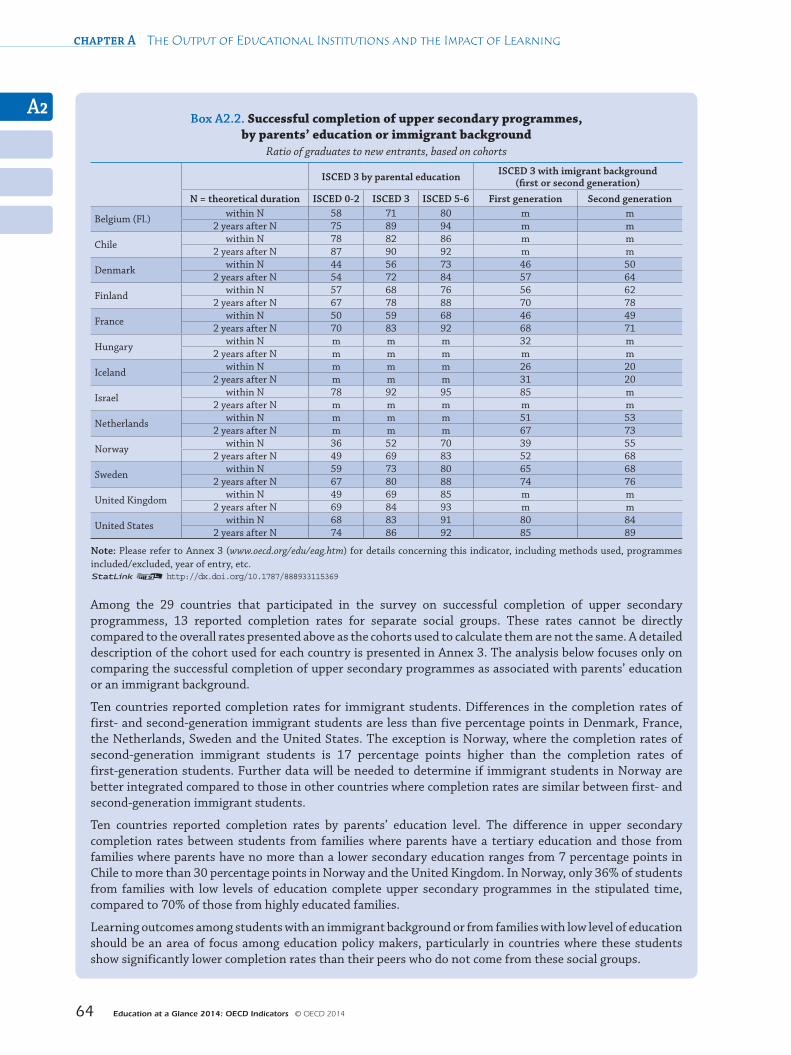
Box A2.2. Successful completion of upper secondary programmes, by parents’ education or immigrant background
Ratio of graduates to new entrants, based on cohorts
ISCED 3 by parental education ISCED 3 with imigrant background (first or second generation)
N = theoretical duration ISCED 0-2 ISCED 3 ISCED 5-6 First generation Second generation
Belgium (Fl.) within N 58 71 80 m m2 years after N 75 89 94 m m
Chile within N 78 82 86 m m2 years after N 87 90 92 m m
Denmark within N 44 56 73 46 502 years after N 54 72 84 57 64
Finland within N 57 68 76 56 622 years after N 67 78 88 70 78
France within N 50 59 68 46 492 years after N 70 83 92 68 71
Hungary within N m m m 32 m2 years after N m m m m m
Iceland within N m m m 26 202 years after N m m m 31 20
Israel within N 78 92 95 85 m2 years after N m m m m m
Netherlands within N m m m 51 532 years after N m m m 67 73
Norway within N 36 52 70 39 552 years after N 49 69 83 52 68
Sweden within N 59 73 80 65 682 years after N 67 80 88 74 76
United Kingdom within N 49 69 85 m m2 years after N 69 84 93 m m
United States within N 68 83 91 80 842 years after N 74 86 92 85 89
Note: Please refer to Annex 3 (www.oecd.org/edu/eag.htm) for details concerning this indicator, including methods used, programmes included/excluded, year of entry, etc.1 2 http://dx.doi.org/10.1787/888933115369
Among the 29 countries that participated in the survey on successful completion of upper secondary programmess, 13 reported completion rates for separate social groups. These rates cannot be directly compared to the overall rates presented above as the cohorts used to calculate them are not the same. A detailed description of the cohort used for each country is presented in Annex 3. The analysis below focuses only on comparing the successful completion of upper secondary programmes as associated with parents’ education or an immigrant background.
Ten countries reported completion rates for immigrant students. Differences in the completion rates of first- and second-generation immigrant students are less than five percentage points in Denmark, France, the Netherlands, Sweden and the United States. The exception is Norway, where the completion rates of second-generation immigrant students is 17 percentage points higher than the completion rates of first-generation students. Further data will be needed to determine if immigrant students in Norway are better integrated compared to those in other countries where completion rates are similar between first- and second-generation immigrant students.
Ten countries reported completion rates by parents’ education level. The difference in upper secondary completion rates between students from families where parents have a tertiary education and those from families where parents have no more than a lower secondary education ranges from 7 percentage points in Chile to more than 30 percentage points in Norway and the United Kingdom. In Norway, only 36% of students from families with low levels of education complete upper secondary programmes in the stipulated time, compared to 70% of those from highly educated families.
Learning outcomes among students with an immigrant background or from families with low level of education should be an area of focus among education policy makers, particularly in countries where these students show significantly lower completion rates than their peers who do not come from these social groups.

A2
How many students are expected to complete upper secondary education? – IndIcAtor A2 chapter A
Education at a Glance 2014: OECD Indicators © OECD 2014 65
definitionFirst-generation students are those who were born outside the country, as were their parents.
Graduates in the reference period can be either first-time graduates or repeat graduates. A first-time graduate is a student who has graduated for the first time at a given level of education in the reference period. Thus, if a student has graduated multiple times over the years, he or she is counted as a graduate each year, but as a first-time graduate only once.
Net graduation rates represent the estimated percentage of an age group that will complete upper secondary education, based on current patterns of graduation.
Second-generation students are those who were born in the country, but their parents were born outside. More details on the definitions used by countries in Box A2.2 is available in Annex 3.
Successful completion of upper secondary general programmes represents the proportion of new entrants to upper secondary general programmes who graduated at the upper secondary level a specific number of years later (based on cohorts).
Successful completion of upper secondary programmes represents the proportion of new entrants to upper secondary programmes who graduated at the upper secondary level a specific number of years later (based on cohorts).
Successful completion of upper secondary vocational programmes represents the proportion of new entrants to upper secondary general programmes who graduated at the upper secondary level a specific number of years later (based on cohorts).
methodologyData refer to the academic year 2011/12 and are based on the UOE data collection on education statistics administered by the OECD in 2012 (for details, see Annex 3 at www.oecd.org/edu/eag.htm).
Data on trends in graduation rates at upper secondary level for the years 1995 and 2000 through 2004 are based on a special survey carried out in January 2007.
Unless otherwise indicated, graduation rates are calculated as net graduation rates (i.e. as the sum of age-specific graduation rates). Gross graduation rates are presented for countries that are unable to provide such detailed data. In order to calculate gross graduation rates, countries identify the age at which graduation typically occurs (see Annex 1). The number of graduates, regardless of their age, is divided by the population at the typical graduation age. In many countries, defining a typical age of graduation is difficult, however, because graduates are dispersed over a wide range of ages.
Graduates of ISCED 3A, 3B and 3C (or 4A, 4B, 4C) programmes are not considered as first-time counts. Therefore, graduation rates cannot be added, as some individuals graduate from more than one upper secondary programme and would be counted twice. The same applies for graduation rates according to programme orientation, i.e. general or vocational. In addition, the typical graduation ages are not necessarily the same for the different types of programmes (see Annex 1). Pre-vocational and vocational programmes include both school-based programmes and combined school- and work-based programmes that are recognised as part of the education system. Entirely work-based education and training programmes that are not overseen by a formal education authority are not included.
In Tables A2.4, A2.5 and Box A2.2, data are based on a special survey carried out in December 2013. Successful completion of upper secondary programmes is calculated as the ratio of the number of students who graduate from an upper secondary programme during the reference year to the number of new entrants in this programme N years before (or N+2), with N being the duration of the programme. The calculation of successful completion is defined from a cohort analysis in three quarters of the countries listed in Table A2.4 (true cohort and longitudinal survey). The estimation for the other countries without a real cohort tracking system assumes constant student flows at the upper secondary level, owing to the need for consistency between the graduate cohort in the reference year and the entrant cohort N years before (Proxy cohort data). This assumption may be an oversimplification. A detailed description of the method used for each country is included in Annex 3 (years of new entrants, years of graduates, programmes taken into account, etc.).

chapter A The Output of Educational Institutions and the Impact of Learning
A2
Education at a Glance 2014: OECD Indicators © OECD 201466
Note regarding data from Israel
The statistical data for Israel are supplied by and are under the responsibility of the relevant Israeli authorities. The use of such data by the OECD is without prejudice to the status of the Golan Heights, East Jerusalem and Israeli settlements in the West Bank under the terms of international law.
ReferencesFalch T. et al. (2010), Completion and Dropout in Upper Secondary Education in Norway: Causes and Consequences, Centre for Economic Research at NTNU, Trondheim, October 2010.
OECD (2014), PISA 2012 Results: What Students Know and Can Do (Volume I, Revised edition, February 2014): Student Performance in Mathematics, Reading and Science, PISA, OECD Publishing, Paris, http://dx.doi.org/ 10.1787/9789264208780-en.
OECD (2012a), Equity and Quality in Education: Supporting Disadvantaged Students and Schools, OECD Publishing, Paris, http://dx.doi.org/10.1787/9789264130852-en.
OECD (2012b), Closing the Gender Gap: Act Now, OECD Publishing, Paris, http://dx.doi.org/10.1787/9789264179370-en.
OECD (2010), Learning for Jobs, OECD Reviews of Vocational Education and Training, OECD Publishing, Paris, http://dx.doi.org/ 10.1787/9789264087460-en.
Zapata, J. (forthcoming), “Upper Secondary Education: a Literature Review on Provision”, OECD Publishing, Paris.
tables of indicator a21 2 http://dx.doi.org/10.1787/888933115122
Table A2.1a Upper secondary graduation rates and average ages (2012)Table A2.1b Upper secondary graduation rates: Under 25 years old (2012)
Web Table A2.1c Post-secondary non-tertiary graduation rates (2012)
Table A2.2a Trends in first-time graduation rates at upper secondary level (1995-2012)
Web Table A2.2b Trends in graduation rates (general and pre-vocational/vocational programmes) at upper secondary level (2005-2012)
Table A2.3a Distribution of upper secondary vocational graduates, by field of education and gender (2012)
Web Table A2.3b Distribution of upper secondary vocational graduates, by field of education (2012)
Table A2.4 Successful completion of upper secondary programmes, by gender and programme orientation
Table A2.5 Successful completion of upper secondary programmes, by programme orientation and duration

A2
How many students are expected to complete upper secondary education? – IndIcAtor A2 chapter A
Education at a Glance 2014: OECD Indicators © OECD 2014 67
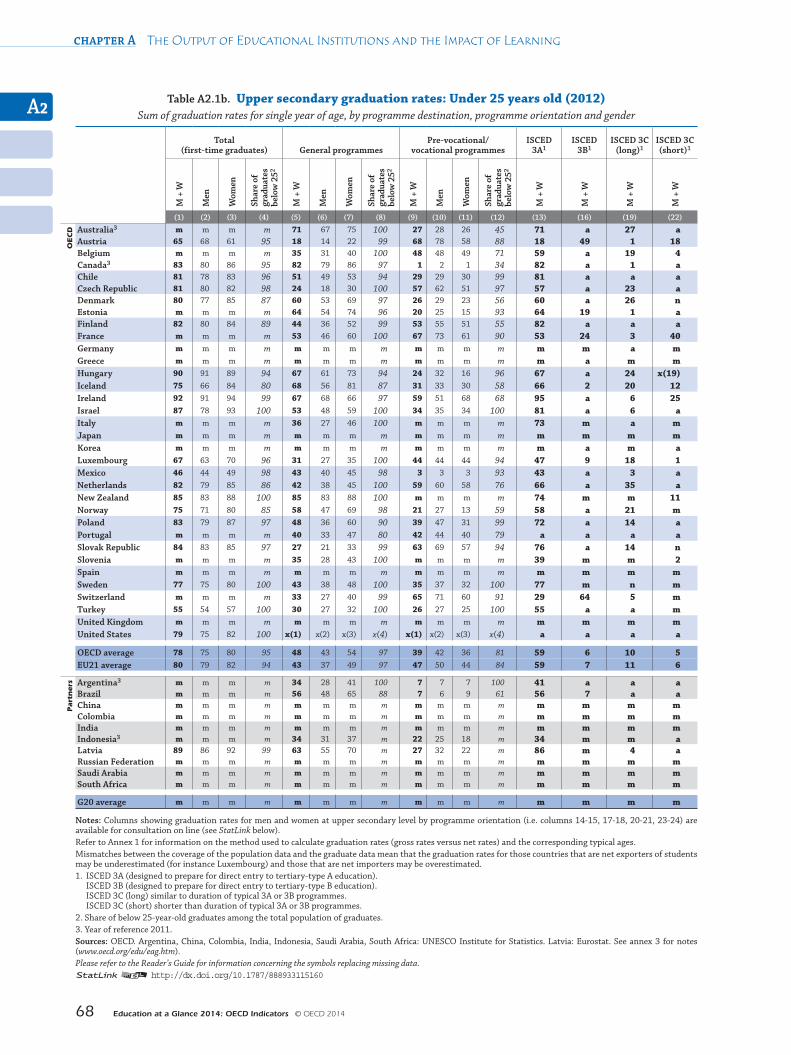
Table A2.1a. Upper secondary graduation rates and average ages (2012)Sum of age-specific graduation rates, by programme destination, programme orientation and gender
Total (first-time graduates)
General programmes
Pre-vocational/ vocational programmes
ISCED 3A1
ISCED 3B1
ISCED 3C (long)1
ISCED 3C (short)1
M +
W
Men
Wom
en
Aver
age
age2
M +
W
Men
Wom
en
Aver
age
age2
M +
W
Men
Wom
en
Aver
age
age2
M +
W
M +
W
M +
W
M +
W
(1) (2) (3) (4) (5) (6) (7) (8) (9) (10) (11) (12) (13) (17) (21) (25)
oecd Australia3 m m m m 71 67 75 17 59 58 61 31 71 a 59 a
Austria 68 71 64 18 18 14 22 18 76 87 65 20 18 55 1 20 Belgium m m m m 35 31 40 18 66 61 72 25 59 a 19 23 Canada3 88 85 91 19 84 81 88 18 4 4 3 m 84 a 4 a Chile 84 81 88 18 55 52 58 19 30 30 30 18 84 a a a Czech Republic 82 81 83 19 24 18 30 19 58 63 53 19 58 n 24 a Denmark 92 86 99 21 62 54 70 19 47 44 49 28 62 a 46 n Estonia m m m m 65 55 76 18 22 27 17 21 65 20 2 a Finland 93 89 96 21 44 37 52 19 97 89 106 29 93 a a a France m m m m 53 46 60 17 75 77 72 20 53 24 4 47 Germany 95 95 94 m 49 44 54 m 46 51 40 m 49 45 a 1 Greece 71 64 78 m 71 64 78 m 33 39 27 m 71 a 33 x(21) Hungary 94 95 94 19 70 63 77 19 25 32 18 20 70 a 25 x(21) Iceland 95 82 109 23 79 64 94 21 55 55 56 26 76 3 37 18 Ireland 93 92 95 19 69 70 68 19 80 61 99 26 97 a 6 46 Israel 87 82 93 17 53 48 59 17 34 35 34 17 81 a 6 a Italy 84 82 86 m 36 27 46 18 64 72 56 m 75 1 a 24 Japan 93 92 94 m 71 68 75 m 22 24 20 m 71 1 21 x(21) Korea 92 92 92 m 71 70 72 m 21 22 20 m 71 a 21 a Luxembourg 69 66 72 20 31 27 35 18 47 46 47 20 47 9 20 1 Mexico 47 45 50 18 44 41 46 18 4 4 4 19 44 a 4 a Netherlands 94 91 98 21 42 38 45 17 78 79 76 25 70 a 49 a New Zealand 85 83 88 17 85 83 88 17 m m m m 74 m m 11 Norway 88 83 94 22 59 48 71 19 34 41 27 28 59 a 34 m Poland 85 80 89 20 52 40 65 20 39 47 31 20 77 a 14 a Portugal m m m m 47 40 54 23 50 50 50 23 a a a a Slovak Republic 86 85 89 19 27 21 33 18 66 71 62 20 78 a 14 1 Slovenia 96 92 101 m 35 28 43 18 73 79 67 m 39 46 21 2 Spain 93 90 97 m 52 46 59 m 50 49 50 m 52 23 11 16 Sweden 77 75 80 18 43 38 48 18 35 37 32 18 77 n n n Switzerland m m m m 34 27 41 20 71 77 66 21 30 69 6 x(21) Turkey 55 54 57 17 30 27 32 17 26 27 25 17 55 a a m United Kingdom 93 92 95 m m m m m m m m m m m 81 12 United States 79 75 82 17 x(1) x(2) x(3) x(4) x(1) x(2) x(3) x(4) a a a a
OECD average 84 81 87 19 52 46 58 19 48 50 46 22 61 10 18 8EU21 average 86 84 89 20 46 40 53 19 56 58 54 22 61 11 18 10
part
ners Argentina3 m m m m 34 28 41 17 7 7 7 17 41 a a a
Brazil m m m m 63 51 75 20 12 10 14 25 64 12 a a China 76 76 77 m 42 41 44 m 60 60 59 m 44 x(13) 33 25 Colombia m m m m m m m m m m m m m m m m India m m m m m m m m m m m m m m m m Indonesia3 m m m m 36 32 41 18 25 29 22 18 36 25 a a Latvia 90 87 93 20 63 55 70 19 28 33 23 20 86 a 4 a Russian Federation m m m m 43 x(5) x(5) m 45 x(9) x(9) m 43 18 22 5 Saudi Arabia m m m m m m m m m m m m m m m m South Africa m m m m m m m m m m m m m m m m
G20 average 77 76 78 m 52 48 58 m 34 34 31 m 54 9 16 9
Notes: Columns showing graduation rates for men, women and average age at upper secondary level by programme orientation (i.e. columns 14-16, 18-20, 22-24, 26-28) are available for consultation on line (see StatLink below).Refer to Annex 1 for information on the method used to calculate graduation rates (gross rates versus net rates) and the corresponding typical ages. Mismatches between the coverage of the population data and the graduate data mean that the graduation rates for those countries that are net exporters of students may be underestimated (for instance Luxembourg) and those that are net importers may be overestimated.1. ISCED 3A (designed to prepare for direct entry to tertiary-type A education). ISCED 3B (designed to prepare for direct entry to tertiary-type B education). ISCED 3C (long) similar to duration of typical 3A or 3B programmes. ISCED 3C (short) shorter than duration of typical 3A or 3B programmes.2. The average age refers generally to the age of the students at the beginning of the calendar year; students could be one year older than the age indicated when they graduate at the end of the school year. It refers to an average weighted age. Please see Annex 3 to learn how it is calculated.3. Year of reference 2011. Sources: OECD. Argentina, China, Colombia, India, Indonesia, Saudi Arabia, South Africa: UNESCO Institute for Statistics. Latvia: Eurostat. See Annex 3 for notes (www.oecd.org/edu/eag.htm). Please refer to the Reader’s Guide for information concerning the symbols replacing missing data.1 2 http://dx.doi.org/10.1787/888933115141
chapter A The Output of Educational Institutions and the Impact of Learning
A2
Education at a Glance 2014: OECD Indicators © OECD 201468
Table A2.1b. Upper secondary graduation rates: Under 25 years old (2012)Sum of graduation rates for single year of age, by programme destination, programme orientation and gender
Total (first-time graduates) General programmes
Pre-vocational/vocational programmes
ISCED 3A1
ISCED 3B1
ISCED 3C (long)1
ISCED 3C (short)1
M +
W
Men
Wom
en
Shar
e of
gr
adua
tes
belo
w 2
52
M +
W
Men
Wom
en
Shar
e of
gr
adua
tes
belo
w 2
52
M +
W
Men
Wom
en
Shar
e of
gr
adua
tes
belo
w 2
52
M +
W
M +
W
M +
W
M +
W
(1) (2) (3) (4) (5) (6) (7) (8) (9) (10) (11) (12) (13) (16) (19) (22)
oecd Australia3 m m m m 71 67 75 100 27 28 26 45 71 a 27 a
Austria 65 68 61 95 18 14 22 99 68 78 58 88 18 49 1 18 Belgium m m m m 35 31 40 100 48 48 49 71 59 a 19 4 Canada3 83 80 86 95 82 79 86 97 1 2 1 34 82 a 1 a Chile 81 78 83 96 51 49 53 94 29 29 30 99 81 a a a Czech Republic 81 80 82 98 24 18 30 100 57 62 51 97 57 a 23 a Denmark 80 77 85 87 60 53 69 97 26 29 23 56 60 a 26 n Estonia m m m m 64 54 74 96 20 25 15 93 64 19 1 a Finland 82 80 84 89 44 36 52 99 53 55 51 55 82 a a a France m m m m 53 46 60 100 67 73 61 90 53 24 3 40 Germany m m m m m m m m m m m m m m a m Greece m m m m m m m m m m m m m a m m Hungary 90 91 89 94 67 61 73 94 24 32 16 96 67 a 24 x(19) Iceland 75 66 84 80 68 56 81 87 31 33 30 58 66 2 20 12Ireland 92 91 94 99 67 68 66 97 59 51 68 68 95 a 6 25 Israel 87 78 93 100 53 48 59 100 34 35 34 100 81 a 6 a Italy m m m m 36 27 46 100 m m m m 73 m a m Japan m m m m m m m m m m m m m m m m Korea m m m m m m m m m m m m m a m a Luxembourg 67 63 70 96 31 27 35 100 44 44 44 94 47 9 18 1 Mexico 46 44 49 98 43 40 45 98 3 3 3 93 43 a 3 a Netherlands 82 79 85 86 42 38 45 100 59 60 58 76 66 a 35 a New Zealand 85 83 88 100 85 83 88 100 m m m m 74 m m 11 Norway 75 71 80 85 58 47 69 98 21 27 13 59 58 a 21 m Poland 83 79 87 97 48 36 60 90 39 47 31 99 72 a 14 a Portugal m m m m 40 33 47 80 42 44 40 79 a a a a Slovak Republic 84 83 85 97 27 21 33 99 63 69 57 94 76 a 14 n Slovenia m m m m 35 28 43 100 m m m m 39 m m 2 Spain m m m m m m m m m m m m m m m m Sweden 77 75 80 100 43 38 48 100 35 37 32 100 77 m n m Switzerland m m m m 33 27 40 99 65 71 60 91 29 64 5 m Turkey 55 54 57 100 30 27 32 100 26 27 25 100 55 a a m United Kingdom m m m m m m m m m m m m m m m m United States 79 75 82 100 x(1) x(2) x(3) x(4) x(1) x(2) x(3) x(4) a a a a
OECD average 78 75 80 95 48 43 54 97 39 42 36 81 59 6 10 5 EU21 average 80 79 82 94 43 37 49 97 47 50 44 84 59 7 11 6
part
ners Argentina3 m m m m 34 28 41 100 7 7 7 100 41 a a a
Brazil m m m m 56 48 65 88 7 6 9 61 56 7 a a China m m m m m m m m m m m m m m m m Colombia m m m m m m m m m m m m m m m m India m m m m m m m m m m m m m m m m Indonesia3 m m m m 34 31 37 m 22 25 18 m 34 m m a Latvia 89 86 92 99 63 55 70 m 27 32 22 m 86 m 4 a Russian Federation m m m m m m m m m m m m m m m m Saudi Arabia m m m m m m m m m m m m m m m m South Africa m m m m m m m m m m m m m m m m
G20 average m m m m m m m m m m m m m m m m
Notes: Columns showing graduation rates for men and women at upper secondary level by programme orientation (i.e. columns 14-15, 17-18, 20-21, 23-24) are available for consultation on line (see StatLink below).Refer to Annex 1 for information on the method used to calculate graduation rates (gross rates versus net rates) and the corresponding typical ages. Mismatches between the coverage of the population data and the graduate data mean that the graduation rates for those countries that are net exporters of students may be underestimated (for instance Luxembourg) and those that are net importers may be overestimated.1. ISCED 3A (designed to prepare for direct entry to tertiary-type A education). ISCED 3B (designed to prepare for direct entry to tertiary-type B education). ISCED 3C (long) similar to duration of typical 3A or 3B programmes. ISCED 3C (short) shorter than duration of typical 3A or 3B programmes.2. Share of below 25-year-old graduates among the total population of graduates.3. Year of reference 2011. Sources: OECD. Argentina, China, Colombia, India, Indonesia, Saudi Arabia, South Africa: UNESCO Institute for Statistics. Latvia: Eurostat. See annex 3 for notes (www.oecd.org/edu/eag.htm). Please refer to the Reader’s Guide for information concerning the symbols replacing missing data.1 2 http://dx.doi.org/10.1787/888933115160
A2
How many students are expected to complete upper secondary education? – IndIcAtor A2 chapter A
Education at a Glance 2014: OECD Indicators © OECD 2014 69
Table A2.2a. Trends in first-time graduation rates at upper secondary level (1995-2012)
1995 2000 2001 2002 2003 2004 2005 2006 2007 2008 2009 2010 2011 2012
Average annual growth rate 1995-20121
oecd Australia m m m m m m m m m m m m m m m
Austria2 m m m m m m m m m m m m 66 68 m
Belgium m m m m m m m m m m m m m m m
Canada m m 77 79 83 79 80 81 77 81 81 85 88 m m
Chile m m m m m 79 85 82 82 83 85 83 83 84 m
Czech Republic 78 m 84 83 88 87 89 89 88 85 83 80 78 82 0.3%
Denmark 83 95 95 94 88 88 82 84 85 83 85 86 90 92 0.7%
Estonia m m m m m m m m m m m m m m m
Finland 91 91 85 84 90 95 94 94 97 93 95 93 96 93 0.1%
France m m m m m m m m m m m m m m m
Germany3 100 92 92 94 97 99 99 100 100 97 84 87 92 95 m
Greece 80 54 76 85 96 93 100 98 96 91 m m m 71 -0.7%
Hungary m m 83 82 87 86 84 87 84 78 86 86 86 94 m
Iceland 80 67 70 79 81 87 79 87 86 89 89 88 90 95 1.1%
Ireland m 74 77 78 91 92 91 87 90 88 91 94 89 93 1.9%
Israel m m m 90 89 93 90 90 92 90 89 92 85 87 m
Italy m 78 81 78 m 82 85 86 84 86 81 83 79 84 0.6%
Japan 96 95 93 94 95 96 95 96 96 95 95 96 96 93 -0.2%
Korea 88 96 100 99 92 94 94 93 91 93 89 94 93 92 0.3%
Luxembourg m m m 69 71 69 75 71 75 73 69 70 70 69 m
Mexico m 33 34 35 37 39 40 42 43 44 45 47 49 47 3.1%
Netherlands m m m m m m m m m m m m 92 94 m
New Zealand m m m m m m m m m m m m m m m
Norway 77 99 105 97 92 100 89 88 92 91 91 87 90 88 0.8%
Poland m 90 93 91 86 79 85 81 84 83 85 84 84 85 -0.5%
Portugal4 52 52 48 50 60 53 51 54 65 63 96 104 89 m m
Slovak Republic 85 87 72 60 56 83 85 86 86 82 82 86 85 86 0.1%
Slovenia m m m m m m 85 97 91 85 96 94 99 96 m
Spain 62 60 66 66 67 66 72 72 74 73 74 80 88 93 2.4%
Sweden m 75 71 72 76 78 76 75 74 74 74 75 75 77 0.2%
Switzerland 86 88 91 91 88 87 87 88 88 88 92 94 m m m
Turkey 37 37 37 37 41 55 48 52 58 26 45 54 56 55 2.4%
United Kingdom m m m m m m 86 88 89 91 92 93 93 93 m
United States 69 70 71 73 74 75 76 75 75 76 76 77 77 79 0.7%
OECD average 78 76 77 78 79 81 82 82 83 81 83 84 82 84 m
OECD average for countries with available data 2000-2012
76 76 75 76 80 79 79 81 79 81 83 83 84 0.8%
EU21 average 79 77 79 77 79 78 81 82 84 84 85 85 83 83 m
part
ners
Argentina m m m m m m m m m m m m m m m
Brazil m m m m m m m m m m m m m m m
Colombia m m m m m m m m m m m m m m m
China m m m m m m m m m m m 69 73 76 m
India m m m m m m m m m m m m m m m
Latvia m m m m m m m m m m m m m 90 m
Indonesia m m m m m m m m m m m m m m m
Russian Federation m m m m m m m m m m m m m m m
Saudi Arabia m m m m m m m m m m m m m m m
South Africa m m m m m m m m m m m m m m m
G20 average m m m m m m m m m m m 71 75 76 m
Notes: Up to 2004, graduation rates at upper secondary level were calculated on a gross basis. From 2005 and for countries with available data, graduation rates are calculated as net graduation rates (i.e. as the sum of age-specific graduation rates).Refer to Annex 1 for information on the method used to calculate graduation rates (gross rates versus net rates) and the corresponding typical ages.1. For countries that do not have data for the year 1995, the 2000-12 average annual growth rate is indicated in italics.2. Programmes spanning ISCED levels 3 and 4 (Höhere berufsbildende Schule) not included.3. Break in the series between 2008 and 2009 due, in Germany, to a partial reallocation of vocational programmes into ISCED 2 and ISCED 5B.4. Year of reference 1997 instead of 1995.Sources: OECD. Argentina, China, Colombia, India, Indonesia, Saudi Arabia, South Africa: UNESCO Institute for Statistics. Latvia: Eurostat. See annex 3 for notes (www.oecd.org/edu/eag.htm). Please refer to the Reader’s Guide for information concerning the symbols replacing missing data.1 2 http://dx.doi.org/10.1787/888933115179

chapter A The Output of Educational Institutions and the Impact of Learning
A2
Education at a Glance 2014: OECD Indicators © OECD 201470
Table A2.3a. Distribution of upper secondary vocational graduates, by field of education and gender (2012)
Men Women
Pre-
voca
tion
al/
voca
tion
al p
rogr
amm
es
grad
uati
on ra
tes
Hum
anit
ies,
art
s an
d ed
ucat
ion
Hea
lth
and
wel
fare
Soci
al s
cien
ces,
bus
ines
s an
d la
w
Serv
ices
Engi
neer
ing,
m
anuf
actu
ring
and
co
nstr
ucti
on
Scie
nces
Agr
icul
ture
Not
kno
wn
or u
nspe
cifi
ed
Pre-
voca
tion
al/
voca
tion
al p
rogr
amm
es
grad
uati
on ra
tes
Hum
anit
ies,
art
s an
d ed
ucat
ion
Hea
lth
and
wel
fare
Soci
al s
cien
ces,
bus
ines
s an
d la
w
Ser
vice
s
Engi
neer
ing,
m
anuf
actu
ring
and
co
nstr
ucti
on
Scie
nces
Agr
icul
ture
Not
kno
wn
or u
nspe
cifi
ed
(1) (2) (5) (6) (7) (8) (9) (14) (15) (16) (17) (20) (21) (22) (23) (24) (29) (30)
oecd Australia1 58 2 5 13 12 59 2 6 1 61 6 37 30 16 5 1 2 4
Austria2 87 1 1 11 8 46 2 8 23 65 2 9 35 21 7 n 8 19 Belgium 61 15 6 11 7 32 3 2 23 72 23 23 12 13 2 n 1 26 Canada1 4 m m m m m m m m 3 m m m m m m m m Chile 30 1 2 24 7 59 n 6 n 30 13 8 48 16 12 n 4 n Czech Republic 63 3 1 10 12 70 n 3 n 53 8 13 33 30 9 n 5 n Denmark 44 3 7 17 15 49 n 8 n 49 1 50 31 10 5 n 4 n Estonia 27 1 n n 15 68 9 7 n 17 6 4 8 52 19 5 6 n Finland 89 4 5 10 16 55 4 5 n 106 7 31 20 26 10 1 6 n France 77 2 3 14 12 62 n 7 n 72 2 29 32 26 7 n 3 n Germany 51 2 3 27 9 53 4 3 n 40 3 16 54 17 7 1 1 n Greece m m m m m m m m m m m m m m m m m m Hungary 32 1 n 4 21 73 n 2 n 18 3 8 23 52 11 n 3 n Iceland 55 14 1 11 16 54 2 2 n 56 24 21 21 26 6 n n 2 Ireland 61 m m m m m m m m 99 m m m m m m m m Israel 35 m m m m m m m m 34 m m m m m m m m Italy 72 m m m m m m m m 56 m m m m m m m m Japan 24 n 1 17 2 56 n 11 12 20 n 10 40 12 8 n 12 17 Korea 22 18 n 7 4 58 11 2 n 20 34 1 26 5 20 12 1 n Luxembourg 46 m m m m m m m m 47 m m m m m m m m Mexico 4 m m m m m m m m 4 m m m m m m m m Netherlands 79 4 8 18 25 34 7 4 n 76 7 45 23 19 3 n 3 n New Zealand m m m m m m m m m m m m m m m m m m Norway 41 1 4 2 15 72 3 3 n 27 4 48 12 24 9 n 3 n Poland 47 1 n 8 13 62 13 4 n 31 3 n 31 47 13 2 3 n Portugal 50 m m m m m m m m 50 m m m m m m m m Slovak Republic 71 4 2 11 19 61 n 3 n 62 8 13 35 33 8 n 3 n Slovenia 79 3 5 13 13 54 7 5 n 67 14 21 33 21 6 n 5 n Spain 49 17 5 10 10 42 9 4 3 50 29 24 25 15 3 2 1 1 Sweden 37 8 7 6 10 65 n 4 n 32 24 27 13 18 8 n 10 n Switzerland 77 2 2 24 6 54 4 6 2 66 4 23 48 12 9 n 3 1 Turkey 27 1 2 11 4 52 13 n 17 25 4 26 17 8 11 10 n 24 United Kingdom m m m m m m m m m m m m m m m m m m United States m m m m m m m m m m m m m m m m m m
OECD average 50 4 3 11 10 48 4 4 17 47 9 19 24 19 7 2 3 17
EU21 average 59 4 3 11 12 50 5 4 12 56 8 20 25 23 7 1 3 12
part
ners Argentina1 7 m m m m m m m m 7 m m m m m m m m
Brazil 10 m m m m m m m m 14 m m m m m m m m
China 60 m m m m m m m m 59 m m m m m m m m
Colombia m m m m m m m m m 60 m m m m m m m m
India m m m m m m m m m m m m m m m m m m
Indonesia1 29 2 2 49 n 39 n n 8 22 2 6 49 n 29 n 4 10
Latvia 33 4 n 6 12 67 10 2 n 23 15 3 34 34 9 2 2 n
Russian Federation m m m m m m m m m m m m m m m m m m
Saudi Arabia m m m m m m m m m m m m m m m m m m
South Africa m m m m m m m m m m m m m m m m m m
G20 average 33 m m m m m m m m 30 m m m m m m m m
Notes: Columns showing the breakdown of humanities, arts and education (3, 4, 18 and 19) and sciences (10-13, 25-28) are available for consultation on line (see StatLink below). The averages were adjusted to 100% and do not correspond exactly to the average of each column. Columns 1 and 16 show the relative share of pre-vocational/vocational graduates among all upper secondary graduates. Figures in bold highlight the field of education with the larger share of graduates in each country.1. Year of reference 2011.2. Programmes spanning ISCED levels 3 and 4 (Höhere berufsbildende Schule) not included.Sources: OECD. Argentina, China, Colombia, India, Indonesia, Saudi Arabia, South Africa: UNESCO Institute for Statistics. Latvia: Eurostat. See annex 3 for notes (www.oecd.org/edu/eag.htm). Please refer to the Reader’s Guide for information concerning the symbols replacing missing data.1 2 http://dx.doi.org/10.1787/888933115198
A2
How many students are expected to complete upper secondary education? – IndIcAtor A2 chapter A
Education at a Glance 2014: OECD Indicators © OECD 2014 71
Table A2.4. [1/2] Successful completion of upper secondary programmes, by gender and programme orientation
Ratio of graduates to new entrants, based on cohorts
Completion of upper secondary
programmesCompletion of general
programmes 1 Completion of vocational
programmes 2
Method
Year used for new entrants Duration programme
(G: general, V: vocational)N = theoretical
duration M +
W
Men
Wom
en
M +
W
Men
Wom
en
Proportion of vocational programme graduates3 M
+ W
Men
Wom
en
Proportion of general
programmes graduates4
oecd Austria True cohort 2007-08 within N 71 65 76 71 65 76 3 m m m m
4 years G & V 2 years after N m m m m m m m m m m mBelgium (Fl.) True cohort 2007-08 within N 71 65 77 81 75 86 14 62 57 67 n
4 years G & V 2 years after N 87 84 90 95 94 97 19 80 77 82 nCanada Proxy cohort
data2008-09 within N 73 69 77 m m m m m m m m3 years 2 years after N m m m m m m m m m m m
Chile True cohort 2007 within N 64 61 67 66 62 69 21 60 58 63 124 years G & V 2 years after N 77 75 80 79 77 81 21 74 72 76 18
Denmark True cohort 2004-05 within N 60 56 65 81 78 83 1 35 35 35 23-4 years G & 2-5 years V 2 years after N 73 70 76 89 87 90 3 53 54 53 9
Estonia True cohort 2005 within N 78 75 81 84 82 85 1 60 60 59 23 years G & 3-4 years V 2 years after N 86 83 88 91 91 92 3 66 67 66 3
Finland True cohort 2006 within N 71 70 72 80 79 81 1 64 64 64 13 years G & V 2 years after N 82 80 83 92 91 93 4 74 74 75 1
France Longitudinal sample survey
1999-2005 within N 59 54 64 61 56 66 5 55 52 60 n3 years G & 2 years V 2 years after N 82 78 85 90 88 91 6 69 67 73 1
Greece Cross cohort 2008-11 within N 85 82 87 89 86 92 m 76 77 76 m3-4 years G & 2-4 years V 2 years after N m m m m m m m m m m m
Hungary Cross cohort 2009-10 within N 84 81 86 87 85 88 m 74 73 77 m4 years 2 years after N m m m m m m m m m m m
Iceland True cohort 2004 within N 45 38 52 47 40 53 14 37 32 48 354 years G & V 2 years after N 58 52 64 61 56 65 19 49 44 57 41
Ireland True Cohort 2007 within N 90 88 92 m m m m m m m m2-3 years G & V 2 years after N m m m m m m m m m m m
Israel True cohort 2009 within N 88 81 94 89 83 95 9 85 80 92 143 years G & V 2 years after N m m m m m m m m m m m
Italy Cross cohort 2005-06 within N 66 59 73 79 75 82 m 61 58 67 m5 years G & V 2 years after N 86 82 90 m m m m m m m m
Japan True cohort 2009 within N 94 93 94 94 94 95 m 92 91 93 m3 years G & V 2 years after N m m m m m m m m m m m
Korea Cross cohort 2009 within N 95 94 96 97 96 97 m 90 89 90 m3 years G & V 2 years after N m m m m m m m m m m m
Luxembourg True cohort 2006-07 within N 40 36 45 64 60 68 3 29 27 32 n4 years G & 2-5 years V 2 years after N 72 68 76 90 88 91 9 64 60 68 n
Mexico True cohort 2009-2010 within N 62 57 66 64 60 68 a 57 54 62 a3 years G & V 2 years after N m m m m m m a m m m a
Netherlands True cohort 2007 within N 61 57 66 69 66 72 3 57 52 62 n2-3 years G & 2-4 years V 2 years after N 80 77 83 94 93 95 4 73 69 76 1
New Zealand True cohort 2008 within N 69 65 73 69 65 73 m m m m m3 years G 2 years after N 74 70 78 74 70 78 m m m m m
Norway True cohort 2006 within N 57 49 66 73 68 77 n 40 34 50 553 years G & 4 years V 2 years after N 72 68 76 83 79 87 1 60 59 62 40
Poland True cohort 2008-09 within N 78 72 85 83 74 90 m 72 70 76 m3 years G & 3-4 years V 2 years after N m m m m m m m m m m m
Slovak Republic Cross cohort 2006 within N 89 89 89 97 96 98 m 85 87 84 m4 years G & 2-4 years V 2 years after N m m m m m m m m m m m
Slovenia Cross cohort 2009-11 within N 73 71 76 82 83 81 m 66 64 71 m4 years G & 3-4 years V 2 years after N m m m m m m m m m m m
Spain Cross cohort 2008-09 within N 60 57 64 60 57 64 m m m m m2 years G & V 2 years after N 83 81 85 83 81 85 m m m m m
Sweden5 True cohort 2007 within N 72 71 75 76 74 78 1 68 69 71 23 years G & V 2 years after N 80 79 82 84 82 86 4 75 76 78 3
Turkey True cohort 2008-09 within N 72 66 80 75 68 82 5 69 63 77 94-5 years G & 4 years V 2 years after N m m m m m m m m m m m
United Kingdom True cohort 2006 within N 67 63 72 67 63 72 m m m m m2 years 2 years after N 83 80 87 m m m m m m m m
United States Longitudinal sample survey
2002 within N 85 83 88 m m m m m m m m3 years G & V 2 years after N 88 86 90 m m m m m m m m
OECD average6 within N 72 68 76 76 73 80 m 64 61 67 m 2 years after N 87 84 89 91 89 93 m 79 77 81 m
Note: Data presented in this table come from a special survey in which 29 countries participated and only concern initial education programmes. Refer to Annex 3 for details concerning this indicator, including methods used, programmes included/excluded, year of entry, etc.1. ISCED 3 general programmes entrants who graduated from either a general or vocational programme.2. ISCED 3 vocational programmes entrants who graduated from either a general or vocational programme.3. ISCED 3 general programmes entrants who graduated from a vocational programme.4. ISCED 3 vocational programme entrants who graduated from a general programme.5. Excluding students having continued their studies in the adult education system.6. OECD average for N + 2 corresponds to the OECD average for N + the difference (in percentage points) of the average for countries with N and N + 2 data.Source: OECD. See Annex 3 for notes (www.oecd.org/edu/eag.htm).Please refer to the Reader’s Guide for information concerning the symbols replacing missing data.1 2 http://dx.doi.org/10.1787/888933115217

chapter A The Output of Educational Institutions and the Impact of Learning
A2
Education at a Glance 2014: OECD Indicators © OECD 201472
Table A2.4. [2/2] Successful completion of upper secondary programmes, by gender and programme orientation
Proportion of students who are still in education
among the students who did not graduated (General programmes)
Proportion of students who are still in education
among the students who did not graduated
(Vocational programmes) Net entry rates at upper secondary
level for students below
20 years old (2012)5Method
Year used for new entrants Duration programme
(G: general, V: vocational)N = theoretical
duration M + W Men Women M + W Men Women
oecd Austria True cohort 2007-08 within N 76 78 74 m m m 100
4 years G & V 2 years after N m m m m m mBelgium (Fl.) True cohort 2007-08 within N 88 89 86 67 68 65 m
4 years G & V 2 years after N 8 10 6 6 6 5Canada Proxy cohort
data2008-09 within N m m m m m m m3 years 2 years after N m m m m m m
Chile True cohort 2007 within N 57 58 57 57 58 56 904 years G & V 2 years after N 34 35 33 37 39 35
Denmark True cohort 2004-05 within N 73 75 70 65 66 65 953-4 years G & 2-5 years V 2 years after N 41 44 39 42 42 42
Estonia True cohort 2005 within N 58 54 60 34 31 39 1003 years G & 3-4 years V 2 years after N 27 24 30 16 16 24
Finland True cohort 2006 within N 82 81 83 50 49 52 m3 years G & V 2 years after N 52 54 50 28 26 31
France Longitudinal sample survey
1999-2005 within N 93 93 94 80 81 79 m3 years G & 2 years V 2 years after N 21 24 19 13 12 15
Greece Cross cohort 2008-11 within N m m m m m m 1003-4 years G & 2-4 years V 2 years after N m m m m m m
Hungary Cross cohort 2009-10 within N m m m m m m 1004 years 2 years after N m m m m m m
Iceland True cohort 2004 within N 54 55 53 39 38 41 984 years G & V 2 years after N 32 32 33 21 20 24
Ireland True Cohort 2007 within N m m m m m m 1002-3 years G & V 2 years after N m m m m m m
Israel True cohort 2009 within N 10 9 12 2 2 4 983 years G & V 2 years after N m m m m m m
Italy Cross cohort 2005-06 within N m m m m m m m5 years G & V 2 years after N m m m m m m
Japan True cohort 2009 within N m m m m m m 1003 years G & V 2 years after N m m m m m m
Korea Cross cohort 2009 within N 7 11 n 7 3 12 m3 years G & V 2 years after N m m m m m m
Luxembourg True cohort 2006-07 within N 82 84 81 62 63 62 904 years G & 2-5 years V 2 years after N 27 35 17 19 21 17
Mexico True cohort 2009-2010 within N m m m m m m 773 years G & V 2 years after N m m m m m m
Netherlands True cohort 2007 within N 77 75 79 35 35 35 m2-3 years G & 2-4 years V 2 years after N 43 43 44 20 21 19
New Zealand True cohort 2008 within N 46 45 48 m m m 1003 years G 2 years after N 15 14 16 m m m
Norway True cohort 2006 within N 37 36 38 37 40 31 993 years G & 4 years V 2 years after N 14 14 15 13 13 14
Poland True cohort 2008-09 within N m m m m m m 883 years G & 3-4 years V 2 years after N m m m m m m
Slovak Republic Cross cohort 2006 within N m m m m m m 924 years G & 2-4 years V 2 years after N m m m m m m
Slovenia Cross cohort 2009-11 within N m m m m m m 1004 years G & 3-4 years V 2 years after N m m m m m m
Spain Cross cohort 2008-09 within N m m m m m m m2 years G & V 2 years after N m m m m m m
Sweden5 True cohort 2007 within N 50 49 50 37 36 38 1003 years G & V 2 years after N 1 1 2 1 1 1
Turkey True cohort 2008-09 within N 22 20 25 23 22 26 794-5 years G & 4 years V 2 years after N m m m m m m
United Kingdom True cohort 2006 within N 50 46 54 m m m m2 years 2 years after N m m m m m m
United States Longitudinal sample survey
2002 within N m m m m m m 983 years G & V 2 years after N m m m m m m
OECD average6 within N 56 56 60 43 42 43m
2 years after N m m m m m m
Note: Data presented in this table come from a special survey in which 29 countries participated and only concern initial education programmes. Refer to Annex 3 for details concerning this indicator, including methods used, programmes included/excluded, year of entry, etc.1. ISCED 3 general programmes entrants who graduated from either a general or vocational programme.2. ISCED 3 vocational programmes entrants who graduated from either a general or vocational programme.3. ISCED 3 general programmes entrants who graduated from a vocational programme.4. ISCED 3 vocational programme entrants who graduated from a general programme.5. Excluding students having continued their studies in the adult education system.6. OECD average for N + 2 corresponds to the OECD average for N + the difference (in percentage points) of the average for countries with N and N + 2 data.Source: OECD. See Annex 3 for notes (www.oecd.org/edu/eag.htm).Please refer to the Reader’s Guide for information concerning the symbols replacing missing data.1 2 http://dx.doi.org/10.1787/888933115217

A2
How many students are expected to complete upper secondary education? – IndIcAtor A2 chapter A
Education at a Glance 2014: OECD Indicators © OECD 2014 73
Table A2.5. Successful completion of upper secondary programmes, by programme orientation and durationRatio of graduates to new entrants, based on cohorts
N = theoretical duration
Completion of general programmes1 Completion of vocational programmes2
Total 2 years 3 years 4 years Total 2 years 3 years 4 years 5 years
oecd Austria within N 71 a a 71 m m m m m
2 years after N m a a m m m m m mBelgium (Fl.) within N 81 a m 81 62 m m 62 m
2 years after N 95 a m 95 80 m m 80 mCanada within N m a m m m m m m m
2 years after N m a m m m m m m mChile within N 66 a a 66 60 a a 60 a
2 years after N 79 a a 79 74 a a 74 aDenmark within N 81 a 81 m 35 53 m 30 80
2 years after N 89 a 89 m 53 69 m 49 97Estonia within N 84 a 84 a 60 a 60 60 a
2 years after N 91 a 91 a 66 a 66 66 aFinland within N 80 a 80 n 64 n 64 n n
2 years after N 92 a 92 n 74 n 74 n nFrance within N 61 a 61 a 55 55 a a a
2 years after N 90 a 90 a 69 69 a a aGreece within N 89 a 89 78 76 70 82 69 a
2 years after N m a m m m m m m aHungary within N 87 a a 87 74 a 74 a a
2 years after N m a a m m a m a aIceland within N 47 a m m 37 m m m m
2 years after N 61 a m m 49 m m m mIreland within N m a m m m m m m m
2 years after N m a m m m m m m mIsrael within N 89 a 89 a 85 a 85 m a
2 years after N m a m a m a m m aItaly within N 79 a m m 61 m m m m
2 years after N m a m m m m m m mJapan within N 94 a 94 m 92 m 92 m a
2 years after N m a m m m m m m aKorea within N 97 a m m 90 m m m m
2 years after N m a m m m m m m mLuxembourg within N 64 a a 64 29 41 30 27 29
2 years after N 90 a a 90 64 55 56 70 69Mexico within N 64 a 64 m 57 a 57 m m
2 years after N m a m m m m m m mNetherlands within N 69 67 72 a 57 51 61 62 a
2 years after N 94 92 97 a 73 66 75 78 aNew Zealand within N 69 a 69 n m m m m m
2 years after N 74 a 74 n m m m m mNorway within N 73 a 73 n 40 a m 40 m
2 years after N 83 a 83 n 60 a m 60 mPoland within N 83 a 83 a 72 a 71 73 a
2 years after N m a m a m a m m aSlovak Republic within N 97 a a 97 85 63 74 90 a
2 years after N m a a m m m m m aSlovenia within N 82 a a 82 66 a 78 63 a
2 years after N m a a m m a m m aSpain within N 60 60 a a m m m m m
2 years after N 83 83 a a m m m m mSweden3 within N 76 a 76 a 68 a 68 a a
2 years after N 84 a 84 a 75 a 75 a aTurkey within N 75 a a 75 69 a a 69 a
2 years after N m a a m m a a m aUnited Kingdom within N 67 a m m m m m m m
2 years after N m a m m m m m m mUnited States within N m a m m m m m m m
2 years after N m a m m m m m m m
OECD average4 within N 76 m 79 78 64 m 69 59 m
2 years after N 91 m 92 95 79 m 82 78 m
Note : Please refer to Annex 3 for details concerning this indicator, including methods used, programmes included/excluded, year of entry, etc.1. ISCED 3 general programmes entrants who graduated from either a general or vocational programme.2. ISCED 3 vocational programmes entrants who graduated from either a general or vocational programme.3. Excluding students having continued their studies in the adult education system.4. OECD average for N + 2 corresponds to the OECD average for N + the difference (in percentage points) of the average for countries with N and N + 2 data.Source: OECD. See Annex 3 for notes (www.oecd.org/edu/eag.htm).Please refer to the Reader’s Guide for information concerning the symbols replacing missing data.1 2 http://dx.doi.org/10.1787/888933115236


