
India’s Electric Vehicle Transition
66
Can Electric Mobility Support India’s Sustainable Economic Recovery Post COVID-19? India’s Electric Vehicle Transition Abhinav Soman, Harsimran Kaur, Himani Jain, and Karthik Ganesan Report November 2020
Transcript of India’s Electric Vehicle Transition

Can Electric Mobility Support India’s Sustainable Economic Recovery Post COVID-19?
India’s Electric Vehicle Transition
Abhinav Soman, Harsimran Kaur, Himani Jain, and Karthik Ganesan
Report November 2020
Centre forEnergy Finance
3x 3x
3x3x
x
PANTONE WARM GREY 1C
PANTONE 417C
PANTONE 1805C
BLACK

India’s Electric Vehicle Transition II: Can Electric Mobility Support India’s Sustainable Economic Recovery Post COVID-19?
Image: iStock
An electric mobility future should be accompanied with reigning in of private mobility and promotion of public transport. This is key to achieving energy reduction goals of electric mobility.
CEEW ReportNovember 2020
ceew.in
Can Electric Mobility Support India’s Sustainable Economic Recovery Post
COVID-19?
India’s Electric Vehicle Transition
Abhinav Soman, Harsimran Kaur, Himani Jain, and Karthik Ganesan
Centre forEnergy Finance
3x 3x
3x3x
x
PANTONE WARM GREY 1C
PANTONE 417C
PANTONE 1805C
BLACK

India’s Electric Vehicle Transition II: Can Electric Mobility Support India’s Sustainable Economic Recovery Post COVID-19?
Copyright © 2020 Council on Energy, Environment and Water (CEEW).
Open access. Some rights reserved. This study is licensed under the Creative Commons Attribution-
Noncommercial 4.0. International (CC BY-NC 4.0) license. To view the full license, visit: www.
creativecommons.org/licenses/ by-nc/4.0/legalcode.
Suggested citation: Soman, Abhinav, Harsimran Kaur, Himani Jain, and Karthik Ganesan. 2020. India’s Electric Vehicle
Transition: Can Electric Mobility Support India’s Sustainable Economic Recovery Post COVID-19?. New
Delhi: Council on Energy, Environment and Water.
Disclaimer: The views expressed in this report are those of the authors and do not necessarily reflect the views and
policies of the Council on Energy, Environment and Water.
The views/analysis expressed in this report do not necessarily reflect the views of Shakti Sustainable
Energy Foundation. The Foundation also does not guarantee the accuracy of any data included in this
publication nor does it accept any responsibility for the consequences of its use. For private circulation
only.
Cover image: iStock.
Peer reviewers: Anantha Lakshmi Paladugala, Research Scientist, Center for Study of Science, Technology and Policy;
Apostolos Petropoulos, Energy Modeler, International Energy Agency; Kanv Garg, Director, Ernst &
Young; Rubal Dua, Research Fellow, King Abdullah Petroleum Studies and Research Center; Ryan Laemel,
Manager, Rocky Mountain Institute India; Sahil Ali, Associate Fellow, Brookings India; Sharif Qamar, Area
Convener, The Energy and Resources Institute; Sudhir Gota, Independent Consultant in Sustainable
Transport, and Yagyavalk Bhatt, Research Associate, King Abdullah Petroleum Studies and Research
Center.
Publication team: Alina Sen (CEEW), Mihir Shah (CEEW), The Clean Copy, Twig Designs, and Friends Digital.
Organisations: The Council on Energy, Environment and Water (ceew.in) is one of South Asia’s leading not-for-profit
policy research institutions. The Council uses data, integrated analysis, and strategic outreach to explain
and change the use, reuse, and misuse of resources. It prides itself on the independence of its high-
quality research, develops partnerships with public and private institutions and engages with the wider
public. In 2020, CEEW once again featured across nine categories in the 2019 Global Go To Think Tank
Index Report. It has also been consistently ranked among the world’s top climate change think tanks.
Follow us on Twitter @CEEWIndia for the latest updates.
Shakti Sustainable Energy Foundation seeks to facilitate India’s transition to a sustainable energy
future by aiding the design and implementation of policies in the following areas: clean power, energy
efficiency, sustainable urban transport, climate change mitigation and clean energy finance.
Council on Energy, Environment and Water Sanskrit Bhawan, A-10 Qutab Institutional Area, Aruna Asaf Ali Marg, New Delhi - 110067, India

About CEEW
The Council on Energy, Environment and Water (CEEW) is one of Asia’s leading not-for-profit policy research institutions. The Council uses data, integrated analysis, and strategic outreach to explain — and change — the use, reuse, and misuse of resources. The Council addresses pressing global challenges through an integrated and internationally focused approach. It prides itself on the independence of its high-quality research, develops partnerships with public and private institutions, and engages with the wider public.
The Council’s illustrious Board comprises Mr Jamshyd Godrej (Chairperson), Mr Tarun Das, Dr Anil Kakodkar, Mr S. Ramadorai, Mr Montek Singh Ahluwalia, Dr Naushad Forbes, Ambassador Nengcha Lhouvum Mukhopadhaya, and Dr Janmejaya Sinha. The 100 plus executive team is led by Dr Arunabha Ghosh. CEEW is certified as a Great Place To Work®.
In 2020, CEEW once again featured extensively across nine categories in the 2019 Global Go To Think Tank Index Report, including being ranked as South Asia’s top think tank (15th globally) in our category for the seventh year in a row. CEEW has also been ranked as South Asia’s top energy and resource policy think tank for the second year running. It has consistently featured among the world’s best managed and independent think tanks, and twice among the world’s 20 best climate think tanks. In ten years of operations, The Council has engaged in 278 research projects, published 212 peer-reviewed books, policy reports and papers, created 100+ new databases or improved access to data, advised governments around the world nearly 700 times, promoted bilateral and multilateral initiatives on 80+ occasions, and organised 350+ seminars and conferences. In July 2019, Minister Dharmendra Pradhan and Dr Fatih Birol (IEA) launched the CEEW Centre for Energy Finance. In August 2020, Powering Livelihoods — a CEEW and Villgro initiative for rural start-ups — was launched by Minister Mr Piyush Goyal, Dr Rajiv Kumar (NITI Aayog), and H.E. Ms Damilola Ogunbiyi (SEforAll). The Council’s major contributions include: The 584-page National Water Resources Framework Study for India’s 12th Five Year Plan; the first independent evaluation of the National Solar Mission; India’s first report on global governance, submitted to the National Security Adviser; irrigation reform for Bihar; the birth of the Clean Energy Access Network; work for the PMO on accelerated targets for renewables, power sector reforms, environmental clearances, Swachh Bharat; pathbreaking work for the Paris Agreement, the HFC deal, the aviation emissions agreement, and international climate technology cooperation; the concept and strategy for the International Solar Alliance (ISA); the Common Risk Mitigation Mechanism (CRMM); critical minerals for Make in India; modelling uncertainties across 200+ scenarios for India’s low-carbon pathways; India’s largest multidimensional energy access survey (ACCESS); climate geoengineering governance; circular economy of water and waste; and the flagship event, Energy Horizons. It recently published Jobs, Growth and Sustainability: A New Social Contract for India’s Recovery.
The Council’s current initiatives include: A go-to-market programme for decentralised renewable energy-powered livelihood appliances; examining country-wide residential energy consumption patterns; raising consumer engagement on power issues; piloting business models for solar rooftop adoption; developing a renewable energy project performance dashboard; green hydrogen for industry decarbonisation; state-level modelling for energy and climate policy; reallocating water for faster economic growth; creating a democratic demand for clean air; raising consumer awareness on sustainable cooling; and supporting India’s electric vehicle and battery ambitions. It also analyses the energy transition in emerging economies, including Indonesia, South Africa, Sri Lanka and Viet Nam.
The Council has a footprint in 21 Indian states, working extensively with state governments and grassroots NGOs. It is supporting power sector reforms in Uttar Pradesh and Tamil Nadu, scaling up solar-powered irrigation in Chhattisgarh, supporting climate action plans in Gujarat and Madhya Pradesh, evaluating community-based natural farming in Andhra Pradesh, examining crop residue burning in Punjab, and promoting solar rooftops in Delhi and Bihar.

India’s Electric Vehicle Transition II: Can Electric Mobility Support India’s Sustainable Economic Recovery Post COVID-19?

Acknowledgments
We, the authors of this report, thank Shakti Sustainable Energy Foundation and Electric Mobility Initiative for supporting our research and providing critical feedback at various stages of the study.
The peer reviewers—Anantha Lakshmi Paladugala (Center for Study of Science Technology and Policy), Apostolos Petropoulos (International Energy Agency), Kanv Garg (Ernst & Young), Rubal Dua (King Abdullah Petroleum Studies and Research Center), Ryan Laemel (Rocky Mountain Institute India), Sahil Ali (Brookings India), Sharif Qamar (The Energy and Resources Institute), Sudhir Gota (independent consultant, sustainable transport), and Yagyavalk Bhatt (King Abdullah Petroleum Studies and Research Center)—patiently read through our draft analysis in depth, provided critical comments, and offered crucial and highly relevant suggestions. This went a long way in upgrading the quality of the report in terms of its narrative and analysis. We owe them an immense debt of gratitude.
The internal reviewers Vaibhav Chaturvedi and Vaibhav Pratap Singh took great care to provide a detailed review and suggestions. Their input enhanced the rigour of our modelling and analysis. We profusely thank them.
We thank our colleagues at the CEEW, Deepa Janakiraman and Tirtha Biswas, for gathering data from the Annual Survey of Industries (ASI), which we used for building the analysis on value-addition and jobs from various sectors. We also thank Poonam Nagarkoti for helping us through the GCAM-India model and providing us with the underlying data from the multi-modal assessment study of energy from India’s transportation sector.
Finally, our outreach team and editors, particularly Alina Sen (Communications Specialist), guided us through the publication process. We are very grateful to the entire team and especially convey our warm thanks to Alina for her role in ensuring that the report meets the CEEW’s quality standards at the same time aiding us in constructing our narrative as a compelling story through data and visuals.

India’s Electric Vehicle Transition II: Can Electric Mobility Support India’s Sustainable Economic Recovery Post COVID-19?
The authors
Abhinav Soman [email protected]
As a Programme Associate at The Council, Abhinav Soman researches the transitions required at three levels to enable sustainable mobility: the transport sector, urban mobility, and the auto-industry. Abhinav holds a Bachelor’s degree in Biotechnology from VIT University and a Master’s in Sustainable Development from the University of Cambridge where he was a Chevening scholar.
Harsimran Kaur [email protected]
As a Research Analyst at The Council, Harsimran Kaur engages in researching on strategies to decarbonise the transport sector and deeply analysing policy interventions for promoting sustainable mobility in urban India. Harsimran holds a Bachelor’s degree in Electrical Engineering from GGS Indraprastha University, and a Master’s in Renewable Energy Engineering from TERI School of Advanced Studies.
“Electric mobility is key to ‘build back better’ and a sustainable recovery post COVID-19 as we have analysed in this study. India can become a global EV manufacturing hub with co-ordinated efforts between industry and policymakers.”
“EV transition, like any major technological transition, has its own set of trade-offs, but nothing that can’t be tackled. While charting the course to an EV future, it is imperative that we are mindful of these trade-offs and take adequate steps to counter them.”

The authors
Himani Jain [email protected]
As a Senior Programme Lead at The Council, Himani Jain displays a keen interest in accessible streets, safe mobility, and urban planning. Himani has over 17 years of experience in land use and transport planning, road safety, participatory approaches, campaigns, and business solutions development. Himani is a professionally trained urban regional planner. She holds a doctorate degree in transport planning from IIT Delhi.
Karthik Ganesan [email protected]
Leading The Council’s work on the power sector, Karthik Ganesan’s research focuses on the operational reform of discoms in India and the competitiveness of various power generation sources. When commuting, he counts the number of single occupancy cars he sees each day. Karthik holds a Master’s degree in Public Policy from the Lee Kuan Yew School of Public Policy at the National University of Singapore. He also holds an undergraduate degree in Civil Engineering and an M.Tech in Infrastructure Engineering from the Indian Institute of Technology, Madras.
“For smooth EV transition, several government-induced initiatives are necessary in ecosystem. These include fiscal tools to enhance investment, incentives for setting domestic value chain, skilled work force and enhancing local demand.”
“India’s BAU scenario is essentially one which will see a significant rise in private vehicle ownership. Electrification will merely be a cosmetic makeover for the already strained system. Planning for effective public transit, especially post-pandemic, must take priority.”

India’s Electric Vehicle Transition II: Can Electric Mobility Support India’s Sustainable Economic Recovery Post COVID-19?
Image: iStock
Long term and stable EV policies are needed to attract investment into EV component manufacturing.

Contents
Executive summary
Annexure I: Vehicle stock model
Annexure II: Estimation of jobs
References
4. Conclusions
3.1 Vehicle stock in 20303.2 Fleet of 2030: the many futures3.3 Outcomes of a 30 per cent EV penetration in 20303.4 Assessment of economy-wide impacts3.5 Emissions
3. Results and discussion
2. Methodology
1.1 Background 1.2 Electric mobility in India
1. Introduction 1
7
11
29
31
35
42
1
4
1216171826
i

India’s Electric Vehicle Transition II: Can Electric Mobility Support India’s Sustainable Economic Recovery Post COVID-19?
Tables
Figures
Table 1: Description of scenarios explored in the study
Table A1: Market shares of cars, UVs and taxis under the ‘car’ category in the projected years in BAU
Table A2: Annual distance travelled per vehicle
Table A3: Load factor per vehicle
Table A4: Fuel economy of the vehicles
Table A5: Studies used for the comparison and validation of projections
Table A6: Job coefficient considered for estimation of jobs
Table A7: Job coefficient considered for manufacturing of an EV charger
Table A8: Costs of EVs in 2030
Table A9: Costs of ICE vehicles in 2030
Table A10: Types of public chargers for different vehicle segments
Table A11: Costs of public chargers
Figure ES1: If EVs garner 30 per cent share of India’s vehicle sales by 2030, it would result in a slew of gains
Figure ES2: EV transition includes trade-offs, the impacts of which can be staved off through prescient planning
Figure 1: EV transition rings in cumulative benefits on the economy
Figure 2: The energy sector is likely to see a paradigm shift due to EV transition
Figure 3: EV sales in India have grown by at least nine times in four years
Figure 4: Outline of the vehicle stock model
Figure 5: In the fuel mix of new sales by 2030, between BAU and EV30 scenarios, two-wheelers and three-wheelers are likely to have a higher proportion of EVs
Figure 6: A flow chart depicting our vehicle stock and fuel consumption projections in three mobility paradigm scenarios
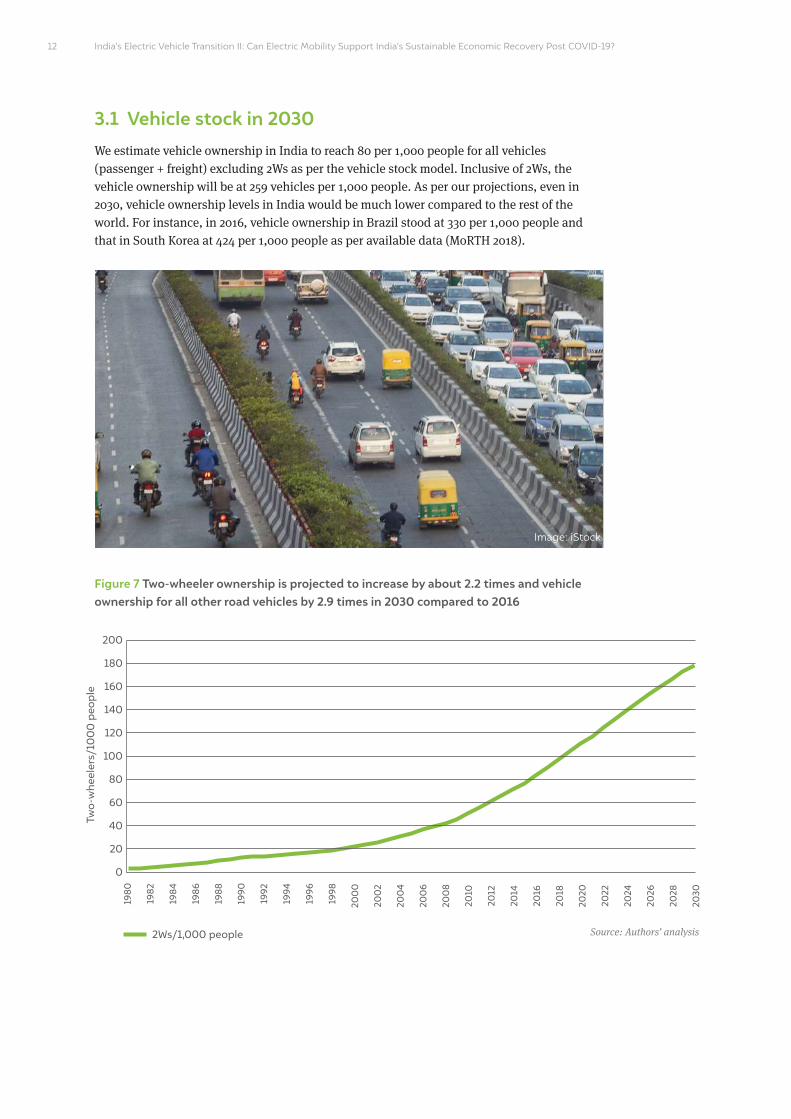
Figure 7: Two-wheeler ownership is projected to increase by about 2 times and vehicle ownership for all other road vehicles by 2.9 times in 2030 compared to 2016
Figure 8: Passenger travel demand is estimated to increase by about 1.9 times between 2020 and 2030
Figure 9: A comparison of projected passenger travel demand and energy demand in 2030 by various models with our estimate
Figure 10: Comparison of stock projections for 2030 between NITI-RMI and this study’s estimate
Figure 11: Vehicle ownership projections in 2030 are sensitive to the saturation level assumption
10
37
37
ii
38
40
iii
41
42
2
42
3
43
5
43
7
44
8
44
9
13
14
14
15
12,13
Figures
Figure 12: A high public transport scenario has about 17 per cent lower fuel consumption compared to BAU in 2030
Figure 13: On-road stock in a high public transport scenario would be about 57 per cent lower compared to a high private vehicle scenario in 2030
Figure 14: Energy demand is about 12 per cent lower in case of 30 per cent EV penetration compared to a BAU scenario in 2030
Figure 15: If EVs garner 30 per cent share of India’s vehicle sales by 2030, it would result in a slew of gains
Figure 16: A 30 per cent EV transition by 2030 will come with its own set of trade-offs
Figure 17: Oil import bill to the exchequer is the about 31 per cent lower in a scenario with high public transport mode-share and 30 per cent EVs in 2030
Figure 18: The consumption of petrol and diesel is highest in the high private vehicle mobility scenario and lowest in the high public transport mobility scenario
Figure 19: Central and state governments would incur a loss of 15 per cent in revenue from the sale of petrol and diesel in an EV30 scenario relative to BAU
Figure 20: Electricity duty revenue increases manifold in various EV30 scenarios compared to BAU
Figure 21: The total cost of ownership of electric vehicles is expected to decrease by 9-20 per cent compared to their ICEV counterparts in 2030
Figure 22: Job intensity is the lowest in oil production and highest in ICE car powertrain manufacturing
Figure 23: About 1.2 lakh jobs in the EV value chain are expected to be created in an EV30 scenario
Figure 24: In multiple EV30 scenarios, 19–49 per cent of jobs are likely to be lost in the petroleum sector and ICE vehicle manufacturing activities compared to BAU
Figure 25: A 30 per cent EV sales scenario is likely to create a market opportunity of more than INR 2 lakh crore (USD 26 billion) for EV powertrain and batteries in 2030
Figure 26: A 30 per cent EV sales in 2030 is likely to create a market size of about INR 13,372 crore (USD 1.8 billion) for public charging infrastructure
Figure 27: Higher private vehicle ownership pollutes the environment in Indian cities while shared mobility and high public transport usage lower the emissions of pollutants
Figure A1: Saturation levels vary significantly across various geographies, with the North American pattern showing the highest saturation level and Asian pattern displaying the lowest saturation
Figure A2: 2Ws occupy a large chunk of vehicle stock and buses cater to the maximum passenger demand
Figure A3: 2Ws would take the lion’s share of EV sales projected in 2030 under various scenarios
16
17
17
18
19
20
21
21
22
22
23
24
24
25
26
27
36
39
43

India’s Electric Vehicle Transition II: Can Electric Mobility Support India’s Sustainable Economic Recovery Post COVID-19?
Acronyms
2Ws two-wheelers
3Ws three-wheelers
ANL Argonne National Laboratory
CSTEP Center for Study of Science, Technology and Policy
e-2Ws electric two-wheelers
e-3Ws electric three-wheelers
e-buses electric buses
e-cars electric cars
e-rickshaws electric rickshaws
e-taxis electric taxis
EV electric vehicle
EVSE electric vehicle supply equipment
FY Financial year
GCAM global change assessment model
ICE internal combustion engine
ICEV internal combustion engine vehicle
IIMA Indian Institute of Management, Ahmedabad
IRADe Integrated Research and Action for Development
LBNL Lawrence Berkeley National Laboratory
MoPNG Ministry of Petroleum and Natural Gas
MoRTH Ministry of Road Transport and Highways
MoSPI Ministry of Statistics and Program Implementation
Mtoe Million tonnes of oil equivalent
NITI National Institution for Transforming India
PKM passenger kilometre
PNNL Pacific Northwest National Laboratory
RMI Rocky Mountain Institute
TCO total cost of ownership
TERI The Energy and Resources Institute
TKM tonnes kilometre
UNEP–DTU United Nations Environment Programme and Technical University of Denmark Partnership
UVs utility vehicles
VKT Vehicle kilometres travelled

Definitions
2W Any two-wheeled vehicle propelled by any type of power other than pedalling (including but not restricted to internal combustion engines and electric motors) intended for private use only.
3W Any three-wheeled vehicle propelled by a motor, generally used for commercial transport of passengers.
4W Any four-wheeled vehicle propelled by an internal combustion engine or an electric motor intended for private or commercial use. It includes cars, jeeps, vans, buses, light and heavy commercial vehicles, and trucks.
Financial year April 1 to March 31
Mode-share Percentage of total passenger kilometres carried out on a particular mode of transportation.
Passenger kilometres It is the unit of measurement representing the total distance travelled by the passengers on a particular mode of transport in a year.
Powertrain The mechanism by which power is transmitted to the axle of the vehicle. It includes electric drives, power electronics, and vehicle interface control modules in case of EVs, and engine, transmission, drive shafts, differentials, and the final drive in case of ICEVs.
TCO Total cost of ownership: It is the lifetime cost of the vehicle that includes upfront cost of the vehicle, fuelling expense, maintenance expense, and battery replacement cost in case of EVs.
Utility vehicles It includes a four-wheel drive vehicle with a roomy body, designed for off-road travel. They are included under a broad category of cars in this study.
Value-add It pertains to market value of goods and services produced by an enterprise. Output value-add includes income, value of stock, value of electricity, value of construction, sale goods, and gross sale value as per the Annual Survey of Industries (ASI) schedule.
Vehicle kilometrestravelled
It is the unit of measurement representing the total distance travelled by a particular mode of transport in a year.

India’s Electric Vehicle Transition II: Can Electric Mobility Support India’s Sustainable Economic Recovery Post COVID-19?
Image: iStock
Electric vehicle manufacturing represents a promising segment for India’s economic recovery post-COVID-19.

Among the avenues for economic recovery and sustained growth after the COVID-19 pandemic dies down, paving the path with a transition to electric vehicles (EV) has
immense potential for investment and rapid market growth. The 30 per cent EV transition in 2030 is likely to have a wide-ranging impact on the economy and we focus specifically on changes in oil import, value-addition, employment, impact on public finances, market size for EV components, and environmental gains from reduced local air pollutants and greenhouse gas (GHG) emissions.
We attempt at unpacking these issues by projecting the vehicle stock in 2030 in business-as-usual (BAU) and a scenario with 30 per cent EV penetration. In addition, we explore three different mobility paradigms – (i) high public transport, (ii) high private vehicle and (iii) high shared mobility to gauge the range of impact of mode-share coupled with 30 per cent EV sales in 2030 on the industry, economy and environment. Our key findings and recommendations are summarised as follows.
Electric mobility would support economic recovery
By our estimates, we project the vehicle stock (passenger + freight) to increase by nearly 2.7 times between the base year 2016 and the projected year 2030. We explored the consequences of 30 per cent EV sales (35 per cent in e-two-wheelers [e-2Ws] and e-three-wheelers [e-3Ws]; 30 per cent in electric buses [e-buses]; 25 per cent in electric taxis [e-taxis]; and 13 per cent in electric cars [e-cars]) in in contrast to a business-as-usual (BAU) scenario.
i
Executive summary
We project the vehicle stock (passenger + freight) to increase by nearly 2.7 times between the base year 2016 and the projected year 2030

India’s Electric Vehicle Transition II: Can Electric Mobility Support India’s Sustainable Economic Recovery Post COVID-19?ii
Figure ES1 If EVs garner a share of 30 per cent of new vehicle sales in 2030, it would result in a slew of gains
Source: Authors’ analysis
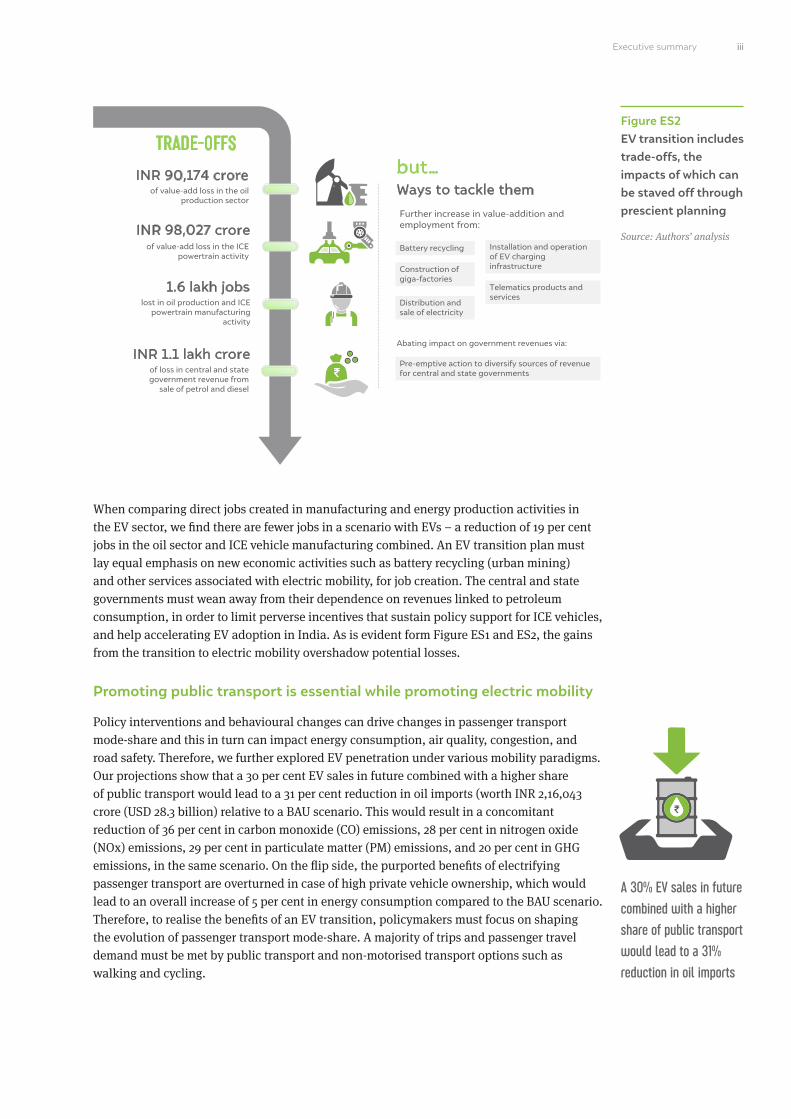
In contrast to a BAU, the gains from 30 per cent electric vehicle (EV) sales in 2030 are hard to miss. With the reduction in oil demand from the passenger road transport sector, India will save on crude oil imports worth INR 1,07,566 crore (USD 14.1 billion). Further, a 17 per cent decrease in particulate matter and NOx emissions, 18 per cent reduction in CO emissions, and 4 per cent reduction in GHG emissions relative to BAU can be expected. In addition to aligning with India’s goals to reduce its oil imports and strengthening its forex reserves, the EV ecosystem presents a market size of INR 2,12,456 crore (USD 27.8 billion) for batteries, powertrains, and charging infrastructure in 2030. Under the right policy environment, supply-chain for EV manufacturing presents an attractive opportunity for future investments providing a much-needed stimulus to the economy. However, any major technological transition is fraught with losses and trade-offs. Figure ES2 highlights some of the major trade-offs from an EV transition.
Image: Vineet Kaul/wikimedia commons
Climate commitments
Public health
Energy security
Multiplier effect of people spending saved money on other goods and services
1.2 lakh jobscreated in EV powertrain, battery
and charger manufacturing and electricity generation sector
INR 2.1 lakh croreof value-add generated in EV
powertrain, battery and charger manufacturing sector
17% of PM and NOx,18% of CO emissions
reduced
16 MtCO2of GHG emissions reduced
9% to 20% lower TCO for EV users
compared to ICE vehicles in the case of 2W, 3W, 4W, and buses
INR 1.1 lakh croreworth of savings with 15%
reduction in crude oil import bill
GAINS
iiiExecutive summary
Figure ES2 EV transition includes trade-offs, the impacts of which can be staved off through prescient planning
Source: Authors’ analysis
When comparing direct jobs created in manufacturing and energy production activities in the EV sector, we find there are fewer jobs in a scenario with EVs – a reduction of 19 per cent jobs in the oil sector and ICE vehicle manufacturing combined. An EV transition plan must lay equal emphasis on new economic activities such as battery recycling (urban mining) and other services associated with electric mobility, for job creation. The central and state governments must wean away from their dependence on revenues linked to petroleum consumption, in order to limit perverse incentives that sustain policy support for ICE vehicles, and help accelerating EV adoption in India. As is evident form Figure ES1 and ES2, the gains from the transition to electric mobility overshadow potential losses.
Promoting public transport is essential while promoting electric mobility
Policy interventions and behavioural changes can drive changes in passenger transport mode-share and this in turn can impact energy consumption, air quality, congestion, and road safety. Therefore, we further explored EV penetration under various mobility paradigms. Our projections show that a 30 per cent EV sales in future combined with a higher share of public transport would lead to a 31 per cent reduction in oil imports (worth INR 2,16,043 crore (USD 28.3 billion) relative to a BAU scenario. This would result in a concomitant reduction of 36 per cent in carbon monoxide (CO) emissions, 28 per cent in nitrogen oxide (NOx) emissions, 29 per cent in particulate matter (PM) emissions, and 20 per cent in GHG emissions, in the same scenario. On the flip side, the purported benefits of electrifying passenger transport are overturned in case of high private vehicle ownership, which would lead to an overall increase of 5 per cent in energy consumption compared to the BAU scenario. Therefore, to realise the benefits of an EV transition, policymakers must focus on shaping the evolution of passenger transport mode-share. A majority of trips and passenger travel demand must be met by public transport and non-motorised transport options such as walking and cycling.
A 30% EV sales in future combined with a higher share of public transport would lead to a 31% reduction in oil imports
iii
INR 90,174 croreof value-add loss in the oil
production sector
INR 98,027 croreof value-add loss in the ICE
powertrain activity
1.6 lakh jobslost in oil production and ICE
powertrain manufacturing activity
INR 1.1 lakh croreof loss in central and state government revenue from
sale of petrol and diesel
TRADE-OFFSbut…
Pre-emptive action to diversify sources of revenue for central and state governments
Ways to tackle them
Battery recycling Installation and operation of EV charging infrastructureConstruction of
giga-factoriesTelematics products and services
Distribution and sale of electricity
Further increase in value-addition and employment from:
Abating impact on government revenues via:

India’s Electric Vehicle Transition II: Can Electric Mobility Support India’s Sustainable Economic Recovery Post COVID-19?
Image: iStock
With decline in battery costs, electric vehicles across vehicle segments will result in a lower Total Cost of Ownership compared to ICE vehicles by 2030.

In a post-COVID world, India needs to take a series of measures to propel economic growth and sustain it in the long term, focusing also on creating jobs. We turn our gaze to the
auto-industry and pitch for a shift in manufacturing from internal combustion engine (ICE) vehicles to electric vehicles (EVs). We analyse the impact of this shift on India’s economic recovery: will it be beneficial or will it be detrimental?
The terrain we traverse to understand the impact of this shift is a two-fold scenario projection encompassing a 10-year horizon:
• Projecting vehicle stock and energy demand for road passenger transport in 2030.
• Mapping and quantifying the impact of the electric mobility transition on various sectors of the Indian economy under different mode-share scenarios. Our key comparative scenario assumes a 30 per cent sales share of EVs in 2030.
We specifically look at the impact of EV transition in terms of opportunities created in the form of reduction in oil import bill, jobs generated, new markets and industries created, improvement in air quality, and reduced greenhouse gas (GHG) emissions. Simultaneously, we foresee a loss in value-addition from some existing industries resulting in reduced jobs in specific activities and also a reduction in government revenues as a result of a drop in the collection of taxes arising from fossil fuel (petrol and diesel) consumption. Any major technology transition is fraught with losses and gains, some of which persist in the short term while others remain over the long term. Our goal in this study is to bring the major considerations to the forefront, for the attention of policymakers and the auto-industry when examining an EV future for India. If the EV sector turns out to be promising for economic recovery, the analysis we present can be used to draw a roadmap that curtails losses and leverages gains from the transition.
Our research is limited to an analysis of motorised road passenger vehicles, battery electric vehicles using lithium-ion battery technology, and conductive point charging unless otherwise specified.
1.1 Background
India’s transition to electric mobility is guided by three main imperatives—energy security, curbing local air pollution, and curtailing GHG emissions from the transport sector. A major transition in transportation technology concerns not just the automotive industry in India but also other sectors with which it has forward and backward linkages: petroleum production,
1. Introduction
Any major technology transition is fraught with losses and gains, some of which persist in the short term while others remain over the long term
1

India’s Electric Vehicle Transition II: Can Electric Mobility Support India’s Sustainable Economic Recovery Post COVID-19?
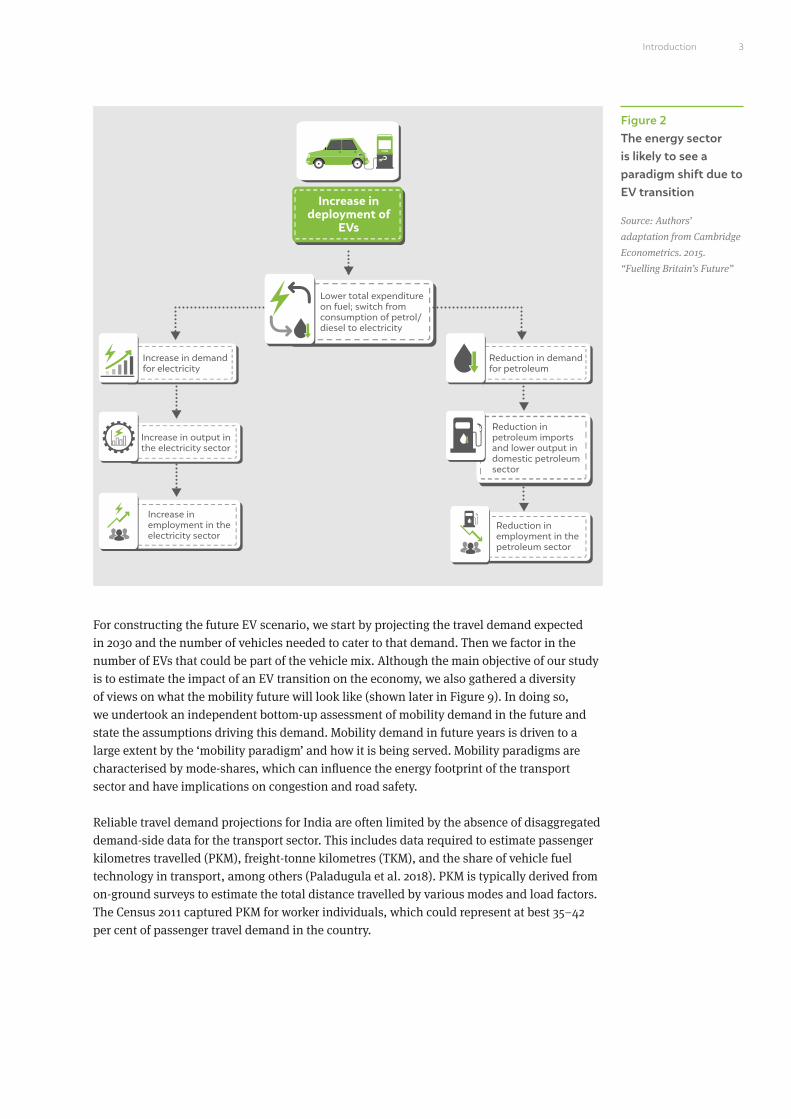
electricity generation, electronics manufacturing, and even public finances on account of change in oil import bill and fuel-tax revenue (ILO 2018). So far, there has been no clear policy mandate for EV penetration. But policymakers in India have set a goal of 30 per cent penetration of EV in new sales by 2030 (Clean Energy Ministerial 2017; PIB 2018). The range of impacts associated with increased deployment of EVs on the economy are captured in Figures 1 and 2.1
2
Figure 1 EV transition rings in cumulative benefits on the economy
Source: Authors’
adaptation from Cambridge
Econometrics. 2015.
“Fuelling Britain’s Future”
1. A net cost reduction in total cost of ownership (TCO) of vehicles could also lead to increased use of vehicles as part of a ‘rebound effect’. However, we have not accounted for this effect in our analysis.
Indirect effect
Induced effect
Multiplier effect
Direct effect
Increase in employment(outside of energy sector)
Increase in deployment of
EVs
Increased investment in EV charging infrastructure
Expansion of low-carbon technology supply-chain
Lower total expenditure on fuel
Net increase in real household disposable income and consumption
Lower cost to consumers and industry
Net reduction in the total cost of ownership
Increase in industry output to meet demand(outside of energy sector)
3Introduction
Figure 2 The energy sector is likely to see a paradigm shift due to EV transition
Source: Authors’
adaptation from Cambridge
Econometrics. 2015.
“Fuelling Britain’s Future”
For constructing the future EV scenario, we start by projecting the travel demand expected in 2030 and the number of vehicles needed to cater to that demand. Then we factor in the number of EVs that could be part of the vehicle mix. Although the main objective of our study is to estimate the impact of an EV transition on the economy, we also gathered a diversity of views on what the mobility future will look like (shown later in Figure 9). In doing so, we undertook an independent bottom-up assessment of mobility demand in the future and state the assumptions driving this demand. Mobility demand in future years is driven to a large extent by the ‘mobility paradigm’ and how it is being served. Mobility paradigms are characterised by mode-shares, which can influence the energy footprint of the transport sector and have implications on congestion and road safety.
Reliable travel demand projections for India are often limited by the absence of disaggregated demand-side data for the transport sector. This includes data required to estimate passenger kilometres travelled (PKM), freight-tonne kilometres (TKM), and the share of vehicle fuel technology in transport, among others (Paladugula et al. 2018). PKM is typically derived from on-ground surveys to estimate the total distance travelled by various modes and load factors. The Census 2011 captured PKM for worker individuals, which could represent at best 35–42 per cent of passenger travel demand in the country.
Increase in deployment of
EVs
Lower total expenditure on fuel; switch from consumption of petrol/diesel to electricity
Increase in demand for electricity
Reduction in demand for petroleum
Increase in output in the electricity sector
Increase in employment in the electricity sector
Reduction in employment in the petroleum sector
Reduction in petroleum imports and lower output in domestic petroleum sector

India’s Electric Vehicle Transition II: Can Electric Mobility Support India’s Sustainable Economic Recovery Post COVID-19?
Aggregated data throws up a bundle of contradictions. As per data from the Ministry of Statistics and Programme Implementation (MoSPI), the road-transport sector consumed about 31 million tonnes of oil equivalent (Mtoe; 12 per cent) of oil in FY18 out of the 262 Mtoe of oil supplied (domestic production + import) in that year (MoSPI 2019). However, using the fuel supply data of the Ministry of Petroleum and Natural Gas (MoPNG), we estimate the fuel consumption for road transport to be around 84 Mtoe (33 per cent) out of a total of 256 Mtoe supplied (MoPNG 2020; PPAC 2013).2 Here, we assume the MoPNG data to be more reliable since it is derived from actual fuel sales. We also compared road-transport fuel consumption estimates derived from the underlying PKM estimates available from the Ministry of Road Transport and Highways (MoRTH) for FY17 with supply-side data from MoPNG for FY17. Here we find that this estimate is significantly higher (approximately by 60 per cent) than road-transport fuel consumption estimated based on the MoPNG fuel sales reports.
The total registered vehicles in India stood at 280 million as of 2017 going by the MoRTH statistics (MoRTH 2019). The actual number of on-road vehicles wouldn’t match this figure, as the transport departments in respective states don’t mandate a vehicle de-registration process. The estimates for privately owned on-road vehicles, therefore, tend to be inaccurate. Surveys have revealed that official statistics overestimate the number of in-use vehicles by as much as 120 per cent (Goel et al. 2016). Hence, historical data on vehicle stocks in India have to be discounted for retired vehicles. Out of three union ministries that could make available data for decision-making on the future of road transport, only one—MoPNG—provides reliable information but lacks the disaggregation needed for robust projections.
1.2 Electric mobility in India
A total of 5,30,560 EVs (including electric two-wheelers [e-2W], electric three-wheelers [e-3W], electric rickshaws [e-rickshaws], electric cars [e-cars], and electric buses [e-buses]) were sold in India (CEEW - Centre for Energy Finance 2020). This remains far from the National Electric Mobility Mission Plan (NEMMP) 2020 target of 6-7 million EV and hybrid sales by 2020. However, there is a steady uptick in the sales of EVs since 2017 as shown in Figure 3. A number of high-voltage electric cars were launched towards the end of 2019 and many more models showcased at the Auto-Expo 2020 were being readied for launch, including Tata Altroz EV, Mahindra eKUV100, and MG Marvel X (Carandbike 2020). The unexpected outbreak of the COVID-19 pandemic and its fallout has disrupted the global supply chains for EV components, mainly power electronics, battery, and the minerals that are used in these components (Wood Mackenzie 2020). The supply chain disruption has cast its shadow over the entire auto-industry, not just the EV sector (ETAuto 2020). The blossoming EV industry in India stares at an unclear future, as experts are divided on how the EV sector will eventually emerge out of the present situation: some have forecast stagnation while others see a possibility of the Indian EV sector becoming a strong contender in the global electric mobility manufacturing space (Panday and Ghosh 2020; Inc42 2020). Policy directives such as Faster Adoption and Manufacturing of (Hybrid and) Electric Vehicles Phase II scheme (FAME II scheme) and Phased Manufacturing Plan have been issued with a clear intent to transition to EVs. But the economy-wide impacts and environmental benefits of an EV transition have not been sufficiently studied in depth. Barring a few policy announcements, the government has not come out with a clear roadmap. A comprehensive policy roadmap and target for EV sales leading up to 2030 is found wanting.
2. We use the share of various consuming segments as per a 2013 Nielsen report commissioned by the Petroleum and Planning Analysis Cell (PPAC) to arrive at this estimate.
4
We estimate the fuel consumption for road transport to be around 84 Mtoe in FY18
A comprehensive policy roadmap and target for EV sales leading up to 2030 is much needed

Figure 3 EV sales in India have grown by at least nine times in four years
Source: Sharma, Yogima.
2019. “Your Electric Vehicle
Dream May Get a Rs 50,000
Jump-Start”; Overdrive.
2016. “Electric Vehicle Sales
Reach 22,000 in India in FY
2015–16”; Frangoul, Anmar.
2020. “Electric Vehicle Sales
in India Jump, with Two-
Wheeled Scooters Driving
Growth”
Note: These sales include
e-2Ws and e-cars only.
For our projections, we explore three ‘marker’ scenarios compared to a business-as-usual (BAU) situation by 2030. These three scenarios we assume have (i) high public transport share, (ii) high private vehicle share, (iii) and high shared mobility. While a change in mode-share is partially influenced by economic growth (and associated paradigms), in our scenarios, we assume that it is mainly the outcome of mobility policy and behaviour change interventions. We characterise these marker scenarios by keeping overall passenger travel demand and the gross domestic product (GDP) constant between scenarios. We have taken a cue from a few studies that explore such scenarios, although keeping these two variables constant is a limitation of our research. To exercise control over the combination of underlying assumptions and to create the aforementioned scenarios, we developed a vehicle stock model. Based on outputs from our vehicle stock model, we further estimate fuel consumption in these three scenarios.
Using the projected vehicle stock in 2030, we estimate passenger and vehicle kilometres travelled (PKM and VKT) under various future scenarios for mobility in India. Our core focus though lies in the comparison between a BAU and a 30 per cent EV sales scenario (EV30), retaining mode-shares as BAU but involving a change in the fuel mix. We also contrast scenarios where a 30 per cent EV penetration is achieved under different mode-shares in serving the projected passenger travel demand, against the BAU. However, we assume occupancy ratio, vehicle ownership vs usage and average trip lengths to be constant, in the absence of robust data. This being another limitation to the study and hence estimates in all three scenarios remain conservative.
FY16 FY17 FY18 FY19 FY200
20,000
40,00022,000
27,000
56,000
1,29,600
1,55,400
60,000
80,000
1,00,000
1,20,000
1,40,000
1,60,000
1,80,000
EV s
ales
5Introduction

India’s Electric Vehicle Transition II: Can Electric Mobility Support India’s Sustainable Economic Recovery Post COVID-19?4
Image: iStock
Auto-industry has forward and backward linkages with several sectors in the economy. A transition to EV manufacturing can therefore have varying effects on other sectors which need to be explored.

7
A range of methodologies, such as time-series analysis, the Gompertz function, artificial neural-network, and log-linear analysis, have been employed for vehicle stock modelling
in the literature. Given the limited transport data available in India and the requirement of our study, we have employed a Gompertz function-based projection for 2030.
Further, due to limitations of the available PKM estimates, we have used vehicle ownership in the Gompertz function as the input as opposed to PKM. We have gathered segment-wise vehicle sales data from the Society of Indian Automobile Manufacturers (SIAM) between 1961 and 2016 to be applied in our projections. We arrive at historical in-use vehicles between 1985 and 2016 by using survival function as derived from on-ground surveys and historical vehicle sales data available from SIAM, as vehicle registration data is not a reliable indicator of vehicles on road (because retired vehicles are not accounted for, as mentioned earlier). See Figure 4 for a depiction of the vehicle stock model.
2. Methodology
Figure 4 Outline of the vehicle stock model
Source: Authors’ analysis
Historical sales
Survival function
Historical GDP
Projected GDP
Projected population
Share of passenger and freight annual vehicle kilometres
Historical on-road
stock
Gompertz function
Projected vehicle
ownershipProjected
vehicle stockSeparation of
passenger and freight vehicles
Historical population
Survival function
Fuel economy
Fuel consumption
Projected new sales
Fuel-mix in new sales
Annual average distance travelled
per vehicle
Stock and sales from the base
year (2016)
Mode-wise market share
(%)
Mode-share projection in pas-km (%)
Input variables
Stages of assessment

India’s Electric Vehicle Transition II: Can Electric Mobility Support India’s Sustainable Economic Recovery Post COVID-19?8
The Gompertz function was then applied to project vehicle ownership until 2030. We do not distinguish between urban and rural segmentation of the vehicle population. Owing to the popularity of two-wheelers in the Indian market and their characteristics, they were modelled separately, and other vehicles such as cars, jeeps, three-wheelers, buses, and freight vehicles were pooled together for the model. We use a saturation level of 250 vehicles per 1,000 people for two-wheelers and 150 vehicles per 1,000 people for other vehicles. We assume a 1.9 per cent year-on-year GDP growth between 2019 and 2020 and 7.4 per cent between 2020 and 2021 based on the post-COVID-19 forecast by the IMF (International Monetary Fund 2020). Further, we assume a GDP growth of 6.4 per cent between 2021 and 2030, based on the compound annual growth rate (CAGR) between 2012 and 2021. The detailed methodology is discussed in the Annexure I.
Scenarios
We draw a comparison between EV sales of 4 per cent in a BAU scenario and a scenario with 30 per cent EV sales by 2030. It’s worth noting that the National Institution for Transforming India (NITI) Aayog and Rocky Mountain Institute (NITI–RMI) study projects a much higher share of EV penetration (NITI Aayog and Rocky Mountain Institute 2019). However, we keep the EV penetration at 30 per cent as India is part of EV30@30 campaign and as the country has committed to achieving that target (Clean Energy Ministerial 2017). See Figure 5 for a fuel mix we have projected for 2030 from our model.
Figure 5 In the fuel mix of new sales by 2030, between BAU and EV30 scenarios, two-wheelers and three-wheelers are likely to have a higher proportion of EVs
Source: Authors’ analysis;
NITI Aayog and Rocky
Mountain Institute. 2019.
“India’s Electric Mobility
Transformation: Progress
to Date and Future
Opportunities”
Buses
Buses
Buses
Taxis
Taxis
Taxis
BAU
NITI-RMI
EV30
Cars
Cars
Cars
3Ws
3Ws
3Ws
2Ws
2Ws
2Ws
Petrol Diesel CNG Electricity
95%
39%
20%
8%
44%
29%
59%
36%
70%
40%
19%
8%
80%
80%
55%
90%
97%
43%
40%
65%
48%
71%
69%
39% 12%
25%
30%
35%
16% 27% 27% 11% 35%
5%
5%
1%
5%
1%
1% 1%
3%
1%
1%
1%
3%
1%
4%
2%1% 1%

9Methodology
The overall vehicle stock can be projected based on the Gompertz function, as described above, but the evolution of mode-share in future cannot be sufficiently represented by a single projection. Therefore, we project mobility paradigms based on three additional scenarios that could emerge by 2030 and explore the consequences of EV penetration in these scenarios as well. These are widely different mobility paradigms compared to the BAU: (i) a high public transport scenario (High PT) with significantly higher share of travel demand met by buses; (ii) a high private vehicles scenario (High PV) with substantial increase in the share of cars and two-wheelers (2W) in 2030; and (iii) a high shared mobility scenario (Shared) with higher share of shared-car trips and limited car ownership (see the flow chart in Figure 6). We are aware that various fuel technologies could also evolve along different pathways by 2030, but we only explore a future with significant penetration of EVs achieved via a supportive policy environment and investment in the EV industry. Therefore, we assume a 30 per cent EV penetration in new sales in 2030, allowing other fuel technologies to evolve as per historical trends in the remaining share of vehicles (see Table 1).
Figure 6 A flow chart depicting our vehicle stock and fuel consumption projections in three mobility paradigm scenarios
Source: Authors’ analysis
Load factor
Annual average distance travelled
per vehicle
Annual average distance travelled
per vehicle
Annual average distance travelled
per vehicle
Vehicle stock in
BAU
Passenger demand in
BAU
Shared mobility scenario
High public transport scenario
High private vehicle
scenario
Mode-wise passenger demand
Shared mobility scenario
Load factor
High public transport scenario
High private vehicle
scenario
Projected mode-wise
stock
Shared mobility scenario
Fuel economy
High public transport scenario
High private vehicle
scenario
Fuel consumption
Shared mobility scenario
Mode-wise market share
High public transport scenario
High private vehicle
scenario
Projected new sales
Mode-shares in 2030
Survival function
Fuel-mix in new sales
Input variables Stages of assessment

India’s Electric Vehicle Transition II: Can Electric Mobility Support India’s Sustainable Economic Recovery Post COVID-19?
Scenario Mode-share (%) EV penetration (%)
High PT
High PV
Shared
BAU
EV30
High PT—EV30
High PV—EV30
Shared—EV30
Cars, UVs Taxis EV2Ws 3Ws ICEVBuses
As noted earlier, mode-share scenarios evolve along different typologies depending upon economic growth rates, which further has an impact on the passenger travel demand. To avoid too many variables complicating our calculations, we assume GDP growth rates and PKM to be constant across the scenarios. We further treat the annual vehicle distance travelled per mode the same across different scenarios. Similarly, the load factor is assumed to be the same in BAU, high PT, and high PV scenarios except for shared mobility, where we assume a load factor of 3 for both taxis and three-wheelers (3Ws). A detailed list of assumptions with sources are tabulated in Tables A2 and A3 in Annexure I.
11
7 21 14 8 50
13
4
4
17 55
96
96
70
70
30
30
5
10 106 5 69
21 11 23 5 40
Table 1 Description of scenarios explored in the study
Source: Authors’ analysis
Note: A detailed mode-wise fuel mix for 2030 has been presented in Figure 5.
496
70 30
496
70 30
10

3. Results and discussion
In this section, we lay out our results on vehicle stock projection and energy demand under our assumed scenarios. We then go on to elaborate using data the impact of the projected
EV transition on oil imports, government revenues, employment, environment and climate, as well as the market opportunity. We assume a 30 per cent EV sales by 2030 in accordance with the government’s target. Our main comparisons in this section are between the BAU and EV30 scenarios unless otherwise specified.
Image: wikimedia commons
11
India’s Electric Vehicle Transition II: Can Electric Mobility Support India’s Sustainable Economic Recovery Post COVID-19?12
3.1 Vehicle stock in 2030
We estimate vehicle ownership in India to reach 80 per 1,000 people for all vehicles (passenger + freight) excluding 2Ws as per the vehicle stock model. Inclusive of 2Ws, the vehicle ownership will be at 259 vehicles per 1,000 people. As per our projections, even in 2030, vehicle ownership levels in India would be much lower compared to the rest of the world. For instance, in 2016, vehicle ownership in Brazil stood at 330 per 1,000 people and that in South Korea at 424 per 1,000 people as per available data (MoRTH 2018).
Figure 7 Two-wheeler ownership is projected to increase by about 2.2 times and vehicle ownership for all other road vehicles by 2.9 times in 2030 compared to 2016
Source: Authors’ analysis2Ws/1,000 people
1980
1982
1984
1986
1988
1990
1992
1994
1996
1998
200
0
200
2
200
4
200
6
200
8
2010
2012
2014
2016
2018
2030
2028
2026
2024
2022
2020
0
200
180
160
140
120
100
80
60
40
20
Two-
whe
eler
s/10
00
peo
ple
Image: iStock

Figure 7 cont...Two-wheeler ownership is projected to increase by about 2.2 times and vehicle ownership for all other road vehicles by 2.9 times in 2030 compared to 2016
Source: Authors’ analysisVs/1,000 people
The total stock of vehicles (passenger + freight) goes up by 165 per cent compared to 2016 (base year), driven by growth in GDP per capita and population. We derive the total passenger demand in billion passenger kilometres (BPKM) in 2030 from the vehicle stock (Figure 8). This requires us to assume a certain change in mode-share based on the methodology described in Annexure I.
1980
1982
1984
1986
1988
1990
1992
1994
1996
1998
200
0
200
2
200
4
200
6
200
8
2010
2012
2014
2016
2018
2030
2028
2026
2024
2022
2020
0
100
90
80
70
60
50
40
30
20
10
Veh
icle
s/10
00
peo
ple
Figure 8 Passenger travel demand is estimated to increase by about 1.9 times between 2020 and 2030
Source: Authors’ analysis
0
2,000
2020 2030
4,000
6,000
8,000
10,000
12,000
14,000
16,00015,391
8,141
18,000
Bill
ion
PK
M
Passenger demand
13Results and discussion
India’s Electric Vehicle Transition II: Can Electric Mobility Support India’s Sustainable Economic Recovery Post COVID-19?
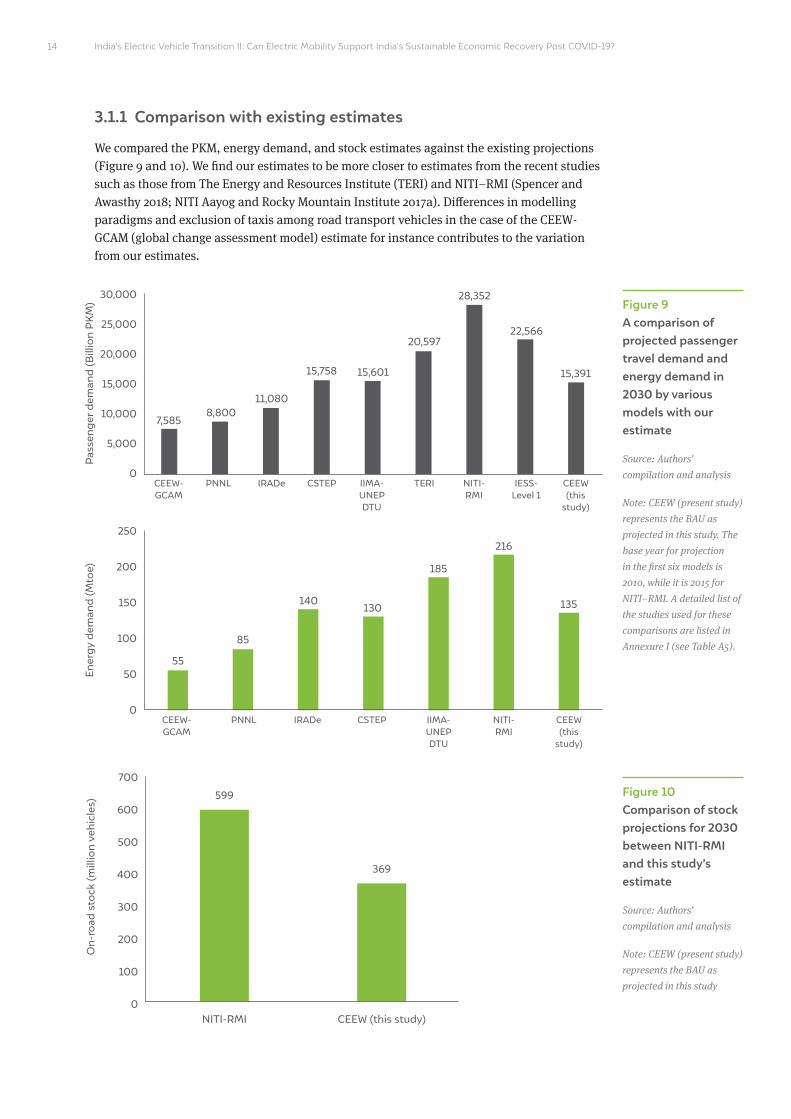
Figure 9 A comparison of projected passenger travel demand and energy demand in 2030 by various models with our estimate
Source: Authors’
compilation and analysis
Note: CEEW (present study)
represents the BAU as
projected in this study. The
base year for projection
in the first six models is
2010, while it is 2015 for
NITI–RMI. A detailed list of
the studies used for these
comparisons are listed in
Annexure I (see Table A5).
0
0
7,585
55
85
140130
185
216
135
8,80011,080
15,758 15,601
20,597
28,352
22,566
15,391
CEEW-GCAM
CEEW-GCAM
PNNL
PNNL
IRADe
IRADe
CSTEP
CSTEP
IIMA-UNEPDTU
IIMA-UNEPDTU
TERI NITI-RMI
NITI-RMI
IESS-Level 1
CEEW (this
study)
CEEW (this
study)
Pas
seng
er d
eman
d (B
illio
n P
KM
)En
erg
y d
eman
d (M
toe)
5,000
50
10,000
100
15,000
150
20,000
200
25,000
30,000
250
14
Figure 10 Comparison of stock projections for 2030 between NITI-RMI and this study’s estimate
Source: Authors’
compilation and analysis
Note: CEEW (present study)
represents the BAU as
projected in this study
0
100
NITI-RMI CEEW (this study)
200
300
400
500
600599
369
700
On-
road
sto
ck (m
illio
n ve
hicl
es)
3.1.1 Comparison with existing estimates
We compared the PKM, energy demand, and stock estimates against the existing projections (Figure 9 and 10). We find our estimates to be more closer to estimates from the recent studies such as those from The Energy and Resources Institute (TERI) and NITI–RMI (Spencer and Awasthy 2018; NITI Aayog and Rocky Mountain Institute 2017a). Differences in modelling paradigms and exclusion of taxis among road transport vehicles in the case of the CEEW-GCAM (global change assessment model) estimate for instance contributes to the variation from our estimates.
3.1.2 Sensitivity analysis
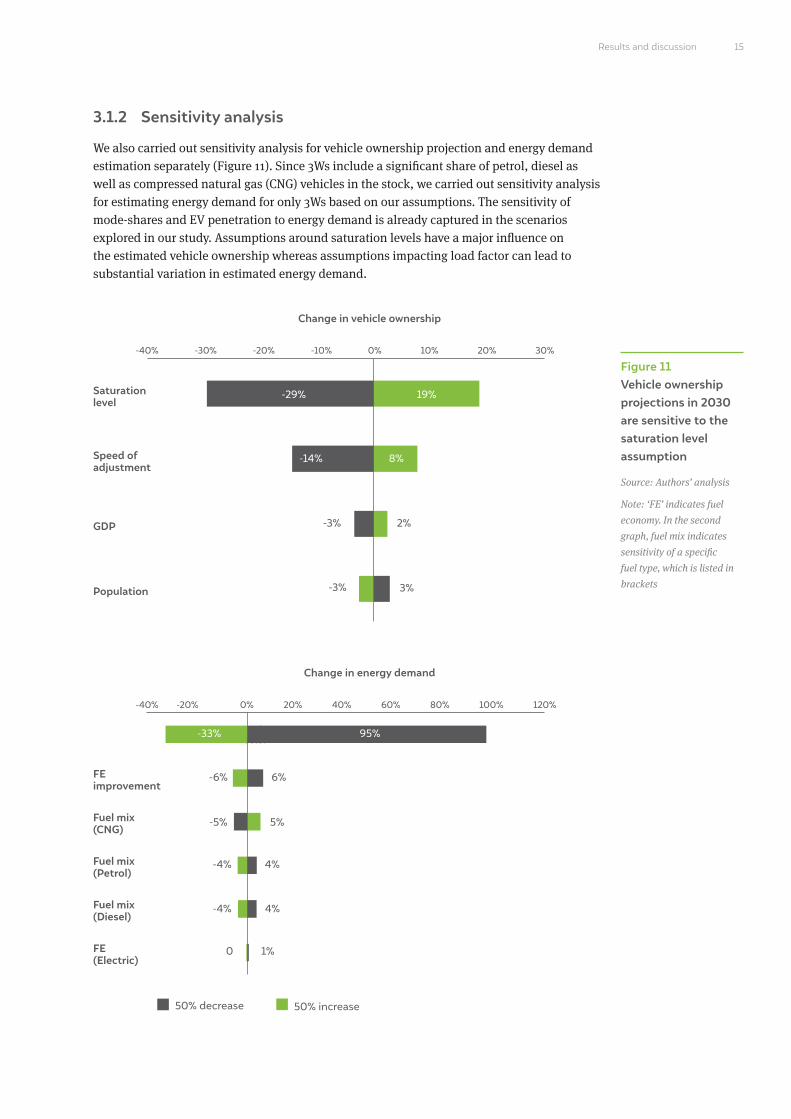
We also carried out sensitivity analysis for vehicle ownership projection and energy demand estimation separately (Figure 11). Since 3Ws include a significant share of petrol, diesel as well as compressed natural gas (CNG) vehicles in the stock, we carried out sensitivity analysis for estimating energy demand for only 3Ws based on our assumptions. The sensitivity of mode-shares and EV penetration to energy demand is already captured in the scenarios explored in our study. Assumptions around saturation levels have a major influence on the estimated vehicle ownership whereas assumptions impacting load factor can lead to substantial variation in estimated energy demand.
Figure 11 Vehicle ownership projections in 2030 are sensitive to the saturation level assumption
Source: Authors’ analysis
Note: ‘FE’ indicates fuel
economy. In the second
graph, fuel mix indicates
sensitivity of a specific
fuel type, which is listed in
brackets
-40%
-40%
-30% -20%
-20%
-10%
Change in vehicle ownership
Change in energy demand
Saturation level
Load factor
FE improvement
Fuel mix (CNG)
Fuel mix (Petrol)
Fuel mix (Diesel)
FE (Electric)
Speed of adjustment
GDP
Population
30%
120%100%80%60%40%
20%
20%
10%0%
0%
50% decrease 50% increase
-29% 19%
95%
-6%
-5%
-4%
-4%
0
6%
5%
4%
4%
1%
-33%
8%-14%
-3%
-3%
2%
3%
15Results and discussion

India’s Electric Vehicle Transition II: Can Electric Mobility Support India’s Sustainable Economic Recovery Post COVID-19?
3.2 Fleet of 2030: the many futures
We further apportioned the total travel demand into mode-share under various scenarios relative to the BAU as shown in Table 1. The multiple mode-share scenarios that may evolve in future are assumed to be a consequence of policies, investments, and behavioural change interventions that prioritise specific modes over others to meet the same travel demand. These mode-shares, in turn, lead to various levels of fuel consumption by the transport sector as presented in Figure 12. As is evident, a high public transport scenario results in the lowest fuel consumption among all the scenarios and about 17 per cent lower than the BAU. At the other end of the spectrum, a high private vehicle scenario results in 17 per cent more fuel consumption compared to BAU.
Figure 12 A high public transport scenario has about 17 per cent lower fuel consumption compared to BAU in 2030
Source: Authors’ analysis
Note: Oil indicates end-use
energy demand for petrol
and diesel
0
20
BAU High PT High PV Shared
40
60
80
100
7
7
7
7
1
1
1
1
120
Ener
gy
dem
and
(Mto
e)
Oil CNG Electricity
The different mode-shares result in changes to the overall vehicle stock number (see Figure 13). The change in the number of vehicles for a particular scenario is directly attributed to the effect of substitution. For example, the PKM demand met by one additional bus is equivalent to PKM demand otherwise fulfilled by 269 motorbikes. Thus, we observe a 57 per cent reduction in the total number of passenger vehicles in a high public transport scenario
128105
152
116
Image: iStock
16

0
100
200
300
400
500
600
Veh
icle
sto
ck (m
illio
ns)
Figure 13 On-road stock in a high public transport scenario would be about 57 per cent lower compared to a high private vehicle scenario in 2030
Source: Authors’ analysisHigh PV BAU Shared High PT
2010
2011
2012
2013
2014
2015
2016
2017
2018
2019
2020
2021
2022
2023
2024
2025
2026
2027
2028
2029
2030
3.3 Outcomes of a 30 per cent EV penetration in 2030
We then explored the outcomes of 30 per cent EV sales under each of the assumed scenarios as shown in Figure 14. Unsurprisingly, we find that energy consumption is highly reduced under high public transport and high shared mobility scenarios (27 per cent and 20 per cent respectively). While fuel consumption benefits are comparable for both these scenarios, but in case of a high public transport scenario, there would be 24 per cent fewer passenger vehicles on road compared to a high shared mobility scenario in 2030. Considering the benefits of better road-space use, lower parking space requirements, and reduced traffic congestion, a high public transport scenario is the preferred mobility scenario for India by 2030.
Figure 14 Energy demand is about 12 per cent lower in case of 30 per cent EV penetration compared to a BAU scenario in 2030
Source: Authors’ analysis
Note: Oil indicates end-use
energy demand for petrol
and diesel
Oil CNG Electricity
0
20
BAU EV30 High PT-EV30 High PV-EV30 Shared EV30
40
60
80
100
160
140
120
Ener
gy
dem
and
(Mto
e)
76
5
5
56
5
5
5
1
128108
89
132
98
3. We estimate that about 211 million 2Ws and 114 million four-wheelers (4Ws) are taken off the road in a hight PT scenario in 2030.
17Results and discussion
compared to a high private vehicle scenario.3 This has important implications beyond the auto-industry, on traffic congestion, air pollution, and parking issues.

India’s Electric Vehicle Transition II: Can Electric Mobility Support India’s Sustainable Economic Recovery Post COVID-19?
3.4 Assessment of economy-wide impacts
Among the many measures to revive the economy in the aftermath of COVID-19, electric mobility should be prioritised as a key sector for India’s economic recovery and sustainable growth. In an EV30 scenario, the domestic value-add generated in manufacturing, reduction in oil import bill, and environmental and health benefits far outweigh the loss in value-addition from the petroleum and automotive sectors as shown in Figure 15.
Figure 15 If EVs garner 30 per cent share of India’s vehicle sales by 2030, it would result in a slew of gains
Source: Authors’ analysis
Image: iStock
18
Climate commitments
Public health
Energy security
Multiplier effect of people spending saved money on other goods and services
1.2 lakh jobscreated in EV powertrain, battery
and charger manufacturing and electricity generation sector
INR 2.1 lakh croreof value-add generated in EV
powertrain, battery and charger manufacturing sector
17% of PM and NOx,18% of CO emissions
reduced
16 MtCO2of GHG emissions reduced
9% to 20% lower TCO for EV users
compared to ICE vehicles in the case of 2W, 3W, 4W, and buses
INR 1.1 lakh croreworth of savings with 15%
reduction in crude oil import bill
GAINS
19Results and discussion
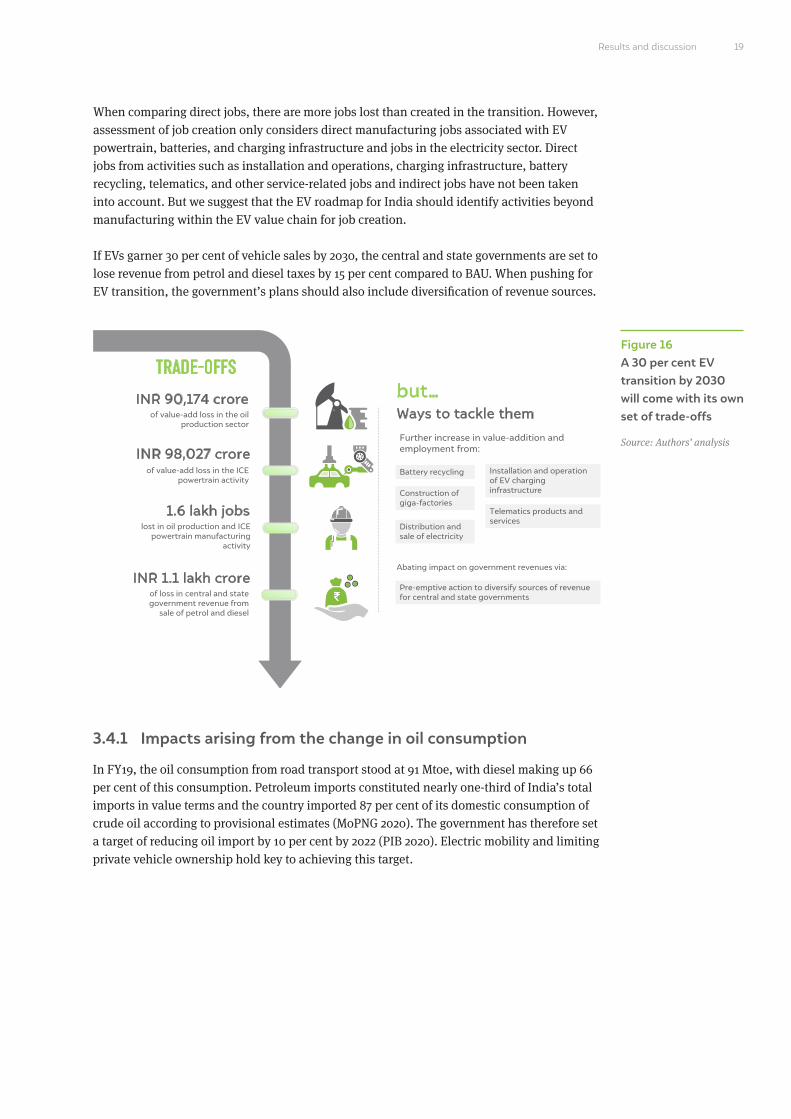
When comparing direct jobs, there are more jobs lost than created in the transition. However, assessment of job creation only considers direct manufacturing jobs associated with EV powertrain, batteries, and charging infrastructure and jobs in the electricity sector. Direct jobs from activities such as installation and operations, charging infrastructure, battery recycling, telematics, and other service-related jobs and indirect jobs have not been taken into account. But we suggest that the EV roadmap for India should identify activities beyond manufacturing within the EV value chain for job creation.
If EVs garner 30 per cent of vehicle sales by 2030, the central and state governments are set to lose revenue from petrol and diesel taxes by 15 per cent compared to BAU. When pushing for EV transition, the government’s plans should also include diversification of revenue sources.
Figure 16 A 30 per cent EV transition by 2030 will come with its own set of trade-offs
Source: Authors’ analysis
3.4.1 Impacts arising from the change in oil consumption
In FY19, the oil consumption from road transport stood at 91 Mtoe, with diesel making up 66 per cent of this consumption. Petroleum imports constituted nearly one-third of India’s total imports in value terms and the country imported 87 per cent of its domestic consumption of crude oil according to provisional estimates (MoPNG 2020). The government has therefore set a target of reducing oil import by 10 per cent by 2022 (PIB 2020). Electric mobility and limiting private vehicle ownership hold key to achieving this target.
INR 90,174 croreof value-add loss in the oil
production sector
INR 98,027 croreof value-add loss in the ICE
powertrain activity
1.6 lakh jobslost in oil production and ICE
powertrain manufacturing activity
INR 1.1 lakh croreof loss in central and state government revenue from
sale of petrol and diesel
TRADE-OFFSbut…
Pre-emptive action to diversify sources of revenue for central and state governments
Ways to tackle them
Battery recycling Installation and operation of EV charging infrastructureConstruction of
giga-factoriesTelematics products and services
Distribution and sale of electricity
Further increase in value-addition and employment from:
Abating impact on government revenues via:

India’s Electric Vehicle Transition II: Can Electric Mobility Support India’s Sustainable Economic Recovery Post COVID-19?20
4. We assume that 100 per cent of the crude oil demand in 2030 is imported as India’s wells are ageing. The country’s oil reserves are likely to see a further decline in future years. We assume the crude oil is imported at USD 60.47 per barrel (bbl) (crude oil price for Indian basket in FY20) prices and account for 8.3 per cent refining losses as per FY19 statistics (MoPNG 2019). However, with the increased penetration of EVs in India and global markets, the oil prices are likely to be lower than the current assumption. We concede this limitation.
5. The import bill savings result from a reduction in petrol and diesel consumption by the road passenger transport sector. The actual value of the oil import bill in 2030 could be higher when accounting for diesel as well as other petroleum product consumption by other sectors.
6. We assume the following: a retail cost of INR 76.73 per litre of petrol and INR 75.19 per litre of diesel and a central excise share of 43 per cent of cost for petrol and 42 per cent of cost for diesel (IOCL 2020b, 2020a). These represent prices in June 2020, at historically low crude oil prices, allowing central and state governments more room to jack-up tax revenue while maintaining the retail price at the same level. We use a low crude oil price assumption to gauge the upper end of nominal revenue loss that could occur in 2030. The average effective tax rate levied by states is 28 per cent for petrol and 20 per cent for diesel (RBI 2020). We do not consider customs duty and other cesses on crude oil collected by the centre in this assessment.
Reduction the petroleum tax revenue of central and state governments
While the intent is to bring down the consumption of petrol and diesel through changes in mode-share and fuel mix (Figure 18), it also has to be borne in mind that the petroleum sector is a significant contributor to revenues for the centre and states in the form of taxes and dividend income. The total revenue realised from taxes on petrol and diesel was INR 5,76,000 crore in FY19, with 60 per cent of these revenues going to the centre and the remaining to the states (PPAC 2020). Tax on fuel constitutes 15–20 per cent of tax revenue for the majority of the states (RBI 2019). Hence, we explored how changing petrol and diesel consumption levels could impact central and state government revenues in 2030.6
Figure 17 Oil import bill to the exchequer is the about 31 per cent lower in a scenario with high public transport mode-share and 30 per cent EVs in 2030
Source: Authors’ analysis0
1,50,000
3,00,000
4,50,000
6,00,000
7,50,000
9,00,000
7,30,8597,04,357
5,96,7915,40,684
4,88,314
Oil
imp
ort
bill
(IN
R c
rore
)
Reduction in oil import bill
The total savings in oil import bill under assumed scenarios range from INR 1,07,566 crore (USD 14.1 billion in 2020 prices) to INR 2,16,043 crore (USD 28.3 billion) as presented in Figure 16.4,5 For comparison, India’s trade deficit in FY20 stood at INR 11,57,108 crore (USD 153 billion) (Suneja 2020).
It is worth noting that, in an EV30 scenario, the oil import bill drops by 15 per cent compared to BAU, while in the case of High PV–EV30 (high private vehicle ownership and 30 per cent EV penetration) scenario, the oil import bill exceeds BAU by 4 per cent. Lower private vehicle ownership, coupled with promotion of electric mobility, would effectively bring down passenger transport energy demand. We find that, in our analysis, the biggest savings in oil imports can be realised from scenarios that combine higher shares of public transport and shared mobility with a penetration of electric vehicles.
High PV-EV30 BAU EV30 Shared EV30 High PT EV30

21Methodology and data sources
Figure 18 The consumption of petrol and diesel is highest in the high private vehicle mobility scenario and lowest in the high public transport mobility scenario
Source: Authors’ analysis
0
30
60
90
120
150
High PV-EV30 BAU EV30 Shared EV30 High PT EV30
Ener
gy
dem
and
(Mto
e)
Petrol Diesel
5541 35 27 22
7687
7371
67
The central government would lose 15–31 per cent of potential petroleum tax revenues (otherwise obtained in a BAU scenario) in 2030 in multiple scenarios we assume for 2030 (Figure 18). The combined state government revenues from petroleum tax could dip by 15–33 per cent under various scenarios compared to BAU. On the other hand, in a high private vehicle scenario, the central and state governments, respectively, gain a revenue of 4 and 8 per cent in the form of fuel taxes. The loss or gain in fuel tax revenue, which is a reflection of consumer spend on petrol and diesel, should be viewed from a larger macroeconomic context. The consumer spending less on fuel is left with a higher disposable income, which, in turn, is expected to increase the consumption of other goods and services in the economy (Cambridge Econometrics 2015).
Figure 19 Central and state governments would incur a loss of 15 per cent in revenue from the sale of petrol and diesel in an EV30 scenario relative to BAU
Source: Authors’ analysis0
1,50,000
3,00,000
4,50,000
6,00,000
BAU
BAU
4,81,859
4,08,349
3,32,975
5,02,317
3,69,191
EV30
EV30
High PV- EV30
High PV- EV30
Shared- EV30
Shared- EV30
High PT- EV30
High PT- EV30
Central Government revenue
Rev
enue
in IN
R c
rore
0
75,000
1,50,000
2,25,000
3,00,0002,58,518
2,19,387
1,74,271
2,78,852
1,95,264
State Government revenue
Rev
enue
in IN
R c
rore

India’s Electric Vehicle Transition II: Can Electric Mobility Support India’s Sustainable Economic Recovery Post COVID-19?22
Assuming current electricity duty rates, revenues generated from increased electricity consumption from EVs will be limited, as shown in Figure 20.7 While pushing for penetration of electric vehicles, both central and state governments need to devise strategies to reduce its impact on their own revenues and wean away from excessive dependence on revenues linked to petroleum consumption.
Figure 20 Electricity duty revenue increases manifold in various EV30 scenarios compared to BAU
Source: Authors’ analysis
7. We assume an average electricity duty of 13 p/kWh and 20 p/kWh for the domestic and commercial consumer, respectively (CEA 2016). Further, we assume that e-2Ws, and private e-cars and e-UVs will be charged at home and e-3Ws, e-taxis, and e-buses will be charged using publicly installed chargers.
8. We include upfront cost, fuelling expenses, maintenance expenses, and battery replacement expenses in the TCO analysis. We estimate the upfront cost by assuming a decline in the cost of batteries as explained in Annexure II and exclude the subsidies applicable today, except for GST which is assumed to be at the same levels as today (28% for ICEVs and 5% for EVs) in 2030.
0
1,500
1,200
900
600
300 170
20%
18%19%
9%
1,399
1,2151,275 1,275
Elec
tric
ity
dut
y re
venu
e (I
NR
cro
re)
Figure 21 The total cost of ownership of electric vehicles is expected to decrease by 9-20 per cent compared to their ICEV counterparts in 20308
Source: Authors’ analysis
BAU EV30 High PV- EV30 Shared- EV30High PT- EV30

Figure 22 Job intensity is the lowest in oil production and highest in ICE car powertrain manufacturing9,10
Source: Authors’ analysis
3.4.2 Impact on employment under various scenarios
In the course of transition to electric mobility, new high-skilled jobs in the manufacturing of batteries, EV powertrain, and charging infrastructure are likely to be created. Additional consumption of electricity will drive job creation in the power sector. Simultaneously, reduced consumption of oil would lead to a reduction in jobs created in the petroleum sector and in internal combustion engine (ICE) vehicle manufacturing. However, it’s important to factor in the job intensity of each of these activities in the economy (see Figure 22). The petroleum value chain (refining, processing, wholesale, and retail) creates the least number of jobs per INR 1 crore of output value-added.
In a 30 per cent EV scenario, around 1,21,422 jobs would be created across the EV value chain in 2030 (Figure 23). This figure includes jobs created in battery, powertrain, and charging infrastructure manufacturing as well as jobs in the electricity sector11 due to increased electricity consumption by EVs.
9. The average cost of supply of INR 5.2/kWh for FY15 was used to arrive at 0.16 jobs/INR crore coefficient for electricity generation (CEA 2020b).
10. The detailed list of coefficients considered for the estimation of jobs in this study are tabulated in Table A6 in the Annexure II.
11. These jobs include operations and maintenance at power plants and excludes manufacturing of equipment and construction of power plants.
23Methodology and data sources
1.59 Jobs/INR crore
0.13 Jobs/INR crore
0.16 Jobs/INR crore
0.45 Jobs/INR crore
0.35 Jobs/INR crore
Battery manufacturing
Electric car powertrain manufacturing
Power generation and maintenance
Oil production ICE car powertrainmanufacturing

India’s Electric Vehicle Transition II: Can Electric Mobility Support India’s Sustainable Economic Recovery Post COVID-19?
Figure 23 About 1.2 lakh jobs in the EV12 value chain are expected to be created in an EV30 scenario
Source: Authors’ analysis
Figure 24 In multiple EV30 scenarios, 19–49 per cent of jobs are likely to be lost in the petroleum sector and ICE vehicle manufacturing activities compared to BAU
Source: Authors’ analysis
If the EV transition at EV30 is realised by 2030, it is likely to result in a reduction of 19 per cent of jobs (1,57,448) in the petroleum13 and automotive (ICE vehicle) sectors as shown in Figure 24. We do not tally the net jobs created, as the current analysis only accounts for direct jobs. We don’t factor in jobs that are likely to be created in battery recycling, installation, and operation of charging infrastructure, and other EV-related services. It is relevant to note that macroeconomic modelling studies accounting for both direct and indirect jobs conducted in countries such as Italy, Britain, and Spain (economies with oil-import dependencies) have concluded that there is a net job creation from a transition to EVs on account higher domestic value-addition and investments as against BAU (Cambridge Econometrics 2015, 2018b, 2018a).
12. This includes jobs created from the manufacturing of battery, EV powertrain, public EV chargers, and operation and maintenance of power plants for electricity generation.
13. These jobs include production of petroleum products and does not include jobs from retail sales of petroleum products.
0
0
30,000
60,000
90,000
1,50,000
4,50,000
1,50,000
-1,50,000
-3,00,000
-4,50,000
-6,00,000
1,20,000
3,00,000
14,340
-1,57,448
-3,06,741
-4,12,011
-2,24,650
-3,44,391
3,80,016
1,84,213
1,21,422
1,39,921
95,26884,246
EV30 High PV- EV30
High PV Shared- EV30
SharedHigh PT High PT- EV30
Cha
nge
in jo
bs
com
par
ed t
o B
AU
Job
s in
EV
val
ue c
hain
The EV transition dynamics also portend bleak prospects for the traditional ICE vehicle-based automotive and petroleum value chain. Jobs will be lost in this value chain irrespective of whether net jobs are created. It is not clear, however, whether the current capacity expansion plans in automotive and petroleum sectors factor in the impacts of EV penetration scenario
BAU EV30 High PV- EV30 Shared- EV30High PT- EV30
24

Figure 25 A 30 per cent EV sales scenario is likely to create a market opportunity of more than INR 2 lakh crore (USD 26 billion) for EV powertrain and batteries in 2030
Source: Authors’ analysis
14. Market size is calculated as the product of the price of the unit and number of units sold. We use market prices for the powertrains of 2Ws, 3Ws, and buses, and value-added in case of 4W powertrain and batteries.
15. We assume the battery size of electric vehicles to remain the same in 2030—2.5 kWh for e-2Ws, 7.3 kWh for e-3Ws, 30 kWh for e-cars, and 142 kWh for e-buses. The battery sizes for e-2Ws and e-3Ws is based on the review of EV models in the market. The battery size for an e-car is based on the report, Study on xEV Market and Opportunities for xEV Component Suppliers, by ACMA & Roland Berger and that for an e-bus is assumed to be an average of the buses procured in the recent years (ACMA, Roland Berger 2018; Khandekar et al. 2018).
16. Powertrain accounts for 25 per cent of the overall cost of the vehicle in case of an e-2W and an e-3W, 30 per cent in case of an e-bus, and 20 per cent in case of an e-car (ACMA, Roland Berger 2018). The proportions of electric powertrain assumption for an e-2W, e-3W, and an e-bus is based on the inputs from industry stakeholders.
which could reduce economic utility and jobs that the two sectors would support in future (with the risk of assets being stranded). As the EV sector scales up, the new jobs created in the EV value chain would require imparting training and skilling to create a workforce that can cater to the needs of EV manufacturing as a prerequisite to meet any anticipated demand for EVs. So, a sound transition plan to identify sectors and activities where fewer jobs would be created in future to abate the adverse impacts and train the existing workforce for new jobs that would be created is very essential for the EV sector to thrive.
3.4.3 Market size for EV components and charging infrastructure in 2030
We further explored the market opportunity created by a demand for EVs in various scenarios that could infuse additional investments into the economy. Specifically, we looked at market size14 for batteries, powertrain, and charging infrastructure.
We estimate that the market size for batteries (for e-2Ws, e-3Ws, e-cars, and e-buses combined) in an EV30 scenario would be INR 53,632 crore (USD 7 billion)15 while that for charging infrastructure would be about INR 13,372 crore (USD 1.8 billion) in 2030. For e-2Ws, e-3Ws, e-cars, and e-buses, the combined market size for electric powertrain amounts to INR 1,45,452 crore (USD 19.1 billion)16 in 2030. In 2019, the market size of the Indian appliance and consumer electronics stood at INR 76,400 crore (USD 10 billion) and is expected to reach INR 1.48 lakh crore (USD 21.8 billion) by 2025 (IBEF 2020). The market size for batteries, powertrain, and charging infrastructure (components with significant share of value-add from electronics) taken together is likely to match the scale of consumer electronics market by 2030 (Figure 25 and 26). Domestic manufacturing of these high value-add components holds the key to capitalising on the market opportunity created.
BAU
INR 6,490 crore
INR 14,225 crore
INR 53,632 crore
INR 1,45,452 crore
INR 33,278 crore
INR 1,14,825 crore
INR 68,916 crore
INR 1,59,013 crore
INR 40,572 crore
INR 1,12,301 crore
EV30 High PV- EV30 Shared- EV30High PT- EV30
25Methodology and data sources
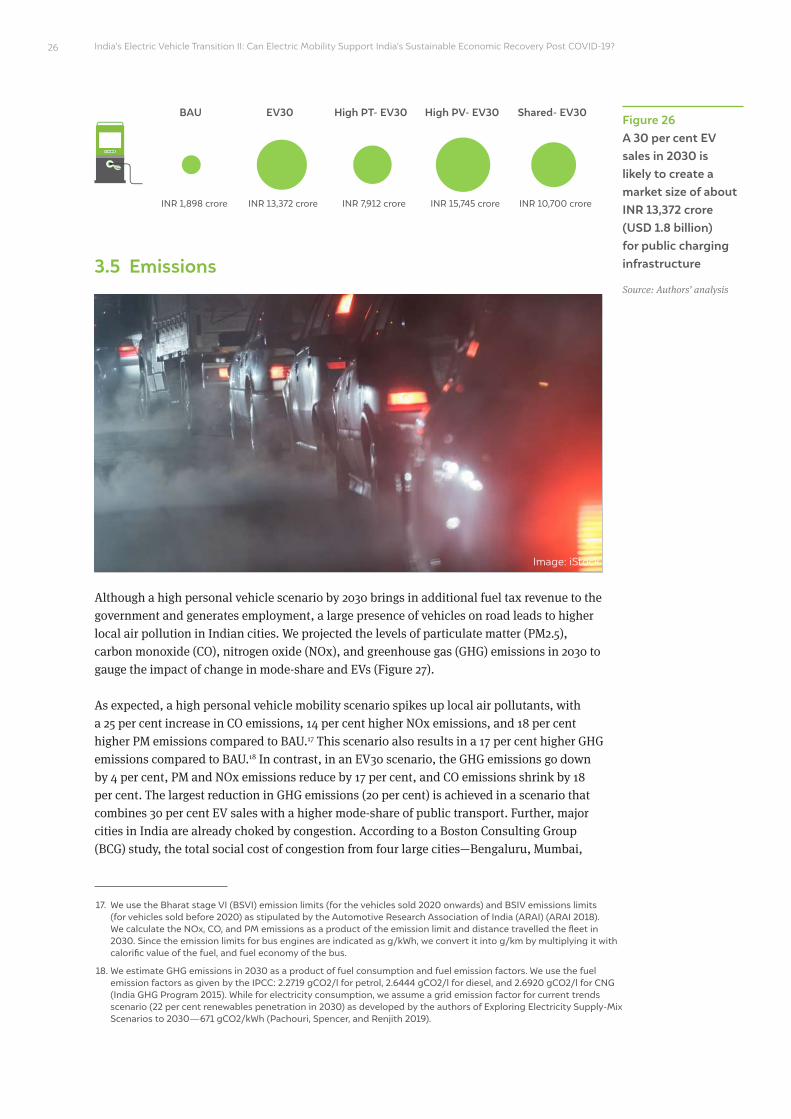
India’s Electric Vehicle Transition II: Can Electric Mobility Support India’s Sustainable Economic Recovery Post COVID-19?
3.5 Emissions
Although a high personal vehicle scenario by 2030 brings in additional fuel tax revenue to the government and generates employment, a large presence of vehicles on road leads to higher local air pollution in Indian cities. We projected the levels of particulate matter (PM2.5), carbon monoxide (CO), nitrogen oxide (NOx), and greenhouse gas (GHG) emissions in 2030 to gauge the impact of change in mode-share and EVs (Figure 27).
As expected, a high personal vehicle mobility scenario spikes up local air pollutants, with a 25 per cent increase in CO emissions, 14 per cent higher NOx emissions, and 18 per cent higher PM emissions compared to BAU.17 This scenario also results in a 17 per cent higher GHG emissions compared to BAU.18 In contrast, in an EV30 scenario, the GHG emissions go down by 4 per cent, PM and NOx emissions reduce by 17 per cent, and CO emissions shrink by 18 per cent. The largest reduction in GHG emissions (20 per cent) is achieved in a scenario that combines 30 per cent EV sales with a higher mode-share of public transport. Further, major cities in India are already choked by congestion. According to a Boston Consulting Group (BCG) study, the total social cost of congestion from four large cities—Bengaluru, Mumbai,
Figure 26 A 30 per cent EV sales in 2030 is likely to create a market size of about INR 13,372 crore (USD 1.8 billion) for public charging infrastructure
Source: Authors’ analysis
17. We use the Bharat stage VI (BSVI) emission limits (for the vehicles sold 2020 onwards) and BSIV emissions limits (for vehicles sold before 2020) as stipulated by the Automotive Research Association of India (ARAI) (ARAI 2018). We calculate the NOx, CO, and PM emissions as a product of the emission limit and distance travelled the fleet in 2030. Since the emission limits for bus engines are indicated as g/kWh, we convert it into g/km by multiplying it with calorific value of the fuel, and fuel economy of the bus.
18. We estimate GHG emissions in 2030 as a product of fuel consumption and fuel emission factors. We use the fuel emission factors as given by the IPCC: 2.2719 gCO2/l for petrol, 2.6444 gCO2/l for diesel, and 2.6920 gCO2/l for CNG (India GHG Program 2015). While for electricity consumption, we assume a grid emission factor for current trends scenario (22 per cent renewables penetration in 2030) as developed by the authors of Exploring Electricity Supply-Mix Scenarios to 2030—671 gCO2/kWh (Pachouri, Spencer, and Renjith 2019).
Image: iStock
INR 1,898 crore INR 13,372 crore INR 7,912 crore INR 15,745 crore INR 10,700 crore
26
BAU EV30 High PV- EV30 Shared- EV30High PT- EV30

Figure 27 Higher private vehicle ownership pollutes the environment in Indian cities while shared mobility and high public transport usage lower the emissions of pollutants
Source: Authors’ analysis
0
0
0
150
10
100
300
20
200
450
30
300
750
50
500
600
40
400
597
39
401 385
332 321
467449
366 351
39 36
30 33 33
28
47
493 511 431
681
569 536
449
BAU
BAU
BAU
EV30
EV30
EV30
High PV- EV30
High PV- EV30
High PV- EV30
High PV
High PV
High PV
Shared
Shared
Shared
Shared- EV30
Shared- EV30
Shared- EV30
High PT- EV30
High PT- EV30
High PT- EV30
High PT
High PT
High PT
NO
X e
mis
sion
s (t
h to
nnes
)P
M e
mis
sion
s (t
h to
nnes
)C
O2 e
mis
sion
s (M
tCO
2)
0
1,500
3,000
4,500
7,500
6,000
BAU
4,855
3,985 3,735 3,125
6,085
5,040 4,231
3,512
EV30 High PV- EV30
High PV Shared Shared- EV30
High PT- EV30
High PT
CO
em
issi
ons
(th
tonn
es) CO emissions
NOX emissions
PM emissions
CO2 emissions
Delhi, and Kolkata—alone amounted to INR 1.68 lakh crore (USD 22 billion) (BCG 2018). India has the highest number of road accident deaths as per the 2018 World Road Statistics report, which compared 199 countries and about 1.5 lakh lives in India were lost in 2018 alone (MoRTH 2018). A predominantly private motor vehicle scenario, apart from polluting the environment in India, also exacerbates costs to the society in the form of congestion and road safety issues.
27Methodology and data sources

India’s Electric Vehicle Transition II: Can Electric Mobility Support India’s Sustainable Economic Recovery Post COVID-19?
Image: iStock
Addressing congestion and road safety will require interventions beyond electrification of transport.

The world is currently reeling under the adverse impact of the COVID-19 pandemic, which has put brakes on economic growth as well. When India emerges out of the pandemic, the
priority for policymakers would be reviving economic growth and creating jobs. We strongly feel that stoking the development of domestic EV manufacturing and creating a market for electric mobility in road passenger transport are promising interventions that foster economic growth and ensure sustainability. We therefore call upon policymakers and industry to collaborate on a transition plan for electric mobility that capitalises on the opportunities created in the form of improvement in balance of payments, new markets, and jobs generated at the same time taking adequate counter-measures to offset the impact on government’s revenues, oil sector, and ICE vehicle manufacturing.
We estimate an 165 per cent increase in vehicular population in the country between 2016 and 2030 to meet India’s growing travel demand. In an EV30 scenario, up to 12 per cent of reduction of oil consumption from passenger transport can be achieved. This strategy corroborates with India’s targeted goals of reducing oil import to improve trade balance and energy security. However, due to reduced fossil fuel consumption, as a result of dwindling share of ICE vehicles in the vehicular population in the country, central and state governments together are likely to incur a loss of revenue of about INR 1.1 lakh crore. This situation requires the government to come up with suitable strategies to wean away from dependence of petroleum tax revenues, which should be pursued in parallel to the promotion of electric mobility.
Importantly, EV penetration presents a tremendous market growth opportunity. The market for high value-add components in a scenario with the projected 30 per cent EV penetration amounts to about INR 2.1 lakh crore (USD 27.8 billion) in 2030 for batteries, electric powertrain, and charging infrastructure. These activities represent parts of the EV supply chain that can generate a significant stimulus for new investments in a favourable policy environment. The new manufacturing activities and increase in electricity consumption are expected to further generate close to 1.2 lakh jobs in 2030. A 30 per cent EV sales scenario is certainly not ambitious given that it can be met via sales of just e-2Ws and e-3Ws, which will have achieved cost competitiveness, both in terms of upfront cost and total cost of ownership by 2030. So, we strongly recommend that the EV roadmap for India should target a significantly higher share of EV penetration.
Merely catalysing electric mobility through policy and financial stimulus (subsidies) is not sufficient. For sustainable mobility, decongesting roads and improving road safety also should form part of plans chalked by policymakers. We recommend shaping and shifting mode-choice of citizens towards public and shared mobility to reduce traffic congestion and enhance road safety. For achieving the mode-share of choice, the central and state
29
4. Conclusions
The market for high value-add components in a scenario with the projected 30 per cent EV penetration amounts to about INR 2.1 lakh crore (USD 27.8 billion) in 2030 for batteries, electric powertrain, and charging infrastructure

India’s Electric Vehicle Transition II: Can Electric Mobility Support India’s Sustainable Economic Recovery Post COVID-19?
governments need to focus on decreasing motorisation through several strategies including incentivising public and shared modes of transport. Apart from widespread EV adoption, scenario in which public transport takes precedence over others has the potential to reduce oil imports by up to 31 per cent (compared to a BAU scenario). If citizens favour public transport and shared mobility, when combined with their shift to electric mobility, it can drastically bring down the level of PM, CO and NOx emissions, thereby having a positive impact on public health in India. Another positive externality in an EV-driven mobility, supplemented by public and shared mobility modes, whose economic costs have not been assessed in this study, is reduced congestion.
Future studies assessing the impact of EV transition on jobs could consider installation and operations jobs associated with charging infrastructure and differentiate between point charging and battery swapping. Further, indirect jobs and job creation in activities beyond vehicle manufacturing such as battery recycling and other services in the EV ecosystem were not assessed in the current study, which can be explored in future work.
For sustainable mobility, decongesting roads and improving road safety also should form part of plans chalked by policymakers
30

31
ACMA, Roland Berger. 2018. “Study on XEV Market and Opportunities for XEV Component Suppliers.”
Anup, Sunitha, and Zifei Yang. 2020. “New Two-Wheeler Vehicle Fleet in India for Fiscal Year 2017–18.” International Council on Clean Transportation. https://theicct.org/sites/default/files/publications/India-2W-fuel%20consumption-2017-18.pdf.
ARAI. 2018. “India Emissions Regulations.” Automotive Research Association of India. https://www.araiindia.com/pdf/Indian_Emission_Regulation_Booklet.pdf.
Arora, Salil, Anant Vyas, and Larry R. Johnson. 2011. “Projections of Highway Vehicle Population, Energy Demand, and CO2 Emissions in India to 2040.” Natural Resources Forum 35 (1): 49–62. doi:10.1111/j.1477-8947.2011.01341.x.
BCG. 2018. “Unlocking Cities - Ridesharing India.” https://image-src.bcg.com/Images/BCG-Unlocking-Cities-Ridesharing-India_tcm9-185213.pdf.
BNEF. 2019. “Electric Vehicle Outlook 2019.” BllombergNEF.
BNEF. 2020. “Electric Vehicle Outlook 2020.” Bloomberg New Energy Finance. https://bnef.turtl.co/story/evo-2020/.
Cambridge Econometrics. 2015. “Fuelling Britain’s Future.” https://www.camecon.com/what/our-work/fuelling-britains-future/.
Cambridge Econometrics. 2018a. “Fuelling Italy’s Future.” https://www.camecon.com/wp-content/uploads/2018/09/FIF-Summary-Report-Engligh.pdf.
Cambridge Econometrics. 2018b. “Fuelling Spain’s Future.” https://www.camecon.com/what/our-work/fuelling-spains-future/.
Carandbike. 2020. “Auto Expo 2020: Top 5 Electric Vehicles.” CarandBike. February 7. https://www.carandbike.com/news/auto-expo-2020-top-5-electric-vehicles-2176792.
CEA. 2016. “Tariff & Duty of Electricity Supply in India.” New Delhi: Central Electricity Authority.
CEA. 2020a. “Report on Optimal Generation Capacity Mix for 2029-30.” New Delhi: Central Electricity Authority. http://cea.nic.in/reports/others/planning/irp/Optimal_mix_report_2029-30_FINAL.pdf.
CEA. 2020b. “Executive Summary on Power Sector April 2020.” New Delhi: Central Electricity Authority. http://cea.nic.in/reports/monthly/executivesummary/2020/exe_summary-04.pdf.
CEEW - Centre for Energy Finance. 2020. “Electric Mobility Dashboard.” CEEW - Centre for Energy Finance. Accessed September 28. https://cef.ceew.in/solutions-factory/tool/electric-mobility.
CSTEP, CEEW, IRADe, PNNL, and TERI. 2019. “Comparison of Decarbonisation Strategies for India’s Land Transport Sector: An Inter Model Assessment.” New Delhi. https://shaktifoundation.in/wp-content/uploads/2019/11/Intermodel-Study_Final-Report.pdf.
Dargay, Joyce, and Dermot Gately. 1999. “Income’s Effect on Car and Vehicle Ownership, Worldwide: 1960-2015.” Transportation Research Part A 33 (1999): 101–38.
References
India’s Electric Vehicle Transition II: Can Electric Mobility Support India’s Sustainable Economic Recovery Post COVID-19?
Dargay, Joyce, Dermot Gately, and Martin Sommer. 2007. “Vehicle Ownership and Income Growth, Worldwide: 1960-2030.” The Energy Journal, October. doi:10.2307/41323125.
Das, Shyamashis, Chandana Sasidharan, and Anirudh Ray. 2019. “Charging India’s Bus Transport.” New Delhi: Alliance for an Energy Efficient Economy. https://www.aeee.in/wp-content/uploads/2019/07/full-report-charging-india-bus-transport.pdf.
Das, Shyamasis, Chandana Sasidharan, and Anirudh Ray. 2020. “Charging India’s Four Wheeler Transport.” Alliance for an Energy Efficient Economy. https://www.aeee.in/wp-content/uploads/2020/06/four-wheeler-report.pdf.
Dhar, Subash, and Priyadarshi Shukla. 2015. “Low Carbon Scenarios for Transport in India: Co-Benefits Analysis.” Energy Policy 81 (June). doi:10.1016/j.enpol.2014.11.026.
Ernst & Young. 2019. “Propelling Electric Vehicles in India: Technical Study on EVs & Charging Infrastructure.” New Delhi. https://beeindia.gov.in/sites/default/files/press_releases/2019%20-%20EY%20to%20BEE%20-%20Technical%20study%20on%20EVs%20%26%20Charging%20Infrastructure.pdf.
ETAuto. 2020. “Opinion: COVID-19 Impact on Indian Automotive Industry - Taking Action in Troubled Times.” ETAuto.Com. https://auto.economictimes.indiatimes.com/news/industry/opinion-covid-19-impact-on-indian-automotive-industry-taking-action-in-troubled-times/74944847.
Frangoul, Anmar. 2020. “Electric Vehicle Sales in India Jump, with Two-Wheeled Scooters Driving Growth.” News. CNBC. April 22. https://www.cnbc.com/2020/04/22/two-wheeled-scooters-drive-electric-vehicle-sales-in-india.html.
Fraunhofer IAO. 2018. “ELAB 2.0 – The Effects of Vehicle Electrification on Employment in Germany.” https://www.ihk-siegen.de/fileadmin/user_upload/ELAB2_0_Vorabbericht_Fraunhofer_IAO.pdf.
Goel, Rahul, Dinesh Mohan, Sarath K. Guttikunda, and Geetam Tiwari. 2016. “Assessment of Motor Vehicle Use Characteristics in Three Indian Cities.” Transportation Research Part D: Transport and Environment 44 (May): 254–65. doi:10.1016/j.trd.2015.05.006.
GOI. 2014. “Auto Fuel Vision and Policy 2025: Report of the Expert Committe.” New Delhi. http://petroleum.nic.in/sites/default/files/autopol.pdf.
Guttikunda, Sarath K., and Dinesh Mohan. 2014. “Re-Fueling Road Transport for Better Air Quality in India.” Energy Policy 68 (May): 556–61. doi:10.1016/j.enpol.2013.12.067.
Huo, Hong, Michael Q. Wang, Larry Johnson, and Dongquan He. 2007. “Projection of Chinese Motor Vehicle Growth, Oil Demand, and CO2 Emissions through 2050.” Transportation Research Record: Journal of the Transportation Research Board, no. 2038. https://trid.trb.org/view/801915.
IASS, TERI, CEEW, and SCGJ. 2019. “Future Skills and Job Creation with Renewable Energy in India. Assessing the Co-Benefits of Decarbonising the Power Sector.” Potsdam: IASS. https://www.ceew.in/sites/default/files/CEEW-%20COBENEFITS-Study-India-Employment%2031Jan20.pdf.
IBEF. 2020. “Indian Consumer Durables Industry Analysis.” India Brand Equity Forum. June. https://www.ibef.org/industry/consumer-durables-presentation.
IEA. 2018. “Global EV Outlook 2018.” https://webstore.iea.org/global-ev-outlook-2018.
IEA. 2020. “Global EV Outlook 2020.” International Energy Agency. https://www.iea.org/reports/global-ev-outlook-2020.
ILO. 2018. “World Employment and Social Outlook 2018 – Greening with Jobs.” https://www.ilo.org/global/publications/books/WCMS_628654/lang--en/index.htm.
32

Inc42. 2020. “Electric Vehicles: The Segment of Choice To Invest in 2020.” Inc42 Media. February 23. https://inc42.com/resources/electric-vehicles-the-segment-of-choice-to-invest-in-2020.
International Monetary Fund. 2020. “World Economic Outlook, April 2020: The Great Lockdown.” IMF. April. https://www.imf.org/en/Publications/WEO/Issues/2020/04/14/weo-april-2020.
Khandekar, Aditya, Deepak Rajagopal, Nikit Abhyankar, Shruti Deorah, and Amol Phadke. 2018. “The Case for All New City Buses in India to be Electric.” 1485102. doi:10.2172/1485102.
MoPNG. 2019. “Indian Petroleum & Natural Gas Statistics 2018-19.” http://petroleum.nic.in/sites/default/files/arep2020.pdf.
MoPNG. 2020. “Indian Petroleum and Natural Gas Statistics 2018-19.” New Delhi: Ministry of Petroleum and Natural Gas. http://petroleum.nic.in/sites/default/files/arep2020.pdf.
MoRTH. 2017. “Review of the Performance of State Road Transport Undertakings.” New Delhi: Ministry of Road Transport and Highways. https://www.morth.gov.in/sites/default/files/Review_2015_2016.pdf.
MoRTH. 2018. “Road Accidents 2018.” https://morth.nic.in/sites/default/files/Road_Accidednt.pdf.
MoRTH. 2019. “Road Transport Year Book 2016-17.” New Delhi: Ministry of Road Transport and Highways. https://morth.nic.in/sites/default/files/Road%20Transport%20Year%20Book%202016-17.pdf.
MoSPI. 2019. “Energy Statistics 2019.” New Delhi: Ministry of Statistics and Programme Implementation. http://mospi.nic.in/sites/default/files/publication_reports/Energy%20Statistics%202019-finall.pdf?download=1.
NITI Aayog, and Rocky Mountain Institute. 2017a. “India Leaps Ahead: Transforming Mobility Solutions for All.” https://niti.gov.in/writereaddata/files/document_publication/NITI-RMI_India_Report_web-v2.pdf.
NITI Aayog, and Rocky Mountain Institute. . 2017b. “India’s Energy Storage Mission.” https://niti.gov.in/writereaddata/files/document_publication/India-Energy-Storage-Mission.pdf.
NITI Aayog, and Rocky Mountain Institute. . 2019. “India’s Electric Mobility Transformation: Progress to Date and Future Opportunities,” 58. https://rmi.org/wp-content/uploads/2019/04/rmi-niti-ev-report.pdf.
Overdrive. 2016. “Electric Vehicle Sales Reach 22,000 in India in FY 2015-16.” Firstpost. April 5. https://www.firstpost.com/auto/electric-vehicle-sales-reach-22000-in-india-in-fy-2015-16-2713140.html.
Pachouri, Raghav, Thomas Spencer, and G. Renjith. 2019. “Exploring Electricity Supply-Mix Scenarios to 2030.” The Energy and Resources Institute, Energy Transition Commission India. https://www.teriin.org/sites/default/files/2019-02/Exploring%20Electricity%20Supply-Mix%20Scenarios%20to%202030.pdf.
Paladugula, Anantha Lakshmi, Nazar Kholod, Vaibhav Chaturvedi, Probal Pratap Ghosh, Sarbojit Pal, Leon Clarke, Meredydd Evans, et al. 2018. “A Multi-Model Assessment of Energy and Emissions for India’s Transportation Sector through 2050.” Energy Policy 116 (May): 10–18. doi:10.1016/j.enpol.2018.01.037.
Panday, Amit, and Malyaban Ghosh. 2020. “Covid-19 Impact: Electric Vehicle Plans May Take Backseat in FY21.” Livemint, April 23, sec. Companies. https://www.livemint.com/companies/news/covid-19-impact-electric-vehicle-plans-may-take-backseat-in-fy21-11587638322306.html.
PIB. 2018. “Shri RK Singh Launches National E-Mobility Programme in India; Congratulates EESL for Installation of 50 Lakh LED Street Lights.” Press Release. March 7. https://pib.gov.in/Pressreleaseshare.aspx?PRID=1523123.
PIB. 2020. “India Will Continue to Lead the Global Sustainable Energy Agenda, Says Shri Dharmendra Pradhan.” Press Information Bueau. January 30. https://pib.gov.in/PressReleseDetailm.aspx?PRID=1601115.
PPAC. 2013. “All India Study on Sectoral Demand of Diesel & Petrol.” http://ppac.org.in/WriteReadData/Reports/201411110329450069740AllIndiaStudyonSectoralDemandofDiesel.pdf.
33References

India’s Electric Vehicle Transition II: Can Electric Mobility Support India’s Sustainable Economic Recovery Post COVID-19?
PPAC. 2020. “Contribution to Central and State Exchequer.” Petroleum Planning & Analysis Cell. https://www.ppac.gov.in/content/149_1_PricesPetroleum.aspx.
RBI. 2019. “State Finances: A Study of Budgets of 2019-20.” Mumbai: Reserve Bank of India. https://rbidocs.rbi.org.in/rdocs/Publications/PDFs/STATEFINANCE201920E15C4A9A916D4F4B8BF01608933FF0BB.PDF.
Rue du Can, Stephane de la, Virginie Letschert, Michael McNeil, Nan Zhou, and Jayant Sathaye. 2009. “Residential and Transport Energy Use in India: Past Trend and Future Outlook.” LBNL-1753E, 951788. doi:10.2172/951788.
Sharma, Yogima. 2019. “Your Electric Vehicle Dream May Get a Rs 50,000 Jump-Start.” Economic Times, February 15. https://economictimes.indiatimes.com/industry/auto/auto-news/your-electric-vehicle-dream-may-get-a-rs-50000-jump-start/articleshow/68001854.cms?from=mdr.
Singh, Sanjay Kumar. 2006. “Future Mobility in India: Implications for Energy Demand and CO2 Emission.” Transport Policy 13 (5): 398–412. doi:10.1016/j.tranpol.2006.03.001.
Spencer, Thomas, and Aayushi Awasthy. 2018. “Analysing and Projecting Indian Electricity Demand to 2030.” https://www.teriin.org/sites/default/files/2019-02/Analysing%20and%20Projecting%20Indian%20Electricity%20Demand%20to%202030.pdf.
Suneja, Kirtika. 2020. “India’s Exports Decline for Fifth Straight Month in December, Trade Deficit Narrows - The Economic Times.” The Economic Times, January 15. https://economictimes.indiatimes.com/news/economy/indicators/indias-exports-decline-for-fifth-straight-month-in-december-trade-deficit-narrows/articleshow/73275220.cms.
TRIPP. 2019. “Improving Operational Efficiency of Bus Systems and Addressing Data Gaps in Vehicular Emissions Management.” Final Grant Report G17SSEF295. Delhi: Transportation ReseaRch and Injury Prevention Programme, Indian Institute of Technogy, Delhi.
United Nations. 2020. “World Population Prospects - Population Division.” United Nations. Accessed May 29. https://population.un.org/wpp/.
Wood Mackenzie. 2020. “Electric Vehicles: Coronavirus Wreaks Havoc across the Supply Chain.” April 8. https://www.woodmac.com/news/opinion/electric-vehicles-coronavirus-wreaks-havoc-across-the-supply-chain/.
World Bank. 2020. “World Development Indicators | DataBank.” The World Bank. Accessed May 29. https://databank.worldbank.org/reports.aspx?source=2&type=metadata&series=SP.POP.TOTL#.
34

Annexure I Vehicle stock model
As described in Chapter 2, we use the Gompertz function to project vehicle stock in 2030. In our calculations, we have used the segment-wise vehicle sales data from SIAM between 1961 and 2016. The sales combined with survival curves from the Transport Research and Injury Prevention Programme (TRIPP 2019) were used to arrive at on-road vehicle stock between 1985 and 2016 as outlined in Equation 1. Since the maximum age of the vehicles (we assume in the calculation) is about 25 years, we arrive at the first on-road vehicle stock in 1985 by using sales data from 1961 and survival curves.
Equation 1: On-road stock estimation
Stock =
where,Stock = on-road stock in year i;k = vehicle age in years, k = 0,1,....m, where m is the maximum age; = new vehicle sales of vehicle type j in year i-k; = survival rates of vehicle type j at age k, where 0 < < 1
Vehicle stock projections: Gompertz function
Typically, the saturation levels reported for other countries exclude 2Ws. So, we have modelled 2Ws separately. Also, given the popularity of the 2Ws in the Indian market, they are likely to follow a growth trajectory different from other vehicles (Arora, Vyas, and Johnson 2011). Thus, 2Ws were modelled separately, and other vehicles such as 3Ws, cars, jeeps, buses, and commercial vehicles were pooled together in the model. We use the Gompertz equation (Equation 2) to model the 2W and vehicle ownership in relation to per-capita GDP (Dargay and Gately 1999).
Equation 2: Gompertz equation used for the vehicle stock model
where,V = vehicle ownership (vehicles per 1,000 people) in year i19;γ = saturation level of vehicle ownership;GDPi = GDP per capita in year i20;α and β = parameters that define the shape of the curve;θ = speed of adjustment for vehicle ownership, with respect to GDP growth (0 < θ < 1)
i
i
i - k,j
i
i
k,jk,j
Sales
V = γθeαe + (1-θ) Vi-1
βGDPi
SRSR
∑ ∑j
m
i - k,j k,jSales SR×k=0
19. We use historical population data (1985–2018) from the World Bank (2020) and the 26th round of United Nations World Population estimates and projections for the years between 2019 and 2030 (United Nations 2020).
20. The time series of GDP data from the World Bank data for years 1985–2018 was used for calculation (World Bank 2020). We use IMF’s projection for 2019 and 2021 and a CAGR of 6.4 per cent between 2022 and 2030, based on the historical CAGR observed between 2012 and 2021 (International Monetary Fund 2020).
35
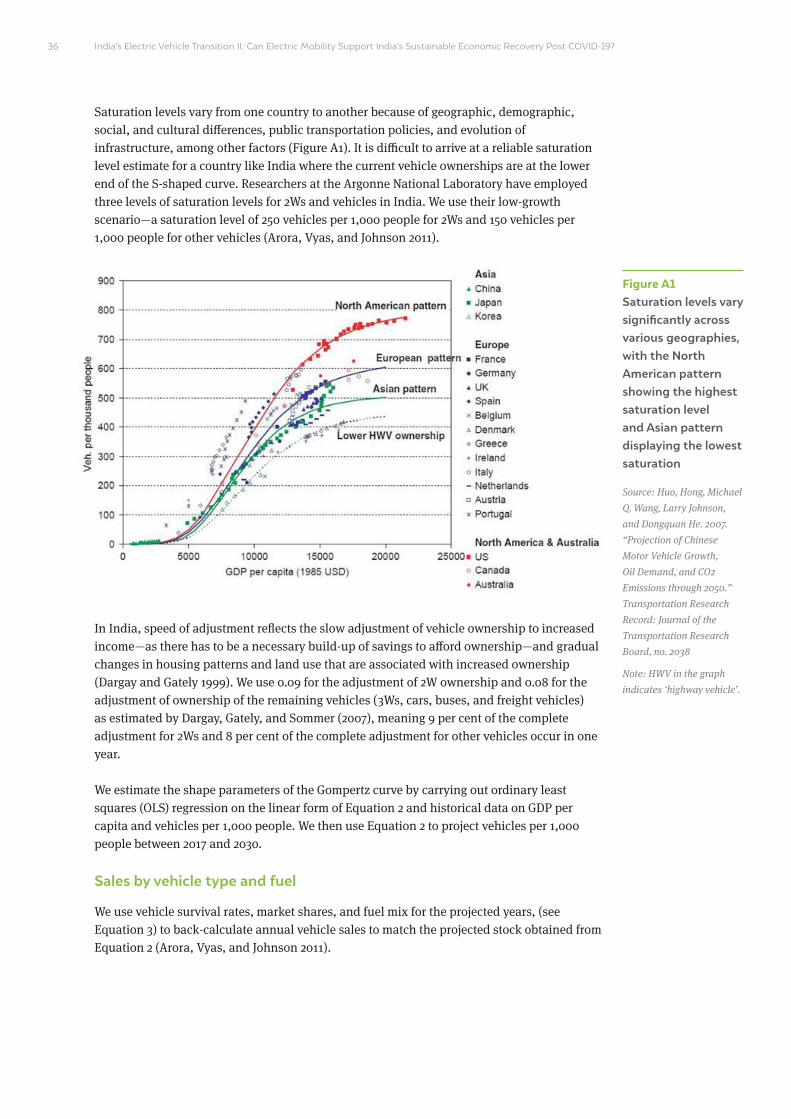
India’s Electric Vehicle Transition II: Can Electric Mobility Support India’s Sustainable Economic Recovery Post COVID-19?
Figure A1 Saturation levels vary significantly across various geographies, with the North American pattern showing the highest saturation level and Asian pattern displaying the lowest saturation
Source: Huo, Hong, Michael
Q. Wang, Larry Johnson,
and Dongquan He. 2007.
“Projection of Chinese
Motor Vehicle Growth,
Oil Demand, and CO2
Emissions through 2050.”
Transportation Research
Record: Journal of the
Transportation Research
Board, no. 2038
Note: HWV in the graph
indicates ‘highway vehicle’.
36
In India, speed of adjustment reflects the slow adjustment of vehicle ownership to increased income—as there has to be a necessary build-up of savings to afford ownership—and gradual changes in housing patterns and land use that are associated with increased ownership (Dargay and Gately 1999). We use 0.09 for the adjustment of 2W ownership and 0.08 for the adjustment of ownership of the remaining vehicles (3Ws, cars, buses, and freight vehicles) as estimated by Dargay, Gately, and Sommer (2007), meaning 9 per cent of the complete adjustment for 2Ws and 8 per cent of the complete adjustment for other vehicles occur in one year.
We estimate the shape parameters of the Gompertz curve by carrying out ordinary least squares (OLS) regression on the linear form of Equation 2 and historical data on GDP per capita and vehicles per 1,000 people. We then use Equation 2 to project vehicles per 1,000 people between 2017 and 2030.
Sales by vehicle type and fuel
We use vehicle survival rates, market shares, and fuel mix for the projected years, (see Equation 3) to back-calculate annual vehicle sales to match the projected stock obtained from Equation 2 (Arora, Vyas, and Johnson 2011).
Saturation levels vary from one country to another because of geographic, demographic, social, and cultural differences, public transportation policies, and evolution of infrastructure, among other factors (Figure A1). It is difficult to arrive at a reliable saturation level estimate for a country like India where the current vehicle ownerships are at the lower end of the S-shaped curve. Researchers at the Argonne National Laboratory have employed three levels of saturation levels for 2Ws and vehicles in India. We use their low-growth scenario—a saturation level of 250 vehicles per 1,000 people for 2Ws and 150 vehicles per 1,000 people for other vehicles (Arora, Vyas, and Johnson 2011).

Table A1 Market shares of cars, UVs and taxis under the ‘car’ category in the projected years in BAU
Source: Authors’ analysis
Table A2 Annual distance travelled per vehicle
Note: We do not use a
separate annual distance
travelled per vehicle for rural
and urban modes in the
model. Additionally, all the
distances mentioned here
are for intra-city travel only,
apart from that of buses
aWe look at private 2Ws only
in our model and do not
account for the bike-taxis
in 2030.
Years
Segment
Cars
Annual distance travelled (km)
UVs
Sources
Taxis
2020
2025
2030
2Wsa
3Ws
Cars
Taxis
Bus
24%
26%
28%
56%
56%
55%
6,300
27,900
11,560
70,000
62,000
20%
19%
17%
NITI Aayog and Rocky Mountain Institute (2017a), Rue du Can et al. (2009), and Singh (2006)
Arora, Vyas, and Johnson (2011)
Goel et al. (2016)
NITI Aayog and Rocky Mountain Institute. (2017b)
1.5 per cent (30,000) of the buses in India today are intra-city buses running 150 km per day, and the remaining 98.5 per cent (2,00,000) buses are inter-city buses running 250 km per day, based on our consultation with the stakeholders
37Annexures
Equation 3: Back-calculation of annual vehicle sales for the years 2017–2030
Stocki = ∑ ∑ Sales × Market × SR
where,k = vehicle age in years, k = 0,1,....m, where m is the maximum ageStocki = Projected on-road stock in year i;Salesi-k,j = New vehicle sales of vehicle type j in year i-k;Marketi-k,j = Market share of vehicle type j in year i-k;SRk,j = Survival rates of vehicle type j at age k, where 0 < SRk,j < 1
As no data is available on future market shares between passenger and freight vehicles, we make assumptions based on the results obtained in various transport modelling studies to flesh out freight vehicles from the projected vehicle stock. An important assumption we make is that the share of freight vehicle kilometres in the total vehicle kilometres travelled for road transport vehicles remains the same until 2030. This is substantiated in the multi-model assessment study conducted in 2019 (CSTEP et al. 2019). The market shares between passenger and freight vehicles are adjusted to ensure this.21
The next level of disaggregation—among passenger vehicles—is done by assuming a median of the projected mode-share growth rates in PKM arrived at by various models (CSTEP et al. 2019; Dhar and Shukla 2015). The market shares were adjusted iteratively to ensure the mode-share growth in PKM22 obtained from the models matched with the median of growth rates. For division of market shares among cars, utility vehicles (UVs), and taxis, the historical trends of market shares observed between 2003 and 2016 were applied for the projected years. These market shares are tabulated in Table A1.
j k=0i-k,j i-k,j k,j
m
21. We calculate vehicle kilometres travelled by each mode, by multiplying the stock with an average annual distance travelled. Our assumptions on average annual vehicle distance travelled are tabulated in Table A2.
22. We calculate the passenger kilometres carried out on each mode by multiplying mode-wise stock with their respective load factor and average annual distance travelled. The assumptions on load factors are tabulated in Table A3.

India’s Electric Vehicle Transition II: Can Electric Mobility Support India’s Sustainable Economic Recovery Post COVID-19?38
Table A3 Load factor per vehicle
Segment Load factor Sources
2Ws
3Ws
Cars
Taxis
Bus
1.5
BAU: 1.76Shared mobility: 3
BAU: 2.14Shared mobility: 3
2.14
41
Rue du Can et al. (2009), NITI Aayog and Rocky Mountain Institute (2017b), CSTEP, CEEW, IRADe, PNNL, and TERI (2019), and Singh (2006)
Rue du Can et al. (2009), NITI Aayog and Rocky Mountain Institute (2017b), and Singh (2006)
Rue du Can et al. (2009), NITI Aayog and Rocky Mountain Institute (2017b), and Singh (2006)
NITI Aayog and Rocky Mountain Institute (2017b)
NITI Aayog and Rocky Mountain Institute (2017b)
Scenarios
We explored three different mode-share scenarios (high public transport, high private vehicles, and shared mode) with varying vehicular mix (ICE vehicles and EV) in 2030 as tabulated in Table 1, and assume a linear growth between base year (2016) and 2030. We assume the mode-share of 3Ws in 2030 to be similar to BAU in both high private vehicle and high public transport mobility scenarios. However, 3Ws would contribute to a larger part of the mode-share in a shared mobility scenario as they are affordable by the population, especially at the lower rung of society, and its historical precedent as a shared mode in most parts of India. Along with 3Ws, taxis would contribute to a large portion of the passenger demand in a shared mobility. In a high public transport mobility scenario, buses carry a larger slice of passenger demand, taking away a chunk of 2Ws and cars from the road. Conversely, in a high private vehicle mobility scenario, cars and 2Ws are assumed to cater to half of the passenger demand in 2030, gnawing away the share of buses and taxis in the process (Figure A2).

39Annexures
Figure A2 2Ws occupy a large chunk of vehicle stock and buses cater to the maximum passenger demand
Source: Authors’ analysis
0
0
0
0
0
0
0
0
10,000
10,000
10,000
10,000
150
150
150
300
300
300
450
300
20,000
20,000
20,000
20,000
450
600
Pas
seng
er d
eman
d (B
illio
n P
KM
)P
asse
nger
dem
and
(Bill
ion
PK
M)
Pas
seng
er d
eman
d (B
illio
n P
KM
)P
asse
nger
dem
and
(Bill
ion
PK
M)
Veh
icle
sto
ck (m
illio
n)V
ehic
le s
tock
(mill
ion)
Veh
icle
sto
ck (m
illio
n)V
ehic
le s
tock
(mill
ion)
BAU
High PV
BAU
High PV
High PT
Shared Shared
High PT
2016
2016
2016
2016
2016
2016
2016
2016
2018
2018
2018
2018
2018
2018
2018
2018
2020
2020
2020
2020
2020
2020
2020
2020
2022
2022
2022
2022
2022
2022
2022
2022
2024
2024
2024
2024
2024
2024
2024
2024
2026
2026
2026
2026
2026
2026
2026
2026
2028
2028
2028
2028
2028
2028
2028
2028
2030
2030
2030
2030
2030
2030
2030
2030
2Ws
Cars
Taxis
3Ws
Buses

India’s Electric Vehicle Transition II: Can Electric Mobility Support India’s Sustainable Economic Recovery Post COVID-19?40
After having arrived at the mode-wise passenger demand in the projected years (2017–2030), we estimate the on-road vehicle stock, and use Equation 3 to back-calculate sales in the projected years. Thus, a high public transport mobility scenario results in a lower vehicle stock while a high private vehicle mobility scenario results in a higher stock compared to that of BAU in 2030. For arriving at the BAU and EV30 fuel mix, we estimated fuel consumption in different mode-share scenarios as shown in Figure 12.
Fuel consumption
We use Equation 4 to arrive at fuel consumption by vehicle type in 2030.
Equation 4: Calculating fuel consumption by vehicle type
Fueli = ∑ ∑
where,Salesi-k,j = new vehicle sales of vehicle type j in year i-k;FMi-k,j = fuel mix in year i-k;SRk = survival rates at age k;Distancej = average annual distance travelled per vehicle by type j in km;FEi-k,j = fuel economy for vehicle by type j in year i-k in km/l or km/kg or km/kWh23
For the fuel mix in a BAU scenario, we use the percentage of EV sales in 2030 as stated in the India Leaps Ahead report (NITI Aayog and Rocky Mountain Institute 2017a). For the EV30 scenario, considering the recent trends and cost economics of EVs and their ICEV equivalents, we allocate a higher EV share for 2Ws and 3Ws. We distribute the remaining fuels (petrol, diesel, and CNG, wherever applicable) in the ratio observed for the base year24 (see Figure 5). The fuel mix between the base year and 2030 are assumed to grow linearly through a simple interpolation.
Table A4 Fuel economy of the vehicles
Segment Fuel economy Sources
2Ws
Cars
3Ws
Bus
Values for 2020
Petrol: 57.4 km/l, Electric: 50 km/kWh
Values for 2015
Petrol: 15.8 km/l, Diesel: 14.9 km/l
CNG: 17.44 km/kg
Values for 2015
Petrol: 35.5 km/l, Diesel: 37.9 km/l
CNG: 24.1 km/kg, Electric: 15.4 km/kWh
Values for 2015
Diesel: 4.5 km/l, CNG: 2.26 km/kg
Electric: 0.8 km/kWh
Anup and Yang (2020) and Ernst & Young (2019)
Goel et al. (2016) and NITI Aayog and Rocky Mountain Institute (2017a)
NITI Aayog and Rocky Mountain Institute (2017a)
MoRTH (2017) and NITI Aayog and Rocky Mountain Institute (2017a)
k=0
Salesi-k,j × SRk,j × FMi-k,j × DistancejFEi-k,j
m
j
23. We use the fuel economy in 2015 as obtained from various sources (see Table A4). We consider a 1.3 per cent annual fuel economy improvement before years 2010, 1.7 per cent between 2010 and 2017, 3 per cent between 2017 and 2022, and 2.35 per cent between 2022 and 2030 for all modes as per the Auto Fuel Vison and Policy (GOI 2014). We assume that the fuel economy of ICEVs in all modes will improve by the same percentages and the fuel economy of electric vehicles to remain constant between 2015 and 2030.
24. The base year varies by vehicle types between (2015 and 2019) due to lack of availability of the latest data.
41Annexures
Model calibration
We compare our energy demand estimate in the baseline year (2016) with the actuals to calibrate the model. While the end-use fuel consumption is not available for the transport sector, we use the end-use fuel disaggregation from the Petroleum Planning and Analysis Cell (PPAC)-commissioned Nielsen study and MoPNG supply-side fuel consumption data to estimate the energy demand from passenger road transport sector in India (PPAC 2013). We expect this to be 48 Mtoe in 2016, while the value we arrive at from the vehicle stock model is 54 Mtoe, thus a 12 per cent difference in the fuel consumption in the base year. This difference may partly be a consequence of using the end-use disaggregation from the Nielsen study conducted in 2013.
Since India does not mandate deregistering of vehicles that are no longer in use, we do not have an official estimate on the on-road vehicle stock to compare our base-year estimation. The total registered vehicles in 2016 were 235 million (MoRTH 2019). But we estimate the on-road vehicles in 2016 to be 147 million. Thus, the on-road stock is 60 per cent of the total number of registered vehicles. We find that this percentage is within the range—51–70 per cent—quoted in various studies (Goel et al. 2016; Guttikunda and Mohan 2014).
Assumptions
Table A5 Studies used for the comparison and validation of projections
Labels Study name (year) Base year
CEEW-GCAM
PNNL
IRADe
CSTEP
IIMA–UNEP DTU
TERI
Singh (2006)
NITI–RMI
Comparison and Decarbonisation Strategies for India’s Land Transport Sector: An Inter Modal Assessment (2019)
Comparison and Decarbonisation Strategies for India’s Land Transport Sector: An Inter Modal Assessment (2019)
Comparison and Decarbonisation Strategies for India’s Land Transport Sector: An Inter Modal Assessment (2019)
Comparison and Decarbonisation Strategies for India’s Land Transport Sector: An Inter Modal Assessment (2019)
Promoting Low Carbon Transport in India (2014)
Analysing and Projecting Indian Electricity Demand to 2030 (2019)
The Demand for Road-Based Passenger Mobility in India: 1950–2030 and Relevance for Developing and Developed Countries (2006)
India Leaps Ahead: Transformative Mobility Solutions for All (2017)
2010
2010
2010
2010
2010
2010
2000
2015

India’s Electric Vehicle Transition II: Can Electric Mobility Support India’s Sustainable Economic Recovery Post COVID-19?42
We use job coefficient (jobs/output value-add in INR crore) (tabulated in Table A6) and output value-add to estimate jobs in 2030. We also estimate jobs to be created in EV charger manufacture (Table A7).
Table A6 Job coefficient considered for estimation of jobs
aSince these are specific
to Germany, which has
significant of automation
in their industry processes
compared to India, the job
numbers in this report are
conservative estimates.
bThe job coefficient arrived
at in this report are in jobs/
MW terms for all kind of
power plant. We use CEA’s
optimal capacity mix for
FY30 to arrive at a weighted
average 0.71 jobs/MW (CEA
2020a).
Table A7 Job coefficient considered for manufacturing of an EV charger
Source: Authors’
compilation from the ASI
data
Activity
NIC code
Job co-efficient (jobs/INR crore)
Manufacturing activity
Sources
Job coefficient( Jobs/output value-add in
INR crore)
EV powertrain manufacturing
Battery manufacturing
ICE 2W powertrain manufacturing
ICE 3W powertrain manufacturing
ICE car powertrain manufacturing
Electricity generation
Oil production
Manufacturing of EV chargers
26101
26102
26103
26104
26105
26106
26107
27320
Average
0.35
0.45
2.04
2.15
1.59
0.71b (jobs/MW)
0.13
2.98
Manufacture of electronic capacitors, resistors, chokes, coils, transformers (electronic), and similar components
Manufacture of electron tubes, diodes, transistors, and related discrete devices
Manufacture of integrated circuits (analogue, digital, or hybrid)
Manufacture of bare printed circuit boards, loading of components onto printed circuit boards; manufacture of interface cards (e.g. sound, video, controllers, network, modems)
Manufacture of display components (plasma, polymer, LCD, LED)
Manufacture of printer cables, monitor cables, USB cables, connectors etc.
Manufacture of microprocessors
Manufacture of other electronic and electric wires and cables (insulated wire and cable made of steel, copper, and aluminium)
Fraunhofer IAO (2018)a
Annual Survey of Industries (ASI) database
Estimated based on the component-wise job coefficient obtained from the ASI database (see Table 8)
IASS, TERI, CEEW, and SCGJ (2019)
2.6
4.3
2.9
3.5
4.4
3.2
1.7
1.1
2.98
Annexure II Estimation of jobs

43Annexures
Output value-add: EV powertrain and battery manufacturing
The output value-add is a product of cost of the product and number of units sold. Thus, in case of battery and powertrains (both ICE and EV), the output value-add is estimated by multiplying the cost of each battery or powertrain in 2030 with EV or ICEV sales (for ICEV powertrain) in that year. We assume the cost of powertrain to remain constant in real terms in 2030, while the cost of batteries would decline from the present USD 220 per kWh to USD 61 per kWh (BNEF 2020). We use the EV and ICEV sales projected in this study for estimating jobs. We have tabulated the details of sales and costs in Figure A3, Tables A8 and A9.
Table A8 Costs of EVs in 2030
Source: Authors’
compilation
Note: These costs are based
on the models available in
the market today and are
assumed to remain the same
in 2030 in real prices
Table A9 Costs of ICE vehicles in 2030
Source: Authors’
compilation
Note: These costs are based
on the models available in
the market today and are
assumed to remain the same
in 2030 in real prices
Figure A3 2Ws would take the lion’s share of EV sales projected in 2030 under various scenarios
Source: Authors’ analysis
Segment
Segment
Proportion
Proportion
Cost (INR 2020 prices)
Cost (INR 2020 prices)
Electric 2Ws
Powertrain
2Ws
Powertrain
3Ws
Powertrain
Cars
Powertrain
Buses
Powertrain
Electric 3Ws
Powertrain
Electric cars
Powertrain
Electric buses
Powertrain
25%
25%
25%
25%
35%
40%
20%
30%
1,03,697
25,924
58,136
14,534
1,83,064
45,768
7,77,643
2,72,175
60,00,000
30,00,000
2,95,000
73,750
12,91,510
2,58,302
1,59,25,000
47,77,500
0
5,000
10,000
25,000
20,000
15,000
BAU EV30 High PV- EV30High PV Shared Shared- EV30High PT- EV30High PT
Sale
s (t
hous
and
uni
ts)
2W 3W 4W Buses

India’s Electric Vehicle Transition II: Can Electric Mobility Support India’s Sustainable Economic Recovery Post COVID-19?44
Output value-add: Oil production
In case of oil, the output value-add is the product of petrol and diesel consumed in 2030 and price charged to the dealers. While the fuel consumption is based on the projections from this study, the price is assumed to be the average of the price charged to dealers in four cities—Delhi, Kolkata, Mumbai, and Chennai—as reported in the Indian Petroleum & Natural Gas Statistics 2018–19 report by MoPNG—INR 36.55 per litre for petrol and INR 40.51 per litre for diesel (MoPNG 2019). In case of electricity, since the coefficient is in jobs/MW, we use the electricity consumption from the passenger road transport sector as projected in this study and estimate the power in MW. The jobs created in the generation of electricity are thus a product of the job coefficient and power demand in 2030 in various scenarios.
Output value-add: Public chargers
We estimate the number of public chargers for 2Ws, 3Ws, and cars by assuming an EVs-to-EVSE (electric vehicle supply equipment) ratio of 10 as per the target stipulated by European Union Alternate Fuels Infrastructure directive (IEA 2018). For buses, we assume an EVs-to-EVSE ratio of 8 as per IEA’s assumption (IEA 2020) . Further, we assume about 16 per cent of the public chargers for 2Ws, 3Ws, and cars are fast chargers, based on an average of the fast charger penetration in different countries (BNEF 2019). Electric bus chargers, on the other hand, are assumed to be all fast chargers. We estimate the output value-add by multiplying the cost of the respective chargers (see Tables A10 and A11) with the number of chargers estimated from the EV sales.
Table A10 Types of public chargers for different vehicle segments
Source: Shyamasis
Das, Sasidharan, and
Ray, 2020. “Charging
India’s Four-Wheeler
Transport”; Shyamashis
Das, Sasidharan, and Ray,
2019. “Charging India’s Bus
Transport”
Table A11 Costs of public chargers
Source: Das, Shyamasis,
Chandana Sasidharan,
and Anirudh Ray. 2020.
“Charging India’s Four-
Wheeler Transport”; Das,
Shyamasis, Chandana
Sasidharan, and Anirudh
Ray. 2019. “Charging India’s
Bus Transport”
Note: The above costs
exclude the cost of ancillary
infrastructure. While these
are present day costs,
we assume these costs to
remain the same in 2030 in
real terms.
Segment
Segment
Slow
Slow
Fast
Fast
2W
3W
Cars
Buses
2W
3W
Cars
Buses
1.4–3.3 kW, 3.3–7.4 kW
1.4–3.3 kW, 3.3–7.4 kW
3.3 kW (AC), 3.3 kW (DC), 10 kW, 15 kW
INR 31,750
INR 31,750
INR 1,32,500
INR 11,97,500
80 kW (DC), 150 kW (DC)
7.5 kW (DC)
7.5 kW (DC)
Up to 50 kW (DC), 50–150 kW (DC)
INR 2,62,500
INR 2,62,500
INR 9,75,000

India's EV transition is in its infancy. Jobs, growth and sustainability can emerge from a well planned and executed transition.
Image: Abhinav Soman/ CEEW

India’s Electric Vehicle Transition II: Can Electric Mobility Support India’s Sustainable Economic Recovery Post COVID-19?
COUNCIL ON ENERGY, ENVIRONMENT AND WATER (CEEW)
Sanskrit Bhawan, A-10, Aruna Asaf Ali Marg Qutab Institutional AreaNew Delhi - 110 067, IndiaT: +91 11 4073 3300
[email protected] | ceew.in | @CEEWIndia


![The Coming Transition in Automobile Cockpits · The Coming Transition in Automobile Cockpits- ... • Helmet mounted displays ... • Vehicle control tasks [skill based]](https://static.fdocuments.net/doc/165x107/5ac1f84d7f8b9a433f8d77cc/the-coming-transition-in-automobile-cockpits-coming-transition-in-automobile-cockpits-.jpg)


