IndIa's Clean RevolutIon - The Climate Group · PDF fileIndIa’s Clean eneRgy ... public...
60
March 2011 IndIa's Clean RevolutIon Supporting partner: Knowledge partnerS:
Transcript of IndIa's Clean RevolutIon - The Climate Group · PDF fileIndIa’s Clean eneRgy ... public...

March 2011
IndIa's Clean RevolutIon
Supporting partner:
Knowledge partnerS:

dIsClaIMeR This publication has been prepared for general guidance on matters of interest only, and does not constitute professional advice. You should not act upon the information contained in this publication without obtaining specific professional advice. No representation or warranty (express or implied) is given as to the accuracy or completeness of the information contained in this publication, and, to the extent permitted by law, the authors and distributors do not accept or assume any liability, responsibility or duty of care for any consequences of you or anyone else acting, or refraining to act, in reliance on the information contained in this publication or for any decision based on it.
© 2011 The Climate Group. All rights reserved. (UK charity number: 1102909).
Cover Image: Foot traffic in front of the Mulla House. Mumbai, India
table of ContentsfoReWoRds .........................................................................................................................iii
IntRoduCtIon and oveRvIeW ............................................................................................. 1
1. IndIa’s Clean eneRgy futuRe .........................................................................................5
India’s energy system ................................................................................................5
Renewable energy .....................................................................................................6
Energy generation efficiency ................................................................................... 13
2. Clean IndustRy ............................................................................................................ 15
Indian industry and the Clean Revolution ................................................................. 15
Potential energy and cost savings from improved industrial energy efficiency ........ 17
Opportunities for energy efficiency in Indian industry ............................................. 18
Energy efficiency potential in key industrial sectors ................................................ 19
3. Clean tRanspoRt .........................................................................................................26
India’s accelerating transport sector ......................................................................26
4. gReen buIldIngs and sMaRt teChnology .................................................................29
Being green by going smart ......................................................................................29
Buildings .................................................................................................................. 31
Appliances ...............................................................................................................32
LED lighting ..............................................................................................................32
Information and Communications Technology (ICT) .................................................34
5. fInanCIng IndIa’s Clean RevolutIon ..........................................................................36
Renewable Energy ...................................................................................................36
Energy efficiency ..................................................................................................... 41
Sources of clean finance .........................................................................................42
6. ConClusIon ...................................................................................................................46
endnotes ...........................................................................................................................48
aCknoWledgeMents ........................................................................................................54
iiiIndIa's Clean RevolutIon MARCH 2011
foReWoRdsnaina lal kidwai, Group General Manager and Country Head, HSBC Group in India
The next ten years are set to witness a major transformation in India’s economy. India’s growth rate is expected to surpass that of China in the coming years. Millions of Indians will become part of the global middle class, moving into cities and demanding modern energy, transport, communications and financial services. On the other hand, growing industrialization will result in increased carbon emissions. There is, therefore, an urgent need to address climate change as a corollary to economic growth.
While India currently makes only a small contribution to the emissions that cause global warming, it is the most vulnerable of all the G20 nations to the impacts of climate change. Water supplies, agriculture, food production and infrastructure will all suffer major damage if emissions continue to rise. A low carbon future is the only one that can guarantee prosperity.
However, beyond the exigencies of climate change there are other, more immediate, reasons for India to explore the opportunities presented by the transition to a low carbon world. Energy security is a major prerequisite for sustainable growth. Without major investments in clean energy and energy efficiency measures, India’s future growth will be severely constrained by an increasing import bill for energy, an inability to satisfy the demands of both industry and commerce and failure to provide access to reliable energy to the many millions who still lack it.
The good news is that a clean energy revolution offers enormous opportunities for those who are prepared to lead. HSBC research1 shows that the global market for low carbon goods and services will reach USD 2.2 trillion over the coming decade. India’s share of this could be as much as USD 135 billion. Its compound annual growth rate of 17% is predicted to outstrip Europe, North America, China and the rest of the world. With its abundant clean energy resources, skilled labor and access to international markets, the prize for Indian business is huge. And as this report shows, this prize is not a pipe-dream for the future; many forward-thinking companies, supported by increasingly ambitious government policies, are already taking advantage.
Increasingly Indian Government, businesses, financial institutions, NGOs and wider civil society are working in partnership to grasp opportunities for low carbon growth. HSBC is supporting a pilot with Spandana, one of the country's leading MFIs, to develop and roll out a clean energy product portfolio suited to the needs of its clients with technical assistance from MicroEnergy Credits (MEC). MEC is exploring ways to link Spandana’s microfinance clients to the global carbon credit markets that will enable them to trade carbon credits earned by adopting clean energy. Through the HSBC Climate Partnership, HSBC collaborates with four leading international NGOs to combat the urgent threat of climate change worldwide. In India we are working with The Climate Group to spark new public-private initiatives to deploy clean technologies that will save energy, cut emissions and create new jobs and prosperity. Examples of the Partnership’s achievements include ground-breaking trials of energy-efficient LED street lighting with the city of Kolkata, strengthening of public and private banks’ capacity to finance India’s Clean Revolution, and building new links between Indian businesses and leading international clean tech companies. We need to see much more of this kind of collaboration to set India’s economy on track towards a prosperous and low carbon future.
iv IndIa's Clean RevolutIon MARCH 2011
suresh prabhu, former Union Minister for Industry, Energy, Environment and Forests, Mark kenber, CEO, The Climate Group
The 17% of the world’s population represented by India accounts for under 5% of global greenhouse gas (GHG) emissions. The country’s per capita emissions currently remain a fraction of those in the developed world. Nevertheless, the challenge created by the nation’s booming demand for energy and the opportunities presented by a 21st Century low carbon economy mean a Clean Revolution must be at the heart of India’s development strategy. There is no such thing as a secure, high carbon, low cost future in India or anywhere else.
With India looking at a reported INR 4.6 million crore (USD 1 trillion) investment in the infrastructure sector during its 12th Five Year Plan period, the Indian economy is at a crossroads. It can either copy the developed world model of high cost, high carbon development or chart a new low carbon pathway based on energy efficiency and energy security.
Unabated, India’s energy demand is set to double by 2030 according to the International Energy Agency (IEA), compounding any efforts to tackle global warming and limiting its own economic growth. Without new energy policies, the IEA suggests that India’s coal imports could increase sevenfold. The challenge to cut global greenhouse gas emissions will be won or lost largely in the cities of emerging economies like China and India.
In a country so large, the energy efficiency gains so far identified across a range of industry sectors are huge. Estimates suggest that primary energy demand could be cut by 25% and avert an extra 120 gigawatt (GW) of power capacity (equivalent to 80% of India’s total power capacity in 2005), meaning that one in five power plants would no longer be needed by 20302.
This new report from The Climate Group shows that India’s Government and businesses are well aware of the challenges and opportunities posed by climate change. It shows that while they recognize India has no historical responsibility for global warming, the country has a huge role to play in delivering its solutions. Second, it shows that India’s Clean Revolution is about more than just climate change – it is about energy security, sustainable growth, access to energy for millions of citizens and the creation of skilled jobs in a variety of industry sectors. Finally, and perhaps most importantly, it also shows significant actions are already underway.
India is already home to world-class technology, energy, manufacturing, heavy industry and finance sectors and the Government of India is alive to the low carbon economy. Together, they are beginning to create a low carbon tiger that will challenge Asian and Western economies for a share of a INR 10 million crore (USD 2.2 trillion) global market this decade3.
There is increasing evidence that India’s bold low carbon policies, low cost labor, and highly skilled manufacturing base can not only enable it to leapfrog efforts in more developed economies, but become a major global hub for clean technologies for decades to come.
India is also home to The Climate Group, whose international coalition is proud to be partnering several leading companies, cities and states in India, to unlock the low carbon finance, policies and technologies needed to unleash this clean industrial revolution.
This report shows that India’s accelerating clean industrial revolution will outpace the rest of the world over the next decade and proves beyond doubt that – led by its Government and business leaders – it intends to be the change it wants to see on climate change and a low carbon economy.
foReWoRds
1IndIa's Clean RevolutIon MARCH 2011
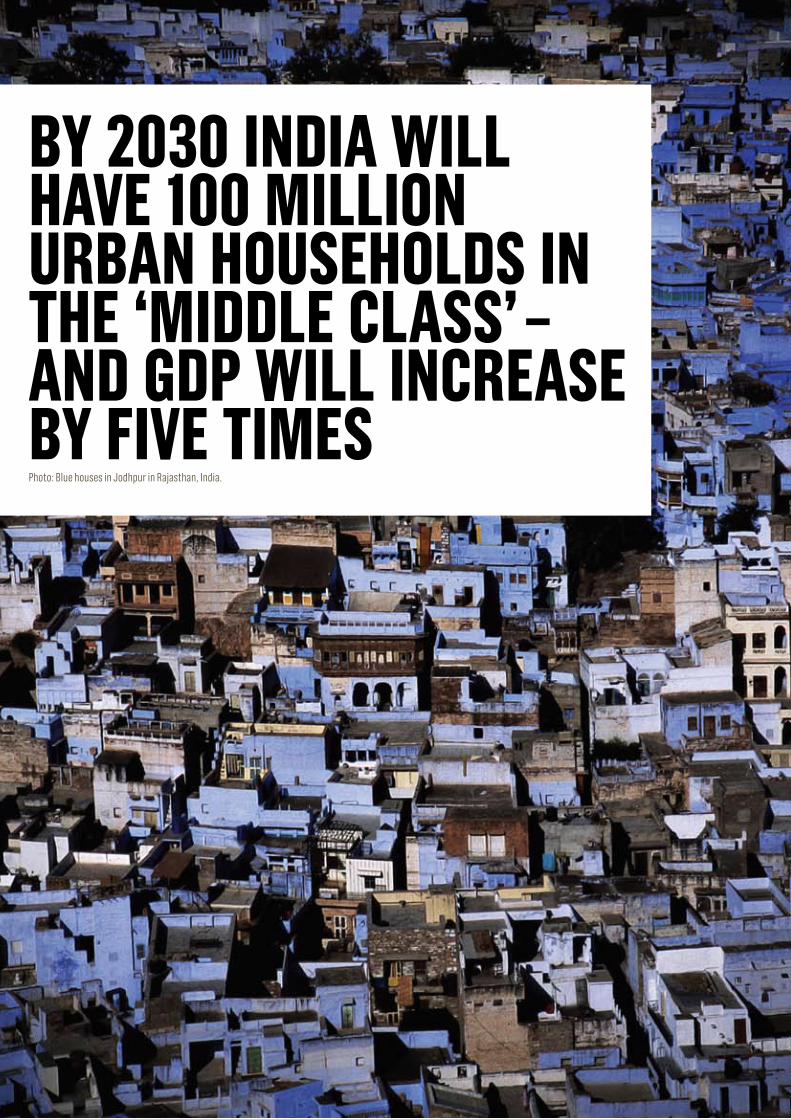
IntRoduCtIon and oveRvIeWThe Indian economy, driven by domestic consumption, is the eleventh largest in the world by nominal Gross Domestic Product (GDP) and the fourth largest by purchasing power parity, growing at around 9% per annum1. However, the country is currently faced with enormous growth and development pressures. It must meet the needs of an enormous population and help many millions out of poverty. It must provide energy to the large part of the country that still remains off-grid. And it must satisfy the increasing demand for goods and services, and above all for energy, of the nearly 100 million people that are expected to enter the 'middle class' bracket by 20302.
Clean revolution opportunities and risks
The next ten years will see a huge economic transformation, with India’s growth rate expected to surpass that of China as soon as next year. Growing its economy at this rate under a business-as-usual (BAU) scenario means India’s demand for energy will continue to increase exponentially, and by 2030 energy production could need to expand six-fold to keep pace. Even today, India spends 45% of export earnings on energy imports3. By 2020 over 35% of the energy it consumes is expected to come from outside the country, making it vulnerable to external price changes4.
Climate security is a further hurdle, with India being the most vulnerable of all the G20 nations to climate change5, not to mention the rising levels of local pollution associated with fossil fuel consumption. Climate change presents all countries with risks and opportunities. But given India’s size and current rate of growth, these are amplified enormously on both the upside and the downside.
India is directly affected by climate change, which is increasingly posing a threat to livelihoods that are already faced with the costs of adaptation. However, the risks of climate change are far outweighed by the opportunities that arise. It is important for the country’s government and business leaders to seize the opportunities for clean growth. These opportunities will improve local air quality, bolster energy security and save costs, while contributing to global efforts to mitigate climate change. A clean industrial revolution will be the only way to maintain growth while addressing these concerns.
Already, around the world, governments and companies are waking up to the economic prospects inherent in this Clean Revolution. According to HSBC Global Research, by 2020 global markets for low carbon goods and services are expected to be worth INR 10 million crore (USD 2.2 trillion) with exponential growth thereafter6. In the next decade, India’s share of the global low carbon market could balloon to INR 616,000 crore (USD 135 billion). Its compound annual growth rate of 17% is predicted to outstrip Europe, North America, China and the rest of the world7. Only China and the US are likely to attract more clean energy investment in the next ten years but the rate of increase of India’s private investment (763%) will be three times the rate of either of these two competitors8. Such rapid increases in the rates of investment underline India’s current stage of industrial development but show the enormous potential of its burgeoning economy.
Only China and the US are likely to attract more clean energy investment in the next ten years but the rate of increase of India’s private investment (763%) will be three times the rate of either of these two competitors.
by 2030 IndIa WIll have 100 MIllIon uRban households In the ‘MIddle Class’ – and gdp WIll InCRease by fIve tIMesPhoto: Blue houses in Jodhpur in Rajasthan, India.
3IndIa's Clean RevolutIon MARCH 2011
IntRoduCtIon and oveRvIeWHowever, given current levels of energy inefficiency in India the biggest opportunities are likely to be in India’s energy efficiency market which will treble to INR 351,500 crore (USD 77 billion) in the next 10 years driven by demand in industry, buildings, energy storage and transport9. The short payback periods and negative net abatement costs for energy efficiency measures will underpin economic growth. Investments in energy efficiencies are expected to provide higher returns per unit of investment than any other part of India’s low carbon economy. With an investment of INR 45,650 crore (USD 10 billion) in energy-efficiency improvements, India’s economy would benefit from its potentially vast annual energy savings of 183.5 billion kWh hours equivalent to INR 114,100 crore (USD 25 billion) at INR 5/kWh (~USD 0.1/kWh) and 148.6 million tons of avoided carbon dioxide (CO
2) emissions per annum.
Combining such opportunities with the country’s entrepreneurial spirit puts India in a good position to reap the benefits of a possible 10.5 million green jobs10. Large, small and medium scale enterprises in India are also increasingly realizing the opportunities presented by clean development. But there is potential for business to be much more involved – and for India to grow business leaders who will play an important global role in the new low carbon economy.
By acting now, India can get ahead of the curve and provide technology solutions which will benefit business and industry, support foreign investment, improve global competitiveness, reduce reliance on dwindling and imported resources, save energy costs and reduce the impact of capital spending on installations that will be around for a long time. Remarkable progress has already been made and India has all the ingredients to benefit from the opportunities offered by addressing climate change. The Government of India recognizes these advantages and is taking a leading role in driving low carbon development, in both international and domestic arenas, with the 2008 National Action Plan on Climate Change and its constituent Missions providing a range of key regulations and incentives for low carbon growth.
the Structure of this report
This report considers the scale of India’s growth, and the steps already taken in the direction of clean growth, by policies and initiatives of government and by the actions of state-owned and private enterprises. It suggests reasons why India is poised to take on a significant role in the world and looks at the opportunities and financing challenges.
The report is not designed to be an exhaustive survey of all the actions that are taking place in India nor of all the available potential for low carbon growth. Indeed, there are huge sectors, such as forestry and agriculture that are not even touched on, along with the investment that is needed in building climate resilience. Instead it seeks to shine a spotlight on the Clean Revolution that is already underway in a few key sectors and make the case for even greater action in these areas.
Chapter 1 covers the opportunities presented in decarbonizing India’s energy supply – through both increased renewable energy deployment and supply-side efficiency. India is blessed with abundant renewable energy resources, particularly in solar and biomass, and India places third in a recent renewable energy country attractiveness index11. Markets for solar, wind, biomass and small hydro are all expected to continue their expansion. By 2020 the wind energy market is expected to be worth INR 60,000 crore (USD 13 billion), solar and biomass INR 32,000 crore (USD 7 billion) each and small hydro INR 27,000 crore (USD 6 billion)12.
4 IndIa's Clean RevolutIon MARCH 2011
The remaining chapters of this report focus on the enormous business and financing opportunities associated with demand-side energy efficiency, including in industry, transportation and buildings
Chapter 2 looks at the industrial sector, where India already has some of the most efficient plants in the world but where past inefficiency implies enormous potential for savings in energy and cost. The sectors where the greatest consumption of energy and consequently the greatest potential for benefit in India are: cement, aluminium, fertilizer, iron and steel, pulp and paper and textiles. The market for industrial efficiency will be worth USD 26 billion in 202013.
In Chapter 3 we look at transport which is one of the fastest growing sectors in terms of low carbon opportunity and – through the deployment of efficient and low carbon vehicles and the expansion of public transport – represents nearly a third of the future market.
Chapter 4 focuses on the major clean growth prospects offered by the applications of various technologies in green buildings, LED lighting and efficient appliances. In particular, the chapter looks at how the information and communications technology (ICT) sector, given its advanced stage of development in India, can play a leading role in helping decarbonize other sectors of the economy.
To make this Clean Revolution possible it will be necessary to find ways for meeting India’s financing needs to drive its green growth. Financing models are in their infancy and sources of finance few, but some progress has been made in recent years and these are highlighted in Chapter 5. Financial, institutional, regulatory, and technological innovation hold the key to India having a successful Clean Revolution.
In short, India’s Clean Revolution is not only essential to national economic development but will spark a spate of low carbon investment and green growth that will make it an essential and exciting market for the international investment community for decades to come. The Climate Group stands ready to act as a partner to the Government of India, regional and city authorities and Indian businesses in this undertaking and will continue to publish updates and case studies of the progress being made over the coming months and years.
IntRoduCtIon and oveRvIeW
5IndIa's Clean RevolutIon MARCH 2011
1. IndIa’s Clean eneRgy futuRe • India is the fifth largest generator of power in the world (170 GW) but per capita
consumption is only 30% of the world average – this will change quickly following the phenomenal growth trajectory of the country and new capacity will be needed at unprecedented rates.
• Renewable energy can supply a large part of this capacity, offering greater energy security, access to those who currently lack it and create a vibrant new industrial sector.
• India is already emerging as a world leader in this sector with a total installed capacity of 17 GW and has set a target to achieve 74 GW of grid-connected renewable energy capacity by 2022.
• The market in India for the renewable energy business is growing at an annual rate of 15%. The scope for private investment in renewable energy is estimated to be about INR 155,210 crore (USD 34 billion). Wind, solar and biomass all have huge potential1.
• Energy generation and transmission efficiency are also critical to India’s long-term energy security. There are huge opportunities all along the power sector value chain, as only 25% of the primary energy used in coal-fired power plants reaches the end user.
india’s energy system
The size of India and its population would suggest an energy use far in excess of current figures. The average per capita consumption of electricity, however, is only 30% of the world average at 734 kWh (kilowatt hour) (2008-2009) compared with around 15,000 kWh in the US, around 1,800 kWh in China and the world average of 2,300 kWh3. Notwithstanding the low per capita usage, India is the fifth largest generator of power in the world (170 GW as of January 2011) producing 4% of the global total4. The country’s 11th Five Year Plan (2007-2012) sets out a target to achieve an additional 62 GW of capacity5.
By 2030 India will have a GDP five times higher than at present6. It will also have 100 million urban households in the ‘middle class’ bracket with higher purchasing power than ever before7. This population represents a huge market for housing, buildings, appliances, transport, infrastructure and utilities, all of which are energy intensive. Their need for jobs also suggests an accompanying growth in India’s economy. However, if this growth is based on a high-carbon model of development, this will have significant resource and environmental consequences both nationally and globally.
Most electricity currently consumed in India derives from coal, which produces local air pollution and contributes to global climate change. Of the total electricity consumed in India 65.3% is generated by thermal power plants, of which 53% is coal-based, 10.5% is gas-based and 0.9% is oil-based8. Hydro sources provide a further 21%, while nuclear delivers 4%9. Currently, 20 nuclear power reactors produce 4.8 GW10 but the country has significant funds for new nuclear reactors targeting generation capacity of 63 GW by 203211.
India’s dependence on this current fuel mix comes at a cost. In addition to the economic and environmental impacts associated with a high dependence on imported fossil fuels, India faces a major challenge in satisfying energy demand as the economy continues to expand. Large scale expansion of renewable energy and increased energy generation efficiency will be critical to helping resolve both challenges. The following two sections address both issues. The potential for demand side efficiency to contribute to reducing the need for additional capacity, cut emissions and drive growth are dealt with in the subsequent chapters.
The renewable energy market in India is growing at an annual rate of 15% with the scope for private investment estimated to be about USD 34 billion. Wind, solar and biomass all have huge potential1.
6 IndIa's Clean RevolutIon MARCH 2011
renewable energy
Renewable energy technologies will help India to build energy supply without compromising its Clean Revolution. These technologies include solar (especially concentrated solar power), wind and biomass technologies.
india’s renewable resources: existing and potential
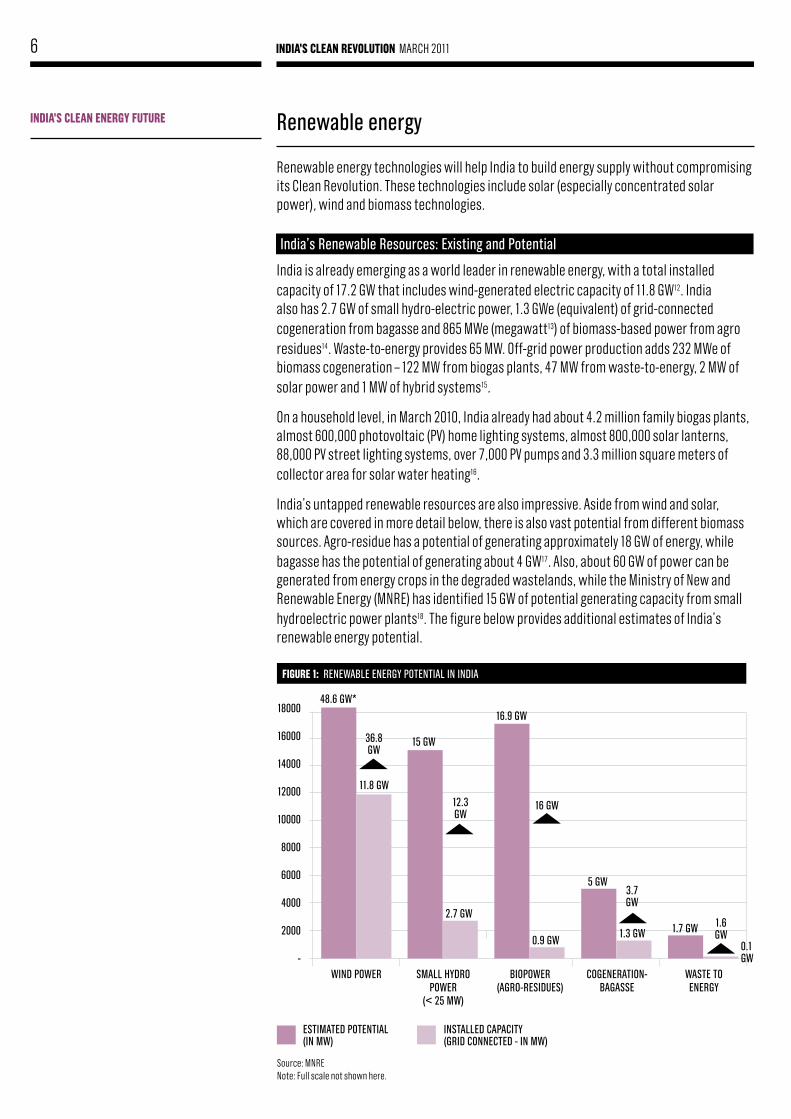
India is already emerging as a world leader in renewable energy, with a total installed capacity of 17.2 GW that includes wind-generated electric capacity of 11.8 GW12. India also has 2.7 GW of small hydro-electric power, 1.3 GWe (equivalent) of grid-connected cogeneration from bagasse and 865 MWe (megawatt13) of biomass-based power from agro residues14. Waste-to-energy provides 65 MW. Off-grid power production adds 232 MWe of biomass cogeneration – 122 MW from biogas plants, 47 MW from waste-to-energy, 2 MW of solar power and 1 MW of hybrid systems15.
On a household level, in March 2010, India already had about 4.2 million family biogas plants, almost 600,000 photovoltaic (PV) home lighting systems, almost 800,000 solar lanterns, 88,000 PV street lighting systems, over 7,000 PV pumps and 3.3 million square meters of collector area for solar water heating16.
India’s untapped renewable resources are also impressive. Aside from wind and solar, which are covered in more detail below, there is also vast potential from different biomass sources. Agro-residue has a potential of generating approximately 18 GW of energy, while bagasse has the potential of generating about 4 GW17. Also, about 60 GW of power can be generated from energy crops in the degraded wastelands, while the Ministry of New and Renewable Energy (MNRE) has identified 15 GW of potential generating capacity from small hydroelectric power plants18. The figure below provides additional estimates of India’s renewable energy potential.
IndIa's Clean eneRgy futuRe
fIguRe 1: renewable energy potential in india
18000
16000
14000
12000
10000
8000
6000
4000
2000
-wind power SMall Hydro
power (< 25 Mw)
biopower(agro-reSidueS)
Cogeneration- bagaSSe
waSte to energy
48.6 gw*
11.8 gw
15 gw
2.7 gw
16.9 gw
0.9 gw
5 gw
1.3 gw 1.7 gw
0.1 gw
36.8 gw
12.3 gw
16 gw
3.7gw
1.6 gw
eStiMated potential (in Mw)
inStalled CapaCity (grid ConneCted - in Mw)
Source: MNRE Note: Full scale not shown here.
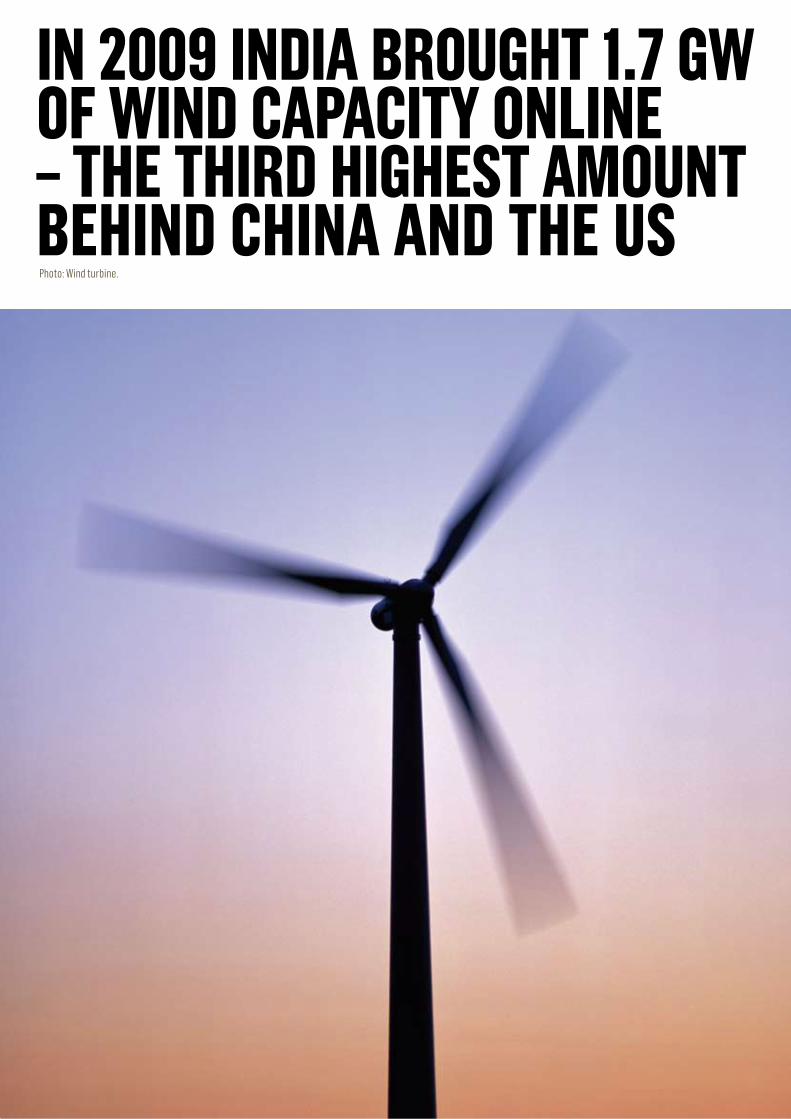
In 2009 IndIa bRought 1.7 gW of WInd CapaCIty onlIne – the thIRd hIghest aMount behInd ChIna and the us Photo: Wind turbine.
8 IndIa's Clean RevolutIon MARCH 2011
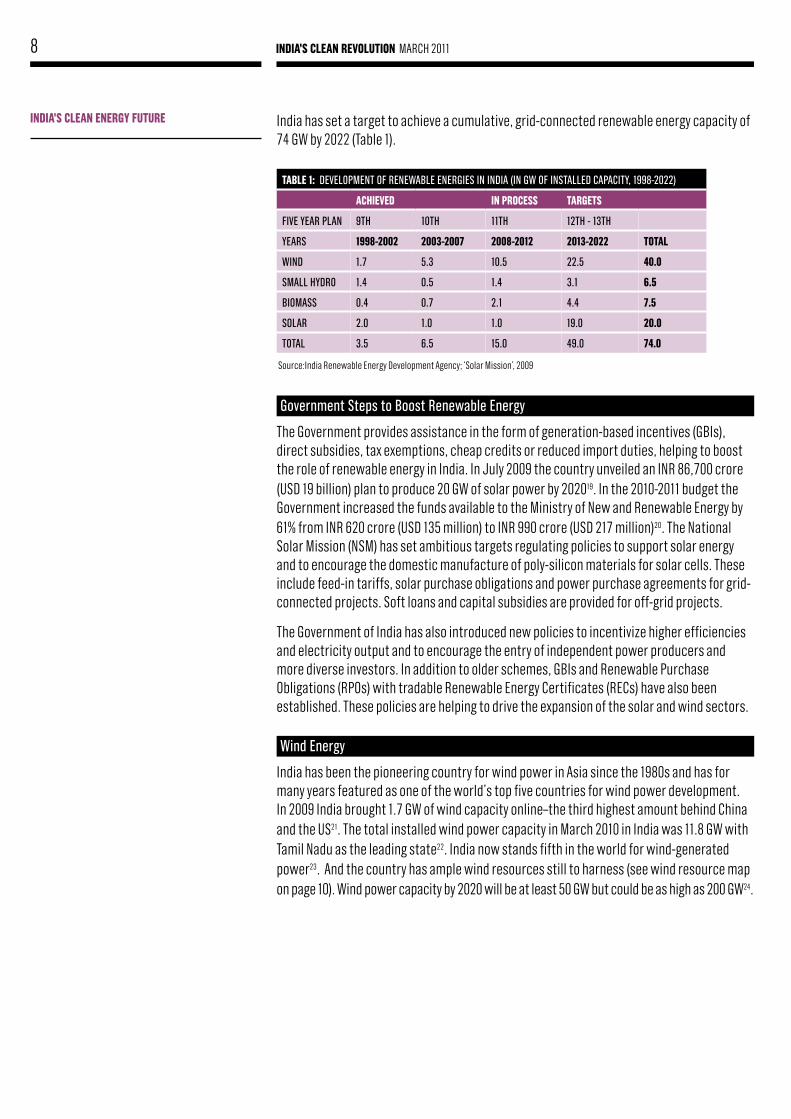
India has set a target to achieve a cumulative, grid-connected renewable energy capacity of 74 GW by 2022 (Table 1).
government Steps to boost renewable energy
The Government provides assistance in the form of generation-based incentives (GBIs), direct subsidies, tax exemptions, cheap credits or reduced import duties, helping to boost the role of renewable energy in India. In July 2009 the country unveiled an INR 86,700 crore (USD 19 billion) plan to produce 20 GW of solar power by 202019. In the 2010-2011 budget the Government increased the funds available to the Ministry of New and Renewable Energy by 61% from INR 620 crore (USD 135 million) to INR 990 crore (USD 217 million)20. The National Solar Mission (NSM) has set ambitious targets regulating policies to support solar energy and to encourage the domestic manufacture of poly-silicon materials for solar cells. These include feed-in tariffs, solar purchase obligations and power purchase agreements for grid-connected projects. Soft loans and capital subsidies are provided for off-grid projects.
The Government of India has also introduced new policies to incentivize higher efficiencies and electricity output and to encourage the entry of independent power producers and more diverse investors. In addition to older schemes, GBIs and Renewable Purchase Obligations (RPOs) with tradable Renewable Energy Certificates (RECs) have also been established. These policies are helping to drive the expansion of the solar and wind sectors.
wind energy
India has been the pioneering country for wind power in Asia since the 1980s and has for many years featured as one of the world’s top five countries for wind power development. In 2009 India brought 1.7 GW of wind capacity online–the third highest amount behind China and the US21. The total installed wind power capacity in March 2010 in India was 11.8 GW with Tamil Nadu as the leading state22. India now stands fifth in the world for wind-generated power23. And the country has ample wind resources still to harness (see wind resource map on page 10). Wind power capacity by 2020 will be at least 50 GW but could be as high as 200 GW24.
IndIa's Clean eneRgy futuRe
table 1: developMent of renewable energieS in india (in gw of inStalled CapaCity, 1998-2022)
aChIeved In pRoCess taRgets
five year plan 9tH 10tH 11tH 12tH - 13tH
yearS 1998-2002 2003-2007 2008-2012 2013-2022 total
wind 1.7 5.3 10.5 22.5 40.0
SMall Hydro 1.4 0.5 1.4 3.1 6.5
bioMaSS 0.4 0.7 2.1 4.4 7.5
Solar 2.0 1.0 1.0 19.0 20.0
total 3.5 6.5 15.0 49.0 74.0
Source:India Renewable Energy Development Agency; ‘Solar Mission’, 2009
9IndIa's Clean RevolutIon MARCH 2011
Case study 1: suzlon – a staR aMong IndIan ReneWable eneRgy CoMpanIes in india Suzlon has a market share of more than 44% of the installed capacity25. it is a world leader in wind energy technology and project development. tulsi tanti, founder of Suzlon, came from the textile industry. after his family’s business suffered from electricity cuts, he ventured into wind energy generation and set up Suzlon in 1995. the company grew quickly and by 2009 it was the third largest wind-turbine manufacturer worldwide with a global market share of 9.8%26. one of the main reasons for its quick international growth was the supply gap that existed at the time. Suzlon could deliver to clients around the world at faster rates than its main competitors27.
Given low and falling costs, the technology may soon achieve grid parity28, at which point wind power will be free of the need for government incentives. Today the capital cost of wind power projects ranges between INR 4-5 crore29 (USD 0.9 – 1.1 million) per MW. This gives a levelled cost of energy generation within a range of INR 2-2.5 crore (USD 0.44 – 0.55 million) per kWh, taking into account the various fiscal benefits extended by the Government including an accelerated depreciation of 80%; tax holidays for power generation projects; soft loans; customs and excise duty relief; and liberalized foreign investment procedures.
In December 2009, a GBI of INR 0.50/kWh (just over USD 0.01) for a ten-year period was announced30. It applies only to newly grid-connected wind plants where installations are a minimum of 5 MW in capacity and approved of by the relevant utility. There is a cap of INR 6.2 million (USD 135,800) per MW and the program is limited to an overall capacity addition of 4 GW. It is administered by the Indian Renewable Energy Development Agency (IREDA). This GBI package makes available INR 380 crore (USD 83 million) for turbines installed up to the end of March 201231.
IndIa's Clean eneRgy futuRe
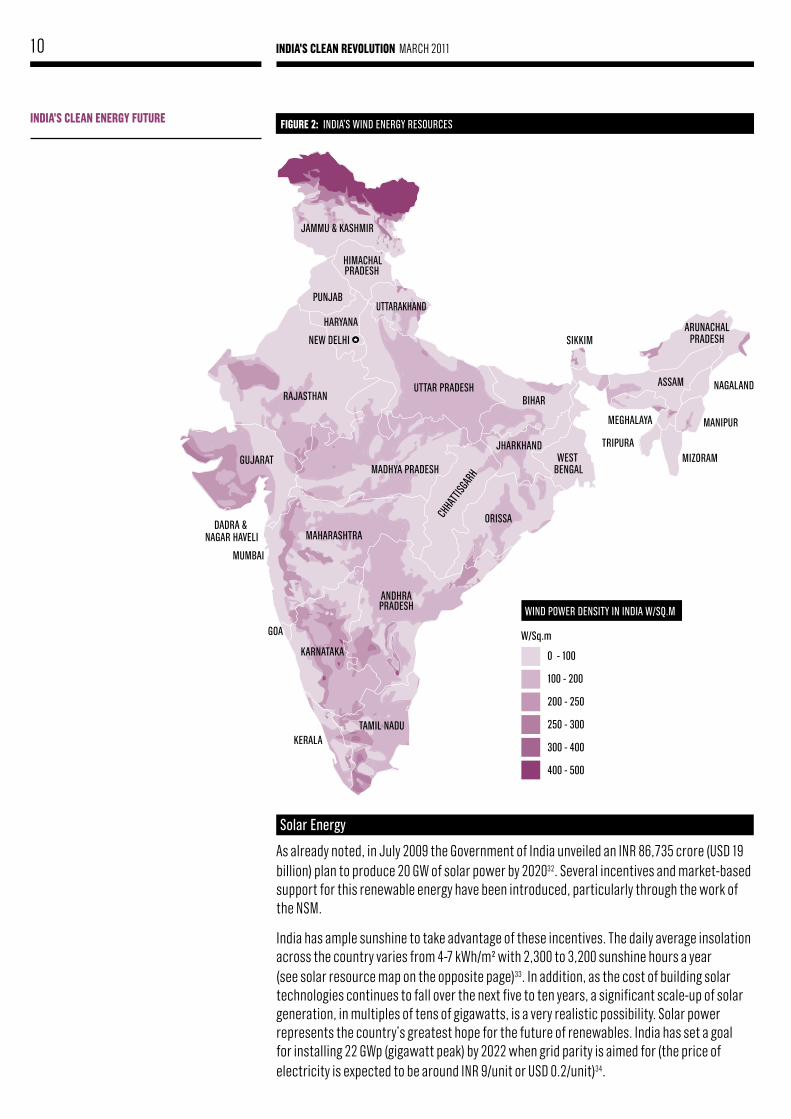
10 IndIa's Clean RevolutIon MARCH 2011
GOA
JAMMU & KASHMIR
HIMACHALPRADESH
PUNJAB
HARYANA
RAJASTHANUTTAR PRADESH
UTTARAKHAND
GUJARATMADHYA PRADESH
CHHA
TTISG
ARH
BIHAR
JHARKHAND
ORISSA
ANDHRAPRADESH
MAHARASHTRA
MUMBAI
DADRA & NAGAR HAVELI
KERALATAMIL NADU
KARNATAKA
SIKKIM
MEGHALAYA
ASSAM
ARUNACHALPRADESH
NAGALAND
MANIPUR
MIZORAMTRIPURA
WEST BENGAL
NEW DELHI
wind power denSity in india w/Sq.M
w/Sq.m
0 - 100
100 - 200
200 - 250
250 - 300
300 - 400
400 - 500
fIguRe 2: india’S wind energy reSourCeS
Solar energy
As already noted, in July 2009 the Government of India unveiled an INR 86,735 crore (USD 19 billion) plan to produce 20 GW of solar power by 202032. Several incentives and market-based support for this renewable energy have been introduced, particularly through the work of the NSM.
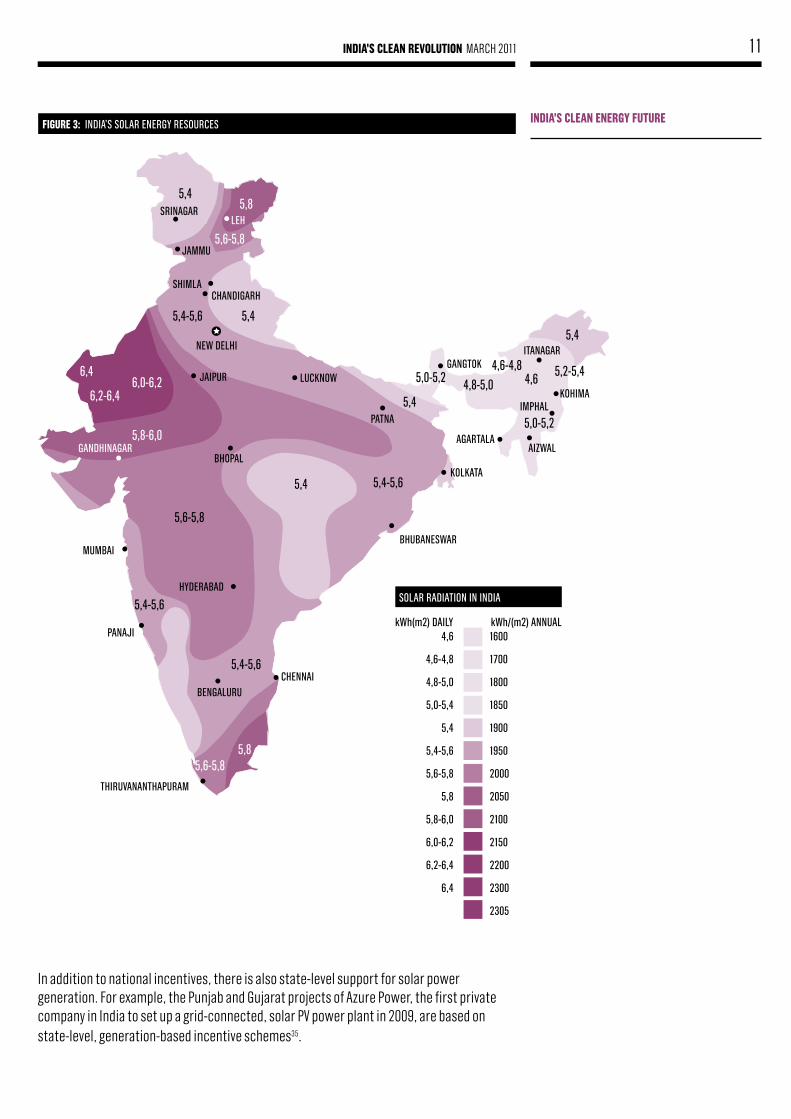
India has ample sunshine to take advantage of these incentives. The daily average insolation across the country varies from 4-7 kWh/m² with 2,300 to 3,200 sunshine hours a year (see solar resource map on the opposite page)33. In addition, as the cost of building solar technologies continues to fall over the next five to ten years, a significant scale-up of solar generation, in multiples of tens of gigawatts, is a very realistic possibility. Solar power represents the country’s greatest hope for the future of renewables. India has set a goal for installing 22 GWp (gigawatt peak) by 2022 when grid parity is aimed for (the price of electricity is expected to be around INR 9/unit or USD 0.2/unit)34.
IndIa's Clean eneRgy futuRe
11IndIa's Clean RevolutIon MARCH 2011
IndIa's Clean eneRgy futuRe
SRINAGAR
JAMMU
LEH
SHIMLACHANDIGARH
JAIPUR LUCKNOW
PATNA
KOLKATA
BHUBANESWAR
HYDERABAD
BENGALURUCHENNAI
THIRUVANANTHAPURAM
GANGTOKITANAGAR
IMPHAL
AGARTALAAIZWAL
NEW DELHI
GANDHINAGARBHOPAL
MUMBAI
PANAJI
KOHIMA
5,45,8
5,8
5,6-5,8
5,4-5,6
5,4-5,6
5,4-5,6
5,4-5,6
5,4
5,4
4,65,2-5,4
5,0-5,2
4,8-5,0
4,6-4,85,0-5,2
5,4
5,4
6,4
6,2-6,46,0-6,2
5,8-6,0
5,6-5,8
5,6-5,8
Solar radiation in india
kwh(m2) daily kwh/(m2) annual1600
1700
1800
1850
1900
1950
2000
2050
2100
2150
2200
2300
2305
4,6
4,6-4,8
4,8-5,0
5,0-5,4
5,4
5,4-5,6
5,6-5,8
5,8
5,8-6,0
6,0-6,2
6,2-6,4
6,4
In addition to national incentives, there is also state-level support for solar power generation. For example, the Punjab and Gujarat projects of Azure Power, the first private company in India to set up a grid-connected, solar PV power plant in 2009, are based on state-level, generation-based incentive schemes35.
fIguRe 3: india’S Solar energy reSourCeS
12 IndIa's Clean RevolutIon MARCH 2011
Case study 2: azuRe poWeR azure power was the first private company in india to setup a grid-connected, solar pv power-plant in 2009. the plant currently has an installed capacity of 1 Mw that supplies about 20,000 households at the tail-end of the grid36. while the first plant cost inr 190 million (uSd 3.8 million) per Mw, the costs for a new plant in gujarat will only be inr 170 million (uSd 3.4 million) per Mw and further projects are expected to cost no more than inr 150 million (uSd 3 million) per Mw.
Aside from the NSM incentives for indigenous solar manufacture, the Government has created special economic zones (SEZs) with the aim of increasing domestic manufacturing to over 1 GW, compared with less than 60 MW in 200937. Fabcity, an SEZ on the outskirts of Hyderabad, is the largest investment ever made in the Indian technology sector. This ground-breaking city marks the first step towards India becoming a semiconductor market worth INR 153,384 crore (USD 33.6 billion) that will employ some 3.6 million people by 201538.
As part of the Government of India’s SEZ plans, investment subsidies of 20-25% for semiconductor manufacture and eco-system manufacturing units (which by definition include solar cells and PV) are also provided through grants, subsidies or government-equity participation39. These subsidies are provided on the condition that the net present value of any investment is at least INR 1000 crore (USD 220 million). Initial applications under the subsidy scheme indicated possible cumulative investment of about INR 66,400 crore (USD 16 billion)40.
Market potential and Job opportunities
The potential for India’s renewable energy generation market is huge. A study by India’s Centre for Development Finance at the Institute for Financial Management and the US-based World Resources Institute showed that the clean energy market in India’s rural ‘Base of the Pyramid’ population41 could be worth as much as INR 9,728 crore (USD 2.11 billion) per annum42. The market for renewables is growing at 15% per annum43 with global investment in clean energy reaching INR 1.1 million crore (USD 243 billion) in 2010, up from INR 851,400 crore (USD 186.5 billion) in 200944.
Unsurprisingly, such growth has positive implications for employment. According to a report of the Global Climate Network, India has the potential to create 10.5 million new jobs if the plans of the country's 2008 National Action Plan on Climate Change are fully realized45. The wind sector, predicted to be worth INR 60,000 crore (USD 13 billion) in 2020, could create between 150,000 to 250,000 jobs. Similarly, the solar industry, predicted to be worth INR 32,000 crore (USD 7 billion)46, could by the same year generate between 117,000 to 235,000 jobs47. The small hydro and biomass sectors, meanwhile, are expected to be worth INR 27,000 crore (USD 6 billion) and INR 32,000 crore (USD 7 billion) respectively in 202048 49.
Delivering these economic and employment benefits will, however, require progress in other areas. The success of renewable energy for grid-based electricity supply, for example, will depend on improvements in the grid infrastructure as well as the future costs of renewable energy components and fossil fuel. Currently, wind and small hydro are by far the most competitive renewable options with electricity generation costs between INR 3-4.5 (USD 0.05-0.09) per kWh, followed by biomass with INR 4.00-5.00 (USD 0.06-0.10) per kWh50. Solar power is still far more expensive: one kWh costs approximately INR 10-15 (USD 0.20-0.30) for Concentrated Solar Power (CSP) and INR 12-20 (USD 0.24-0.40) for PV51. Coal remains the cheapest source of energy with generation costs of only INR 1-2 (USD 0.02-0.04) per kWh52.
IndIa's Clean eneRgy futuRe
The market for renewables is growing at 15% per annum with global investment in clean energy reaching USD 243 billion in 2010. India’s renewable market has the potential to create 10.5 million new jobs.
13IndIa's Clean RevolutIon MARCH 2011
In the long-term, the main opportunity in India is perhaps not to be found in grid-connected renewables, but in off-grid applications: from small-scale rural electrification to large-scale captive power for industries suffering heavily from insufficient power supply53. Here, renewable energy often competes with expensive generator-based power running on diesel or with the expense of having no power at all rather than with cheap grid electricity. Given that a large part of the country is not yet connected to the grid (40% of Indian households according to one study54), India has the opportunity to create a more cost effective and possibly climate friendly decentralized electricity supply.
India can make a virtue of the proportion of the country that is currently off-grid. It can use renewable energy to leapfrog ahead of developed countries and implement renewable energy technologies in an economically attractive mini-grid set-up. What is needed are not so much new technology options, but rather good business models with functioning marketing and distribution channels, service and maintenance networks as well as financing options. The key success factor is entrepreneurship – a resource India has in abundance – plus a clear and consist public policy framework to support sustained investment.
energy generation efficiency
Much of India’s energy generation (and consumption) use is very inefficient. Currently, only 25% of the primary energy used in its coal-fired power plants actually reaches the end user55. This illustrates the enormous low-hanging opportunities for energy and financial savings all along the value chain. Energy efficiency offers the most attractive low carbon strategy for India56 including in the power generation sector, a fact not lost on the Government.
government drive for efficient power generation
To harness the enormous energy saving potential, the Government’s Renovation and Modernisation program has been introduced to apply to existing power plants. Government support is also provided for new technologies like supercritical technology for coal-based plants and for Integrated Gasification Combined Cycle (IGCC) technology for gas-based plants57. The efficiency of India’s coal power plants currently averages only 30%58. New supercritical technology can bring average energy conversion efficiency up by 10% by 2030, which would not only save money but reduce coal consumption by about 250 Mt (megaton) per annum, lowering capacity requirements by about 90 MW and reduce emissions by about 400 Mt CO
259.
Case study 3: IndIa’s fIRst ultRa Mega poWeR plant (uMpp) by tata poWeR tata power Company limited will build and operate at Mundra in the state of gujarat a 4 gw uMpp using higher quality imported coal and supercritical technology. the gHg emissions per Kwh of energy generated from the project will be about 750g Co
2/kwh (gram Co
2 per kilowatt hour), compared with the indian average of 1,259g
Co2/kwh for coal-based power plants in 2005. the gHg emissions intensity will thus
be reduced by 40%. the project will avoid the burning of 1.7 million tons of coal per annum, resulting in a reduction of 3.6 MtCo
2/year.
IndIa's Clean eneRgy futuRe
14 IndIa's Clean RevolutIon MARCH 2011
Success in reducing transmission and distribution losses
India has already significantly reduced its transmission and distribution losses from 40% in 2000 to 27% in 200960. The Government of India is aiming to bring down the losses to 20% by 201261, which would still leave considerable room for improvement. The state of Gujarat, for example, has managed to bring down redistribution losses from 30% in 2005 to 20% in 2009 (Case Study 4). Privatization of one Delhi utility has led to a reduction of distribution losses from 53% to 15%, leading to savings of more than INR 2,500 crore (USD 547 million) in the year 2006-2007 and around INR 5,000 crore (USD 1.1 billion) in 2011-2012.
Case study 4: pRIvatIzatIon of delhI utIlIty ReduCes dIstRIbutIon losses62 after partial privatization, north delhi power limited (ndpl) was able to reduce transmission losses from 53% in 2002 to 15% in 2009. this was due to investments in grid infrastructure, electronic monitoring systems, a computerized management system and engaging of citizens to reduce power theft.
Joining the energy efficiency dots: Supply and demand Side linkages
Improving power generation and transmission performance addresses only part of India’s energy efficiency challenge. Supply side improvements mean little without corresponding efforts on the demand side. For this reason the Government of India has initiated a number of policies to help control energy consumption. These are designed to harness India’s energy savings potential, which is estimated to be at least 20% without the need for significant investment63.
The Government of India’s initiatives began in 2001 with the introduction of the Energy Conservation Act, followed by the establishment of the Bureau of Energy Efficiency (BEE) in 2006. Government policies and measures now include64:
• Setting industry standards for energy consumption, demanding regular energy audits and offering energy manager training.
• Increasing consumer awareness by offering a five-star rating system for appliances.
• Active demand-side management to reduce peak power demand and the development of business models for Energy Service Companies (ESCOs).
With the 11th Five Year Plan (2007-2012) having set an energy saving target of 10 GW65 (a significant increase over the 877 MW achieved under the previous plan), the pressure is now on government and business alike to deliver. The remainder of this report looks at how Indian business and political leaders are stepping up to meet this challenge by embracing the energy-saving, low carbon opportunities of the Clean Revolution.
IndIa's Clean eneRgy futuRe
With India’s 11th Five Year Plan having set an energy saving target of 10 GW, the pressure is now on government and business alike to deliver.
15IndIa's Clean RevolutIon MARCH 2011
2. Clean IndustRy• Industry is India’s largest energy user, already accounting for about 52% of total
commercial energy consumption; demand is expected to soar to 588 billion kWh by 2045, from 138 billion kWh in 2004-2005. This means that energy efficiency lies at the heart of India’s clean industrial revolution.
• Industrial energy consumption could be reduced by 15-25%1, avoiding the need for the construction of 10 GW of power capacity by 2012.
• Energy efficiency is predicted to be the most valuable low carbon market strategy for India, worth INR 352,000 crore (USD 77 billion) by 20202, up from INR 68,500 crore (USD 15 billion) in 2009. The market for industrial efficiency will be worth INR 118,700 crore (USD 26 billion) in 2020.
• The above energy savings would equate to 148.6 million tons of avoided CO2 emissions
per annum.
• The National Mission on Enhanced Energy Efficiency (NMEEE) is expected to account for annual fuel savings in excess of 23 million tons by 2014. It also seeks to achieve a cumulative avoided electricity capacity addition of 19 GW, and save 98 million tons CO
2
emissions per year.
• The Perform, Achieve, Trade (PAT) scheme to be introduced in April 2011 and applicable to 600 units across eight energy intensive industries, aims to save ten million tons of fuel by 2014, with the market for certificates expected to be worth USD 0.3 billion3.
indian industry and the Clean revolution
India is among the top ten countries in the world for industrial production and industry is the country’s largest consumer of energy and emitter of GHGs4. Demand for energy in 2004-2005 by India’s industrial sector at 138 billion kWh accounted for about 52% of the total commercial energy consumption5. At projected growth rates this is expected to soar to 588 billion kWh by 20456, with a concomitant increase in emissions.
For Indian industry, climate change could increase the costs of doing business and in some cases may disrupt supply chains. Apart from the direct impacts on infrastructure, industrial plant and transport networks, increasing public awareness and concern for the environment – both domestically and internationally – may lead to companies being perceived as ‘dirty’. As a result companies face being shunned by consumers and seeing their access to finance and markets restricted. Government policies that impose energy efficiency and process standards may also result in regulatory risk for companies that have not invested in cleaner technologies, a situation that will be exacerbated as they fall behind those adopting newer, more resource efficient and hence more competitive production methods.
On the plus side, however, India can become a leader in developing and adopting technologies and processes that are energy efficient and more sustainable in the long run. There are very real economic opportunities available from reducing costs associated with the energy intensity of GDP growth. This is particularly so given India’s power deficit and over-dependence on fossil fuel imports.
The large energy conservation potential in Indian industry could lead to substantial reductions in the cost of production and huge savings in fossil fuel and electricity consumption, while at the same time helping industry to be sustainable in the competitive international market.
aCCoRdIng to hsbC, In 2020 the MaRket foR IndustRIal eneRgy effICIenCy In IndIa WIll be WoRth usd 26 bIllIon Photo: Bandra-Worli sea link. Mumbai, India.
17IndIa's Clean RevolutIon MARCH 2011
Energy efficiency therefore offers the most attractive low carbon strategy for India as it provides opportunities to help the country meet increasing demand, while reducing both cost and carbon emissions. The large energy conservation potential in Indian industry could lead to substantial reductions in the cost of production and huge savings in fossil fuel and electricity consumption, while at the same time helping industry to be sustainable in the competitive international market.
It is difficult (and expensive) to adopt new technologies and practices once plants have been set up and production processes established. India is at the stage of creating massive industrial and capital assets and can opt for clean and energy-efficient technologies to make possible an era of low carbon growth. Early action will thus be important to avoid lock-in from large-scale capital investments.
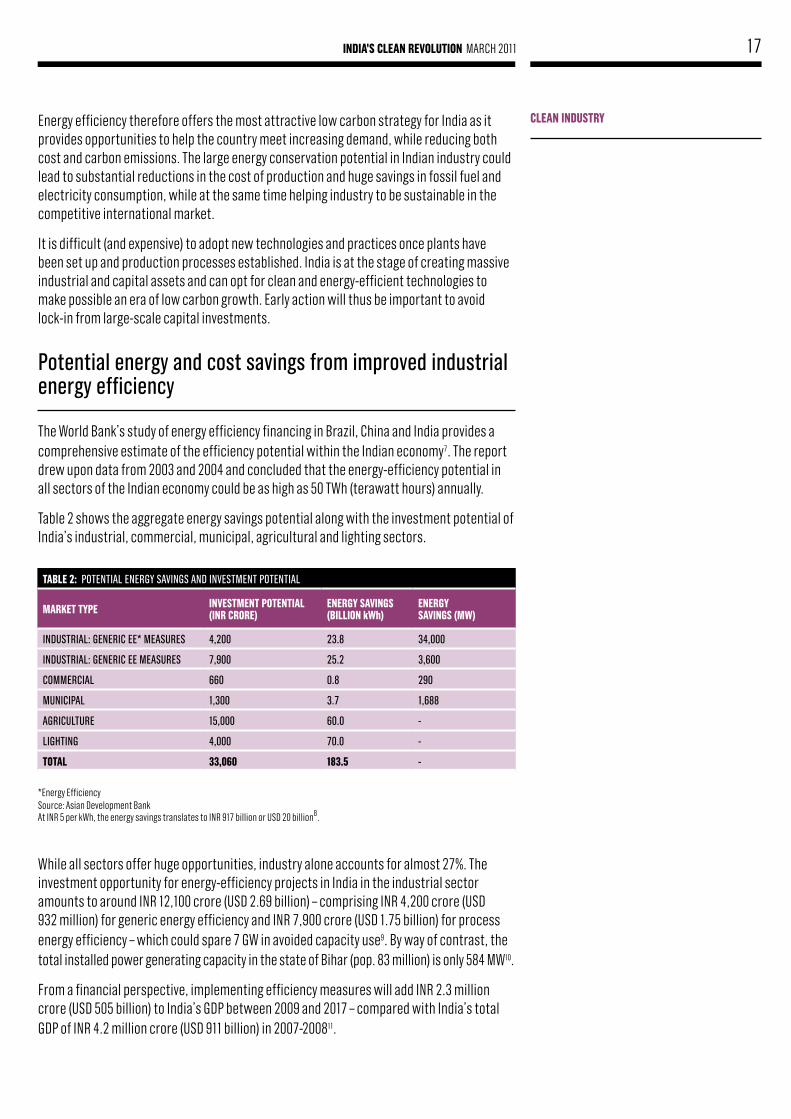
potential energy and cost savings from improved industrial energy efficiency
The World Bank’s study of energy efficiency financing in Brazil, China and India provides a comprehensive estimate of the efficiency potential within the Indian economy7. The report drew upon data from 2003 and 2004 and concluded that the energy-efficiency potential in all sectors of the Indian economy could be as high as 50 TWh (terawatt hours) annually.
Table 2 shows the aggregate energy savings potential along with the investment potential of India’s industrial, commercial, municipal, agricultural and lighting sectors.
*Energy Efficiency Source: Asian Development Bank At INR 5 per kWh, the energy savings translates to INR 917 billion or USD 20 billion8.
While all sectors offer huge opportunities, industry alone accounts for almost 27%. The investment opportunity for energy-efficiency projects in India in the industrial sector amounts to around INR 12,100 crore (USD 2.69 billion) – comprising INR 4,200 crore (USD 932 million) for generic energy efficiency and INR 7,900 crore (USD 1.75 billion) for process energy efficiency – which could spare 7 GW in avoided capacity use9. By way of contrast, the total installed power generating capacity in the state of Bihar (pop. 83 million) is only 584 MW10.
From a financial perspective, implementing efficiency measures will add INR 2.3 million crore (USD 505 billion) to India’s GDP between 2009 and 2017 – compared with India’s total GDP of INR 4.2 million crore (USD 911 billion) in 2007-200811.
Clean IndustRy
table 2: potential energy SavingS and inveStMent potential
MaRket type InvestMent potentIal (InR CRoRe)
eneRgy savIngs (bIllIon kWh)
eneRgy savIngs (MW)
induStrial: generiC ee* MeaSureS 4,200 23.8 34,000
induStrial: generiC ee MeaSureS 7,900 25.2 3,600
CoMMerCial 660 0.8 290
MuniCipal 1,300 3.7 1,688
agriCulture 15,000 60.0 -
ligHting 4,000 70.0 -
total 33,060 183.5 -
18 IndIa's Clean RevolutIon MARCH 2011
opportunities for energy efficiency in indian industry
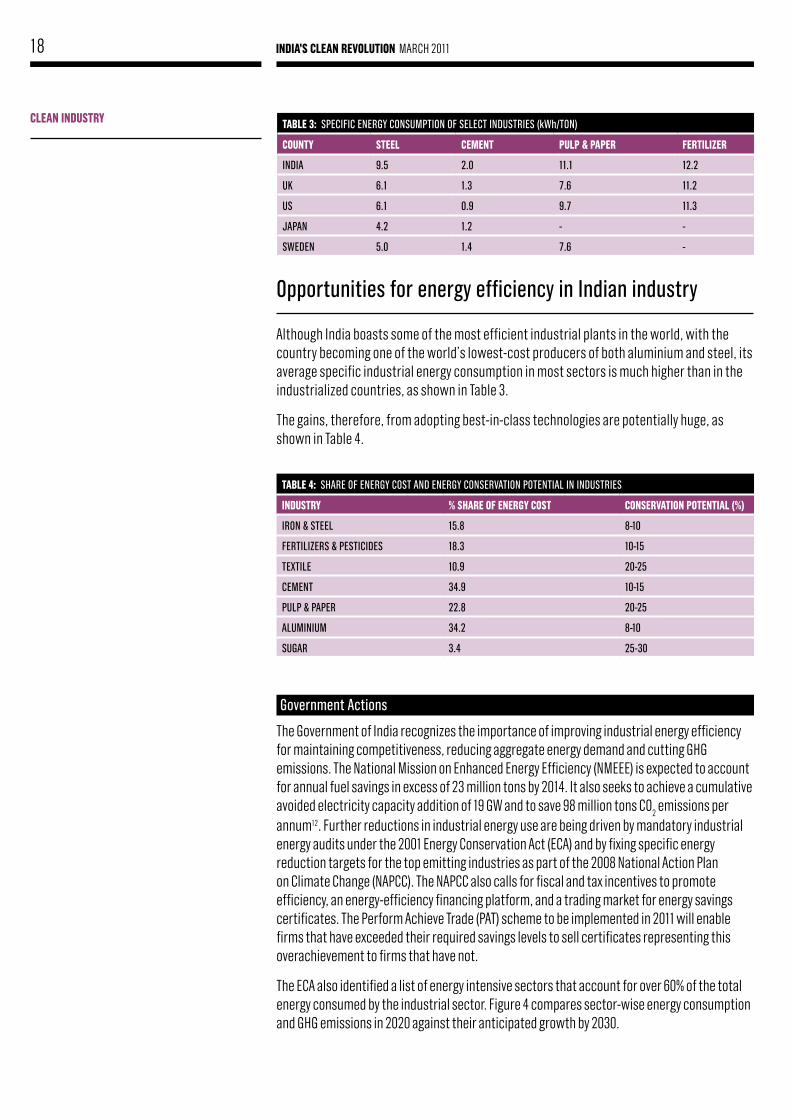
Although India boasts some of the most efficient industrial plants in the world, with the country becoming one of the world’s lowest-cost producers of both aluminium and steel, its average specific industrial energy consumption in most sectors is much higher than in the industrialized countries, as shown in Table 3.
The gains, therefore, from adopting best-in-class technologies are potentially huge, as shown in Table 4.
government actions
The Government of India recognizes the importance of improving industrial energy efficiency for maintaining competitiveness, reducing aggregate energy demand and cutting GHG emissions. The National Mission on Enhanced Energy Efficiency (NMEEE) is expected to account for annual fuel savings in excess of 23 million tons by 2014. It also seeks to achieve a cumulative avoided electricity capacity addition of 19 GW and to save 98 million tons CO
2 emissions per
annum12. Further reductions in industrial energy use are being driven by mandatory industrial energy audits under the 2001 Energy Conservation Act (ECA) and by fixing specific energy reduction targets for the top emitting industries as part of the 2008 National Action Plan on Climate Change (NAPCC). The NAPCC also calls for fiscal and tax incentives to promote efficiency, an energy-efficiency financing platform, and a trading market for energy savings certificates. The Perform Achieve Trade (PAT) scheme to be implemented in 2011 will enable firms that have exceeded their required savings levels to sell certificates representing this overachievement to firms that have not.
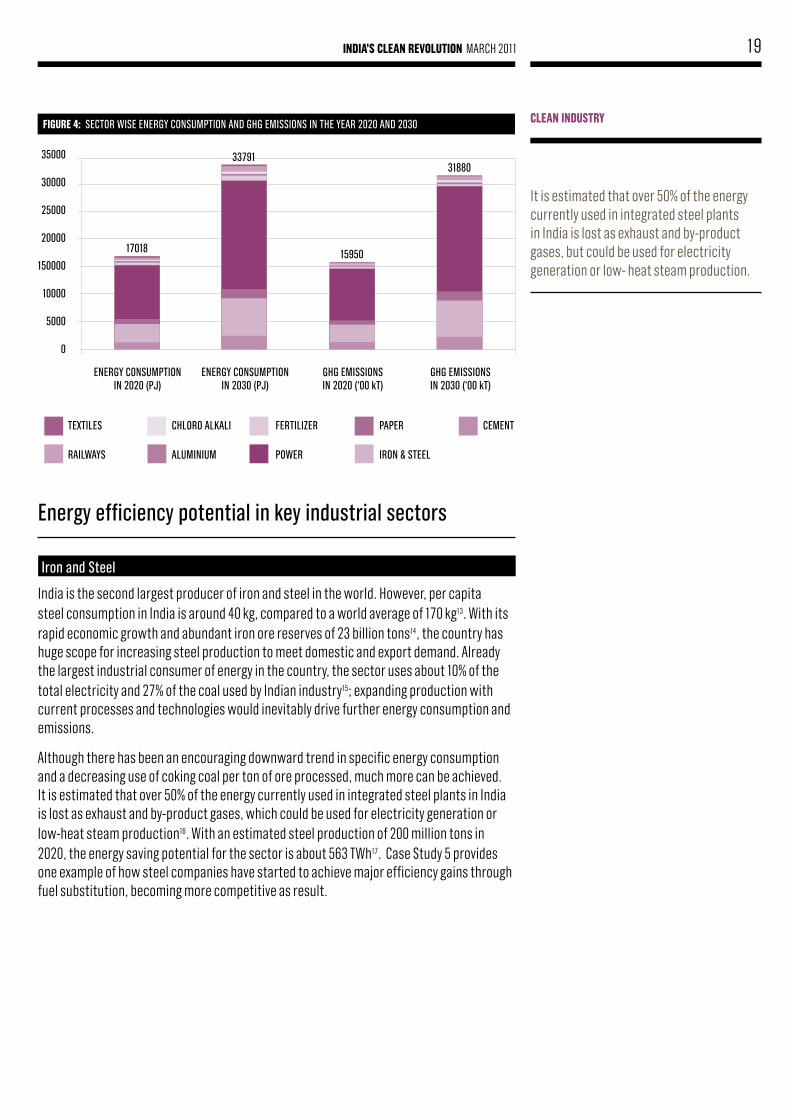
The ECA also identified a list of energy intensive sectors that account for over 60% of the total energy consumed by the industrial sector. Figure 4 compares sector-wise energy consumption and GHG emissions in 2020 against their anticipated growth by 2030.
table 3: SpeCifiC energy ConSuMption of SeleCt induStrieS (kwh/ton)
County steel CeMent pulp & papeR feRtIlIzeR
india 9.5 2.0 11.1 12.2
uK 6.1 1.3 7.6 11.2
uS 6.1 0.9 9.7 11.3
Japan 4.2 1.2 - -
Sweden 5.0 1.4 7.6 -
Clean IndustRy
table 4: SHare of energy CoSt and energy ConServation potential in induStrieS
IndustRy % shaRe of eneRgy Cost ConseRvatIon potentIal (%)
iron & Steel 15.8 8-10
fertilizerS & peStiCideS 18.3 10-15
textile 10.9 20-25
CeMent 34.9 10-15
pulp & paper 22.8 20-25
aluMiniuM 34.2 8-10
Sugar 3.4 25-30
19IndIa's Clean RevolutIon MARCH 2011
energy efficiency potential in key industrial sectors
iron and Steel
India is the second largest producer of iron and steel in the world. However, per capita steel consumption in India is around 40 kg, compared to a world average of 170 kg13. With its rapid economic growth and abundant iron ore reserves of 23 billion tons14, the country has huge scope for increasing steel production to meet domestic and export demand. Already the largest industrial consumer of energy in the country, the sector uses about 10% of the total electricity and 27% of the coal used by Indian industry15; expanding production with current processes and technologies would inevitably drive further energy consumption and emissions.
Although there has been an encouraging downward trend in specific energy consumption and a decreasing use of coking coal per ton of ore processed, much more can be achieved. It is estimated that over 50% of the energy currently used in integrated steel plants in India is lost as exhaust and by-product gases, which could be used for electricity generation or low-heat steam production16. With an estimated steel production of 200 million tons in 2020, the energy saving potential for the sector is about 563 TWh17. Case Study 5 provides one example of how steel companies have started to achieve major efficiency gains through fuel substitution, becoming more competitive as result.
fIguRe 4: SeCtor wiSe energy ConSuMption and gHg eMiSSionS in tHe year 2020 and 2030
35000
30000
25000
20000
150000
10000
5000
0
energy ConSuMptionin 2020 (pJ)
energy ConSuMptionin 2030 (pJ)
gHg eMiSSionS in 2020 (‘00 kt)
gHg eMiSSionS in 2030 (‘00 kt)
17018
33791
15950
31880
Clean IndustRy
It is estimated that over 50% of the energy currently used in integrated steel plants in India is lost as exhaust and by-product gases, but could be used for electricity generation or low- heat steam production.
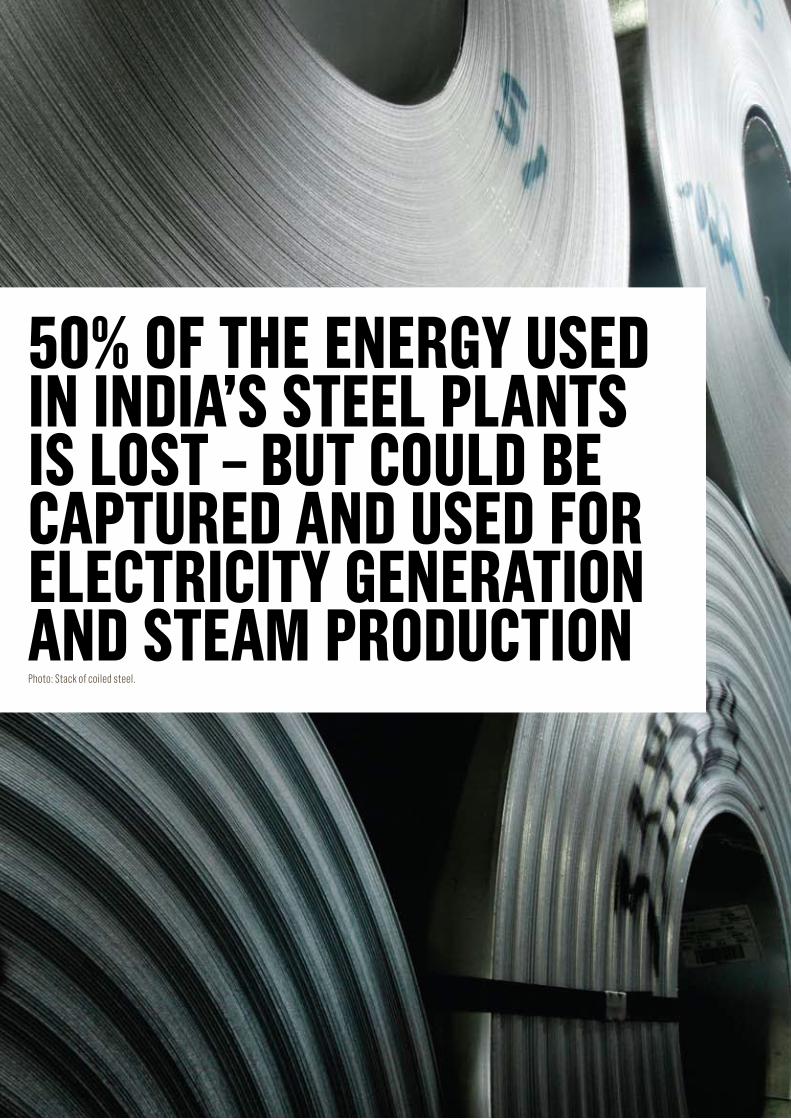
50% of the eneRgy used In IndIa’s steel plants Is lost – but Could be CaptuRed and used foR eleCtRICIty geneRatIon and steaM pRoduCtIon Photo: Stack of coiled steel.
21IndIa's Clean RevolutIon MARCH 2011
Case study 5: tata steel Coal taR InjeCtIon pRojeCt, jaMshedpuR established in 1907, tata Steel is asia’s first and india’s largest private sector steel producer. the company has achieved a breakthrough in coal tar injection technology in blast furnace as a supplement for coke – the calorific value of coal tar is 36,000 kJ/kg (kilojoules per kilogram), which is higher than coke. the system consists of a coal tar storage tank, a pumping station for the tar, a method for controlling the heat of the tar, transport lines to supply the tar to the blast furnaces and distribution and injection systems. the total investment for the project was inr 5 million (uSd 111,000), drawn totally from internal resources, generating an annual savings of inr 9.1 million (uSd 202,000) with a payback of seven months18.
Cement
India is the second largest cement producer in the world19. In spite of rapid growth due to enormous infrastructure development and a housing boom, per capita cement consumption of around 100 kg is still low compared to the world average of 260 kg20.
The cement industry has made tremendous strides in upgrading to the latest technology. As a result, CO
2 emissions per ton of cement in India today are 750 kg compared with 850 kg
in the US21. Nevertheless, energy accounts for about 50% of the total manufacturing cost and cement is still amongst the largest emitters of GHG in India22. According to BEE, there is the potential to reduce energy consumption by 15%, amounting to INR 1,425 crore (USD 316 million) per annum in savings23.
Some of the major areas for improvement are shown in Table 5.
The main route to cutting CO2 emissions is by shifting from coal to lower carbon fuels.
Despite having abundant availability of biomass and natural gas, their use by cement companies remains low. Up to 25%-30% of the total power required could also be supplied through cogeneration of heat and power, using waste heat from plant exhaust or from pre-heater or cooler exit gases (see Case Study 6).
Clean IndustRy
table 5: areaS for iMproveMent froM different teCHnologieS
aRea of IMpRoveMent futuRe use % (2015) lIkely ghg ReduCtIon (%)
blended CeMentS 75-80 22-24
CoMpreSSed natural gaS fuel 20 8-9
waSte derived fuel 20 8-9
non-Conventional energy 8 2-3
energy effiCient plant/MaCHinery 10 8-10
22 IndIa's Clean RevolutIon MARCH 2011
Case study 6: jk CeMents ltd a project completed in 2007 involved using the heat from the exhaust gases from preheat and air quenching Chambers in a plant of JK Cements ltd. these exit gases contained 35% of the total heat generated in the plant. waste heat recovery captive power plants were set up which contained six boilers with a combined capacity of 76.15 tons per hour to drive a steam turbine generator with a capacity of 13.2 Mw. the project reduces 70,796 tons Co
2 emissions per annum24.
The use of secondary materials like slag and fly ash for manufacturing blended cement and the use of waste fuels as a part replacement for coal are also possible (see Case Study 7). In addition, computerization and improved kiln control and better refractory lining can enhance energy efficiency by up to 5%. Both case studies six and seven provide examples of the successful application of energy-saving measures in India’s cement industry. If these solutions were extended across the sector, they would go a long way to capturing the total available energy savings and emission reductions.
Case study 7: shRee CeMents ltd Shree Cements limited (SCl) is among the top five cement groups in india with a turnover of more than inr 3,480 crore (uSd 773 million) and one of the highest operating profit margins. the company is the market leader in delhi, rajasthan and gujarat. the company has also been a leader in adopting energy-efficiency measures and has been appointed leader of the Cement Sector task force for the seventh consecutive year by bee. the company has amongst the lowest power and fuel consumption levels in the industry and remains the benchmark for other companies in terms of overall energy efficiency.
SCl has developed three successful Clean development Mechanism (CdM) projects under the Kyoto protocol. it was the first cement company to have Certified emission reductions (Cers) issued for its ‘optimal utilization of Clinker’ project where fly ash is added to reduce the amount of content of clinker, which is associated with high emissions. the project reduces on-site emissions from clinkerization and off-site emissions at thermal power plants for the grinding of blended cement, kiln operations and processing of additives per unit of cement produced. SCl has received 450,000 Cers for this project25.
Clean IndustRy
23IndIa's Clean RevolutIon MARCH 2011
aluminium
India is the world’s eighth largest producer and fifth largest consumer of aluminium26. Demand for aluminium is expected to grow by about 9% per annum and Indian producers are expanding their production capacity27.
Energy cost is around 35% of the total cost of production and efficiency savings of 8-10% are possible with new technology28. Options include:
• Replacement of rotary kilns by Gas Suspension Calciner;
• Adoption of tube digestion systems;
• Implementation of better agitation techniques;
• Use of large size filters and additives;
• Installation of plate heat exchangers; and
• The implementation of various energy saving measures in smelter operations.
fertilizer
India is the third largest producer and consumer of fertilizers in the world, with the sector accounting for approximately 18.3% of its industrial energy consumption29. Energy saving measures and efficient processing technologies plants have improved energy efficiency over the past few decades (see Case Study 8). The total GHG mitigation potential for the Indian fertilizer industry is estimated to be 34 MtCO
2e with huge potential benefits under
the CDM. The potential for energy savings is estimated to be in the range of 10-15%, leading to considerable cost savings30. Shifting production to best practice in new plants can improve the overall efficiency by 25% with a corresponding decrease in GHG emissions of about 30%31. Returns on investment can be very high as illustrated in Case Study 8.
Case study 8: ModIfICatIon In Co2 systeM In Indo-gulf feRtIlIzeRs ltd,
jagdIshpuR investments made by indo-gulf fertilisers ltd of inr 44.1 million (uSd 980,000) to modify its Co
2 systems have generated annual savings of inr 27.1 million (uSd
600,000) and a payback period of 18 months. use of older generation technology meant that 32 tons per hour of steam was required for regenerating Co
2-loaded
K2Co
3 solution, but flashing at lower pressure generates steam and helps better
regeneration. as a result, a low-pressure tower is used instead of a high-pressure tower. the new system required installation of additional equipment (such as pumps, exchangers and a flash vessel)32.
Clean IndustRy
With new technology in the production aluminum, energy efficiency savings of 8-10% are possible. In the fertilizer industry, energy savings could be as high as 15%. In both cases, increased efficiency would lead to considerable cost savings.
24 IndIa's Clean RevolutIon MARCH 2011
Clean IndustRy pulp and paper
The pulp and paper sector employs more than 1.5 million people and contributes INR 2,500 crore (USD 554 million) to the Government exchequer33. Per capita consumption of paper is one of the lowest in the world at only seven kilograms34. This is set to increase enormously with economic growth.
Paper manufacturing is an energy-intensive process, with the average energy cost for Indian mills at around 20-25% of the total production cost. The fact that this figure is 12-14% in the US and Scandinavia gives an indication of the possible gains that could be made by Indian paper companies. Uptake of energy saving technologies has been accelerated by regulatory and policy emphasis on energy efficiency as well as efforts by the Indian Paper Manufacturers Association and research organizations such as the Central Pulp and Paper Research Institute. It is estimated that the energy saving potential for this industry in India is 20-25%35, while switching from coal to other lower carbon fuels and expanding cogeneration would further help reduce emissions.
The ITC Case Study (see below) gives an example of how Indian pulp and paper companies are also increasingly involved in supporting sustainable forestry initiatives and carbon sequestration projects. Offsetting initiatives such as these will be important for highly carbon intensive sectors for which full decarbonization isn’t technically feasible.
Case study 9: ItC suppoRt foR sustaInable foRestRy with a market capitalization of over inr 137,000 crore (uSd 30 billion) and a turnover of inr 27,400 crore (uSd 6 billion), itC is one of india's foremost private-sector companies. the company’s business encompasses fast-moving consumer goods, paper and packaging, agro-industry and food, hospitality and information technology. itC is a pioneer in sourcing cost-effective, sustainable pulpwood. its program in 2008-2009 benefited over 16,000 villagers and sequestered 3.7 Mt (megaton) Co
2, making the division 'Carbon positive' for the fourth year in a row.
the project uses high-yielding, disease-resistant and site-specific clones and helps create an expansive green cover that contributes to groundwater recharge, soil conservation and carbon sequestration36.

25IndIa's Clean RevolutIon MARCH 2011
Clean IndustRytextiles
The textiles sector is India’s second largest employer after agriculture, contributing about 27% of national export earnings. The sector accounts for 10.9% of the country’s total commercial energy consumption and has an energy conservation potential of around 20-25%37. The major energy-saving opportunities for textile manufacturing come from:
• Installation of radio frequency driers;
• Smaller wrap diameter spindles;
• Single-stage bleaching processes;
• Use of resin finishing;
• Low-energy bleaching processes;
• Low temperature curing of pigment prints;
• Use of foam techniques for printing and finishing.
Case study 10: eneRgy ConseRvatIon In aRvInd MIlls established in 1930, arvind Mills is the largest producer of denim in the world and can boast a number of ‘green’ credentials. the company has one of asia’s largest effluent reverse osmosis systems and it is the first denim mill in the world to receive eco-tex Certification from germany. it has also demonstrated leadership in energy efficiency. an internal audit exercise identified savings from switching off certain cooling pumps during favorable winter conditions. the benefits achieved in the project include greater flexibility of operation and savings of 241,920 kwh of power per annum. the project was executed in 2005 with an investment of inr 1.01 million (uSd 24,000) that was fully financed internally and resulted in annual savings of inr 8.77 million (uSd 195,000), with a payback of less than one month38.
26 IndIa's Clean RevolutIon MARCH 2011
3. Clean tRanspoRt• In India 100 million tons of CO
2e could be saved through greater use of public transport,
electric vehicles, and improved fuel efficiency.
• The transport efficiency sector could be worth INR 118,700 crore (USD 26 billion) by 20201.
• 400,000 electric vehicles are expected on India’s roads by 20202.
india’s accelerating transport sector
A fast growing economy with increasing industrialization, urbanization, de-licensing, growing purchasing power and the availability of trained and comparatively cheap manpower has led to a phenomenal growth in transportation demand in India.
The transportation sector accounts for 15% of India’s total energy consumption3. Road transport accounts for around 90% of the total energy consumed in the transport sector4. However opportunities exist within the sector that if taken, together with opportunities in agriculture, could reduce overall oil consumption in India by 20-25%, and save INR 159,800 crore (USD 35 billion)5. Further economic benefits lie in the transport efficiency market, predicted to be worth INR 118,700 crore (USD 26 billion) by 20206.
With increased attention on the pollution levels in India's cities, there is a growing interest in the use of alternatives to carbon intensive forms of travel. There is the potential to reduce vehicle emissions by nearly 100 MtCO
2e through greater use of public transport, the use of
electric vehicles (EVs) and improved vehicle efficiency7.
Government policies favor investment in public transport through financial support by way of loans and grants to state and local governments. Several energy efficient and environment friendly initiatives such as air conditioned low-floor bus services, Bus Rapid Transit (BRT) and Mass Rapid Transit Systems (MRTS) have been undertaken in large cities. Delhi is leading the way by having world's largest eco-friendly Compressed Natural Gas (CNG) fleet for public transport8, a BRT system, and the Metro (see Case Study 11). These forms of public transport are also being extended to other cities like Mumbai, Pune, Bangalore, Kolkata, Mumbai, Ahmedabad, Hyderabad and others. Meanwhile, Kolkata’s Metro is the first underground railway to be built in India9.
Case study 11: Mass tRavel In delhI delhi Metro’s mass rapid transit system was completed in 2006 within budget and almost three years ahead of schedule. extensions to the network are planned in 2015 and 2021; increasing the size of the network to 413 km10. it is the first railway project in the world to benefit from CdM benefits and has so far earned 400,000 carbon credits by saving energy through the use of regenerative braking systems on its trains11.
Energy efficiency within the transportation and agriculture sectors could reduce overall oil consumption in India by 20-25%, and save USD 35 billion.
27IndIa's Clean RevolutIon MARCH 2011
thriving Market for evs and energy-efficient vehicles
India emerged as the second fastest growing car market in the world in 2010, next only to China. Car sales surged by 31% during the year to 1.9 million units. This expansion saw India become the seventh largest car market in the world, up from fifteenth position in 200012. By 2030 India’s vehicle fleet is expected to climb to 380 million, up from 50 million today. The Indian car industry now has a turnover of INR 128,000 crore (USD 28 billion) while the auto component industry’s turnover has reached about INR 45,650 crore (USD 10 billion)13.
Considering its economic growth trajectory, investments to ramp up transportation in India will require annual spending of approximately INR 137,000 crore (USD 30 billion) by 2015, INR 274,000 crore (USD 60 billion) by 2020 and INR 412,000 crore (USD 90 billion) by 203014.
It will be important for India’s long-term economic and environmental well-being that as much of this expansion in vehicle numbers is low carbon. Electric vehicles are part of the solution. EVs have energy efficiencies of over 90%, which is approximately double the efficiency of vehicles with internal combustion engines15. This means that EVs can help cut India’s fossil fuel dependency and also reduce local pollution on its crowded road network. Other good news is that the opportunities in low carbon vehicles are growing. The global market in low carbon vehicles is expected to be worth INR 2.2 million crore (USD 473 billion) by 202016. Domestically, 400,000 EVs and hybrids are expected on the road by 202017. There will also be significant export opportunities for Indian car manufacturers.
The major player in the EV market, Reva, plans to build a plant in Bangalore by 2011 that will produce 30,000 cars a year18 for local use and export. Delhi incentivizes the use of EVs, providing a 15% subsidy to all electric vehicles along with a 12.5% VAT exemption, and road tax and registration refund19. It would reduce vehicle emissions, and help mainstream EVs if other states were to follow suit. Government incentives are playing a role, but more aggressive signalling is needed.
Case study 12: a leadIng ManufaCtuReR of evs In IndIa reva was founded in 1994. the revai, their micro electric car, was launched in 2001 in bangalore. on the back of this success the same car was launched in london under the g-wiz brand. today reva has deployed one of the largest fleets of electric vehicles anywhere in the world. Consequently they have built up data from more than 100 million km of user experience. their experience and technical know-how has propelled them to being one of the foremost ev manufactures in the world; in 2010 this was recognized as the revai was named the green car of the year in the CnbC tv-18 overdrive awards20.
In addition to the advances in Indian EVs, alternatives such as biofuels, compressed natural gas (CNG), liquefied petroleum gas (LPG) and fuel cell technology are gaining in prominence as ways to reduce emissions in the sector. As an example, the Karnataka State Road Transport Corporation (KSRTC) has switched its 1,000 bus fleet to using an ethanol-diesel blend comprising 7.7% ethanol and 0.5% of O2Diesel’s proprietary fuel additive technology21.
Clean tRanspoRt
28 IndIa's Clean RevolutIon MARCH 2011
LPG is now available in more than 350 cities in the country for use in passenger cars, three wheelers, two wheelers, trucks, buses and light commercial vehicles (LCVs)22. Increasing numbers of vehicles are either being converted or new vehicles using the fuel are coming onto the market. For example, in Bangalore and Kolkata, three wheelers have been made mandatory to run on LPG resulting in about 79,000 auto rickshaws being converted in compliance with the regulation23. In total there are more than 935,000 vehicles fueled by natural gas in India24.
government Support
The MNRE recently announced an incentive package worth INR 95 crore (USD 20.8 million) for all types of Battery Operated Vehicles (BOVs), Plug-in Hybrid Vehicles (PHEVs) and Hybrid Electric Vehicles (HEVs)25. The incentive scheme is intended for EV manufacturers in India and amounts to INR 4,000 (USD 88) for two wheelers, INR 60,000 (USD 1,300) for three wheelers, INR 100,000 (USD 2,200) for cars, and INR 400,000 (USD 8,800) for electric minibuses26. Following a reduction in the excise duty on EVs from 16% to 8% in the 2004 budget, the finance minister proposed removing customs duties on key components used in EVs and to reduce import duties from 24% to 4% in the 2010-2011 Budget27.
Although the sector accounts for about 18% of the total CO2 emissions in the country, there
are still no emissions-limits standards for CO2 pollution from vehicles. There is also no
provision to make CO2 emissions-labelling mandatory on cars. Nevertheless, in addition to
incentives for emissions-efficient vehicles, there has been increasing control of vehicle emissions by policy-makers in India over the past two decades, especially in urban areas. Regulation in conjunction with increasingly environmentally friendly technologies means that oil companies, car manufacturers as well as consumers are all obliged to comply with tightening standards. The National Auto Fuel Policy of 2003 gives a broad roadmap for achieving various vehicle emission norms over time with the corresponding requirements for upgrading fuel quality28.
It is for government to send the right signals to the market to ensure that its vehicle market is not supported to the detriment of public transportation, which offers the highest potential for energy savings and emissions reduction, especially in urban areas.
Clean tRanspoRt
29IndIa's Clean RevolutIon MARCH 2011
4. gReen buIldIngs and sMaRt teChnology• Green buildings and ‘smart’ information and communication technologies can help India
avoid a looming energy deficit, while at the same time helping to add INR 2.3 million crore (USD 608 billion) in economic output by 2020.
• The use of energy efficient lighting, appliances and electronics could reduce India’s GHG emissions by 125 MtCO
2e by 2030, while also delivering cost savings to households and
businesses through lower energy bills.
• Application of smart ICT to lighting, heating and production processes in the industry and building sectors alone could deliver savings of INR 33,000 crore (USD 7.4 billion) and INR 135,600 crore (USD 29.7 billion) respectively by 2020.
• The emergence of smart technologies as a core driver of the Clean Revolution provides a win-win opportunity for India: not only will such technologies reduce cost and save energy across all areas of business, but they will also provide new markets for India’s world class ICT sector.
being green by going smart
The rapid growth of India’s middle class is leading to a huge market for housing, infrastructure, appliances and utilities, placing further stress on the country’s energy infrastructure. A study by the Berkeley Laboratory of the US Department of Energy has found that cost-effective end-use electricity efficiency measures have the potential to eliminate India’s expected electricity deficit by 2014 while at the same time requiring less investment for new power supply compared to the BAU scenario1. Removal of the electricity deficit through these means would lead to an INR 2.3 million crore (USD 505 billion) and INR 2.8 million crore (USD 608 billion) increase in India’s economic output by 2017 and 2020 respectively.
Capturing these energy and economic savings in housing, infrastructure and other areas provides major business opportunities. ‘Smart’ technologies from the information and communications technology (ICT) sector can play a significant role in providing solutions for many of these sectors. This is a win-win opportunity for India: not only will such energy saving efforts reduce cost and drive down carbon emissions, but they will also provide new markets for India’s world class ICT sector. This chapter showcases the end-user efficiency opportunity in buildings, appliances, lighting and the ICT sector.
Cost-effective end-use electricity efficiency measures have the potential to eliminate India’s expected electricity deficit by 2014 – leading to lead to a USD 608 billion increase in India’s economic output by 2020.
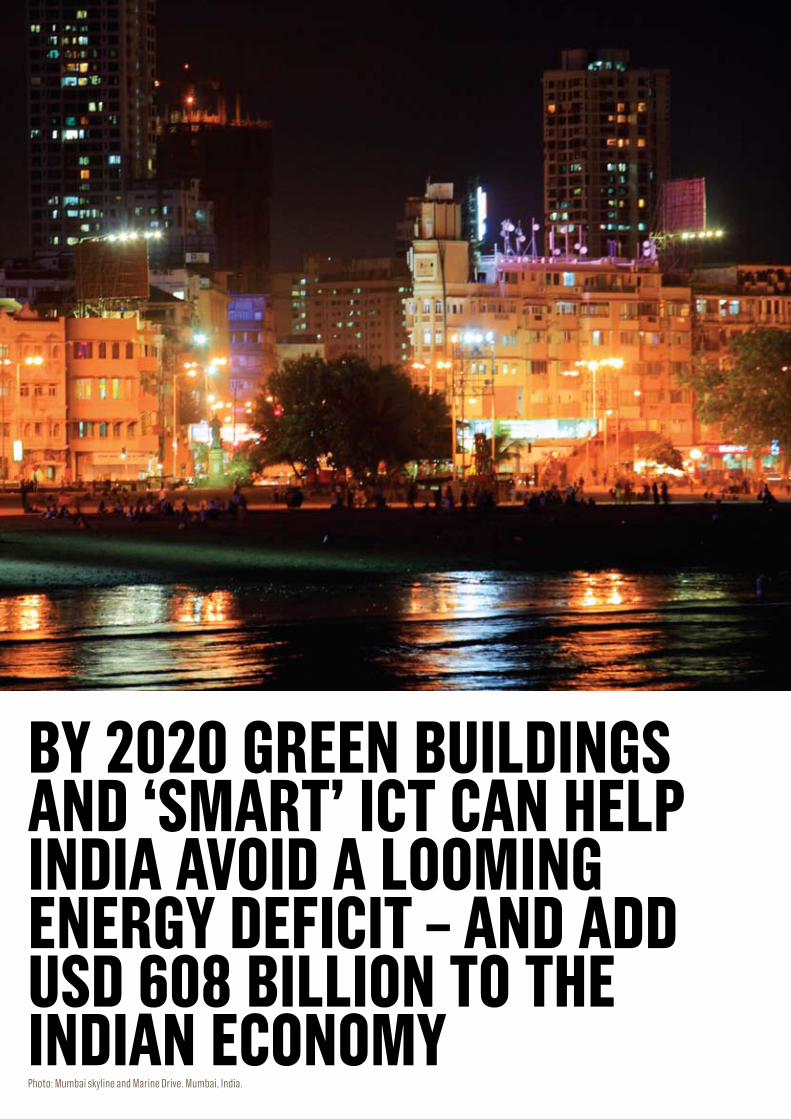
by 2020 gReen buIldIngs and ‘sMaRt’ ICt Can help IndIa avoId a looMIng eneRgy defICIt – and add usd 608 bIllIon to the IndIan eConoMy Photo: Mumbai skyline and Marine Drive. Mumbai, India.
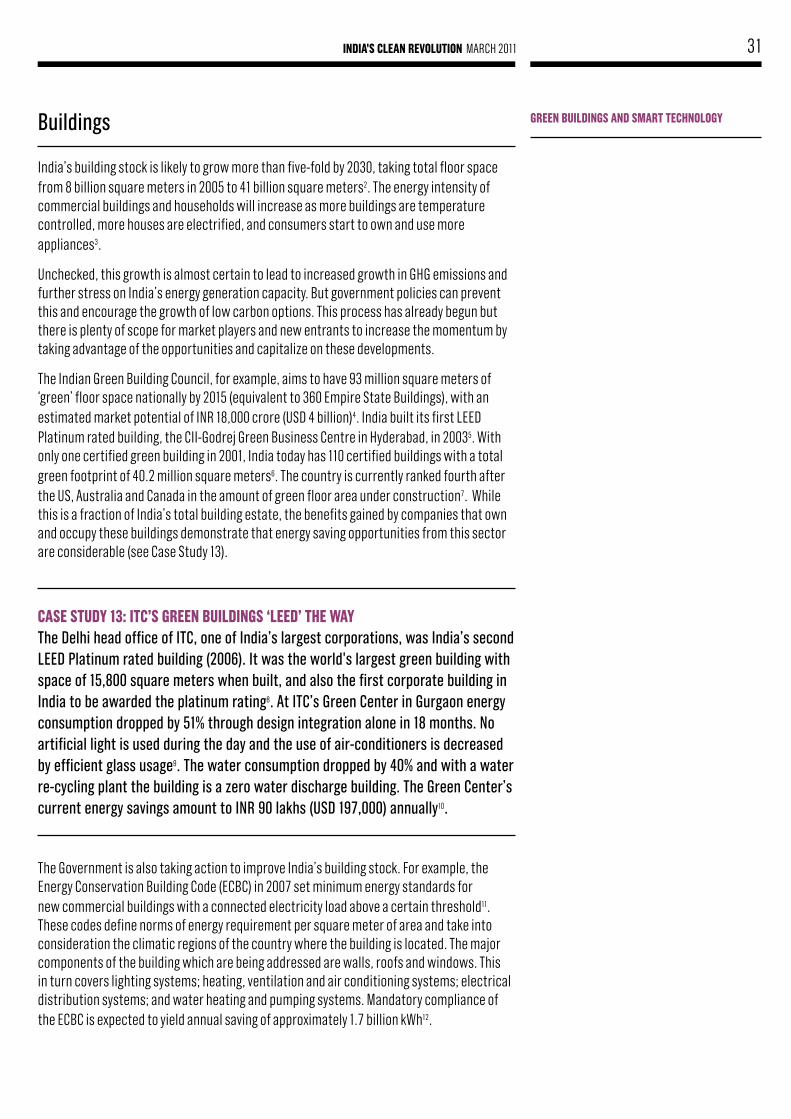
31IndIa's Clean RevolutIon MARCH 2011
buildings
India’s building stock is likely to grow more than five-fold by 2030, taking total floor space from 8 billion square meters in 2005 to 41 billion square meters2. The energy intensity of commercial buildings and households will increase as more buildings are temperature controlled, more houses are electrified, and consumers start to own and use more appliances3.
Unchecked, this growth is almost certain to lead to increased growth in GHG emissions and further stress on India’s energy generation capacity. But government policies can prevent this and encourage the growth of low carbon options. This process has already begun but there is plenty of scope for market players and new entrants to increase the momentum by taking advantage of the opportunities and capitalize on these developments.
The Indian Green Building Council, for example, aims to have 93 million square meters of ‘green’ floor space nationally by 2015 (equivalent to 360 Empire State Buildings), with an estimated market potential of INR 18,000 crore (USD 4 billion)4. India built its first LEED Platinum rated building, the CII-Godrej Green Business Centre in Hyderabad, in 20035. With only one certified green building in 2001, India today has 110 certified buildings with a total green footprint of 40.2 million square meters6. The country is currently ranked fourth after the US, Australia and Canada in the amount of green floor area under construction7. While this is a fraction of India’s total building estate, the benefits gained by companies that own and occupy these buildings demonstrate that energy saving opportunities from this sector are considerable (see Case Study 13).
Case study 13: ItC’s gReen buIldIngs ‘leed’ the Way the delhi head office of itC, one of india’s largest corporations, was india’s second leed platinum rated building (2006). it was the world's largest green building with space of 15,800 square meters when built, and also the first corporate building in india to be awarded the platinum rating8. at itC’s green Center in gurgaon energy consumption dropped by 51% through design integration alone in 18 months. no artificial light is used during the day and the use of air-conditioners is decreased by efficient glass usage9. the water consumption dropped by 40% and with a water re-cycling plant the building is a zero water discharge building. the green Center’s current energy savings amount to inr 90 lakhs (uSd 197,000) annually10.
The Government is also taking action to improve India’s building stock. For example, the Energy Conservation Building Code (ECBC) in 2007 set minimum energy standards for new commercial buildings with a connected electricity load above a certain threshold11. These codes define norms of energy requirement per square meter of area and take into consideration the climatic regions of the country where the building is located. The major components of the building which are being addressed are walls, roofs and windows. This in turn covers lighting systems; heating, ventilation and air conditioning systems; electrical distribution systems; and water heating and pumping systems. Mandatory compliance of the ECBC is expected to yield annual saving of approximately 1.7 billion kWh12.
gReen buIldIngs and sMaRt teChnology
32 IndIa's Clean RevolutIon MARCH 2011
There is a huge scope for energy savings in existing buildings. Energy audit studies conducted in several office buildings, hotels and hospitals indicate energy saving potential of 23% to 46% in end uses like lighting, heating, ventilation and air conditioning systems13. However, there is a critical lack of organizations that can provide energy efficiency technologies and services on a large scale14.
appliances
Appliances and electronics account for about 40% of electricity consumed in households and around 25% in commercial buildings15. Using the most efficient appliances and electronics available today could further reduce emissions compared with BAU by about 95 MtCO
2e by 203016.
Government policies are helping to accelerate the shift to more efficient consumer goods. India’s Bureau of Energy Efficiency (BEE) operates a Standards and Labelling Scheme (S&L). This is designed to provide the impetus for Indian industry to compete on overseas markets that have mandatory standards. The scheme aims to stimulate market transformation in favor of energy efficient appliances and to reduce overall energy consumption by 3 GW by 201217. Only four products have mandatory S&L requirements as yet. This means that there is still space in a large range of products for leadership to emerge, be it in terms of product manufacturing, innovation, policy involvement or affecting demand-side market behavior. Labelling is due to be expanded to cover other products and appliances including compact fluorescent lamps (CFLs), passenger cars, heavy commercial vehicles, office equipment, washing machines, consumer electronics, microwaves, battery chargers, industrial fans and blowers, and compressors.
led lighting
Replacing incandescent lamps and CFLs with light-emitting diode (LED) lighting could reduce emissions by about 30 MtCO
2e by 203018. India’s lighting market is dominated
by incandescent bulbs due to their low costs but CFLs have penetrated the market considerably over time. With appropriate incentives from the Government, it is anticipated that current programs to reduce the cost of CFLs will lead to a 90% penetration in the residential sector19. LED technology can provide lighting six times more efficiently than incandescent bulbs and they are 25% more efficient than CFLs20. Globally, LEDs have a market potential of over INR 593,000 crore (USD 130 billion)21. The standardization of this technology is currently being mapped out by BEE through a group called ‘Model Technical Specifications for LED application in Street Light’22.
LEDs are among the technologies that will drive a low carbon economy and a transformation of the market is slowly growing that will propel this. The Climate Group is working with the Kolkata Municipal Corporation (KMC) in a LED street-lighting program. The trial will see LED streetlights installed in several arterial roads across Kolkata with 270 fixtures being tested in total. The project is being carried out by the Kolkata Municipal Corporation in joint collaboration with BEE, the West Bengal State Electricity Distribution Company Ltd (WBSEDCL) and the West Bengal Pollution Control Board (WBPCB), with overall facilitation by The Climate Group. Similar pilot schemes are being implemented in different municipalities and states, such as Maharashtra and Tamil Nadu23 amongst others.
gReen buIldIngs and sMaRt teChnology
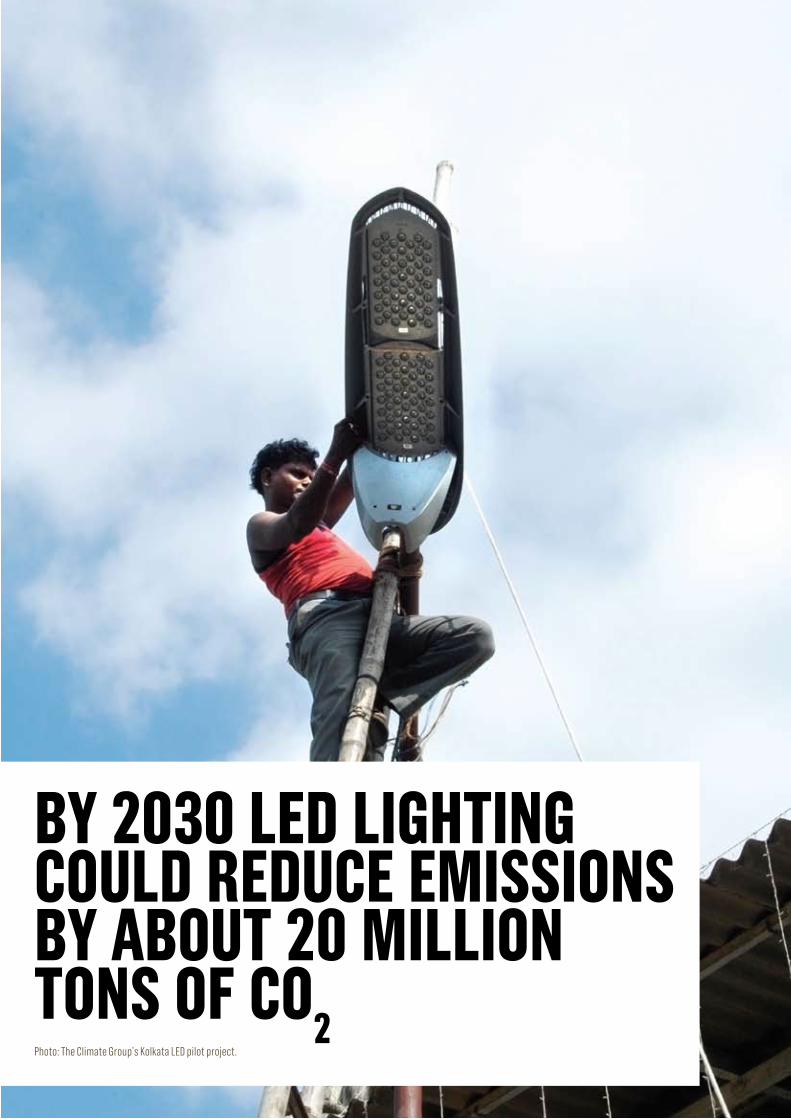
by 2030 led lIghtIng Could ReduCe eMIssIons by about 20 MIllIon tons of Co
2
Photo: The Climate Group’s Kolkata LED pilot project.
34 IndIa's Clean RevolutIon MARCH 2011
information and Communications technology (iCt)
The information and communications technology (ICT) sector has an impact that goes well beyond its own energy consumption. Globally, the direct footprint from ICT is approximately 2% but by catering solutions for the remaining 98%, ICTs could deliver approximately 7.8 gigatons of CO
2 equivalent (GtCO
2e) of global emissions savings in 202024. This represents 15%
of GHG emissions in 2020 based on BAU estimation.
As energy demand grows, energy efficiency ICT solutions will help other industries to reduce their consumption of energy through smart grids, as well as building and transport applications. Smart ICTs can be applied to automated lighting and cooling in offices, energy efficiency-rated equipment, and the development of new products and services that use less material and energy and eliminate waste. By targeting high emissions sectors of the economy it is estimated that ‘smart’ ICTs could enable energy efficiency cost savings of approximately INR 4.3 million crore (USD 946.5 billion) globally by 202025.
India is well placed to take advantage of such an ICT-enabled Clean Revolution. The sector in India is expected to employ over 8.7 million people directly by 2012, with indirect employment being three times greater26. GDP generated in the ICT sector has increased from INR 65,600 crore (USD 14.3 billion) in 2000-2001 to INR 253,000 crore (USD 55.5 billion) in 2007-2008, which amounts to a compound annual growth rate of 21.3%27. Services dominate the ICT industry in India where the share of ICT services to total GDP has increased from 3.1% in 2000-2001 to 5.5% in 2000-200828. Because India is a leading provider of software services in the world, the country could capitalize on its large skilled workforce and knowledge to capture the enormous low carbon opportunities that are available.
Unsurprisingly, global ICT companies are increasingly looking for solutions and innovations to exploit opportunities for a low carbon economy. Two products developed by Cisco showcase the type of opportunities open to innovative Indian ICT companies. ‘TelePresence’, a state-of-the-art innovation for video-conferencing, helps reduce business travel (and hence budgets) and also lower GHG emissions. ‘EnergyWise’ enables companies to measure the power consumed by their network equipment and buildings, manage power use according to the type, label or location of a device, and create policies to reduce their energy consumption29.
gReen buIldIngs and sMaRt teChnology
By 2020, ‘Smart’ ICTs could enable energy efficiency cost savings of approximately USD 946.5 billion globally.
35IndIa's Clean RevolutIon MARCH 2011
gReen buIldIngs and sMaRt teChnology
Case study 14: IndIan ICt CoMpanIes go gReen indian iCt companies are engaging with their stakeholders and vendors by greening their supply chains and procurement policies. tata Consultancy Services’ (tCS) procurement policies, for example, are designed to green its supply chain30. iCt companies in india, such as wipro, tCS and infosys, are pioneering examples of efficient energy and the sparing of resources31. wipro’s employees used 18.6% less power between 2000 and 2008. the company won the Confederation of indian industry’s (Cii) award for excellence in energy Management three years in a row from 2006 to 200832.
The role of governments and other industries is equally important in financing, and in the implementation, promotion, execution and adoption of these solutions. Moderate ICT incorporation in the industry and building sectors in India in 2020 and 2030 offer an investment potential of INR 136,700 crore (USD 29.9 billion) and INR 418,600 crore (USD 92 billion) respectively33. These investments will correspond to cost savings of INR 33,600 crore (USD 7.4 billion) and INR 135,600 crore (USD 29.7 billion) per annum, respectively34. India’s rural economy should not be forgotten either. Almost 60% of India’s population is dependent on agriculture and agri-businesses for their livelihoods. ICTs can be used to support community responses and climate adaptation35 by finding ‘smart’ technology solutions to help strengthen local communities’ capacities to respond and adapt to climate change36.
36 IndIa's Clean RevolutIon MARCH 2011
5. fInanCIng IndIa’s Clean RevolutIon • According to HSBC, the global market for low carbon goods and services could be worth
some INR 10 million crore (USD 2.2 trillion) by 2020, with India’s share rising to INR 616,300 crore (USD 135 billion)1.
• India’s Clean Revolution will attract billions of dollars of fresh investment, offering opportunities for the country’s public and private financial institutions to create new products and services.
• INR 274,000 crore (USD 60 billion) will need to be invested to meet India’s renewable energy targets with banks acting as conduits for both domestic and international investors.
• Unique models of funding have emerged; private-equity funds have already invested more than INR 1,370 crore (USD 300 million) in dedicated renewable-energy-based, platform companies. The challenge now is to scale them up, with public-private partnerships likely to be center-stage.
• Financing of ESCOs to advance energy efficiency and conservation has faced difficulties with scalability but increasing awareness and regulatory impetus is expected to make the financing of energy efficiency a significant business opportunity.
Success in achieving a Clean Revolution will depend on the availability of adequate financing to mobilize investment in renewable technologies and energy efficiency. This challenge – running into the millions of crore (trillions of dollars) – presents a huge opportunity for banks, insurers, asset managers and other investors in what is already a rapidly growing market. HSBC, for example, estimates that the global market for low carbon goods and services could be worth some INR 10 million crore (USD 2.2 trillion) by 20202.
Unique models for funding renewable energy and energy efficiency are emerging in pursuit of the opportunities, but considerable development of these will be needed for India to be able to fund and capitalize on all the potential which the Clean Revolution has in store. With its relatively mature financial markets, entrepreneurial spirit and access to both domestic and global markets, India is particularly well positioned to take advantage of this growth. In this chapter we see the potential opportunity which a clean industrial revolution offers to the Indian financial-services industry and how some pioneers are already leading the way.
renewable energy
As we saw in Chapter 1, India has emerged as one of the early adopters of renewable energy amongst developing countries with around 17 GW of installed capacity and an additional capacity of approximately 40-55 GW expected by the end of the 13th Five Year Plan (ending in 2022)3. This entails an investment of over INR 274,000 crore (USD 60 billion) over the coming decade. Assuming a typical 70:30 debt-equity ratio, this would translate into a requirement of INR 191,730 crore (USD 42 billion) in debt and INR 82,000 crore (USD 18 billion) in equity over the next decade. Public markets, corporate and private equity investors are likely to account for a significant amount of the equity which is expected in this sector.
The Government has introduced incentive structures to support the development of its low carbon industry, including Renewable Portfolio Standard norms and lucrative feed-in tariffs. These incentives, coupled with de-regulation of the electricity sector after the Electricity Act of 2003, the robustness of the Indian economy, the favorable macro-economic conditions and the lucrative returns possible have created considerable potential for the
India has emerged as one of the early adopters of renewable energy amongst developing countries with around 17 GW of installed capacity and an additional capacity of approximately 40-55 GW expected by the end of the 13th Five Year Plan (ending in 2022).
37IndIa's Clean RevolutIon MARCH 2011
private sector to become involved. Several large international corporates such as China Light and Power (CLP), Acciona and AES and private equity investors such as TPG, Barings, Olympus and GEF have already invested significant amounts in Indian renewable energy4.
Notwithstanding the enormous promise, there still remain considerable barriers to investment in renewable energy, not found in traditional project financing, including:
• Capital intensive nature of business – upfront capital expenditure is considerable and there are concerns for project developers and financiers alike surrounding the viability of projects under development in the face of rapid technological innovation;
• Long project development lead times – while most clean energy projects are modular, there is a long lead-in time to develop larger-scale projects. For instance, the land intensity of wind and solar power often leads to delays in acquisitions. Moreover, the necessary conditions for output (in terms of solar incidence, wind speed and even hydrology) frequently lead to delays also around the building of adequate transmission mechanisms;
• Lack of familiarity of traditional financing institutions with renewable energy technologies – most lenders find it difficult to keep pace with the technological developments of various clean energy technologies and are apprehensive of most clean energy developers in the absence of established track records.
Given these barriers there is a need for innovative financial structures to fund projects in this sector. Models are emerging but only slowly; some of the most promising of these are described below.
platform Companies
More than INR 1,370 crore (USD 300 million) has been invested by private equity funds in dedicated, renewable energy-based 'platform companies' – a new emerging model for low carbon financing. These are typically companies which develop and own a portfolio of renewable energy projects across various technologies and geographies and have a mix of assets at various stages of development. With strong operational teams to manage them, they can offer investors opportunities which match their return, risk and exit criteria.
This model is helpful in mitigating policy and technology risks as well as in providing substantial scale. Higher returns at enterprise level versus that of individual projects derive from the advantages of having a pipeline of projects and an enterprise premium. This model offers exit opportunities through a sale of the portfolio or through public listing. For example, on listing Orient Green Power Ltd provided a multi-fold return on initial investment. Figure 5 highlights the advantages to investors.
Examples of platform companies operating in India through private-equity investment show a varying mix of investment across renewable energy technologies (Figure 6).
fInanCIng IndIa's Clean RevolutIon
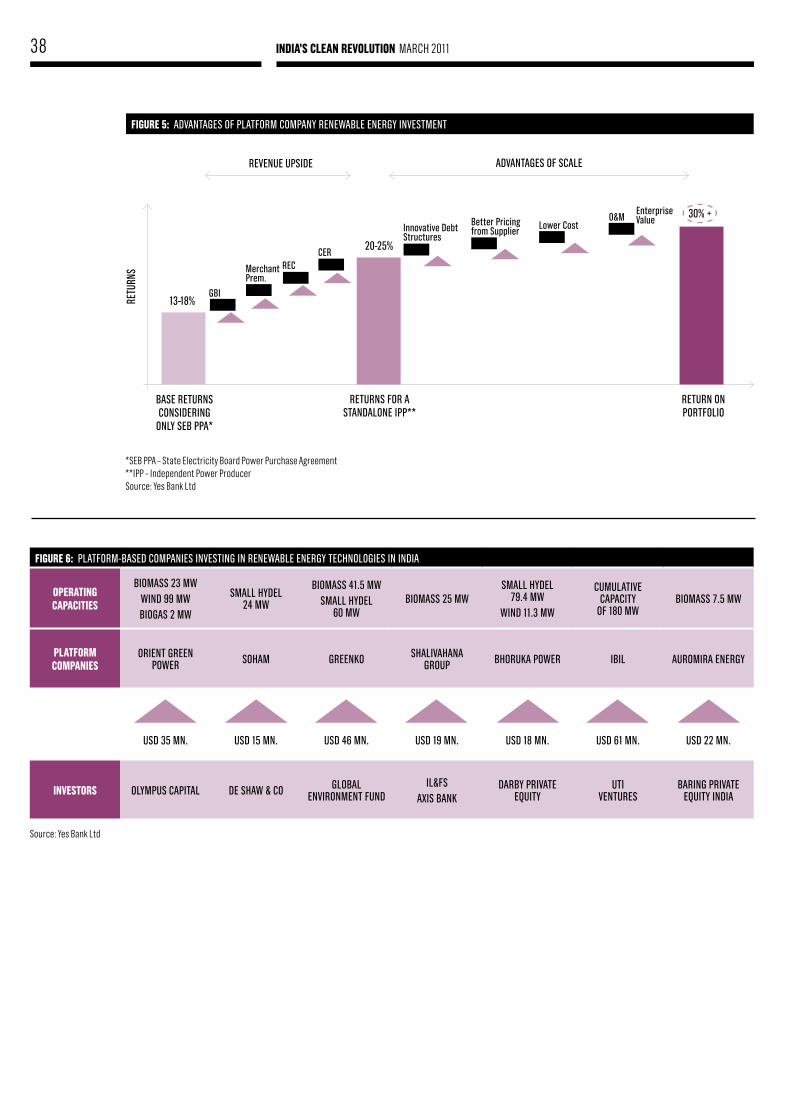
38 IndIa's Clean RevolutIon MARCH 2011
fIguRe 5: advantageS of platforM CoMpany renewable energy inveStMentre
turn
S
baSe returnS ConSidering
only Seb ppa*
13-18%gbi
Merchant prem.
reCCer
innovative debt Structures
better pricing from Supplier lower Cost
o&Menterprise value
20-25%
30% +
revenue upSide advantageS of SCale
returnS for a Standalone ipp**
return on portfolio
*SEB PPA – State Electricity Board Power Purchase Agreement**IPP – Independent Power Producer Source: Yes Bank Ltd
fIguRe 6: platforM-baSed CoMpanieS inveSting in renewable energy teCHnologieS in india
opeRatIng CapaCItIes
bioMaSS 23 Mwwind 99 MwbiogaS 2 Mw
SMall Hydel 24 Mw
bioMaSS 41.5 MwSMall Hydel
60 MwbioMaSS 25 Mw
SMall Hydel 79.4 Mw
wind 11.3 Mw
CuMulative CapaCity
of 180 MwbioMaSS 7.5 Mw
platfoRM CoMpanIes
orient green power SoHaM greenKo SHalivaHana
group bHoruKa power ibil auroMira energy
uSd 35 Mn. uSd 15 Mn. uSd 46 Mn. uSd 19 Mn. uSd 18 Mn. uSd 61 Mn. uSd 22 Mn.
InvestoRs olyMpuS Capital de SHaw & Co global environMent fund
il&fSaxiS banK
darby private equity
uti ventureS
baring private equity india
Source: Yes Bank Ltd

39IndIa's Clean RevolutIon MARCH 2011
develop-to-Sell
A typical greenfield renewable energy project in India could take anywhere between two and five years in development, depending on the renewable energy source. Most of the capital involved is only required during the last leg of construction, especially in the case of biomass and wind where more than 80% of the project cost is the turbine cost. In addition, a substantial amount of local and technical knowledge is required to develop the project to make it construction ready, for land acquisition and regulatory approvals.
As a result, a 'Develop-to-sell' model has emerged in which developers without significant capital but with the necessary expertise take projects to the point where they are construction-ready. At that stage, the developer sells the project to utilities who undertake the capital expenditure and financial closure. The risk to these developers is much higher than to project owners but they enjoy significantly higher returns. Typically, these developers are local companies who have strong technical and local capabilities.
The majority of wind power capacity in India is added using this approach5 and where the developer role is usually filled by equipment suppliers, such as the large Indian wind-turbine manufacturers, Suzlon and Enercon India. These companies typically undertake end-to-end project development, at times liaising with local players in getting Government approvals, acquiring land, undertaking the transmission and distribution infrastructure, the basic construction and completing the energy performance contract (EPC) for the project. The model is also increasingly being explored by various EPC players and developers in the case of solar PV.
Mid-sized venture capital funds can then fund developers at holding company level, enabling them to reduce the risks associated with the funding of individual projects. Since exit via public listing is typically difficult in this model, it is usually linked to the sale of successful projects.
Clean power Merchanting
With the Electricity Act of 2003, 'power merchanting' has emerged as a thriving industry with a strong secondary market and large public and private power-traders. They typically take late-stage equity and debt stakes in power projects that are under construction, with exit linked to buyback of equity once project revenues flow in from electricity sales.
While this route has traditionally been seen more commonly in the case of coal-based power plants, examples of these structures, which are also suitable for renewable energy, are beginning to be seen. With the easing of government rules with regard to the 'merchanting' of wind power, this model should substantially gain importance in the coming years.
One example involves Power Trading Corporation, India’s largest power trading corporation, which has set-up a Special Purpose Vehicle, PTC India Financial Services Ltd (PFS), in partnership with Goldman Sachs and the Macquarie Group. PFS invests equity and debt in several conventional and renewable power projects – including wind and biomass - and has issued gross equity and debt totalling approximately INR 643 crore (USD 143.9 million) and INR 168 crore (USD 36.8 million) respectively6.
fInanCIng IndIa's Clean RevolutIon

In the neXt deCade, IndIa’s shaRe of the global loW CaRbon MaRket Could balloon to usd 135 bIllIon
7
Photo: People walking on a busy street in New Delhi, India.

41IndIa's Clean RevolutIon MARCH 2011
energy efficiency
There is a tremendous potential for energy efficiency in India. In May 2008 the Ministry of Power estimated an energy conservation potential of 20 GW9. In terms of electricity units, the Asian Development Bank (ADB) and Indian Bureau of Energy Efficiency (BEE) estimated that around 183.5 billion kWh can be saved annually10. According to the National Mission for Enhanced Energy Efficiency, market-based approaches to unlock energy efficiency opportunities are estimated to be about INR 74,000 crore (USD 16.2 billion)11. It is calculated that by 2014-15 these will lead to annual fuel savings in excess of 23 Mtoe (million tons oil equivalent), an additional 19 GW of cumulative electricity capacity, and will mitigate 98 MtCO
2 emissions per annum12.
Given the cost-sensitive nature of Indian industries, however, it is a challenge for developers to bear and pass on the high upfront cost of energy efficiency to end users. The financing of energy efficiency, therefore continues to be a challenge that hampers growth of the sector. For example only 877 MW was saved in the 10th Five Year Plan (2002- 2007)13. New funding mechanisms will be needed to achieve the 10 GW of energy savings targeted in the 11th Five Year Plan.
The Government, under the National Action Plan on Climate Change, has taken steps to facilitate an enabling environment for growth in energy efficiency, which is expected to have a significant impact in years to come. As the Government’s Perform, Achieve, Trade (PAT) scheme takes off, the PAT market will generate cash flows which will attract lenders that are prepared to take greater exposure, and newer models will evolve based on ESCO-type structures.
eSCos
ESCOs (‘Energy Service Companies’) are businesses that provide energy efficient equipment or services, bear the upfront equipment and installation costs and then take a share in the incremental cost-savings achieved by the end user. They are becoming increasingly common in India and are emerging as an effective way to finance energy efficiency projects.
This model has been particularly effective in the case of municipal street lighting where several municipalities across India have issued tenders to private ESCOs for energy efficient solar lighting14. In these cases, the revenues of the ESCOs depend on the savings in electricity bills of municipalities. This model is also emerging in other demand-side, energy efficiency projects involving buildings, industries, and Special Economic Zones.
Unfortunately, banks are unfamiliar with energy efficiency projects, do not understand the credit profile of end users and find the ticket-size of individual projects too small with the result that ESCOs still find it difficult to raise finance. Government guarantees – such as those set up by the BEE - should go a long way in making banks and other financial institutions more comfortable with the business model and return expectations of energy efficiency projects and so lead to increased growth in coming years.
It has been estimated that India has an energy conservation potential of 20 GW66. According to the National Mission for Enhanced Energy Efficiency, market-based approaches to unlock energy efficiency opportunities are estimated to be about USD 16.2 billion8.
fInanCIng IndIa's Clean RevolutIon
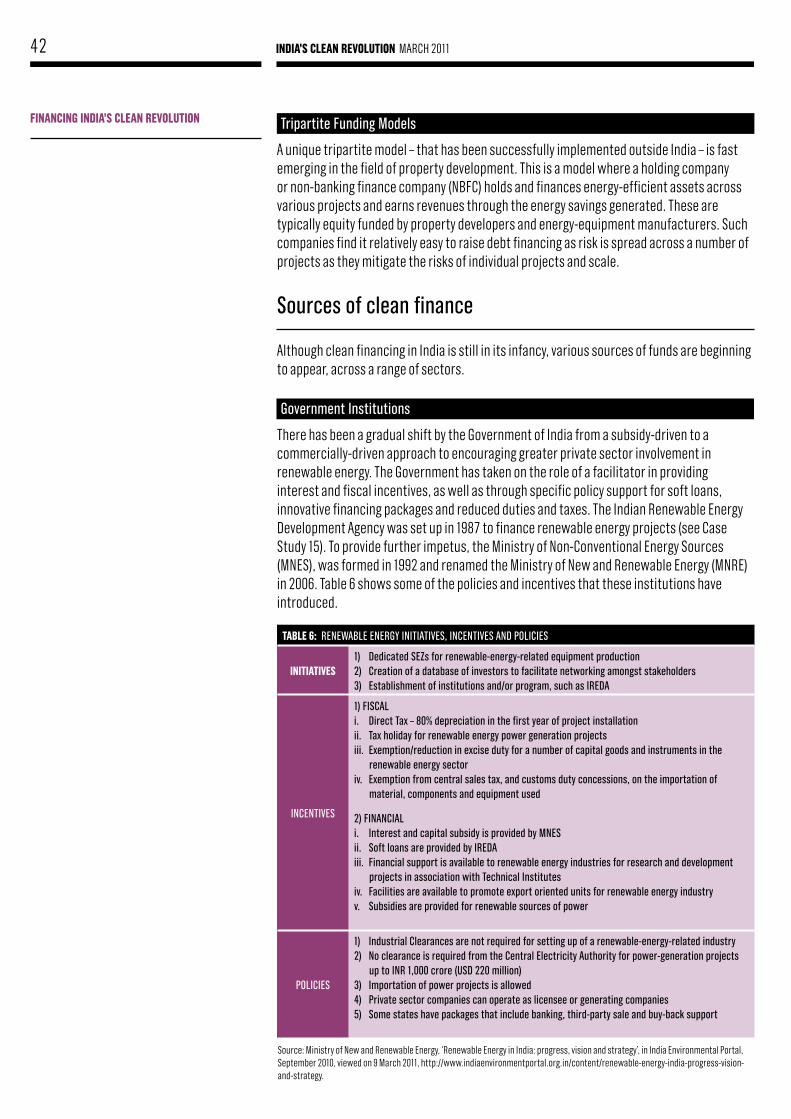
42 IndIa's Clean RevolutIon MARCH 2011
tripartite funding Models
A unique tripartite model – that has been successfully implemented outside India – is fast emerging in the field of property development. This is a model where a holding company or non-banking finance company (NBFC) holds and finances energy-efficient assets across various projects and earns revenues through the energy savings generated. These are typically equity funded by property developers and energy-equipment manufacturers. Such companies find it relatively easy to raise debt financing as risk is spread across a number of projects as they mitigate the risks of individual projects and scale.
Sources of clean finance
Although clean financing in India is still in its infancy, various sources of funds are beginning to appear, across a range of sectors.
government institutions
There has been a gradual shift by the Government of India from a subsidy-driven to a commercially-driven approach to encouraging greater private sector involvement in renewable energy. The Government has taken on the role of a facilitator in providing interest and fiscal incentives, as well as through specific policy support for soft loans, innovative financing packages and reduced duties and taxes. The Indian Renewable Energy Development Agency was set up in 1987 to finance renewable energy projects (see Case Study 15). To provide further impetus, the Ministry of Non-Conventional Energy Sources (MNES), was formed in 1992 and renamed the Ministry of New and Renewable Energy (MNRE) in 2006. Table 6 shows some of the policies and incentives that these institutions have introduced.
table 6: renewable energy initiativeS, inCentiveS and poliCieS
InItIatIves1) dedicated Sezs for renewable-energy-related equipment production 2) Creation of a database of investors to facilitate networking amongst stakeholders3) establishment of institutions and/or program, such as ireda
inCentiveS
1) fiSCali. direct tax – 80% depreciation in the first year of project installationii. tax holiday for renewable energy power generation projectsiii. exemption/reduction in excise duty for a number of capital goods and instruments in the
renewable energy sectoriv. exemption from central sales tax, and customs duty concessions, on the importation of
material, components and equipment used
2) finanCiali. interest and capital subsidy is provided by MneSii. Soft loans are provided by ireda iii. financial support is available to renewable energy industries for research and development
projects in association with technical institutesiv. facilities are available to promote export oriented units for renewable energy industryv. Subsidies are provided for renewable sources of power
poliCieS
1) industrial Clearances are not required for setting up of a renewable-energy-related industry2) no clearance is required from the Central electricity authority for power-generation projects
up to inr 1,000 crore (uSd 220 million)3) importation of power projects is allowed4) private sector companies can operate as licensee or generating companies5) Some states have packages that include banking, third-party sale and buy-back support
Source: Ministry of New and Renewable Energy, ‘Renewable Energy in India: progress, vision and strategy’, in India Environmental Portal, September 2010, viewed on 9 March 2011, http://www.indiaenvironmentportal.org.in/content/renewable-energy-india-progress-vision-and-strategy.
fInanCIng IndIa's Clean RevolutIon
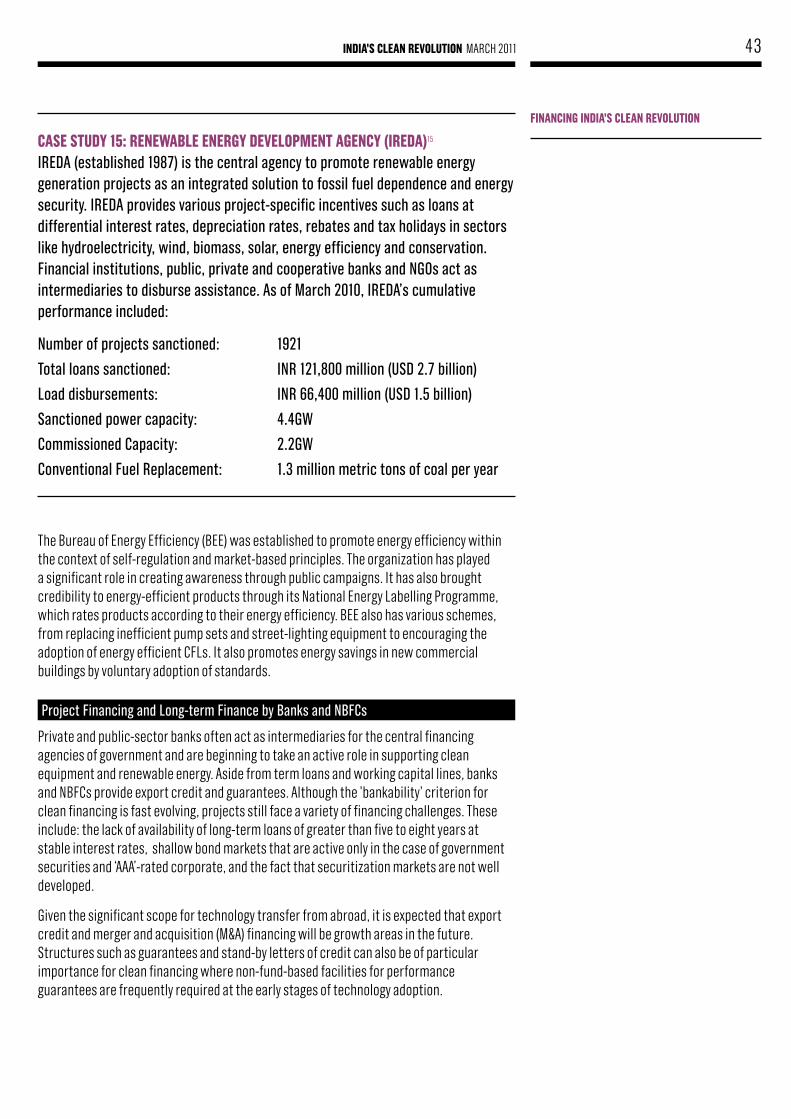
43IndIa's Clean RevolutIon MARCH 2011
Case study 15: ReneWable eneRgy developMent agenCy (IReda)15 ireda (established 1987) is the central agency to promote renewable energy generation projects as an integrated solution to fossil fuel dependence and energy security. ireda provides various project-specific incentives such as loans at differential interest rates, depreciation rates, rebates and tax holidays in sectors like hydroelectricity, wind, biomass, solar, energy efficiency and conservation. financial institutions, public, private and cooperative banks and ngos act as intermediaries to disburse assistance. as of March 2010, ireda’s cumulative performance included:
number of projects sanctioned: 1921
total loans sanctioned: inr 121,800 million (uSd 2.7 billion)
load disbursements: inr 66,400 million (uSd 1.5 billion)
Sanctioned power capacity: 4.4gw
Commissioned Capacity: 2.2gw
Conventional fuel replacement: 1.3 million metric tons of coal per year
The Bureau of Energy Efficiency (BEE) was established to promote energy efficiency within the context of self-regulation and market-based principles. The organization has played a significant role in creating awareness through public campaigns. It has also brought credibility to energy-efficient products through its National Energy Labelling Programme, which rates products according to their energy efficiency. BEE also has various schemes, from replacing inefficient pump sets and street-lighting equipment to encouraging the adoption of energy efficient CFLs. It also promotes energy savings in new commercial buildings by voluntary adoption of standards.
project financing and long-term finance by banks and nbfCs
Private and public-sector banks often act as intermediaries for the central financing agencies of government and are beginning to take an active role in supporting clean equipment and renewable energy. Aside from term loans and working capital lines, banks and NBFCs provide export credit and guarantees. Although the 'bankability' criterion for clean financing is fast evolving, projects still face a variety of financing challenges. These include: the lack of availability of long-term loans of greater than five to eight years at stable interest rates, shallow bond markets that are active only in the case of government securities and ‘AAA’-rated corporate, and the fact that securitization markets are not well developed.
Given the significant scope for technology transfer from abroad, it is expected that export credit and merger and acquisition (M&A) financing will be growth areas in the future. Structures such as guarantees and stand-by letters of credit can also be of particular importance for clean financing where non-fund-based facilities for performance guarantees are frequently required at the early stages of technology adoption.
fInanCIng IndIa's Clean RevolutIon
44 IndIa's Clean RevolutIon MARCH 2011
Corporates
M&A activity in India has picked up significantly, particularly in clean enterprises and technologies. Some of the larger power utilities look at acquiring assets that can fulfill their regulatory requirements. Some industrial houses meanwhile recognize that being seen as a responsible player with regard to the environment helps with brand recognition and positioning. Given the Government’s more stringent environmental emphasis, however, this has also become an imperative. Moreover, with acute power shortages and significantly more expensive power provision, corporates see the business sense of clean projects, both for renewable energy in captive power plants and energy efficiency in industrial processes. Thus the trend in sustainability is moving slowly but surely from the fringes of Corporate Social Responsibility to mainstream commercial activity financed both on and off-balance sheet. As strategic investors, corporates acquire licensed technology from innovating institutions or use their balance sheet to acquire these enterprises and/or technologies outright.
equity funds and Capital Markets
Private-equity investments of nearly INR 228,250 crore (USD 50 billion) were made in more than 1,400 Indian businesses over the period 2004-2009. Most private-equity funding, however, continues to go to more mature businesses that are capable of absorbing larger ticket sizes. As a result of the global economic slowdown, venture capital investments in clean technology in India in 2009 were down to approximately INR 867 crore (USD 190 million). This was 13% below the level of investment in 200816, although a quick rebound was expected. Of this, energy generation (biofuels) accounted for 55% of the deal value17. Clean technology investments are gaining traction with dedicated clean technology funds raising considerable capital for deployment. Other than private-equity funds, carbon funds have also funded interesting clean technology projects and exited through the sale of CERs. With Indian infrastructure growing strongly, renewable energy generation companies have continued to find considerable favor with public markets. But financing is needed for ventures at earlier stages of development, along with markets and exchanges where energy certificates can be traded.
Microfinance institutions (Mfis) – distributed Clean energy products
With rapid technological advances in rural distributed generation and energy consumables that may typically have higher upfront costs and minimal operating costs (as in the case of many solar-based products), MFIs clearly have a significant role to play in financing low-income households to acquire clean energy products.
the Clean development Mechanism
With the success of the Clean Development Mechanism (CDM), there is a considerable interest in structuring markets and exchanges that can facilitate the trade and monetization of securities that represent an underlying environmentally desirable impact. While the PAT scheme is still being developed and incentives for renewable energy only recently being implemented, the CDM has proved to be an effective way for Indian companies to finance low carbon projects.
fInanCIng IndIa's Clean RevolutIon
Clean technology investments are gaining traction with dedicated clean technology funds raising considerable capital for deployment. From 2004 – 2009, private-equity investments of about USD 50 billion were made in more than 1,400 Indian businesses. Most private-equity funding, however, continues to go to more mature businesses.
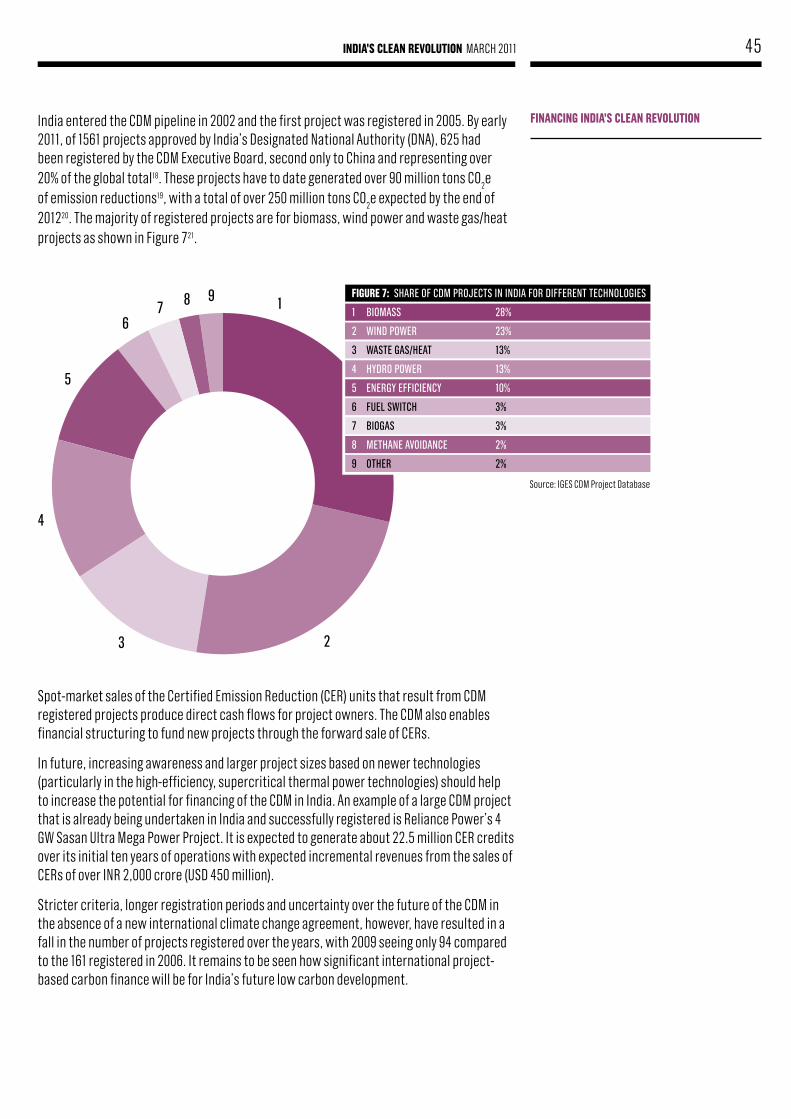
45IndIa's Clean RevolutIon MARCH 2011
India entered the CDM pipeline in 2002 and the first project was registered in 2005. By early 2011, of 1561 projects approved by India’s Designated National Authority (DNA), 625 had been registered by the CDM Executive Board, second only to China and representing over 20% of the global total18. These projects have to date generated over 90 million tons CO
2e
of emission reductions19, with a total of over 250 million tons CO2e expected by the end of
201220. The majority of registered projects are for biomass, wind power and waste gas/heat projects as shown in Figure 721.
Spot-market sales of the Certified Emission Reduction (CER) units that result from CDM registered projects produce direct cash flows for project owners. The CDM also enables financial structuring to fund new projects through the forward sale of CERs.
In future, increasing awareness and larger project sizes based on newer technologies (particularly in the high-efficiency, supercritical thermal power technologies) should help to increase the potential for financing of the CDM in India. An example of a large CDM project that is already being undertaken in India and successfully registered is Reliance Power’s 4 GW Sasan Ultra Mega Power Project. It is expected to generate about 22.5 million CER credits over its initial ten years of operations with expected incremental revenues from the sales of CERs of over INR 2,000 crore (USD 450 million).
Stricter criteria, longer registration periods and uncertainty over the future of the CDM in the absence of a new international climate change agreement, however, have resulted in a fall in the number of projects registered over the years, with 2009 seeing only 94 compared to the 161 registered in 2006. It remains to be seen how significant international project-based carbon finance will be for India’s future low carbon development.
1
23
4
5
67 8 9 fIguRe 7: SHare of CdM proJeCtS in india for different teCHnologieS
1 bioMaSS 28%
2 wind power 23%
3 waSte gaS/Heat 13%
4 Hydro power 13%
5 energy effiCienCy 10%
6 fuel SwitCH 3%
7 biogaS 3%
8 MetHane avoidanCe 2%
9 otHer 2%
Source: IGES CDM Project Database
fInanCIng IndIa's Clean RevolutIon
46 IndIa's Clean RevolutIon MARCH 2011
6. ConClusIonThe preceding chapters of this report have shown government and businesses leaders in India are moving increasingly quickly towards a Clean Revolution in their country. This is a revolution that will help achieve India’s energy, economic, environmental and developmental objectives in a way that is sustainable. This is not easy given the enormous size of India’s population and the scale at which its economy is currently developing. But by focusing on energy efficiency and renewable energy India’s climate leaders are demonstrating that economic, social and environmental objectives are not mutually exclusive.
India’s size, stage of economic development and entrepreneurial business community mean that it is well placed to leapfrog along the high growth, low carbon development pathway. The reward for success includes energy savings for businesses and households, improved international competitiveness, increased energy security, improved local air quality and the possibility to provide off-grid electricity to its vast, unconnected rural population. With its eye on a Clean Revolution, the government of India hopes to reap these benefits, as follows:
• Ample renewable energy sources are available and can contribute to the long-term energy security of the country – the country has a long-term renewable energy policy in place which will ensure significant opportunities for the technology, business and financing sectors of the country.
• The developmental need of supplying power to remote areas overlaps with low-carbon power generation, for example through off-grid renewable energy.
• By promoting energy efficiency, India will be able to maximize the availability of electricity and simultaneously reduce its carbon intensity.
• The government’s policy includes the goal of shifting away from importing technology and know-how towards local production, further benefiting the economy. India’s world class ICT sector is particularly well placed to support energy efficiency in other sectors through the application of ‘smart’ technologies.
Meeting India’s target of adding approximately 40-55 GW of renewable energy capacity, as set out in its 13th Five Year Plan, will result in a financing opportunity worth USD 60 billion over the next decade. In addition, there is the potential for market-based approaches to unlock energy efficiency opportunities amounting to around USD 16.5 billion.
This indicates the enormous advantages in being part of India’s clean revolution – whether on the financing side, in the development of renewable technologies, in the provision of energy efficient measures or in the development of clean applications in transport, buildings, appliances, lighting and the ICT sector.

47IndIa's Clean RevolutIon MARCH 2011
What are needed now are not so much new technology options, but rather good business models with functioning marketing and distribution channels, service and maintenance networks as well as financing options. There remains a lack of awareness in India with regard to various clean technologies and there is a perceived risk in the regulatory environment, ranging from the continued provision of subsidies and incentives to the value of CDM in the post-2012 environment. Other challenges are the typically smaller project sizes in energy-efficiency projects and the longer payback periods for renewable-energy projects. Finally, constant technological evolution carries accompanying risks of obsolescence. All these challenges are frequently cited as barriers to low carbon financing.
But considerable progress has already been made thanks to government policies and favorable subsidy and fiscal incentives. Significant steps are being taken by government and the private sector. India is well-placed by virtue of the stage of its development to reap the rewards of its high growth, low carbon goals. It increasingly has the infrastructure and resources, as well as the technological, financial and human capacity that are needed to ensure success. Technological advances have resulted in competitive production costs, innovative financing mechanisms are emerging, and numerous examples of best practice exist as this report has demonstrated.
With advances at all levels, particularly in resolving financing needs, the country’s Clean Revolution is set to take off in a way that will benefit the global community, both through mitigating emissions and through developing clean solutions that are useful everywhere.
ConClusIon
48 IndIa's Clean RevolutIon MARCH 2011
foReWoRds
1 N Robins, C Singh, R Clover, Z Knight and J Magness, ‘Sizing the Climate Economy’, HSBC Global Research, September 20102 Ibid.
3 Ibid.
endnotes
IntRoduCtIon and oveRvIeW
1 World Bank, ‘India Country Data’, March 2011, viewed on 11 March 2011, http://data.worldbank.org/country/india>2 McKinsey Global Institute, ‘India’s urban awakening: Building inclusive cities, sustaining economic growth’,
April 2010, p. 453 UNEP, ‘Towards a Green Economy; Pathways to Sustainable Development and Poverty Eradication –
A synthesis for policy makers’, 2011, viewed on 11 March, www.unep.org/greeneconomy4 C Singh, N Robins, R Patel, 'Sizing India's Climate Economy', HSBC Global Research, January 20115 Ibid.6 N Robins, C Singh, R Clover, Z Knight and J Magness, ‘Sizing the Climate Economy’, HSBC Global Research, September 20107 C Singh, N Robins, R Patel ‘Sizing India’s Climate Economy’, HSBC Global Research, January 20118 The Pew Centre, ‘Global Clean Power: A $2.3 Trillion Opportunity’, 2010, viewed on 11 March 2011, <
http://www.pewtrusts.org/uploadedFiles/wwwpewtrustsorg/Reports/Global_warming/G20-Report-LowRes.pdf9 C Singh, N Robins, R Patel, 'Sizing India's Climate Economy', HSBC Global Research, January 2011>10 Global Climate Network, Low carbon Jobs in an Inter-Connected World, Global Climate Network Discussion Paper No 3,
Global Climate Network, March 2010, viewed on 10 March 2011, http://www.globalclimatenetwork.info/ecomm/files/GCN%20low%20carbon%20jobs%20summary%20update%20March%202010.pdf
11 Ernst and Young, ‘Renewable Energy Country Attractiveness Indices’, February 2011, viewed on March 2011, < http://www.ey.com/Publication/vwLUAssets/Renewable_energy_country_attractiveness_indices_-_Issue_28/$FILE/EY_RECAI_issue_28.pdf>
12 C Singh, N Robins, R Patel, 'Sizing India's Climate Economy', HSBC Global Research, January 201113 C Singh, N Robins, R Patel, 'Sizing India's Climate Economy', HSBC Global Research, January 2011
IndIa's Clean eneRgy futuRe
1 C Singh, N Robins, R Patel, 'Sizing India's Climate Economy', HSBC Global Research, January 20112 Ibid.3 Central Electricity Authority, ‘Highlights of Power Sector, Monthly Review of Power Sector (Executive Summary)
for January 2011’, 2011, p. 24 KPMG, ’Power Sector in India: White paper on Implementation Challenges and Opportunities’, 2010, p. 25 Central Electricity Regulatory Commission, March 2011, as found and viewed on 11 March 2011,
http://www.climate-connect.co.uk/Home/?q=node/3756 Geographic.org, June 2005, as found and viewed on 11 March 2011,
www.photius.com/rankings/gdp_2050_projection.html, last accessed on 10 March 20117 McKinsey Global Institute, ‘India’s urban awakening: Building inclusive cities, sustaining economic growth’,
April 2010, p. 458 Central Electricity Authority, ‘All India generating installed capacity- region wise, Monthly Review of Power Sector
(Executive Summary)’, January 2011, p. 89 Central Electricity Authority, ‘All India Installed Capacity (in MW) of Power Stations Located in the Regions of Main Land
and Islands’, Executive Summary, Power Sector Reports, 2008, p. 110 TheTimes of India, January 2011, as found and viewed on 10 March 2011, http://timesofindia.indiatimes.com/india/
Indias-20th-nuclear-reactor-connected-to-power-grid/articleshow/7319085.cms11 ‘Energy Requirements’, Integrated Energy Policy, Report of the Expert Committee, Planning Commission, 2006, p. 5612 C Singh, N Robins, R Patel, 'Sizing India's Climate Economy', HSBC Global Research, January 201113 1,000 MW is equal to 1 GW14 Government of India, Ministry of New and Renewable Energy, found and viewed on 31 March 2010,
http://www.mnre.gov.in/15 Ibid.16 Ibid.17 Renewable Energy World, October 2010, found and viewed on 11 March 2011, http://www.renewableenergyworld.com/
rea/news/article/2010/10/the-last-word-will-india-be-the-next-big-green-growth-market18 Indian Renewable Energy Status Report: Background Report for DIREC 2010, October 2010, found and viewed on
11 March 2011, http://www.direc2010.gov.in/pdf/Indian-Renewable-Energy-Status-Report.pdf19 K Mukherjee D Fogarty, Reuters, 28 July 2009, viewed on 9 March 2011,
www.reuters.com/article/2009/07/28/idUSDEL10423020 Government of India, Budget 2011, allocation for Ministry of New and Renewable Energy,
indiabudget.nic.in/ub2010-11/eb/sbe67.pdf
49IndIa's Clean RevolutIon MARCH 2011
endnotes21 Global Wind Energy Council, ‘Global Wind 2009 Report’, 2009, found and viewed on 10 March, http://www.gwec.net/fileadmin/documents/Publications/Global_Wind_2007_report/GWEC_Global_Wind_2009_Report_LOWRES_15th.%20Apr.pdf
22 Government of India, Ministry of New and Renewable Energy, found and viewed on 11 March 2010, http://www.mnre.gov.in/
23 C Singh, N Robins, R Patel, 'Sizing India's Climate Economy', HSBC Global Research, January 201124 Renewable Energy World, October 2010, found and viewed on 11 March 2011,
http://www.renewableenergyworld.com/rea/news/article/2010/10/the-last-word-will-india-be-the-next-big-green-growth-market
25 Consolidated Energy Consultants,‘Wind Power India: Manufacturer-wise wind electric generators installed in India’ 31 March 2009, http://www.windpowerindia.com/statmanuf.html
26 Suzlon, found and viewed 11 March 2011, http://www.suzlon.com/investors/l3.aspx?l1=6&l2=23&l3=4327 Forbes India, ‘Saving Suzlon,, 5t June 2009, found and view on 11 March 2011,
http://business.in.com/article/cross-border/saving-suzlon/302/028 ‘Grid parity’ is when electricity can be generated from a particular source (e.g. wind) at a price which is at least cheap
as that supplied by other energy sources (e.g. coal or gas).,29 In Indian usage, one crore equals 10 million and one lakh equals 100,00030 Vestsa, found and viewed 11 March 2011, http://www.vestas.com/in/in/wind-power-in-india/current-incentives-for-
wind-power.aspx31 Government of India, Ministry of New and Renewable Energy, December 2009, viewed and found on 11 March 2011,
www.mnre.gov.in/gbi/Debashish%20Majumdar.pdf32 K Mukherjee D Fogarty, Reuters, 28 July 2009, viewed on 9 March 2011,
http://www.reuters.com/article/2009/07/28/idUSDEL10423033 S Kirmani, M Jamil, C kumar, MJAhmed, Techno Economic Feasibility Analysis of a Stand-Alone PV System
to Electrify a Rural Area Household in India, International Journal of Engineering Science and Technology Vol. 2(10), 2010, 5231-5237 pg.1
34 Cumulative Capacity, Grid Parity and Cost, CSTEP, found and viewed on 11 March 2011, www.cstep.in/docs/Chapter%204-%20Cumulative%20Capacity,%20Grid%20Parity%20and%20Cost.pdf
35 Commodity Online, ‘Azure: India’s first solar project to go commercial’, 10 December 2009, viewed on 11 March 2011, http://www.commodityonline.com/news/Azure-Indias-first-solar-project-to-go-commercial-23754-3-1.html
36 Azure Power, found and viewed on 11 March 2011, www.azurepower.com37 AndrhaNews.net, ‘Nagpur, first model solar city in India’, February 2009, http://www.andhranews.net/38 Malaviya, Jaideep,’On a Solar Mission: How India is Becoming a Centre of PV Manufacturing’
Renewable Energy World, 2008.39 Malaviya, Jaideep, ‘On a Solar Mission: How India is Becoming a Centre of PV Manufacturing’
Renewable Energy World, 200840 Indian Semiconductor Association, ‘Solar PV Industry: Global and Indian Scenario’, New Delhi, 200941 Approximately 140 million households or 76% of India’s rural population
(see http://www.wri.org/publication/power-to-the-people)42 S Bairiganjan, R Cheung, EA Delio, D Fuente, S Lall, S Singh, Power To The People: Investing in Clean Energy for the Base
of the Pyramid in India, The Institute for Financial Management, Centre for Development Finance43 United States Department of Commerce, found and viewed on 11 March 2011, http://www.commerce.gov/44 Renewable energy world, found and viewed on 11 March, http://www.renewableenergyworld.com/rea/news/
article/2011/01/2010-clean-energy-investment-hits-a-new-record45 Global Climate Network, Low carbon Jobs in an Inter-Connected World, Global Climate Network Discussion Paper No 3,
Global Climate Network, March 2010, viewed on 10 March 2011, http://www.globalclimatenetwork.info/ecomm/files/GCN%20low%20carbon%20jobs%20summary%20update%20March%202010.pdf
46 C Singh, N Robins, R Patel, 'Sizing India's Climate Economy', HSBC Global Research, January 201147 Global Climate Network, April 2010, found and viewed on 11 March 2011,
http://www.wbcsd.org/plugins/DocSearch/details.asp?type=DocDet&ObjectId=MzgxOTE48 C Singh, N Robins, R Patel, 'Sizing India's Climate Economy', HSBC Global Research, January 201149 Note that the two reports referred to in this paragraph use different assumptions and so their results are not
strictly comparable. However, the numbers cited do give an indication of the order of magnitude of the economic and employment opportunities to be generated by India’s NAPCC.
50 Estimation of industry experts51 Solar India Online, found and viewed on 11 March 2011, http://www.solarindiaonline.com/index.php52 McKinsey, ‘Powering India – The Road to 2017’, 2009, found and viewed 11 March 2011,
http://www.mckinsey.com/locations/india/mckinseyonindia/pdf/Power_Report_Exec_Summary.pdf53 Wartsila, ‘The Real Cost of Power’, 201054 Greenpeace Report: “Still Waiting”, 2009, viewed 11 March 2011,
http://www.greenpeace.org/india/Global/india/report/2009/11/stillwaiting.pdf55 Bureau of Energy Efficiency (BEE), energy manager training, brochure on trigeneration
disclaimer
India’s Clean Revolution draws on a wide range of sources, including government reports, independent academic analysis, news reports, interviews and informal conversations. While every effort has been made to present a balanced account with information corroborated where possible, some evidence – in particular the most recent information – is inevitably circumstantial. Any errors are the sole responsibility of The Climate Group.
Currency usage
Currency conversion of US dollars (USD) into Indian Rupees (INR) and vice versa was done using the average 2010 conversion rate of 45.65 INR = USD 1.00 / 1 INR = USD 0.022.
Many INR figures have been given in ‘crore’, a unit in the Indian numbering system equivalent to a figure of 10 million, and commonly used in India for expressing large numbers. A crore has a similar use to ‘millions’ and ‘billions’ in the western numbering system. Conversion to crore was made in this report for figures greater than one billion INR (~USD 22 million).
50 IndIa's Clean RevolutIon MARCH 2011
endnotes 56 The electricity intensity of the Indian economy has fallen from approximately 3.14% in the 1950s to 0.73% in 2007 according to the Overview of Indian Power Sector, Indiacore, 2008, Website. Electricity intensity is defined as the percentage growth of electricity consumption, which correlates with 1% of economic growth. Electricity intensity is defined as the percentage growth of electricity consumption, which correlates with 1% of economic growth. This was possible mainly because India’s growth until now has been based more on the service sector (with an intensity of only 0.11%) than on industrial production (with an intensity of 1.91%) according to Powering India – The Road to 2017, McKinsey, 2009.
57 Ministry of Power, ‘NTPC Limited’, Annual Report 2009-10 p. 9658 Sharma, S C Deo, ‘Coal-fired Power Plant Heat Rate and Efficiency Improvement in India’, APEC Workshop on Options to
Reduce CO2 Emissions, February 2004, www.iea.org/work/2004/zets/apec/presentations/sharma.pdf
59 Varun Rai, ’Climate Change Mitigation in India’, Seminar February 2010, data based on CEA and CERC60 Y Alagh, ‘Transmission and Distribution of Electricity in India Regulation, Investment and Efficiency. Found and viewed
on 11 March 2011, http://www.oecd.org/dataoecd/35/33/46235043.pdf>61 PowerLine. “Industrial Tariff Trends”. August 2009.62 P Antmann, ‘Reducing Technical and Non‐Technical Losses in the Power Sector, World Bank Group Energy Sector
Strategy’. July 2009, found and viewed on 10 March 2011, http://siteresources.worldbank.org/EXTESC/Resources/Background_paper_Reducing_losses_in_the_power_sector.pdf>
63 Indiacore, “Overview of the Power Sector in India”, 200864 Bureau of Energy Efficiency, found and viewed 11 March, http://www.bee-india.nic.in/65 weSRCH, found and viewed on 11 March 2011, http://energy.wesrch.com/paper_details/pdftext/TR1AU1HFZLOOM/the-
energy-scenario-and-the-renewable-potential-in-india
Clean IndustRy
1 Evolution Markets Executive Brief, Edition 38, 19 April 2010, p. 2, http://new.evomarkets.com/pdf_documents/Energy%20Efficiency%20in%20the%20U.S.%20and%20India:%20A%20Study%20in%20Contrasts%20and%20Possibilities.pdf
2 C Singh, N Robins, R Patel, 'Sizing India's Climate Economy', HSBC Global Research, January 20113 Ibid.
4 Inter-Agency and Expert Group (IAEG) on MDG Indicators, United Nations5 www.cea.nic.in Printed in Electrical India Annual 20066 India Climate Portal, 2011, viewed 28 February 2011,
http://www.indiaclimateportal.org/component/option,com_policybrief/view,policybriefdetail/id,37 Taylor, R. P., Govindarajalu, C., Levin, J., Meyer, A. S., & Ward, W. A. (2008). Financing energy efficiency: Lessons from
Brazil, China, India, and beyond. Retrieved on 20 August 2008, from World Bank website: http://www.worldbank.org/external/default/WDSContentServer/WDSP/IB/2008/02/18/000333037_20080218015226/Rendered/PDF/425290PUB0ISBN11OFFICIAL0USE0ONLY10.pdf
8 Source: http://adb.org/Documents/events/2008/ACEF/Session17-Natarajan.pdf, accessed 12 February 20119 Greenpeace India, October 2010, http://www.facenfacts.com/NewsDetails/668/greenpeace-decentralized-
renewable-energy-campaign-in-bihar.htm, accessed 28 February 2011.10 Ibid.11 National Mission on Enhanced Energy Efficiency goals, Bureau of Energy Efficiency (http://moef.nic.in/downloads/
others/Mission-SAPCC-NMEEE.pdf)12 Ibid.13 Steel Industry, http://www.scribd.com/doc/39081593/Steel-Indusrty14 Money Control, February 2007,
http://www.moneycontrol.com/news/economy/iron-ore-exports-seen-dented-by-new-duty_269367.html15 SK Jain, Energy Efficiency & New Technology Deployment in Indian Iron & Steel Sector, International Workshop On
Industrial Energy Efficiency, New Delhi, 27 January 201016 Schumacher, Katja and Jayant Sathaye, India’s Iron and Steel Industry: Productivity, Energy Efficiency and Carbon
Emissions, Ernest Orlando Lawrence Berkeley National Laboratory, October 199817 Ibid.18 Developing Financial Intermediation Mechanisms for Energy Efficiency Projects in Brazil, China and India: Energy
Efficiency Case Studies in Indian Industries, Confederation of Indian Industries, September 200719 Cement Manufacturers’ Association, Facts on Indian Cement Industry (1982-2009), Coromandel Infotech India Limited,
2009, viewed on 9 March, http://www.cmaindia.org/portal/static/DynamicFacts.aspx20 IBEF, http://www.arc.unisg.ch/org/arc/web.nsf/1176ad62df2ddb13c12568f000482b94/43cf0caeed566faac12571d3006
1daac/$FILE/India%20Symposium_IBEF_Sectoral%20Reports_Cement.pdf)21 C Bhushan, MZ Hazra. Concrete Facts: The Life Cycle of the Indian Cement Industry.
New Delhi: Centre for Science and Environment, 2005.22 Practical Guide to Energy Conservation, Chapter 12: Cement Industry, p. 323 Practical Guide to Energy Conservation, Section 5: Climate Change, Chapter 15:
Impact of Climate Change in India, p. 451, www.pcra.org/English/latest/book/15-Chapter%20-%2015.pdf24 Developing Financial Intermediation Mechanisms for Energy Efficiency Projects in Brazil, China and India: Energy
Efficiency Case Studies in Indian Industries, Confederation of Indian Industries, September 200725 www.shreecement.in and presentation by Sanjay Singh of Shree Cement Ltd. for the National Award for Excellence in
Energy Management, 2009
51IndIa's Clean RevolutIon MARCH 2011
endnotes26 Aluminium Association of India, 201027 National Multi‐Commodity Exchange Of India Limited, Report on Aluminium, viewed on 9 March,
http://www.nmce.com/files/study/Aluminium.pdf28 VS Verma, Energy Efficient Technologies Use in India – An overview, BEE, August 2004, viewed on 9 March,
http://www.authorstream.com/Presentation/aSGuest61285-475296-bee-director-general-presentation-us/29 National Academy of Agricultural Research and Management, Report on Fertilizer Industry in India, January 201130 VS Verma, op cit31 Ibid.32 Confederation of Indian Industries, Developing Financial Intermediation Mechanisms for Energy Efficiency Projects in
Brazil, China and India: Energy Efficiency Case Studies in Indian Industries, September 200733 Indian Paper Industry, Research India, January 200834 Indian Paper Industry, Research India, January 200835 VS Verma, Energy Efficient Technologies Use in India – An overview, BEE, August 2004, viewed on 9th March,
http://www.authorstream.com/Presentation/aSGuest61285-475296-bee-director-general-presentation-us/36 ITC Sustainability Report 2009,37 Can, Stephane de la Rue du, Jayant Sathaye, Lynn Price and David Fridley, ‘Assessment of Energy Use and Energy Savings
Potential in Selected Industrial Sectors in India’, Energy Analysis Department Environmental Energy Technologies Division, Ernest Orlando Lawrence Berkeley National Laboratory, August, 2005, p. 5-1 to 5-11
38 Developing Financial Intermediation Mechanisms for Energy Efficiency Projects in Brazil, China, India, UNEP, September 2007, http://www.3countryee.org/public/EECaseStudiesIndustriesIndia.pdf
Clean tRanspoRt
1 C Singh, N Robins, R Patel, 'Sizing India's Climate Economy', HSBC Global Research, January 20112 Ibid. 3 C Singh, N Robins, R Patel, 'Sizing India's Climate Economy', HSBC Global Research, January 20114 M. Badami, ‘The Road Transport Energy Challenge in India’, in Center for The Advanced Study of India, November 2010,
viewed on 9 March 2011, http://casi.ssc.upenn.edu/iit/badami>5 McKinsey & Company, Environmental and Energy Sustainability: An Approach for India, McKinsey, p. 26,
January-February 2011, viewed on 10 March 2011, http://www.mckinsey.com/clientservice/sustainability/pdf/Environmental_Energy_Sustainability.pdf>
6 C Singh, N Robins, R Patel, 'Sizing India's Climate Economy', HSBC Global Research, January 20117 McKinsey Global Institute, ‘India’s urban awakening: Building inclusive cities, sustaining economic growth’,
April 2010, viewed on 10 March 2011, < http://www.mckinsey.com/mgi/reports/freepass_pdfs/india_urbanization/MGI_india_urbanization_fullreport.pdf
8 Delhi Transport Corporation, viewed on 9 March 2011, http://www.dtc.nic.in/ccharter.htm 9 Metro Railway Kolkata, viewed on 9 March 2011, http://www.mtp.indianrailways.gov.in10 N. Lakshman, ‘The Miracle-Worker of the Delhi Metro’. BusinessWeek, 2007, viewed on 9 March 2011, <
http://www.businessweek.com/magazine/content/07_12/b4026009.htm.>11 The Institute of Chartered Accounts of India, ‘Clean Development Mechanism and Carbon Credits, A Primer’,
2009, viewed 9 March 2011, http://220.227.161.86/21023cdmcc.pdf>12 India Tribune, ‘India emerges as world’s No. 2 in car sales in 2010’, January 2011, viewed on 10 March, <
www.indiatribune.com/index.php?option=com_content&view=article&id=4833:india-emerges-as-worlds-no-2-in-car-sales-in-2010&catid=123:business&Itemid=489.>
13 Ministry of heavy Industries & Public Enterprises, ‘Automotive Mission Plan 2006-16’, September 2006, viewed on 10 March 2011, http://www.dhi.nic.in/draft_automotive_mission_plan.pdf.>
14 McKinsey Global Institute, ‘India’s urban awakening: Building inclusive cities, sustaining economic growth’, April 2010, viewed on 10 March 2011, http://www.mckinsey.com/mgi/reports/freepass_pdfs/india_urbanization/MGI_india_urbanization_fullreport.pdf
15 Intergovernmental Panel on Climate Change (IPCC), ‘Working Group III Report: Mitigation of Climate Change’, 4th Assessment Report, 2007, viewed on 11 March 2011, http://ipcc.ch/publications_and_data/ar4/wg3/en/contents.html
16 C Singh, N Robins, R Patel, 'Sizing India's Climate Economy', HSBC Global Research, January 201117 Ibid.18 Newsweek, ‘Delhi vs. Detroit?’, April 2 2009, viewed on 10 March, <
http://www.newsweek.com/2009/04/01/delhi-vs-detroit.html.>19 Daily News & Analysis, ‘Delhi government plans charging booths for electric vehicles’, 4 January 2010, view on 8 March
2011, http://www.dnaindia.com/india/report_delhi-government-plans-charging-booths-for-electric-cars_133097420 About Reva, Mahindra Reva Electric Vehicles, 2011, viewed on 11 March 2011,
http://www.revaindia.com/about_reva.html>21 Personal communication with Aditi Dass, 09 March 201122 ‘Indian Auto LPG Coalition, viewed 9 March 2011, http://www.iac.org.in/auto-lpg-in-india’ after ‘(LCVs)23 Indian Auto LPG Coalition, ‘Auto LPG in India’, viewed on 10 March 2011, www.iac.org.in/auto-lpg-in-india24 International Association for Natural gas Vehicles, in Natural Gas Vehicle Knowledgebase, December 2009,
viewed on 10 March 2011, http://www.iangv.org/tools-resources/statistics.html25 C Singh, N Robins, R Patel, 'Sizing India's Climate Economy', HSBC Global Research, January 201126 Ibid.
52 IndIa's Clean RevolutIon MARCH 2011
endnotes
gReen buIldIngs and sMaRt teChnology
1 J. Sathaye and A. P. Gupta, ‘Eliminating Electricity Deficit through Energy Efficiency in India: An Evaluation of Aggregate Economic and Carbon Benefits’, March 2010, viewed on 11 March 2011, < http://ies.lbl.gov/drupal.files/ies.lbl.gov.sandbox/3381E_0.pdf>
2 McKinsey & Company, Environmental and Energy Sustainability: An Approach for India, McKinsey, p. 26, January-February 2011, viewed on 10 March 2011, < http://www.mckinsey.com/clientservice/sustainability/pdf/Environmental_Energy_Sustainability.pdf>
3 McKinsey & Company, Environmental and Energy Sustainability: An Approach for India, McKinsey, p. 26, January-February 2011, viewed on 10 March 2011, < http://www.mckinsey.com/clientservice/sustainability/pdf/Environmental_Energy_Sustainability.pdf>
4 Kumar V, Green Architects in India, National Institute of Science, Technology and Development Studies, March 2011, viewed on 10 March 2011, < http://www.cedefop.europa.eu/EN/Files/Vipan_kumar_-_Green_architects_in_India.pdf>
5 Indian Green Building Council, Indian Green Building Council India, March 2011, viewed on 10 March 2011, < http://www.igbc.in/site/igbc/index.jsp>
6 Indian Green Building Council, Indian Green Building Council India, March 2011, viewed on 10 March 2011, < http://www.igbc.in/site/igbc/index.jsp>
7 Kumar V, Green Architects in India, National Institute of Science, Technology and Development Studies, March 2011, viewed on 10 March 2011, < http://www.cedefop.europa.eu/EN/Files/Vipan_kumar_-_Green_architects_in_India.pdf>
8 Indian Green Building Council, Indian Green Building Council India, March 2011, viewed on 10 March 2011, < http://www.igbc.in/site/igbc/index.jsp>
9 Mr Niranjan Khatri, ITC Welcomgroup, Personal Communication with Shikha Bhasin, 28 April 2010.10 Mr Niranjan Khatri, ITC Welcomgroup, Personal Communication with Shikha Bhasin, 28 April 2010.11 500 kW or contract demand of 600 kVA (kilovolt ampere) and above12 Bureau of Energy Efficiency, Energy Conservation Building Code User Guide, Energy Manager Training,
March 2011, viewed 8 March, http://www.emt-india.net/ECBC/ECBC-UserGuide/ECBC-UserGuide.pdf>13 Bureau of Energy Efficiency, Schemes for Promoting Energy Efficiency in India during the XI Plan, Page 8,
Bureau of Energy Efficiency, March 2011, viewed 10 March 2011, http://www.bee-india.nic.in/miscellaneous/documents/rti_act/schemes_for_promoting_energy_efficiency_in_India_during_the_ XI_Plan.pdf
14 Delio EA, Lall S and Singh C, Executive summary of Powering Up: The Investment Potential of Energy Service Companies in India, World Resources Institute, March 2011, viewed on 10 March 2011, < http://pdf.wri.org/powering_up_executive_summary.pdf>
15 McKinsey & Company, Environmental and Energy Sustainability: An Approach for India, McKinsey, p. 30-31, January-February 2011, viewed on 10 March 2011, < http://www.mckinsey.com/clientservice/sustainability/pdf/Environmental_Energy_Sustainability.pdf>
16 McKinsey & Company, Environmental and Energy Sustainability: An Approach for India, McKinsey, p. 30-31, January-February 2011, viewed on 10 March 2011, http://www.mckinsey.com/clientservice/sustainability/pdf/Environmental_Energy_Sustainability.pdf>
17 Pradhan G, India: Growing Energy Needs and Mitigation Options, Ministry of Power, Government of India, Slide 28., March 2011, 10 March 2011, http://www.oecd.org/dataoecd/39/15/40633690.pdf>
18 McKinsey & Company, Environmental and Energy Sustainability: An Approach for India, McKinsey, p. 31, January-February 2011, viewed on 10 March 2011, http://www.mckinsey.com/clientservice/sustainability/pdf/Environmental_Energy_Sustainability.pdf>
19 McKinsey & Company, Environmental and Energy Sustainability: An Approach for India, McKinsey, p. 31, January-February 2011, viewed on 10 March 2011, < http://www.mckinsey.com/clientservice/sustainability/pdf/Environmental_Energy_Sustainability.pdf
20 McKinsey & Company, Environmental and Energy Sustainability: An Approach for India, McKinsey, p. 31, January-February 2011, viewed on 10 March 2011, < http://www.mckinsey.com/clientservice/sustainability/pdf/Environmental_Energy_Sustainability.pdf
21 McKinsey & Company, Environmental and Energy Sustainability: An Approach for India, McKinsey, p. 31, January-February 2011, viewed on 10 March 2011, http://www.mckinsey.com/clientservice/sustainability/pdf/Environmental_Energy_Sustainability.pdf
22 Bureau of Energy Efficiency, Bureau of Energy Efficiency India, March 2011, viewed on 8 March, http://www.beeindia.nic.in/content.php?page=schemes/schemes.php?id=2>.
23 Lakshmi K, The Hindu India, March 2011, viewed 10 March 2011 < http://www.hindu.com/2010/09/01/stories/2010090158510100.htm>.
24 The Climate Group, SMART 2020: Enabling the low carbon economy in the information age, The Climate Group, March 2011, viewed on 11 March 2011, http://www.theclimategroup.org/_assets/files/Smart2020Report.pdf>
25 The Climate Group, SMART 2020: Enabling the low carbon economy in the information age, The Climate Group, March 2011, viewed on 11 March 2011, http://www.theclimategroup.org/_assets/files/Smart2020Report.pdf>
27 The Hindu Business Line, Electric vehicle makers upbeat on ‘Green' Budget, February 27, 2010, viewed on 10 March 2011, http://www.thehindubusinessline.in/2010/02/27/stories/2010022752550500.htm>
28 Ministry of Petroleum and Natural Gas, National Auto Fuel Policy Announced, October 2003, viewed on 10 March 2011,< http://pib.nic.in/archieve/lreleng/lyr2003/roct2003/06102003/r0610200313.html
53IndIa's Clean RevolutIon MARCH 2011
endnotes26 Planning Commission Government of India, Eleventh Five Year Plan 2007-12, Volume I: Inclusive Growth, Oxford University Press, March 2011, viewed on 11 March 2011, < http://planningcommission.gov.in/plans/planrel/fiveyr/11th/11_v1/11th_vol1.pdf>.
27 Chandrasekhar CP, The Hindu, March 2011, viewed on 11 March 2011, < http://www.thehindu.com/opinion/columns/Chandrasekhar/article442421.ece>
28 The Climate Group, SMART 2020: Enabling the low carbon economy in the information age, The Climate Group, March 2011, viewed on 11 March 2011, http://www.theclimategroup.org/_assets/files/Smart2020Report.pdf>
29 Cisco, Cisco Systems Inc., March 2011, viewed March 2011, http://www.cisco.com/en/US/products/index.html30 Tata Consultancy Services, Tata Group London, March 2011, viewed 11 March 2011, <
http://www.tcs.com/thought_leadership/Pages/Green-Logistics-Service-Providers.aspx31 One Infosys, Sustainability Report 2008-09, Infosys, March 2011, viewed on 11 March 2011, <
http://www.infosys.com/sustainability/Documents/infosys-sustainability-report-0809.pdf>32 Wipro. Sustainability Report 2007-08, Wipro, March 2011, viewed on 11 March 2011, <
http://www.wipro.com/corporate/investors/pdf-files/wipro-sustainability-report-2007-08.pdf>33 CII ITC Centre of Excellence for Sustainable Development, Executive Summary of ICT’s Contribution to India’s National
Action Plan on Climate Change, Digital Energy Solutions Consortium, March 2011, viewed on 11 March 2011, < http://www.digitalenergysolutions.org/clientuploads/DESC%20India/Executive%20Summary%20CII-DESC.pdf>
34 CII ITC Centre of Excellence for Sustainable Development, Executive Summary of ICT’s Contribution to India’s National Action Plan on Climate Change, Digital Energy Solutions Consortium, March 2011, viewed on 11 March 2011, < http://www.digitalenergysolutions.org/clientuploads/DESC%20India/Executive%20Summary%20CII-DESC.pdf>
35 Labelle R et al, ICTs for e-Environment: Guidelines for Developing Countries, with a focus on Climate Change, International Telecommunication Union, March 2011, viewed on 11 March 2011, < http://www.itu.int/ITU-D/cyb/app/docs/itu-icts-for-e-environment.pdf>.
36 Heeks R and Ospina AV, Linking ICTs and Climate Change Adaptation: A Conceptual Framework for e-Resilience and e-Adaptation, March 2011, viewed on 11 March 2011, IDRC CRDI Canada, < http://idl-bnc.idrc.ca/dspace/bitstream/10625/44416/1/130855.pdf
fInanCIng IndIa's Clean RevolutIon
1 N Robins, C Singh, R Clover, Z Knight and J Magness, ‘Sizing the Climate Economy’, HSBC Global Research, September 20102 Ibid.3 Arora et al, Indian Renewable Energy Status Report, Background Report for DIREC 2010. October 2010,
Viewed on 9 March 2011, http://www.ren21.net/Portals/97/documents/Indian_RE_Status_Report.pdf>4 Renewable energy analyst, Yes Bank Ltd, Personal Communication with Shikha Bhasin, 15 December 20115 ‘Vivek Mehra, Yes Bank, Personal Communication with Mark Kenber, 25 January 20116 PTC India, ‘11th Annual Report 2009 – 2010’. 16 August 2010, viewed on 11 March 2011, <
http://www.ptcindia.com/common/PTC%20Annual%20Report%202009-10-SHAREHOLDER.pdf>7 C Singh, N Robins, R Patel, ‘Sizing India’s Climate Economy’, HSBC Global Research, January 2011
8 Ibid.9 Yes Bank, ‘The Energy Scenario and the Renewable Potential in India’, GreenTech. 20th October 2009,
viewed on 11 March 2009, http://energy.wesrch.com/paper_details/pdf/TR1AU1HFZLOOM/the-energy-scenario-and-the-renewable-potential-in-india>
10 E Delio et al, ‘Powering up: The Investment Potential of Energy Service Companies in India’, World Resources Institute. 2010, viewed on 9 March 2011, http://www.wri.org/publication/powering-up>
11 C Singh, N Robins, R Patel, 'Sizing India's Climate Economy', HSBC Global Research, January 201112 Bureau of Energy Efficiency, ‘National Mission for Enhanced Energy Efficiency’. Viewed on 11 March 2011,
http://www.bee-india.nic.in/NMEEE/NMEEE2.ppt13 E Dellio et al, ‘Powering up: The Investment Potential of Energy Service Companies in India’, World Resources Institute.
2010, viewed on 9 March 2011, http://www.wri.org/publication/powering-up>14 USAID Asia, ‘Innovative Approaches to Financing Energy Efficiency in Asia’. August 2009, viewed on 9 March 2011,
http://usaid.eco-asia.org/programs/cdcp/reports/innovative_approaches.pdf>15 Ministry of New and Renewable Energy, ‘Renewable Energy in India: progress, vision and strategy’, in India
Environmental Portal, September 2010, viewed on 9 March 2011, < http://www.indiaenvironmentportal.org.in/content/renewable-energy-india-progress-vision-and-strategy>.
16 G OKane, ‘India and China look good for clean tech investment in 2010’, asiancorrespondent.com, 12 January 2010, viewed on 11 March 2011, http://asiancorrespondent.com/green-business-blog/india-and-china-look-good-for-clean-tech-investment-in-2010>
17 Ibid.18 UNFCCC, ‘CDM in numbers: Registration’, 10 March 2011, viewed on 11 March 2011, <
http://cdm.unfccc.int/Statistics/Registration/NumOfRegisteredProjByHostPartiesPieChart.html>19 UNFCCC, ‘CERs issued by host country’, 10 March 2011, viewed on 11 March 2011,
http://cdm.unfccc.int/Statistics/Issuance/CERsIssuedByHostPartyPieChart.html>20 N Okubo, ‘Clean Development Mechanism (CDM) in India’, IGES Market Mechanism Group, October 2010, viewed on
11 March 2011, http://enviroscope.iges.or.jp/modules/envirolib/upload/984/attach/india_final.pdf>21 IGES CDM Project Database, ‘CDM in India’, 1 Oct 2010, viewed on 11 March 2011, <
http://enviroscope.iges.or.jp/modules/envirolib/upload/984/attach/india_final.pdf

54 IndIa's Clean RevolutIon MARCH 2011
aCknoWledgeMentsThis report is the product of valuable contributions and insights of a large number of people who participated in its research, writing and review.
suppoRtIng paRtneR:
The Climate Group is grateful for HSBC’s support of this report, and of our India program, through the HSBC Climate Partnership. The HSBC Climate Partnership was launched in India in January 2008 and supports Earthwatch, WWF, The Climate Group, and Smithsonian Tropical Research Institute to combat the impact of climate change on forests, freshwater, cities and people.
HSBC Holdings plc, the parent company of the HSBC Group, is headquartered in London. The Group serves customers worldwide from around 7,500 offices in 87 countries and territories in Europe, the Asia-Pacific region, the Americas, the Middle East and Africa. With assets of USUSD 2,455 billion at 31 December 2010, HSBC is one of the world’s largest banking and financial services organizations. HSBC is marketed worldwide as ‘the world’s local bank’.
The Climate Group is grateful to HSBC for granting us permission to draw on and quote from their two seminal reports: N Robins, C Singh, R Clover, Z Knight and J Magness, ‘Sizing the Climate Economy', HSBC Global Research, September 2010’, and C Singh, N Robins, R Patel, 'Sizing India's Climate Economy, HSBC Global Research, January 2011. Any errors or discrepancies between HSBC data and related information in this report are the responsibility of The Climate Group alone.
knoWledge paRtneR:
YES BANK, India’s new age private sector bank, is the outcome of the professional and entrepreneurial commitment of its Founder, Rana Kapoor and his top management team, to establish a high quality, customer centric, service driven, private Indian bank catering to the future businesses of India. YES BANK has adopted international best practices, the highest standards of service quality and operational excellence, and offers comprehensive banking and financial solutions to all its valued customers.
YES BANK has a knowledge driven approach to banking, and a superior customer experience for its retail, corporate and emerging corporate banking clients. YES BANK is steadily evolving as the Professionals’ Bank of India with the long term mission of “Building the Best Quality Bank of the World in India”.
We would like to specially thank Mr. Vivek Mehra, Mr. Moiz Saif and Ms. Ruta Samant for their contributions and expertise to the finance chapter.
55IndIa's Clean RevolutIon MARCH 2011
KPMG is the global network of professional services firms of KPMG International. KPMG member firms provide audit, tax and advisory services through industry focused, talented professionals, who deliver value for the benefit of their clients and communities.
KPMG in India has offices in Mumbai, Delhi, Bangalore, Chennai, Hyderabad, Kolkata, Pune, Chandigarh and Kochi and services over 5,000 international and national clients. The firms in India have access to more than 5,000 Indian and expatriate professionals.
We would like to thank Mr. Manish Agarwal and Mr. Arvind Sharma for their invaluable contributions in developing the concept and the structure of the report.
eXteRnal ContRIbutoRs: We would like to thank Dr. Tobias F. Engelmeier, Ms. Isabelle-Jasmin Roth and Mr. Mohit Anand from Bridge to India for their expertise in researching and writing.
Numerous individuals and corporates have contributed to this report with their expertise through interviews and thoughtful suggestions. We are grateful for their support and guidance throughout the process and recognize that they have not seen the entire report and may not subscribe to its outcome.
the ClIMate gRoup ContRIbutoRs: Shikha Bhasin, Lauren Bird, Guyang Chen, Madeleine Cobb, Aditi Dass, Urvashi Devidayal, Emily Gould, Callum Grieve, Inigo Harrison-Topham, Tom Howard-Vyse, Mark KenberProdyut Mukherjee, Ashirbad Raha, Damian Ryan, Clare Saxon, Thurstan Wright
pRoduCtIon:
design: Pixels & Pulp www.pixelsandpulp.com
editors: Barry Kantor and Colin Douglas
photography: Cover image: © Atul Loke, Panos Pictures | Page 2: © Ugurhan Betin, iStockphoto | Pages 7, 20, 40: Getty Images | Pages 16, 30: © Jiri Rezac for The Climate Group | Page 33: The Climate Group staff member
about the ClIMate gRoup:
The Climate Group is an independent, not-for-profit organization working internationally with government and business leaders to advance the smart policies, technologies and finance needed to cut global emissions and unlock a clean industrial revolution. Our global coalition of companies, states, regions and cities around the world recognizes the economic and environmental imperatives of taking decisive action now. The Climate Group was founded in 2004 and has operations in Australia, China, Europe, India and North America.
ContaCt InfoRMatIon
The Climate Group, London Second Floor, Riverside Building County Hall Belvedere Road London SE1 7PB United Kingdom
Tel: +44 (0) 20 7960 2970 Fax: +44 (0) 20 7960 2971
www.theclimategroup.org
The Climate Group, New Delhi c/o Incube Business Centre Level 3, Room No. 301 18, Nehru Place New Delhi, 110 019, India
Tel: +91 11 3061 4613 Fax: +91 11 3061 4411
The Climate Group, Mumbai c/o Arup Engineering Consultants 5th Floor, Housefin Bhavan C-21 Bandra Kurla Complex Bandra (East) Mumbai, 400 051, India
Tel: +91 22 2657 0494
Feedback and requests for information should be sent to:

for More inforMation, pleaSe viSit: www.theclimategroup.org