Indiana PA Food Co op Feasibility Study
53
Indiana PA Food Co‐ op Feasibility Study Prepared for Steering Committee Indiana PA Food Co‐op Prepared by Cathy A. Smith, Ph.D. Keystone Development Center, Inc. December 2015
Transcript of Indiana PA Food Co op Feasibility Study

Indiana PA Food Co‐op Feasibility Study
Prepared for Steering Committee
Indiana PA Food Co‐op
Prepared by
Cathy A. Smith, Ph.D. Keystone Development Center, Inc.
December 2015

Keystone Development Center 2 December 2015
Executive Summary
An analysis of the economic viability of establishing a food cooperative in Indiana, PA was conducted by the Keystone Development Center (KDC) as part of a technical assistance agreement with the Steering Committee of the Indiana PA Food Co‐op. The focus of the study is the establishment of a retail food cooperative in the downtown area of Indiana, PA. A primary trade area (PTA) was determined based upon the geography from which approximately 80% of the Co‐op sales will originate. The PTA is roughly 12.5 miles to the north, 9.5 miles to the east, 14 miles to the south, and 12 miles to the west with Indiana at its center. It was defined based upon Steering Committee input, survey results, competitor distribution, and local‐road configuration. According to census data, there are 25,167 households and 55,498 individuals over 18 in the PTA. When examining feasibility, food cooperative developers usually look at several socio‐demographic characteristics of residents in the PTA. These are based upon experience with successful food cooperative start‐ups. Two such measures are education attainment and Median Household Income (MHI). Both tend to have a positive correlation to food‐cooperative success. In the PTA, both the MHI and educational attainment are below state averages and therefore not positive indicators. Some areas in the PTA (close to Indiana University) are well above the state averages, providing some positive support to viability. The development of the revenue model is one of the key pieces of the financial analysis. One analysis method used secondary data from the Census and Community Expenditure Survey to estimate potential sales for the Co‐op. The other method used primary data from a community survey. For the first method, the total number of households in the PTA and average household expenditures for food‐at‐home purchases were used in the calculations. Student purchases and nonfood sales were also estimated. Sales outside the PTA were projected based on local traffic volumes. This resulted in a combined projected monthly sales of approximately $16,300 sales per week or about $847,900 per year. The other method used survey data to project estimated sales of $31,484 per week. This is based upon 535 answering the relevant questions. Extrapolating between the two, a weekly sales estimate of $18,000 was used as the basis for the first‐year financial analysis. Potential competitors to the cooperative were obtained from various sources. There are 12 possible direct competitors and at least 6 indirect competitors to the business. A spatial analysis shows an area somewhat well served by grocery stores ‐‐ though Indiana residents regularly drive approximately 60 miles to the Trader Joe’s and Whole Foods in Pittsburgh. An important issue for an operating grocery store is sourcing quality products at the lowest cost. With the cooperative’s proposed mission to sell local foods, this complicates an already complex situation. Local foods tend to mean small scale vendors, resulting in the store having to buy from several suppliers. An analysis of the potential local‐food supply was done through

Keystone Development Center 3 December 2015
data from the 2012 USDA Census of Ag Profile. There are a total of 29,231 farms with vegetable/fruit sales of $83 million in the local‐product supply area (based on a 100‐mile radius). Data support an adequate local‐food supply. The feasibility of a business startup is highly dependent on the development costs. A total development budget to open the store is estimated to be $634,359. The capital for development and operations is assumed to come from equity provided by the cooperative members, grants, and loans from commercial sources. The member/owners have to provide significant equity for many reasons, including that no commercial lender will loan to a business with limited equity. The analysis assumes that the business would borrow just over $380,600 from a primary lender with the remaining coming from members and grants. The assumptions include 500 founding members paying a membership fee of $100. Detailed financial projections for the first five years of the business were developed. This included a monthly‐operating statement and cash‐flow analysis for Year 1. These were then projected into yearly statements for years 2 to 5. Balance sheets for the first five years were also prepared. Many assumptions were necessary to build the financial model, including building size, cost of goods sold, employee numbers, and numerous other operating expenses. Please refer to the full report for details. The financial results are cautiously positive. The business loses money in Year 1 with a predicted net loss of just over $48,000 (a loss is not unusual for the first year of a start‐up). Most analysts like to see a business profitable by year 3 and this business finally shows profitability in Year 5. A cash‐flow analysis is essential since a business needs enough cash to pay bills. Based on many assumptions, the business maintains a positive cash balance across the 5 Years, with the balance dipping to just over $3,000 at the end of Year 5 (with an additional $14,000 also available in a reserve‐cash account). The primary debt is paid off at the end of Year 5, so the cash‐flow situation dramatically improves in Year 6. A sensitivity analysis of the financial model shows a model at equilibrium. Small changes in key assumptions send the cash balance into the negative. This is totally expected as the model is intentionally balanced at the cusp of feasibility to minimize the amount of start‐up capital needed. There appears to be enough feasibility potential to proceed into further business planning. The true test will come when the membership drive kicks into full gear. When money is required, will the community and donors step up? Potential next steps include making a decision on whether to go forward with the same vision of the business. If the decision is to move forward, the Steering Committee should consider incorporating and expanding on the initial feasibility work. This could include a more detailed marketing study to further confirm potential sale. The group should also begin an equity drive – the model assumes 500 founding members. A business planning process should also be initiated among other steps detailed in the report.

Keystone Development Center 4 December 2015
About This Report This report presents feasibility‐study results for a food cooperative to be located in Indiana, PA. The study was conducted as part of a technical assistance agreement between the Keystone Development Center (KDC) and the Steering Committee for the Indiana PA Food Co‐op. The author and analyst is Cathy Smith, Cooperative Developer for KDC. Please see Appendix A for the limiting conditions of the report. For more information on this project, please contact the Indiana PA Food Co‐op Steering Committee at [email protected].

Keystone Development Center 5 December 2015
Table of Contents Executive Summary ....................................................................................................................................... 2
About This Report ......................................................................................................................................... 4
Figures ........................................................................................................................................................... 6
Introduction .................................................................................................................................................. 7
Cooperative Model ....................................................................................................................................... 7
Primary Trade Area ....................................................................................................................................... 7
Revenue Model Calculations ...................................................................................................................... 12
Primary Trade Area Revenue .................................................................................................................. 13
Household Sales .................................................................................................................................. 13
Student Food Sales .............................................................................................................................. 14
Nonfood Sales ..................................................................................................................................... 14
Secondary Trade Area Revenue .............................................................................................................. 15
Combining the Sales Estimates ............................................................................................................... 15
Competitor Analysis .................................................................................................................................... 16
Store Location ............................................................................................................................................. 17
Suppliers ...................................................................................................................................................... 18
Food Perishability........................................................................................................................................ 21
Food Safety ................................................................................................................................................. 21
Leadership ................................................................................................................................................... 21
Development Budget .................................................................................................................................. 22
Debt, Equity, and Members ........................................................................................................................ 23
Financial Analysis of Feasibility ................................................................................................................... 25
Sales ........................................................................................................................................................ 25
Cost of Goods Sold .................................................................................................................................. 26
Employees ............................................................................................................................................... 27
Rent and Utilities ..................................................................................................................................... 28
Depreciation ............................................................................................................................................ 29
Information Technology .......................................................................................................................... 29
Credit Card Fees and Sales Tax ............................................................................................................... 29
Insurance and Other Expenses ............................................................................................................... 30
Income Statement and Net Profit (Loss) ..................................................................................................... 30
Cash‐Flow Analysis ...................................................................................................................................... 31
Five Year Projections and Business Sustainability ...................................................................................... 33
Net Profit/Loss – 5 Years ......................................................................................................................... 33

Keystone Development Center 6 December 2015
Cash‐flow – 5 Years ................................................................................................................................. 35
Balance Sheet .............................................................................................................................................. 36
Feasibility of Food Cooperative .................................................................................................................. 37
Recap ....................................................................................................................................................... 37
Sensitivity ................................................................................................................................................ 38
Next Steps ............................................................................................................................................... 39
Appendix A: Limiting Conditions
Appendix B: Food Cooperative Financial Tables
Appendix C: Survey Summary
Figures Figure 1: Indiana PA Food Co‐op Primary Trade Area and No. of Households ............................................. 8 Figure 2: Demographic Data for Primary Trade Area ................................................................................... 9 Figure 3: Group Quarters Population in PTA .............................................................................................. 10 Figure 4: Percent with Bachelor's Degree or Higher ................................................................................... 11 Figure 5: Median Household Income by Census Tract for the PTA ............................................................ 12 Figure 6: Components of the Revenue Calculations ‐‐ PTA ........................................................................ 13 Figure 7: PA DOT Traffic Volume ................................................................................................................. 15 Figure 8: Total Weekly Sales Estimates ....................................................................................................... 16 Figure 9: Food Co‐op Competitors .............................................................................................................. 16 Figure 10: Competitor locations ................................................................................................................. 16 Figure 11: Giant Eagle Express Building ...................................................................................................... 18 Figure 12: Vegetable and Fruit Market Value ‐‐ data table ........................................................................ 19 Figure 13: Number of Farms by County in Supply Area .............................................................................. 20 Figure 14: Vegetable and Fruit Marketing by County ................................................................................. 20 Figure 15: Development Budget ‐‐ Food Cooperative ................................................................................ 22 Figure 16: Capital Requirements ................................................................................................................. 24 Figure 17: Equity and Debt Assumptions ‐‐ 5 Years .................................................................................... 24 Figure 18: Revenue Assumption Reality Check ........................................................................................... 26 Figure 19: Revenue Estimations ‐‐ First Year .............................................................................................. 26 Figure 20: Employee Assumptions .............................................................................................................. 27 Figure 21: Potential Store Hours ................................................................................................................. 28 Figure 22: Revenue and Net Profit by Month for First Year of Startup ...................................................... 31 Figure 23: Monthly Cash Balance for First Year Start up ............................................................................ 32 Figure 24: Five Year Losses ......................................................................................................................... 33 Figure 25: Income State Summary ‐‐ 5 Years .............................................................................................. 34 Figure 26: Assumptions for 5 Year Projections ........................................................................................... 35 Figure 27: Projected Cash Balance ‐‐ 5 Years .............................................................................................. 35 Figure 28: Five‐Year Balance Sheet Summary ............................................................................................ 37

Keystone Development Center 7 December 2015
Introduction The results of a feasibility study conducted by the Keystone Development Center (KDC) under a technical assistance agreement with the Steering Committee of the Indiana PA Food Co‐op are presented. The study is an objective look at the various factors around the economic viability of establishing a food cooperative in the downtown area of Indiana. Various data sources are used for the analysis. Primary data was collected through a survey of community members and potential customers. A summary of the survey results is presented in Appendix C. Secondary data is from multiple sources and further detailed in following sections.
Cooperative Model A cooperative is a member‐owned, member‐run and member‐governed business. It is a business that exists to serve its members. Hypothetically the food cooperative could have members who are both consumers and workers. The cooperative model encourages participation and feedback—operating to meet member goals. Member/owners are expected to contribute both equity and, in some cases, volunteer labor to the business. Various aspects of the analysis are summarized in the following sections, including several sections covering the financial model and analysis. First, the primary trade area analysis is detailed. This provides the geographic basis for the store’s potential sales.
Primary Trade Area The primary trade area (PTA) is defined for this analysis as the area from which approximately 80% of the Co‐op sales will originate. This is the geographic area from which the coop will consistently draw most of its customers. The secondary trade area will pull in the final 20% and is estimated separately. The geographic determination and definition is covered, followed by the demographics. These results and the subsequent feasibility determination are based on both primary and secondary data. The primary data come from a community survey for which a summary is included in Appendix C. The secondary data is primarily from the Census Bureau and USDA. The PTA was defined based upon several key pieces of data, including average daily traffic on surrounding highways, competitor distribution1, survey results, and opinions of local development representatives. The following is a map of the PTA with the number of households by census tracts2.
1 Discussed in a following section. 2 All demographic data is from the 2009‐2013 American Community Survey 5 Year Estimates. The somewhat disjointed appearance of the map is driven by the Census Bureau’s geographic designation for the tract.

Keystone Development Center 8 December 2015
Figure 1: Indiana PA Food Co‐op Primary Trade Area and No. of Households
It is roughly 12.5 miles to the north, 9.5 miles to the east, 14 miles to the south, and 12 miles to the west. The following table shows relevant socio‐demographic data for the census tracts depicted above:

Keystone Development Center 9 December 2015
Figure 2: Demographic Data for Primary Trade Area
Included in the table above are the Census Bureau’s estimates of individuals living in group quarters. Because Indiana University is within the PTA, the numbers living in group quarters is particularly relevant. The group quarters data include all people not living in households. There are two general categories of people in group quarters ‐‐ the institutionalized and noninstitutionalized populations. The data available at the census tract level does not distinguish between the two categories. With further research the estimates from the Census Bureau were adjusted to more accurately reflect the study’s needs. There are two correctional facilities in the PTA – the Pine Grove Maximum Security Prison and the Indiana County Jail. Their addresses are marked on the following map with a square box and both are in Census Tract 9609. The prison has an average daily inmate count of approximately 660 and the County jail has 64 beds. The prison numbers were subtracted from the above estimates for the revenue analysis.
Census Tract County
Total
Households
Median
Househol
d Income
Pop 18 Yrs
and Older
% Bach
Degree or
More in
Pop 25
and Over
Group
Quarters
9605 Indiana 748 62,625$ 2,626 19.1 36
9606 Indiana 2,080 56,857$ 4,254 28.4 51
9607 Indiana 3,508 42,122$ 6,145 36.9 325
9608 Indiana 1,633 64,583$ 3,404 45.4 152
9609 Indiana 1,652 42,500$ 3,864 34.1 1,002
9610 Indiana 1,036 33,750$ 1,932 51.1 43
9611.01 Indiana 2,054 13,091$ 4,521 36.6 371
9611.02 Indiana 446 4,423$ 3,942 7.3 3,033
9612 Indiana 1,286 46,696$ 2,233 35.7 10
9613 Indiana 1,592 45,735$ 3,137 16.2 35
9615 Indiana 1,617 47,674$ 3,232 11.7 2
9616 Indiana 1,054 42,938$ 3,640 18 7
9617 Indiana 777 42,361$ 1,411 22.1 5
9618 Indiana 744 45,938$ 1,376 8.9 3
9619 Indiana 1,823 46,593$ 3,652 15.5 3
9620 Indiana 1,643 44,786$ 3,463 11.3 54
9621 Indiana 1,474 47,823$ 2,666 24.5 2
Total 25,167 55,498 5,134

Keystone Development Center 10 December 2015
Figure 3: Group Quarters Population in PTA
When examining feasibility, food cooperative developers usually look at several characteristics of the residents in the PTA. These are based upon experience with successful food cooperative start‐ups. Two such measures are education level and Median Household Income. Both tend to have a positive correlation to food‐cooperative success. The PA State Average for the educational attainment of a Bachelor Degree or more in the 25 and over population is 27.5%. The average for the PTA is 24.9%. This is an indicator that the leadership pool from which to draw the founders might be more limited. There are however, 7 census tracts where educational attainment exceeds the state average. This population tends to live close to Indiana University and in the Indiana Borough. The following map shows their distribution.

Keystone Development Center 11 December 2015
Figure 4: Percent with Bachelor's Degree or Higher
A successful co‐op startup usually only needs 5 to 7 people as a core leadership group, so a low percent of educational attainment is treated as only one of several indicators. And already the Indiana PA Food Co‐op has approximately 12 members on its Steering Committee. Median Household Income (MHI) for the state of PA is $50,228. Co‐ops in areas with higher than average income tend to be more successful. The average for the PTA is $42,970. Again, the household income statistic does not support a cooperative start up. Though there are pockets of population with a higher MHI as evidenced by the following map. The higher income population is centered on the University in the Indiana Borough and the census tracts to the north.

Keystone Development Center 12 December 2015
Figure 5: Median Household Income by Census Tract for the PTA
Revenue Model Calculations The development of the revenue model is one of the key pieces of the financial analysis. Identification of the PTA is essential to estimating the potential market size for the cooperative’s sales. This section focuses on revenue projections based upon the previous PTA definition and description. Because the feasibility of a business that does not exist is being determined, estimations of the business’ financials are needed. All the financial projections used in feasibility assessment are just that, projections. The revenue projections are presented now because the estimates are needed for other aspects of the initial analysis (e.g., determining store size). The Financial Analysis section returns to the revenue model with additional information.

Keystone Development Center 13 December 2015
Primary Trade Area Revenue The sales or revenue from the PTA are estimated in several components and summed together for total sales. First the food sales from households in the PTA is estimated. Figure 6 summarizes the whole set of calculations and the following narrative explains the logic. This is then followed by a section on student food sales estimates and nonfood sales. A separate section covers the Secondary Trade Area (STA).
Household Sales For this component of the revenue model, the total number of households in the PTA provides the foundation for the calculations. Data from the U.S. Bureau of Labor Statistics’ Consumer Expenditure (CE) Survey is used to estimate consumer expenditures on food consumed at home. The CE is the only federal survey providing information on a complete range of consumers' expenditures and incomes, as well as the characteristics of those consumers. The 2014 average expenditure for food‐at‐home expenditures for residents of the Northeast is used. The estimate is for a consumer unit.3 For 2014 in the Northeast, the average expenditure per consumer unit on food‐at‐home is $4,090 per year. For the CE survey, “Food at Home” refers to the total expenditures for food at grocery stores (or other food stores) and food prepared by the consumer unit on trips. It excludes the purchase of nonfood items. The food‐at‐home expenditures would include deli purchases. The total number of households in the PTA is 25,167, giving a total estimate of just under $103 million spent for food at home. Obviously not all of these dollars would be available to Co‐op. Figure 6: Components of the Revenue Calculations ‐‐ PTA
3 A consumer unit consists of any of the following: 1) All members of a particular household who are related by blood, marriage, adoption or other legal arrangements; 2) a person living alone or sharing a household with others or living as a roomer in a private home or lodging house or in permanent living quarters in a hotel or motel, but who is financially independent; and 3) two or more persons living together who use their incomes to make joint expenditure decisions. The terms consumer unit, family and household are often used interchangeably for convenience. However, the proper technical term for purposes of the Consumer Expenditure Survey is “consumer unit.”
Total Food $$ in PTA: $102,933,030
Natural/Organic Mkt. Share (8%): $8,234,642
Small/Indie Store Mkt. Share (26%): $2,141,007
Cooperative Annual Market Share (30%): $599,482
PTA Projected Weekly Household Food Sales: $11,528

Keystone Development Center 14 December 2015
To further refine the estimate, the percent of food dollars spent in the organic and natural foods segment is used as a proxy. While this is a less‐than‐ideal method of defining the potential sales pool for the start‐up cooperative, it does screen out the more “traditional shopper” dollars. The theory is that the cooperative customer is more likely to be seeking out products that are environmentally friendly and pesticide free – characteristics of natural/organic products. A traditional shopper will be less likely to join or shop at the cooperative. The natural/organic food segment is approximately 8% of the grocery expenditures.4 This leaves a reduced potential market of $8.2 million in food purchases. Next, the $8.2 million is further decreased because the food cooperative, an independent/small store, cannot compete for all the “natural” food dollars with the larger chain stores. Independent grocery stores have approximately 26% of the natural food/organic market (from same study as above) so the potential market is reduced again by this amount, resulting in an estimate of $2.1 million annual sales as the total potential market for the cooperative. But again, the cooperative cannot expect to capture all these dollars – that would be a 100% market share. At start‐up, the cooperative is assumed to gain a 28% market share. This results in projected monthly sales of approximately $50,000 per month, or $600,000 per year. The projected weekly revenue for the co‐op from household food sales in the PTA is $11,528 per week. The above revenue calculations are based on household expenditures. But the PTA includes the Indiana University of Pennsylvania, which has a significant student population. The next section covers this.
Student Food Sales While the CE Survey for households presumably captures students living off campus, it does not adequately account for students living on campus. This is where the Group Quarter demographics become important. By taking the group‐quarter estimates and removing the estimated jail population, an estimate of potential student sales can be generated. Again, this is far from a precise estimate. For the Northeast Region the average number of people per household is 2.4 and as stated above, the average annual expenditure on food at home per household is $4,090 or approximately $1,704 per person. This number is used to estimate weekly food sales from students. There are an estimated 4,410 (non‐jail) in group quarters within the PTA. To be conservative, the $1,704 is reduced by 20% because students are likely to spend less on food at home, given on‐campus eating options. By using the same process of reduction used above to carve the total market down to a reasonable assumption, the estimate for student food purchases is $673 per week. Please refer to the tables in Appendix B for further details on the exact calculations.
Nonfood Sales The estimates so far have been based upon just food‐at‐home expenditures. The store will sell more than food and will therefore generate revenue from nonfood sales. One estimate is that approximately 19% of the store sales will be nonfood products.5 This number was used on total food sales (including those from STA) to estimate the additional sales revenue. It comes to just over $2,600 per week. The PTA is generally assumed to be approximately 80% of the total projected revenue. A following section covers the analysis for the Secondary Trade Area to verify that calculation.
4 Based upon the 2006 study, the Natural and Organic Food and Beverage Industry Trends: Current and Future Patterns in Production, Marketing, Retailing, and Consumer Usage, published by Packaged Facts. 5 South Philly Food Co‐op: Determining a Store Strategy, Wharton Community Consultants Dec 15, 2011.

Keystone Development Center 15 December 2015
Secondary Trade Area Revenue The Average Daily Traffic Volume from the PA Department of Transportation was used for the estimate. Through parts of downtown Indiana, over 10,000 vehicles per day go through. Since the location of the store is not known, a conservative assumption of 5,000 cars per day is assumed to go by store front. One quarter of one percent (0.25%) of the 5,000 are assumed to stop at the store. They are predicted to spend on average $20/stop. This adds $1,500 per week for STA sales. This estimate is only about 10% of total sales projections. Normally the STA is projected to add 20% to the business so this is a low estimate of the STA contribution to sales. Additional research is needed before a more accurate estimate can be made and is outside the scope of the survey. The following map is a bad reproduction of the most recent DOT map for Average Daily Traffic volume. Figure 7: PA DOT Traffic Volume
Combining the Sales Estimates The goal of the above machinations is to arrive at a weekly sales estimate for the food co‐op. This will provide one of the foundations of the financial analysis.6 The following table summarizes the estimates and shows total projected weekly sales of just over $16,000. This should be considered a rough estimate of weekly sales available to the co‐op.
6 There is a separate financial analysis section that describes further refinements of the estimates.

Keystone Development Center 16 December 2015
Figure 8: Total Weekly Sales Estimates
Competitor Analysis Potential competitors to the cooperative were derived from discussions with individuals working on the project and through a web search of related businesses. The survey results were also used to inform the list. The following table includes both direct and indirect competitors to the food co‐op. Direct competitors are stores that will be similar to the proposed store in terms of merchandise mix, customers, image, and appeal. They are also the businesses close to the anticipated location of the store. Indirect competitors are stores that may carry similar merchandise but their main thrust is different from the co‐op or they might be located further away. At this point, concluding strength of the competitors can only be based upon the survey results.7 The survey indicates that Martin’s Food Markets is the most frequented grocery business from the respondents (29%). Walmart is just less than Martin’s with 28.6%. Giant Eagle has 18% and Aldi is 13%. According to the survey, these four account for just under 90% of the respondents. Further competitor data gathering should be gathered if the project goes forward – this includes details on any new projects in development.
Figure 9: Food Co‐op Competitors
The following is a map of their locations: Figure 10: Competitor locations
7 See Appendix C for further survey results.
Revenues ‐‐ Weekly
PTA Weekly Food Sales ‐‐ Households $11,528
Student Weekly Food Sales $673 Total FoodSTA Food Sales $1,500 $13,702NonFood Revenues $2,603
Total Weely Revenue $16,305
Store Name Street Address City State ZipcodeDIRECT COMPETITORS
Aldi 2910 Oakland Ave Indiana PA 15702
Back to Nature 2450 Warren Road Indiana PA 15701
Bi‐Lo of Homer City 125 W. Elm St Homer City PA 15748
Cunningham Meats 81 Cunningham Rd Indiana PA 15701
Giant Eagle 475 Ben Franklin Road South Indiana PA 15701
Glicks Bulk and Discount 5381 Hwy 286 E Indiana PA 15701
Martin's Food Markets 1570 Oakland Ave Indiana PA 15701
Stauffer's Market 8273 Rte 56 E Brush Valley PA 15720
Tate's Supermarket 120 4th St. Clymer PA 15747
Valeski 4th Street Bilo 420 Rte 119 North Indiana PA 15701
Walmart 3100 Oakland Ave Indiana PA 15701
Yarnick's Farm Market 155 Thomas Covered Bridge Rd Indiana PA 15701
INDIRECT COMPETITORS
Farmers Markets Various Locations
Indiana County Farmers' Market 8th and Church Indiana PA 15701
Planet Goodness LLC 1012 1st St. Vandergrift PA 15690
DiMaios Market 4077 3rd Street NuMine PA 16244
Trader Joe's 6343 Penn Ave Pittsburgh PA 15206
Whole Foods 5880 Centre Ave Pittsburgh PA 15206

Keystone Development Center 17 December 2015
The blue dots indicate the direct competitors and the red the indirect. There are several convenience stores associated with gas stations in the area that are not included above and could potentially be considered indirect competitors. The spatial analysis (and survey) reveals an area already well served by traditional grocery stores. Though several of the survey respondents are traveling as far as Pittsburgh for better natural food selections.
Store Location Various factors are important to a successful store, including parking and adequate loading/unloading facilities. Beneficial synergies among neighboring retailers are ideal. These are those retailers that appeal to the same type of target customer. These could include bookstores, coffee shops and bakeries. Potential detrimental retailers should also be considered. One example of this would be businesses that, if located too close to the food store, could limit parking. These could include movie theaters, health clubs/gyms, restaurants and bowling alleys. Some discussion has occurred around the now vacant Giant Eagle Express building at 435 South 7th Street. It opened in May 2012 and recently closed. Reasons for the closing have not been made public. The building is vacant and in an ideal location for the food cooperative. It is large, Giant Eagle had 14,000 ft2 of retail area and the building appears to be a total of 34,000 ft2. The following are two screen captures of the site from Google Earth.

Keystone Development Center 18 December 2015
Figure 11: Giant Eagle Express Building
The Steering Committee has strong preferences for the downtown area. Their vision is for the store to be within walking distance from the University. The survey somewhat supports the downtown location with 54% indicating a clear preference for downtown. Please refer to Appendix C for more details. A review of available commercial properties for rent indicates very few available locations in the Indiana area. Any other location discussion is beyond the scope of this study.
Suppliers One of the biggest issues for an operating grocery store is sourcing quality products at the lowest cost. With the cooperative’s mission to sell local foods, this complicates an already complex situation. Local foods tend to mean a small scale so that the store must deal with several suppliers. Grocery stores tend to source their product from food wholesalers and distributors, but local products can mean unorganized, informal distribution. If the project goes forward, vendor lists should be collected and contacts made to begin building the network of sources for the store. Everything else can be right and the store or market will still fail if there is not quality product to sell at a price that consumers can afford. And this will always be a point of economic contention between the cooperative and vendors. For example, with local farm products the farmer needs as much for his/her product as possible – so the farm can be sustainable. The cooperative needs to acquire inventory at as low a price a possible – so members can afford to buy. It is classic economic. One good quality in a general manager is a strong ability to source product and build goodwill. Seasonality is a key driver for local product. The store’s inventory of local products will change with the season. This also presents inventory‐sourcing challenges. Members will have to be made aware that variability in the availability of local products is just the way it is. This challenges the business to keep sales up during the winter months. An analysis of potential local‐food supply was done by using data from the 2012 USDA Census of Agriculture. Data for vegetables, melon, potatoes, sweet potatoes, fruits, tree nuts, and berries is used for the estimation.

Keystone Development Center 19 December 2015
First a table is presented with some agricultural data for approximately 100 miles in all directions. The 100‐mile radius distinction is based upon the definition of local used by locavores. The counties with incomplete data are a result of small data samples.
Figure 12: Vegetable and Fruit Market Value ‐‐ data table
County State
Veg and Fruit
Market Value No. Farms
Allegheny Pennsylvania 3,207,000$ 428
Armstrong Pennsylvania 962,000$ 783
Beaver Pennsylvania 826,000$ 646
Bedford Pennsylvania 8,475,000$ 1,210
Blair Pennsylvania 1,459,000$ 525
Butler Pennsylvania 3,557,000$ 1,061
Cambria Pennsylvania 1,825,000$ 551
Cameron Pennsylvania ‐$ 36
Centre Pennsylvania 2,981,000$ 1,192
Clarion Pennsylvania 1,701,000$ 652
Clearfield Pennsylvania 89,000$ 533
Crawford Pennsylvania 223,000$ 1,351
Elk Pennsylvania 266,000$ 271
Erie Pennsylvania 26,661,000$ 1,422
Fayette Pennsylvania 1,217,000$ 941
Forest Pennsylvania 80,000$ 56
Franklin Pennsylvania 17,045,000$ 1,596
Fulton Pennsylvania 175,000$ 658
Greene Pennsylvania ‐$ 876
Huntingdon Pennsylvania 1,606,000$ 833
Indiana Pennsylvania ‐$ 1,166
Jefferson Pennsylvania 448,000$ 577
Lawrence Pennsylvania ‐$ 659
McKean Pennsylvania 573,000$ 290
Mercer Pennsylvania 1,322,000$ 1,185
Mifflin Pennsylvania 1,694,000$ 808
Somerset Pennsylvania 237,000$ 1,140
Venango Pennsylvania 258,000$ 464
Warren Pennsylvania 889,000$ 602
Washington Pennsylvania 2,120,000$ 1,915
Westmoreland Pennsylvania 1,355,000$ 1,274
Allegany Maryland 249,000$ 291
Garrett Maryland 72,000$ 540
Marion West Virginia 229,000$ 557
Monongalia West Virginia 238,000$ 458
Morgan West Virginia 178,000$ 196
Preston West Virginia 680,000$ 1,084
Taylor West Virginia 43,000$ 404
Total 82,940,000$ 29,231

Keystone Development Center 20 December 2015
Figure 13: Number of Farms by County in Supply Area
The darkest color above is 2,000 farms. There are a total of 29,231 farms in the local product supply area. The following are Vegetable and Fruit Market sales by County on a map.
Figure 14: Vegetable and Fruit Marketing by County

Keystone Development Center 21 December 2015
The analysis indicates that there is agriculture around Indiana. The highest producing counties are at some distance – Erie, Franklin, and Bedford. To offer fresh, local produce year round, the store will need to be proactive. Farmer owned marketing cooperatives is a place to start. This would include Penns Corner Farm Alliance and Tuscarora Organic Growers.
Food Perishability A store that sells fresh food is going to have many perishable products. These include fruits, vegetables, soups, sauces, meats, and prepared foods. There will be a certain amount of loss due to food that goes bad before it can be sold. This should be minimized and documented for tax purposes. To decrease perishability loss, storage and display that maintain supportive environments are essential. Good coolers in both the bulk storage and display cases are important. Staff will need to constantly tend to the product; rotating product in and keeping the area clean are continuous tasks. A decision on how much of the perishable food is moved into better coolers at night needs to be made. If no food is moved, then the display cases need to be able to handle overnight storage. The equipment and employee assumptions in the financial estimate section later in this report allows for good equipment and hopefully enough employees to do the jobs needed. The perishability is not explicitly captured in the model, but inventory estimates are intentionally higher to account for this.
Food Safety Food handling and processing facilities are either recommended or required to have certain food safety programs in place. If the project goes forward, the relevant department within the Pennsylvania government should be contacted for specific requirements. If possible, management and other staff should be trained in ServSafe (a program of the National Restaurant Association) to gain an understanding of foodborne Illnesses and their prevention. The food cooperative should also consider a hazard analysis and critical control points (HACCP) plan. HACCP is a management system based on common sense application of science and technology to identify, evaluate, control and document the safe handling and processing of foods. It covers three types of food safety hazards: 1) biological; 2) chemical; and 3) physical. These hazards might be naturally occurring in food, contributed by the environment or generated by a mistake during processing or handling. A HACCP plan focuses on the prevention of problems throughout the food chain. It is designed to identify and assess potential hazards, determine the critical control points, establish systems to monitor processes and handling and define corrective actions. The plan includes—but is not limited to—operations such as receiving items on a dock, holding product in a cooler, cleaning practices of food surfaces and storage areas and hygiene of employees. Cooperatives that process or repack foods will have a more complex plan than those that are simply receiving and selling.
Leadership A successful cooperative is directly related to the quality of leadership available. The Indiana cooperative has a strong Steering Committee with a diversity of talents represented. There is reason to believe a strong Board of Directors will emerge from the Steering Committee. In addition, the survey indicates a pool of potential members is available for the cooperative. Three hundred indicated they would join the cooperative.

Keystone Development Center 22 December 2015
Development Budget The feasibility determination of a business startup is highly dependent on the development costs. Before a business opens, many things have to happen. The location must be chosen and evaluated, a lease or purchase negotiated, design and layout/design completed, construction done, equipment ordered, employees hired, inventory acquired, marketing plan designed and implemented, and on and on. This all requires significant cash and the loan/equity package will need to be in place before the bulk of the expenses can be incurred. This section covers the estimate of a pre‐opening or development budget. 8 It is necessarily based on many assumptions. The next table lays out the development budget for several categories of expenses along with the estimated amount needed and related assumptions. This is assuming just over 3,000 ft2 total square feet of building use for the food cooperative with the store retail space at 2,100 ft2. While rent is assumed to be forgiven for first three years9, it is estimated to be $13/total square feet or $39,000 per year starting in Year 4. The $13 is based upon currently available commercial rentals in downtown Indiana. Figure 15: Development Budget ‐‐ Food Cooperative
8 The development budget does not include budget estimates for any additional feasibility work, marketing studies, or business plan development as these are assumed to be part of the “pre‐development” or due diligence activities. 9 This will obviously require a landlord sympathetic to the cooperative development effort. Partial motivation for this would come from the improvements to the property made by the cooperative that would add value to the property.
ExpensesEstimated Amount
PromotionsAdvertising (12 weeks prior) $7,500Other promotion expense $3,000
Building Rental
Rent Payments (security deposit) $0 0 Month(s)Six months of rent before opening $0 6 Month(s)
Building Modifications and Equipment
Construction Costs $135,000 $45 Per total ft2*
Equipment $135,000 $45 Per total ft2**
EmployeesGeneral Manager Wages $21,667 5 Month(s)Misc. Employee Wages and Expenses Pre Start up $12,000Full Staff (including GM) $12,924 1 Month(s)
Other Expenses
Inventory $94,500 $45 Per retail ft2
Legal $5,000Accounting $2,000Insurance $3,000Consultants (Store design, architect, etc.) $45,000Software (including CRM/POS) $10,000Interest (six months) $9,000
Operating Capital
Working Capital $81,099 10%Percent of Yr 1
SalesSUBTOTAL $576,690
Over-run Allowance $57,669 10%Percent of Subtotal
TOTAL $634,359
Development Budget
Assumptions

Keystone Development Center 23 December 2015
Most of the categories are self‐explanatory. Several depend on the total or retail square footage in the building. This is why the Revenue Model was done first, to estimate total sales as this allows for an estimate of building size. The construction and equipment costs are estimated using benchmarks based upon square foot assumptions from other food cooperative start‐ups. The assumption is $45 per total square feet for the construction and the equipment. This is a best guess assumption on the cost of rehabbing a building to suit the store needs. The equipment and construction costs total just under $270,000. Some building locations will cost less than this but the overall goal of the feasibility analysis is to use conservative estimates. The budget allows for hiring the General Manager six months before opening and a full staff one month before. Twelve thousand is included for other costs such as employee benefits and possibly a membership coordinator to assist with the equity campaign10. Software purchases of $10,000 are assumed – this is separate from the equipment estimates. There is $45,000 in undesignated consultant fees as the project will likely need additional support in architectural design, marketing, member recruitment, store layout and HACCP plans. This could also be used for board training if needed. In addition, there is $5,000 for legal and $2,000 for accounting. This will all depend on some pro bono and volunteered services. If the cooperative seeks loans from members and the broader community, an Offering Memo will have to be prepared to disclose the business plan and potential risk. This will require additional legal and accounting support. Insurance of $3,000 is assumed in the development budget, since the insurance will need to be in place prior to opening. Operating or working capital is estimated to be 10% of sales and there is also a 10% overrun allowance in the budget. Approximately six months of interest payments for the loan before opening are also included.11 And finally there is a marketing budget of $10,500. This totals to just over $634,000 in projected funds needed prior to opening the business. 12
Debt, Equity, and Members The projected $634,359 will likely come from several sources, including both cooperative members and a commercial lender. There are two basic types of business capital – debt and equity. The actual portfolio is impossible to predict so a basic set of assumptions is used. Note some start‐up projects include potential grants as a source for development. This option is included and summarized below13. The analysis assumes that the cooperative can find one commercial lender who will lend 60% of the development budget at 5% for 5 years. There are many variables in the debt portfolio that can change – percent put down on loan, annual percentage rate, and time to amortize the full 10 Only limited benefits are assumed prior to the store opening. 11 This assumes that the lender only requires interest payments prior to the store opening. 12 Again the costs of feasibility due diligence or pre‐development are not included in this budget. 13 Grant funds are considered as equity because there is no repayment obligation.

Keystone Development Center 24 December 2015
loan. In addition to the primary lender, the cooperative may decide to borrow money from its members and others. If the co‐op borrows from members or the community, this debt would be subordinate to the primary bank debt. The actual debt package will likely be more complex than modeled. However, the simplified structure should reflect the overall cost of capital. The following summarizes the model’s assumptions for needed start‐up capital and the debt: Figure 16: Capital Requirements
With this set of assumptions, the cooperative will need to raise $253,744 from members and other sources to provide collateral for the primary loan. For example, if the membership fee for everyone is $100, then it would require 2,537 members before start up to raise the entire down payment. This would mean that 10% of the households in the PTA would be members. Because this is an unrealistic goal, a different strategy is used. Options for additional capital include member preferred shares, member loans, crowd funding, and member/community grants. After discussion with the SC, an estimate of 500 members paying $100 is used. These are members who join before the store opens. Also, $325,000 in member/community grants are assumed. This is an important assumption and should be carefully considered as realistic. If grants are not available, the strategy for raising the money will have to switch to additional debt or preferred shares. The following table summarizes the equity/secondary debt assumptions used in the analysis for the food cooperative. This lays out membership assumptions for the first five years. Membership fees increase after the store opens. Figure 17: Equity and Debt Assumptions ‐‐ 5 Years
loan length -- (years) 5Fund Usage Amount
Construction Costs $135,000Equipment $135,000Operating Capital (Cash) $81,099Inventory for Start up $94,500Other Pre-opening Expenses $188,760
Total Capital Needed $634,359Equity Required For Primary Loan $253,744
Total Borrowed $380,615
Equity-down payment 40%Interest Rate--Long Term 5%
Assumptions
Equity Calculations Pre-opening 1 2 3 4 5No. New Members 500 200 150 150 150 100Total Members 500 700 850 1,000 1,150 1,250
Membership Fee $100 $150 $150 $150 $150 $200
New Equity -- Members $50,000 $30,000 $22,500 $22,500 $22,500 $20,000
Member/Community Grants $325,000
Total New Member and Equity $375,000 $30,000 $22,500 $22,500 $22,500 $20,000
Total Member Equity Contributions $375,000 $405,000 $427,500 $450,000 $472,500 $492,500

Keystone Development Center 25 December 2015
The membership fee is $100 pre‐opening and then it increases to $150 in Year 1‐4 and $200 in Year 5. This is an ambitious goal for membership. In all most all cases, the single greatest barrier to business feasibility is raising of adequate capital. This is further discussed in the section covering cash flow. The analysis assumes that $325,000 is raised as grants that go into the co‐op’s cash. This is a risky assumption for feasibility. However, there are experienced grant writers on the Steering Committee and the local borough is supportive of the start‐up. This significantly increases the probability of success in obtaining grants.
Financial Analysis of Feasibility The projections of the financial feasibility of the cooperative business include several components and assumptions, some of which have already been discussed. A detailed model of the proposed business was developed to investigate the feasibility. Because the business does not exist, a model is the only way to proceed with the financial analysis. Pro forma financial statements are the end product of the model. A summary of these are presented at the end of this section. Appendix B contains the datasheets used in the projections and the final financial statements that are not elsewhere presented. The statements for Year 1 include a Month‐by Month Profit‐loss or Income Statement and Cash‐flow Analysis along with three Balance Sheets (pre‐opening, at beginning of Year 1 and end of Year 1). The next sections cover the major elements of the financial model, including details on the underlying assumptions (those not already discussed) for the first‐year estimation. This is a month‐by‐month model for the first year. It is then followed by 5‐year projections.
Sales Potential revenue was estimated in an earlier section and is based upon projections of PTA and STA sales. Important data in the calculation included the number of households in the PTA and the average at‐home‐food expenditures. The cooperative was assumed to gain a 28% market share of available grocery dollars. The benchmark estimate is $16,305 per week in potential food co‐op sales. For the analysis going forward, $18,000 per week in sales is assumed. This is slightly more than the previous estimation. The increase is primarily based on the survey results and the competitor analysis. The following table gives a quick reality check on the underlying numbers needed to support $18,000 per week in sales. These are based on the numbers hours the store is open (details later) and an assumption on average transaction amount. This average transaction amount is only used to ballpark the number of people/hour required to meet sales projections.
Keystone Development Center 26 December 2015
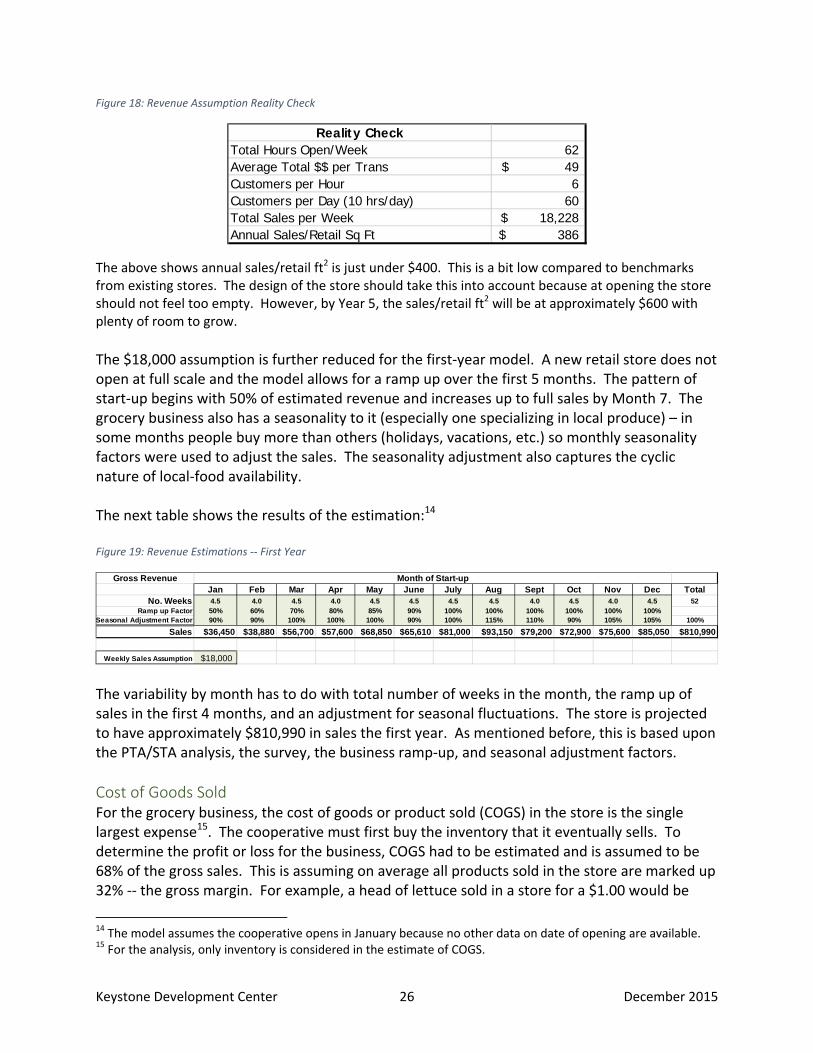
Figure 18: Revenue Assumption Reality Check
The above shows annual sales/retail ft2 is just under $400. This is a bit low compared to benchmarks from existing stores. The design of the store should take this into account because at opening the store should not feel too empty. However, by Year 5, the sales/retail ft2 will be at approximately $600 with plenty of room to grow.
The $18,000 assumption is further reduced for the first‐year model. A new retail store does not open at full scale and the model allows for a ramp up over the first 5 months. The pattern of start‐up begins with 50% of estimated revenue and increases up to full sales by Month 7. The grocery business also has a seasonality to it (especially one specializing in local produce) – in some months people buy more than others (holidays, vacations, etc.) so monthly seasonality factors were used to adjust the sales. The seasonality adjustment also captures the cyclic nature of local‐food availability. The next table shows the results of the estimation:14 Figure 19: Revenue Estimations ‐‐ First Year
The variability by month has to do with total number of weeks in the month, the ramp up of sales in the first 4 months, and an adjustment for seasonal fluctuations. The store is projected to have approximately $810,990 in sales the first year. As mentioned before, this is based upon the PTA/STA analysis, the survey, the business ramp‐up, and seasonal adjustment factors.
Cost of Goods Sold For the grocery business, the cost of goods or product sold (COGS) in the store is the single largest expense15. The cooperative must first buy the inventory that it eventually sells. To determine the profit or loss for the business, COGS had to be estimated and is assumed to be 68% of the gross sales. This is assuming on average all products sold in the store are marked up 32% ‐‐ the gross margin. For example, a head of lettuce sold in a store for a $1.00 would be
14 The model assumes the cooperative opens in January because no other data on date of opening are available. 15 For the analysis, only inventory is considered in the estimate of COGS.
Reality CheckTotal Hours Open/Week 62 Average Total $$ per Trans 49$ Customers per Hour 6 Customers per Day (10 hrs/day) 60 Total Sales per Week 18,228$ Annual Sales/Retail Sq Ft 386$
Gross RevenueJan Feb Mar Apr May June July Aug Sept Oct Nov Dec Total
No. Weeks 4.5 4.0 4.5 4.0 4.5 4.5 4.5 4.5 4.0 4.5 4.0 4.5 52Ramp up Factor 50% 60% 70% 80% 85% 90% 100% 100% 100% 100% 100% 100%
Seasonal Adjustment Factor 90% 90% 100% 100% 100% 90% 100% 115% 110% 90% 105% 105% 100%
Sales $36,450 $38,880 $56,700 $57,600 $68,850 $65,610 $81,000 $93,150 $79,200 $72,900 $75,600 $85,050 $810,990
Weekly Sales Assumption $18,000
Month of Start-up

Keystone Development Center 27 December 2015
purchased by the co‐op for $.68. The assumption is based on discussions with various individuals who have experience with food cooperatives and reviewing available estimates of grocery gross margins by department.
Employees In addition to the cost of the goods sold, another major cost of store operations is labor. Employee numbers and wage assumptions are summarized in the following table. Additional labor expenses that include unemployment benefits, payroll taxes and health benefits are discussed next. The next table is just the wages. Figure 20: Employee Assumptions
Employees are broken into two categories – Hourly or Production and Administrative. The administrative employees tend to be salaried though the calculations are projected at a per hour rate for ease of reference and calculation. The assumptions include a full‐time manager; 1 Assistant Manager working 10 hours per week; 1 office assistant working 20 hours; 3 check‐out employees working 30 hours per week; 1 Produce/Dept. Manager working 20 hours per week; two food‐prep employees (for the Deli); and various others as detailed above. Hourly assumptions are believed to be competitive for the area. The Manager of the food cooperative is assumed to make $52,000 per year. To some this might seem high, but the position requires a highly skilled person. It is a critical position and one that can lead to success or failure of the business enterprise. The number of check‐out employees was calculated based on the number of hours the store is open. The next table presents a possible store schedule. It is based upon the hours other specialty food markets in the area are open. Note that for this analysis, the important number is 62 hours per week and the exact opening and closing times are not critical.
Employee Numbers Wage/Hr
No. Hours per Week
per PersonTotal Per
WeekTotal Per
MonthTotal Per
Year
Hourly or Production Employees
Annual Wage/Perso
nCheck out 3 $8.00 30 $720 $3,120 $37,440 12,480$ Produce/Dept. Manager 1 $9.00 20 $180 $780 $9,360 9,360$ Food Prep 2 $7.50 30 $450 $1,950 $23,400 11,700$ Stockers 1 $7.25 20 $145 $628 $7,540 7,540$ Janitorial 1 $7.25 30 $218 $943 $11,310 11,310$
SubTotal 8 $1,713 $7,421 $89,050
Administrative EmployeesManager 1 $25.00 40 $1,000 $4,333 $52,000 52,000$ Assistant Manager 1 $10.00 10 $100 $433 $5,200 5,200$ Office Assistant 1 $8.50 20 $170 $737 $8,840 8,840$
SubTotal 3 $1,270 $5,503 $66,040
TOTAL 11 $2,983 $12,924 $155,090

Keystone Development Center 28 December 2015
Figure 21: Potential Store Hours
The staffing assumption includes 90 hours of check‐out employee time per week allowing for at least one checker to be on duty during busy times and two for almost 30 hours a week. If more check‐out staff is needed, arrangements should be made for employees assigned to other tasks to work a checkout lane. For the Manager, 40 hours are assumed with an Assistant Manager at 10, and Produce Manager at 20. This allows for 70 hours of management to cover all the hours when the store is open. Someone in a supervisory capacity should be there for all the hours the store is open ‐‐ so coordination will be needed to fulfill this requirement. Obviously the exact configuration of employees/hours will vary based on decisions made later in the project. For example, an individual employee might work fewer hours and therefore there would be more employees. Hopefully, the above numbers capture an approximate cost of the labor for running the store. The employee numbers and wages outlined above are reflective of a minimal all‐paid staff. However, some food co‐ops rely on volunteers to help staff the store. If the Indiana PA Food Cooperative were to use volunteers, this could potentially allow for increased wages of the paid employees. Better wages can lead to improved employee satisfaction and retention, though managing volunteers comes with its own challenges. These challenges include managing the volunteers (no‐show rates can be high) and potential conflicts with IRS regulations regarding non‐compensated workers. For health benefits, 15% of gross wages is used as an estimate for all employees. This would be put toward health insurance benefits. In addition to the 15% health insurance, worker’s compensation and unemployment benefits are also included ‐‐ based upon dollars of salary and job classification. These are based on actual costs and are detailed in the Monthly Profit Loss statement in a following section.
Rent and Utilities Utilities are a bit of a “shot in the dark.” With the location unknown, utility information is not available. The model assumes that the Electric and Heat together are $18,000 for the first year. The actual mix will vary by season since air conditioning will be electric and thus there will be no heating expense. The coolers will use a significant amount of electric year round. Rent is assumed to be contributed for the first three years. After that it is $39,000 per year exclusive of gas/electric but inclusive of water/sewer.
Store Hours Time OpenNumber of Hours
Total Hours Open/wk
Mon Closed 0 62Tues 8:00 am to 7:00 pm 11Wed 8:00 am to 7:00 pm 11
Thurs 8:00 am to 7:00 pm 11Fri 8:00 am to 7:00 pm 11Sat 8:00 am to 7:00 pm 11Sun 9:00 am to 4:00 pm 7

Keystone Development Center 29 December 2015
Depreciation Depreciation is the method of allocating the cost of a tangible asset over its useful life. This is a noncash expense as the value of an asset is reduced as a result of wear and tear, age, or obsolescence. Most assets lose their value over time (in other words, they depreciate), and must be replaced once the end of their useful life is reached. Businesses depreciate long‐term assets for both tax and accounting purposes. For accounting purposes, depreciation indicates how much of an asset’s value has been used up. For tax purposes, businesses can deduct the cost of the tangible assets they purchase as business expenses; however, businesses must depreciate these assets in accordance with IRS rules about how and when the deduction may be taken based on what the asset is and how long it will last. For this model, the depreciation is assumed to be straight line, or the same amount of depreciation is charged for each period. The equipment cost of $135,000 is depreciated over 7 years and half of the construction cost ($135,000/2=$67,500) is depreciated over a 20‐year period. Only half of the renovation cost is depreciated since knowing what the renovations will be and if what is done is a depreciable event for the cooperative business is difficult. Depending on actual events this might change. Annual depreciation is calculated as $22,661.
Information Technology The modern food cooperative needs to allow for efficient check‐out and information gathering. A POS (point of sale) system is crucial. Data should be available to allow management to analyze trends (weekly, monthly, quarterly, annual, and year‐over‐year). One of the largest cash drains on the business will be “shrink” of the inventory. This can happen through theft, but mostly through spoilage. The basic inventory unit is a SKU (Stock‐keeping Unit). Data on the SKU level allow for monitoring of performance. Low margin products should be monitored carefully for their overall contribution to sales. The traditional loss‐leader product of milk comes to mind. Products with a short shelf life are critical to control (and conversely the shelf stable items least critical). Coolers and storage units will need to be constantly monitored. The business will probably accept electronic payments. There may be discounts associated with membership. A security system will be needed. This all leads to a relatively high‐technology environment. The financial analysis allows for $100/month in computer/IT/website expense. Hopefully one of the employees or board members will also have IT expertise to help keep these costs low. The development budget should cover the cost of purchase and set up.
Credit Card Fees and Sales Tax The cooperative is assumed to take credit cards which have an accompanying fee from the credit card company, i.e. Visa and MasterCard. The transaction fee is assumed to be 3% and that 80% of the sales transactions will be via credit card. This was done with a straight

Keystone Development Center 30 December 2015
calculation of total sales times 80% times 3%. Without knowing more about the percent of customers using a credit card to pay for purchases, this is a best “guess” estimate. Note the credit card estimate does not include any sales tax that might also be charged on the credit card. Sales tax is assumed to have a zero impact in the financial model and is not included in this pro forma model. To do otherwise, complicates an already complicated model and does not add any significant insight into the analysis. Sales tax will be collected on the taxable items and this same amount will be paid out. This means that the cooperative will actually handle more cash than is tracked in the cash‐flow analysis.
Insurance and Other Expenses Insurance was lumped into one category – Insurance – inclusive. This includes projections for general liability/business interruption and property/equipment insurance. They are estimated at $2,400 annually. The Income Statement (a summary of the business’ sales and expenses over time) in Appendix B shows all the assumed expenses for the various categories and this section highlights expenses not yet mentioned. Monthly expenses for marketing, accounting, legal expenses, etc. are “best guess” estimates. Marketing expenses are estimated to be $6,000 per year. In addition, miscellaneous categories for both operating and administrative expense categories are included to catch anything underestimated or missed. These two total $2,400 per year and are for unforeseen expenses. This is a good hedge against something forgotten or under estimated. Please note that the development budget also allowed for $57,669 in cost over‐runs. The overrun amount is important as this type of project often has unforeseen expenses. General maintenance and repair expenses are estimated to be $2,400 per year. Maintenance costs include the upkeep of parking lots, flooring, and carts/baskets.
Income Statement and Net Profit (Loss) The previous calculations and assumptions are used to populate the Income Statement. This is also called the Operating Statement or the Profit/Loss Statement. It is a summary over time of the revenues and expenses of the business. An Income Statement for the first year of start‐up, broken out by months was produced. This is a large and complex table and is not reproduced in this section; please refer to Appendix B. The following graph shows sales, expenses, and net profit on a month‐by‐month basis for the first year. Skip ahead to the table summarizing the 5 years of projections to see more on the structure of the data.

Keystone Development Center 31 December 2015
Figure 22: Revenue and Net Profit by Month for First Year of Startup
Initially the store sales are in ramp‐up and then in spring/summer sales pick up. They dip a bit in June, mostly because it is a 4‐week month. Sales peak in August at height of local growing season. There is a bit of a slump and then sales begin to pick up around Thanksgiving and Christmas. The orange bar is the profit. The business loses money in the first year as it moves toward full scale operations. The model predicts a net loss of just over $48,000. It is not unusual for a business to lose money the first year. This highlights the need to have ample cash on hand at start up. More on this will be discussed in a later section. When reviewing the financial projections for a cooperative, one should keep in mind that the economic forces on a cooperative tend to drive the business to operate at zero profit. Since the owners are also the customers who shop at the cooperative they want to pay as little for their food as possible and tend to discount their share of any business profit. With profit tending toward zero, a key metric is whether the business maintains a healthy cash balance. Important is whether the business will have enough cash on hand to keep bills paid. The next section on the cash flow analysis attempts to answer this question.
Cash‐Flow Analysis The following graph presents the cash‐flow analysis for the business in its start‐up year. This attempts to determine whether the business can meet its expenses. A business that cannot pay its bills and meet payroll in a timely manner has no chance of success. The detailed table of cash sources and uses is included in Appendix B. The following graph tracks the end of month cash balance for the first year. It assumes an opening balance in the checking account of $67,583 and that the inventory, which begins at $94,500, is maintained at a constant rate. The cost of inventory is estimated at 68% of gross sales. Sales taxes are assumed to be cash neutral

Keystone Development Center 32 December 2015
– collected at the register and put into a separate checking account16. There is no payment of business and income taxes because the business shows a loss for the first year. Additional membership capital (from members joining after opening) is estimated at $30,000. It is assumed to come in evenly over the 12 months. Figure 23: Monthly Cash Balance for First Year Start up
As is expected from the previous discussion, the business draws heavily on its cash in the first year. This is normal for a start‐up and lack of adequate start‐up capital to offset this is one of the primary reasons new businesses fail. The assumptions for start‐up capital already discussed assure that the business will have adequate cash to get it through the first year. But what about the next four years? The co‐op will have borrowed a significant amount with a 5‐year payback from a commercial lender. Principle and interest payments will put a strain on cash. The first five years will be cash intensive and the only way the business will succeed will be to keep an adequate amount of in‐coming cash. The need to reach sales goals and raise additional equity overall five years is clear. The costs of inventory and personnel are the other major cash demands. As the business ramps up, more cash goes out than is covered by sales or new equity. The starting cash balance is $81,099 and an additional $20,000 is added from the reserve checking17 to cover outflow. quickly declining to $38,836 by Month 12. Cash drains that are not explicitly captured in this model (other than through conservative estimates), but are often a re‐occurring problem in a food cooperative, include product theft
16 This account is not part of the cash flow analysis as no funds in the account would be available for purposes other than paying the sales tax. 17 The overrun allowance and cash raised over the development costs is assumed to be put in a reserve checking account. This is outside the regular business model and funds are transferred into the general operating account as needed.

Keystone Development Center 33 December 2015
(both customers and employees), cash theft (employees), waste/spoilage of food and products, and excessive utility costs. They are real but beyond the scope of this financial model. The question now is whether the cooperative can survive for 5 years. The following sections explains how the estimates for Year 1 were used to project the business out for 5 years and the resulting cash‐flow analysis.
Five Year Projections and Business Sustainability The analysis now turns to the 5 year projections of the business. Once the first year is modeled, the 5 year projections are mostly generated by simple growth formulas for sales and expenses. Two items not covered by this technique include the principal and interest payments for the debt ‐‐ actual amortization amounts are used. Over the 5 years, sales are assumed to grow 11% each year and general expenses 3%. Cost of food sold remains at 68% of sales. Assumed is that the staff from Year 1 can handle the store up to Year 5 so there are no planned additional hires. Production labor costs are allowed to increase 5% each year, allowing for a modest salary increase for the original staff or possibly additional hours. The administrative staff expense is assumed to increase 3% each year, which is basically a small cost of living adjustment.
Net Profit/Loss – 5 Years All of the above assumptions are collapsed into a set of Annual Projections for the business – see Appendix B for the tables. The following graph shows net loss projections (before taxes) over the 5 years of the model:
Figure 24: Five Year Losses
The business shows a slight improvement in net losses until Year 3 then in Year 4, losses increase again. This is primarily due to the beginning of rent payments in Year 4. Most analysts like to see a business profitable by year 3 and this business shows no profitability until Year 5. After Year 5, the primary debt will be paid off and the store should show a significant

Keystone Development Center 34 December 2015
increase in profitability. The next table is the detailed Income Statement for the five years of projections:
Figure 25: Income State Summary ‐‐ 5 Years
The following table summarizes the assumptions used to project the model out 5 years:
1 2 3 4 5Revenue Schedule: Sales $810,990 $900,199 $999,221 $1,109,135 $1,231,140
Gross Sales $810,990 $900,199 $999,221 $1,109,135 $1,231,140
Cost of Goods Sold: Inventory $551,473 $612,135 $679,470 $754,212 $837,175Total Cost of Goods Sold $551,473 $612,135 $679,470 $754,212 $837,175
Personnel Expense Wages -- nonadmin $89,050 $93,503 $98,178 $103,087 $108,241Insurance--Workers' Comp -- nonadmin $5,343 $5,610 $5,891 $6,185 $6,494Employee Benefits -- nonadmin $13,358 $14,025 $14,727 $15,463 $16,236Payroll Taxes -- nonadmin $7,124 $7,480 $7,854 $8,247 $8,659Wages -- admin $66,040 $68,021 $70,062 $72,164 $74,329Workers' Comp -- admin $660 $680 $701 $722 $743Payroll Tax - -admin $5,283 $5,442 $5,605 $5,773 $5,946Employee Benefits -- admin $9,906 $10,203 $10,509 $10,825 $11,149Total Personnel Expense $196,764 $204,965 $213,526 $222,465 $231,798
Occupancy Expense Rent $0 $0 $0 $39,000 $39,000Electric $8,400 $8,652 $8,912 $9,179 $9,454Fuel--Heating $9,600 $9,888 $10,185 $10,490 $10,805Insurance--Inclusive $2,400 $2,472 $2,546 $2,623 $2,701Pest Control $960 $989 $1,018 $1,049 $1,080Trash Removal $600 $618 $637 $656 $675Water & Sewer $0 $0 $0 $0 $0Repair and Maintenance $2,400 $2,472 $2,546 $2,623 $2,701Total Occupancy Expense $24,360 $25,091 $25,844 $65,619 $66,417
Depreciation/Amortization Interest on Debt $17,470 $13,954 $10,258 $6,373 $2,290Depreciation $22,661 $22,661 $22,661 $22,661 $22,661Total Depreciation/Amortization $40,131 $36,615 $32,919 $29,034 $24,950
Operating Expense Supplies--cleaning, etc $1,200 $1,236 $1,273 $1,311 $1,351Credit Card Fees $19,464 $21,605 $23,981 $26,619 $29,547Bags $1,200 $1,236 $1,273 $1,311 $1,351Labels for pricing $960 $989 $1,018 $1,049 $1,080Deli Packaging $9,600 $9,888 $10,185 $10,490 $10,805Telephone $1,200 $1,236 $1,273 $1,311 $1,351Other -- Operating $1,200 $1,236 $1,273 $1,311 $1,351
Total Operating Expenses $34,824 $37,426 $40,277 $43,404 $46,835
Administrative Expense Accounting $1,200 $1,236 $1,273 $1,311 $1,351Payroll Service $1,200 $1,236 $1,273 $1,311 $1,351Computer/Internet/Website Expense $1,200 $1,236 $1,273 $1,311 $1,351Legal Expenses $240 $247 $255 $262 $270Marketing--Ads, etc. $6,000 $6,180 $6,365 $6,556 $6,753Office Supplies $600 $618 $637 $656 $675Other -- Admin $1,200 $1,236 $1,273 $1,311 $1,351Total Admin $11,640 $11,989 $12,349 $12,719 $13,101
Total Operating Costs $859,192 $928,220 $1,004,384 $1,127,452 $1,220,277
Net Profit -$48,202 -$28,021 -$5,163 -$18,317 $10,863Income Taxes $0 $0 $0 $0 $4,345
EBITDA -$8,071 $8,594 $27,756 $10,717 $40,158
Year of Operation

Keystone Development Center 35 December 2015
Figure 26: Assumptions for 5 Year Projections
Cash‐flow – 5 Years Again, one of the big questions is what about the cash flow? Can the business generate enough cash to keep the bills paid? The profit calculation does not include principal payments on debt so a business can show a profit on paper but still fail because the cash available is not adequate. Mostly, cash is acquired by the cooperative through sales. It can also be augmented by adding new members, taking on additional debt or through additional grants. Assumptions used for additional equity and debt were already presented in the section Debt, Equity, and Members. The following figure shows the balance of the cash account as of the end of the year indicated. As explained before, the cash balance is dependent on the sources (sales + equity + reserve cash + new debt) and uses (total expenses + taxes) of the cash.
Figure 27: Projected Cash Balance ‐‐ 5 Years
With the previously described assumptions for new members and member loans, the cash holds through Year 5. Although the balance is down to just over $3,000 at the end of Year 5, though there is just under $14,000 left in the reserve cash account. The pattern is influenced
Assumptions COFS (% of Gross Sales) 68%Gen Exp Growth 3%Production Employee Exp Growth 5%Admin Employee Growth 3%Sales Growth 11%

Keystone Development Center 36 December 2015
by cash infusions from the reserve cash account18, new member assumptions and the beginning of rent payments in Year 4. The one positive thing is that in Year 5 the primary loan is paid off and after that interest/principle payments will decrease significantly. The business needs to make it through the first five years and, if the cooperative can raise the assumed capital, this model shows it can do that.
Balance Sheet Balance Sheets summarize the assets, liabilities, and equity of a business at a point in time. A Balance Sheet at the development stage of the business when assets and equity are poised for start‐up was the initial schedule generated. Then a Balance Sheet at start‐up and another at the end of the first year of operation were estimated. This is followed by a summary schedule showing the basic Balance Sheets for the business over the 5 years of projections. Please see Appendix B for additional schedules. The following presents the projected (as of yearend) Balance Sheets for the first five years of operations:
18 The reserve cash account contains the extra money raised over the development budget ($121,256) and the overrun allowance. At opening it has a total of $178,925. It is assumed to be paid into general operations at the rate of $20K in Year 1, $70K in Year 2, $30K in Year 3, $30K in Year 4, and $15K in Year 5. One can argue that the overrun allowance might indeed be needed for that in the pre‐opening period. This model assumes it is not needed and provides additional cash for the reserve account.

Keystone Development Center 37 December 2015
Figure 28: Five‐Year Balance Sheet Summary
The total assets of the business drop nearly $270,000 over the 5 years, this is due to both a loss of cash and the depreciation. Total Equity decreases just under $6,000 over the 5 years of projections.
Feasibility of Food Cooperative The findings of this study are that the project under the assumptions as detailed is cautiously feasible. First a recap of the assumptions and major drivers of the project. The following is a set of critical numbers based upon the model assumptions. These are key metrics for the start‐up.
Recap Equity and Capital ‐‐ Startup
Members at Startup: 500 Join Fee: $100 Grants: $325,000 Total Equity at Startup: $375,000 Commercial Loan: $380,615
Assets: 1 2 3 4 5Current Assets
Cash $36,836 $51,737 $45,801 $22,826 $3,101Accounts Receivable $0 $0 $0 $0 $0Inventory $94,500 $94,500 $94,500 $94,500 $94,500Reserve Account $158,925 $88,925 $58,925 $28,925 $13,925
Total Current Assets $290,261 $235,163 $199,226 $146,251 $111,527
Long Term AssetsDepreciable Assets $270,000 $247,339 $224,679 $202,018 $179,357Accumulated Depreciation $22,661 $22,661 $22,661 $22,661 $22,661Net Depreciable Assets $247,339 $224,679 $202,018 $179,357 $156,696Non-Depreciable Assets $0 $0 $0 $0 $0
Total Long-Term Assets $247,339 $224,679 $202,018 $179,357 $156,696
Total Assets $537,601 $459,841 $401,244 $325,608 $268,223Liabilities & Equity:
Current LiabilitiesCost of Sales A/P $0 $0 $0 $0 $0Short-term Debt $0 $0 $0 $0 $0
Total Current Liabilities $0 $0 $0 $0 $0
Debt $311,893 $239,655 $163,721 $83,902 $0
EquityStock & Paid-in Capital $273,909 $296,409 $318,909 $341,409 $361,409Equity Loss or Gain (accum as of prev Yr.) $0 -$48,202 -$76,223 -$81,386 -$99,704Equity Loss or Gain (this Yr.) -$48,202 -$28,021 -$5,163 -$18,317 $6,518
Total Equity $225,707 $220,186 $237,523 $241,706 $268,223
Total Liabilities & Equity $537,601 $459,841 $401,244 $325,608 $268,223
Year of Operation (as of End of Year)

Keystone Development Center 38 December 2015
Operations
Average Total $$ per Trans: $ 49 Customers/Day (10 hrs/day): 60 Sales per Week: $18,000 Cost of Goods Sold: 68%
Development
Building Total Square Feet: 3,000 $/Ft2 Rent: Free for first 3 years, $13 thereafter
Sensitivity As has been stated several times, the financial estimates and tables are based upon many assumptions. The best possible data were gathered under the constriction that this is a pro bono study and only limited resources are available for data collection. This section allows some of the key assumptions to change with a look at what it does to business viability19. First the cost of inventory is allowed to vary from 68% to 70%. If this happens, the business is out of cash in Year 4, unless something else changes in the assumptions. The cost of doing business is too high. Business sustainability is highly dependent on the cost of the inventory. This model predicts that the business will flounder if the ability to price product at a 32% markup (average across all products) is not supported by the market. Next the sensitivity to employee numbers is explored. If another checker at 30 hours is added, the cash‐flow can NOT stand the additional drain and it will be negative by Year 4. Employees are expensive and have a significant impact on the sustainability of the business. The membership assumptions are also critical for feasibility as this translates into cash available. If membership numbers vary by 100 fewer than assumed in Year 1, the cash flow becomes negative in Year 5. Additional equity from membership fees is critical to helping the business survive in the first few years. The picture that emerges from the sensitivity analysis is that the model is fairly close to equilibrium. Any movement in one of the major variables sends the business into infeasibility. This is totally expected as the model presented is intentionally balanced at the cusp of feasibility to minimize the amount of start‐up capital needed. Remember that the grocery industry is a “small margin” industry. The financial stability of almost any food store is tenuous at best. There appears to be enough feasibility potential to proceed into further business planning. The true test will come when the membership drive kicks into full gear. The co‐op needs 500 founding members to move forward. Another big assumption is grants of $325,000 for start‐up capital. When money is required, will the community and donors step up?
19 Note that in the sensitivity analysis, using the reserve cash differently that already assumed was not explored. Possibly a reallocation could prolong the business.

Keystone Development Center 39 December 2015
Next Steps Decide if the project is going forward based on the results of the feasibility analysis. Does the
vision remain the same? If the project is going forward, then consider moving forward with the following steps
Incorporate the business.
Expand the initial feasibility work with a more detailed market study to confirm potential sales.
Start the business planning process. This should involve a detailed timeline that specifically articulates milestones for the equity drive and development. Most food cooperative development efforts require at least 3 to 5 years. Plan for this.
Conceptualize and Operationalize the Equity Drive – members are going to buy “why” it is happening, so remember to keep the “why of it” out there.
A. Devise a community outreach program. How are members going to be recruited? B. Build membership numbers. C. Work on grant sources and begin to submit proposals.
Investigate potential lending options and determine what primary loan packages might be available.
Evaluate potential sites for the business. A decision should be made as to what point in the equity/capital raising process, the building will be rented.
Build a vendor list and begin making contacts with local producers.
Further evaluate the employee plan against additional data collected on prevailing wages and labor availability.
Clarify the organization’s financial structure to be sure cash in and out has adequate authorization and is tracked.
Continue to develop the organization – incorporate, elect a Board of Directors, develop by‐laws and policies, etc.
Monitor the competition. Who is entering market? Is anything changing in the competitor environment?

Keystone Development Center 40 December 2015
Appendix A: Limiting Conditions
Indiana Food Co‐op Feasibility Report – December 2015
1. The analyses, opinions, and conclusions in this report are limited by the reported assumptions and limiting conditions, and are unbiased professional analyses, opinions, and conclusions.
2. Our engagement in this assignment was not contingent upon developing or reporting
predetermined results.
3. Neither Keystone Development Center nor its professional staff has any present or prospective interest in the project that is the subject of this report, and has no interest or bias with respect to the parties involved.
4. Our compensation is not contingent upon development or reporting of a predetermined
feasibility or direction of feasibility that favors the cause of the client, the feasibility of the project, the attainment of a stipulated result or the occurrence of a subsequent event directly related to the intended use of this report.
5. One individual provided significant professional assistance to this report: Cathy A. Smith, Ph.D.
was the analyst for the project and the sole author of the final report. This feasibility analysis is subject to the following limiting conditions:
1. Future services regarding the subject matter of this report, including, but not limited to, testimony or attendance in court, shall not be required of the Keystone Development Center, unless previous arrangements have been made in writing.
2. This report and the conclusions arrived at herein are for the exclusive use of our client for the
sole and specific purposes as noted herein. The report and conclusions are not intended and should not be construed to be investment advice.
3. In the event this analysis is used for financing or tax purposes, no responsibility is assumed for
the inability to negotiate favorably on the basis of the feasibility expressed herein.
4. Our liability to you for any claim against our organization, or its employees, or its agents is limited to an amount equal to the total of our billings to you for this assignment. The laws of the Commonwealth of Pennsylvania will govern this agreement. All disputes between us which cannot be settled shall be resolved through binding arbitration in accordance with the rules for resolution of commercial disputes then in effect of the American Arbitration Association, and judgment upon the award may be entered with any court having jurisdiction thereof.

Keystone Development Center 41 December 2015
Appendix B – Food Cooperative Financial Tables (These are the schedules not already included in the text)
1. Five Year Cash‐flow 2. First Year Cash flow 3. First Year Profit/Loss 4. Equity and Debt Summary 5. Balance Sheet – Development 6. Balance Sheet – Opening 7. Mortgage Amortization – primary debt 8. Revenue Model Background Calculations

Cash Flow StatementFive Years
1 2 3 4 5Starting Cash $81,099 $36,836 $51,737 $45,801 $22,826
Sources
Cash Sales $810,990 $900,199 $999,221 $1,109,135 $1,231,140Cash from Reserves $20,000 $70,000 $30,000 $30,000 $15,000Rental Income $0 $0 $0 $0 $0Short-term Loan Proceeds $0 $0 $0 $0 $0Preferred Stock $0 $0 $0 $0 $0Long-Term Loan Proceeds $0 $0 $0 $0 $0Equity Capital Proceeds $30,000 $22,500 $22,500 $22,500 $20,000
Total Souces $860,990 $992,699 $1,051,721 $1,161,635 $1,266,140
UsesCost of Goods Sold $551,473 $612,135 $679,470 $754,212 $837,175Payroll & Related $196,764 $204,965 $213,526 $222,465 $231,798Occupancy Expense $24,360 $25,091 $25,844 $65,619 $66,417Debt Principal Payments $68,722 $72,238 $75,934 $79,819 $83,902Interest $17,470 $13,954 $10,258 $6,373 $2,290Operating Expenses $34,824 $37,426 $40,277 $43,404 $46,835Admin Expenses $11,640 $11,989 $12,349 $12,719 $13,101Purchase Depreciable Assets $0 $0 $0 $0 $0Purchase Non-Depr. Assets $0 $0 $0 $0 $0Dividends, Owner Pay-outs $0 $0 $0 $0 $0Total Uses Before Taxes $905,253 $977,797 $1,057,657 $1,184,610 $1,281,519Income Taxes $0 $0 $0 $0 $4,345
Total Uses After Taxes $905,253 $977,797 $1,057,657 $1,184,610 $1,285,864
Net Change in Cash (44,263)$ 14,901$ (5,936)$ (22,975)$ (19,724)$ Ending Cash Position $36,836 $51,737 $45,801 $22,826 $3,101
Year of Operations
Keystone Developoment Center Appendix B: Page 1 December 2015

Cash Flow StatementFirst Year Start-up
1 2 3 4 5 6 7 8 9 10 11 12Starting Cash $81,099 $85,898 $73,308 $64,101 $57,052 $51,441 $44,872 $42,857 $44,439 $43,784 $39,372 $37,651
Sources
Cash Sales $36,450 $38,880 $56,700 $57,600 $68,850 $65,610 $81,000 $93,150 $79,200 $72,900 $75,600 $85,050Cash from Reserves $20,000 $0 $0 $0 $0 $0 $0 $0 $0 $0 $0 $0Rental Income $0 $0 $0 $0 $0 $0 $0 $0 $0 $0 $0 $0Short-term Loan Proceeds $0 $0 $0 $0 $0 $0 $0 $0 $0 $0 $0 $0Long-Term Loan Proceeds $0 $0 $0 $0 $0 $0 $0 $0 $0 $0 $0 $0Equity Capital Proceeds $2,500 $2,500 $2,500 $2,500 $2,500 $2,500 $2,500 $2,500 $2,500 $2,500 $2,500 $2,500
Total Souces $58,950 $41,380 $59,200 $60,100 $71,350 $68,110 $83,500 $95,650 $81,700 $75,400 $78,100 $87,550
UsesCost of Goods Sold $24,786 $26,438 $38,556 $39,168 $46,818 $44,615 $55,080 $63,342 $53,856 $49,572 $51,408 $57,834Payroll & Related $17,028 $15,136 $17,028 $15,136 $17,028 $17,028 $17,028 $17,028 $15,136 $17,028 $15,136 $17,028Occupancy Expense $2,030 $2,030 $2,030 $2,030 $2,030 $2,030 $2,030 $2,030 $2,030 $2,030 $2,030 $2,030Debt Principal Payments $5,597 $5,620 $5,644 $5,667 $5,691 $5,714 $5,738 $5,762 $5,786 $5,810 $5,834 $5,859Interest $1,586 $1,563 $1,539 $1,516 $1,492 $1,468 $1,445 $1,421 $1,397 $1,372 $1,348 $1,324Operating Expenses $2,155 $2,213 $2,641 $2,662 $2,932 $2,855 $3,224 $3,516 $3,181 $3,030 $3,094 $3,321Admin Expenses $970 $970 $970 $970 $970 $970 $970 $970 $970 $970 $970 $970Purchase Depreciable Assets $0 $0 $0 $0 $0 $0 $0 $0 $0 $0 $0 $0Purchase Non-Depr. Assets $0 $0 $0 $0 $0 $0 $0 $0 $0 $0 $0 $0Dividends, Owner Pay-outs $0 $0 $0 $0 $0 $0 $0 $0 $0 $0 $0 $0Total Uses Before Taxes $54,151 $53,970 $68,407 $67,149 $76,961 $74,680 $85,514 $94,068 $82,355 $79,812 $79,821 $88,366Income Taxes $0 $0 $0 $0 $0 $0 $0 $0 $0 $0 $0 $0
Total Uses After Taxes $54,151 $53,970 $68,407 $67,149 $76,961 $74,680 $85,514 $94,068 $82,355 $79,812 $79,821 $88,366
Net Change in Cash 4,799$ (12,590)$ (9,207)$ (7,049)$ (5,611)$ (6,570)$ (2,014)$ 1,582$ (655)$ (4,412)$ (1,721)$ (816)$ Ending Cash Position $85,898 $73,308 $64,101 $57,052 $51,441 $44,872 $42,857 $44,439 $43,784 $39,372 $37,651 $36,836
Month of Start-up
Keystone Developoment Center Appendix B: Page 2 December 2015

Income Statement1st Year Start-up
1 2 3 4 5 6 7 8 9 10 11 12 Annual % of SalesNumber of Weeks 4.5 4 4.5 4 4.5 4.5 4.5 4.5 4 4.5 4 4.5 52
Revenue Schedule: Sales $36,450 $38,880 $56,700 $57,600 $68,850 $65,610 $81,000 $93,150 $79,200 $72,900 $75,600 $85,050 $810,990Gross Sales $36,450 $38,880 $56,700 $57,600 $68,850 $65,610 $81,000 $93,150 $79,200 $72,900 $75,600 $85,050 $810,990
Cost of Goods Sold: Inventory $24,786 $26,438 $38,556 $39,168 $46,818 $44,615 $55,080 $63,342 $53,856 $49,572 $51,408 $57,834 $551,473 68.00%Total Cost of Goods Sold $24,786 $26,438 $38,556 $39,168 $46,818 $44,615 $55,080 $63,342 $53,856 $49,572 $51,408 $57,834 $551,473 68.00%
Personnel Expense Wages -- nonadmin $7,706 $6,850 $7,706 $6,850 $7,706 $7,706 $7,706 $7,706 $6,850 $7,706 $6,850 $7,706 $89,050 10.98%
Insurance--Workers' Comp -- nonadmin $462 $411 $462 $411 $462 $462 $462 $462 $411 $462 $411 $462 $5,343 0.66%Employee Benefits -- nonadmin $1,156 $1,028 $1,156 $1,028 $1,156 $1,156 $1,156 $1,156 $1,028 $1,156 $1,028 $1,156 $13,358 1.65%Payroll Taxes -- nonadmin $617 $548 $617 $548 $617 $617 $617 $617 $548 $617 $548 $617 $7,124 0.88%Wages -- admin $5,715 $5,080 $5,715 $5,080 $5,715 $5,715 $5,715 $5,715 $5,080 $5,715 $5,080 $5,715 $66,040 8.14%Workers' Comp -- admin $57 $51 $57 $51 $57 $57 $57 $57 $51 $57 $51 $57 $660 0.08%Payroll Tax - -admin $457 $406 $457 $406 $457 $457 $457 $457 $406 $457 $406 $457 $5,283 0.65%Employee Benefits -- admin $857 $762 $857 $762 $857 $857 $857 $857 $762 $857 $762 $857 $9,906 1.22%Total Personnel Expense $17,028 $15,136 $17,028 $15,136 $17,028 $17,028 $17,028 $17,028 $15,136 $17,028 $15,136 $17,028 $196,764 24.26%
Occupancy Expense Rent $0 $0 $0 $0 $0 $0 $0 $0 $0 $0 $0 $0 $0 0.00%Electric $700 $700 $700 $700 $700 $700 $700 $700 $700 $700 $700 $700 $8,400 1.04%Fuel--Heating $800 $800 $800 $800 $800 $800 $800 $800 $800 $800 $800 $800 $9,600 1.18%Insurance--Inclusive $200 $200 $200 $200 $200 $200 $200 $200 $200 $200 $200 $200 $2,400 0.30%Pest Control $80 $80 $80 $80 $80 $80 $80 $80 $80 $80 $80 $80 $960 0.12%Trash Removal $50 $50 $50 $50 $50 $50 $50 $50 $50 $50 $50 $50 $600 0.07%Water & Sewer $0 $0 $0 $0 $0 $0 $0 $0 $0 $0 $0 $0 $0 0.00%Repair and Maintenance $200 $200 $200 $200 $200 $200 $200 $200 $200 $200 $200 $200 $2,400 0.30%Total Occupancy Expense $2,030 $2,030 $2,030 $2,030 $2,030 $2,030 $2,030 $2,030 $2,030 $2,030 $2,030 $2,030 $24,360 3.00%
Depreciation/Amortization Interest on Debt $1,586 $1,563 $1,539 $1,516 $1,492 $1,468 $1,445 $1,421 $1,397 $1,372 $1,348 $1,324 $17,470 2.15%Depreciation $1,888 $1,888 $1,888 $1,888 $1,888 $1,888 $1,888 $1,888 $1,888 $1,888 $1,888 $1,888 $22,661 2.79%Total Depreciation/Amortization $3,474 $3,451 $3,428 $3,404 $3,380 $3,357 $3,333 $3,309 $3,285 $3,261 $3,237 $3,212 $40,131 4.95%
Operating Expense Supplies--cleaning, etc $100 $100 $100 $100 $100 $100 $100 $100 $100 $100 $100 $100 $1,200 0.15%Credit Card Fees $875 $933 $1,361 $1,382 $1,652 $1,575 $1,944 $2,236 $1,901 $1,750 $1,814 $2,041 $19,464 2.40%Bags/other $100 $100 $100 $100 $100 $100 $100 $100 $100 $100 $100 $100 $1,200 0.15%Labels for pricing $80 $80 $80 $80 $80 $80 $80 $80 $80 $80 $80 $80 $960 0.12%Deli Packaging $800 $800 $800 $800 $800 $800 $800 $800 $800 $800 $800 $800 $9,600 1.18%Telephone $100 $100 $100 $100 $100 $100 $100 $100 $100 $100 $100 $100 $1,200 0.15%Other -- Operating $100 $100 $100 $100 $100 $100 $100 $100 $100 $100 $100 $100 $1,200 0.15%Total Operating Expenses $2,155 $2,213 $2,641 $2,662 $2,932 $2,855 $3,224 $3,516 $3,181 $3,030 $3,094 $3,321 $34,824 4.29%
Administrative Expense Accounting $100 $100 $100 $100 $100 $100 $100 $100 $100 $100 $100 $100 $1,200 0.15%Payroll Service $100 $100 $100 $100 $100 $100 $100 $100 $100 $100 $100 $100 $1,200 0.15%Computer/Internet/Website Expense $100 $100 $100 $100 $100 $100 $100 $100 $100 $100 $100 $100 $1,200 0.15%Legal Expenses $20 $20 $20 $20 $20 $20 $20 $20 $20 $20 $20 $20 $240 0.03%Marketing--Ads, etc. $500 $500 $500 $500 $500 $500 $500 $500 $500 $500 $500 $500 $6,000 0.74%Office Supplies $50 $50 $50 $50 $50 $50 $50 $50 $50 $50 $50 $50 $600 0.07%Other -- Admin $100 $100 $100 $100 $100 $100 $100 $100 $100 $100 $100 $100 $1,200 0.15%Total Admin $970 $970 $970 $970 $970 $970 $970 $970 $970 $970 $970 $970 $11,640 1.44%
Total Operating Costs $50,443 $50,238 $64,652 $63,370 $73,158 $70,854 $81,665 $90,194 $78,457 $75,890 $75,875 $84,395 $859,192 105.94%
Net Profit -$13,993 -$11,358 -$7,952 -$5,770 -$4,308 -$5,244 -$665 $2,956 $743 -$2,990 -$275 $655 -$48,202Income Taxes
EBITDA -$10,518 -$7,907 -$4,524 -$2,366 -$928 -$1,887 $2,668 $6,265 $4,027 $271 $2,962 $3,867 -$8,071
Assumptions COFS (% of Gross Sales) 68%
Month of Start-up
Keystone Developoment Center Appendix B: Page 3 December 2015

Equity, Membership, and Loan Summary
Equity Calculations Pre-opening 1 2 3 4 5No. New Members 500 200 150 150 150 100Total Members 500 700 850 1,000 1,150 1,250
Membership Fee $100 $150 $150 $150 $150 $200
New Equity -- Members $50,000 $30,000 $22,500 $22,500 $22,500 $20,000
Member/Community Grants $325,000
Total New Member and Equity $375,000 $30,000 $22,500 $22,500 $22,500 $20,000
Total Member Equity Contributions $375,000 $405,000 $427,500 $450,000 $472,500 $492,500
Preferred Stock Purchases $0 $0 $0 $0 $0 $0
DebtMember/Community Loans/Grants $0 $0 $0 $0 $0 $0
Total Capital Raised - Before Opening $375,000
Equity and/or Subordinated Debt Needed (includes overrun cash) $253,744
Cash Raised over Start-up Costs $121,256Overrun Allowance $57,669 1 2 3 4 5
Total Cash Reserves $178,92520,000$ 70,000$ 30,000$ 30,000$ 15,000$
Cash Reserve Balance $158,925 $88,925 $58,925 $28,925 $13,925
PreOpenningDEBT Summary 1 2 3 4 5
Primary Loan $380,615 $311,893 $239,655 $163,721 $83,902 $0Member Loan -- Pre-open $0 $0 $0 $0 $0 $0
Member Loan Year 1 $0 $0 $0 $0 $0Member Loan Year 2 $0 $0 $0 $0Member Loan Year 3 $0 $0 $0Member Loan Year 4 $0 $0Member Loan Year 5 $0
TOTAL DEBT $380,615 $311,893 $239,655 $163,721 $83,902 $0
Member Loans Interest 3%Length (years) 10Payback starts (year) 5
Year of Start-up (as of Dec 31)
Balance at End of Year
Year
Amount Withdrawn from Cash Reserves (added first day of year)
Keystone Developoment Center Appendix B: Page 4 December 2015

Development Balance SheetFirst Year Start-up
Assets:Current Assets
Cash $81,099Accounts Receivable $0Other Current Assets (Inventory, overun allowance, development budget $$, and addnl cash reserves) $404,516
Total Current Assets $485,615
Long Term AssetsDepreciable Assets $270,000Accumulated Depreciation $0Net Depreciable Assets $0Non-Depreciable Assets $0
Total Long-Term Assets $270,000
Total Assets $755,615Liabilities & Equity:
Current LiabilitiesCost of Sales A/P $0Short-term Debt $0
Total Current Liabilities $0
Debt $380,615
EquityOriginal Stock & Paid-in Capital $375,000Equity Loss or Gain $0
Total Equity $375,000
Total Liabilities & Equity $755,615
Keystone Developoment Center Appendix B: Page 5 December 2015

Beginning Balance SheetFirst Year Start-up
As of Business OpeningAssets:
Current AssetsCash $81,099Accounts Receivable $0Other Current Assets (Inventory and Reserve funds) $273,425
Total Current Assets $354,524
Long Term AssetsDepreciable Assets $270,000Accumulated Depreciation $0Net Depreciable Assets $0Non-Depreciable Assets $0
Total Long-Term Assets $270,000
Total Assets $624,524Liabilities & Equity:
Current LiabilitiesCost of Sales A/P $0Short-term Debt $0
Total Current Liabilities $0
Debt $380,615
EquityOriginal Stock & Paid-in Capital $375,000
Less Pre-opening Payouts $131,091Crowd-Source Capital $0
Total Equity $243,909
Total Liabilities & Equity $624,524
Keystone Developoment Center Appendix B: Page 6 December 2015

Mortgage Amortization
$380,615 $86,192.165.000% $7,182.685 $17,470.082015 $50,345.51January $430,960.80
Year MonthBeginning Balance Payment Principal Interest
Cumulative Principal
Cumulative Interest
Ending Balance
2015 Jan $380,615.29 $7,182.68 $5,596.78 $1,585.90 $5,596.78 $1,585.90 $375,018.51Feb $375,018.51 $7,182.68 $5,620.10 $1,562.58 $11,216.88 $3,148.48 $369,398.41Mar $369,398.41 $7,182.68 $5,643.52 $1,539.16 $16,860.40 $4,687.64 $363,754.89Apr $363,754.89 $7,182.68 $5,667.03 $1,515.65 $22,527.43 $6,203.29 $358,087.86May $358,087.86 $7,182.68 $5,690.65 $1,492.03 $28,218.08 $7,695.32 $352,397.21Jun $352,397.21 $7,182.68 $5,714.36 $1,468.32 $33,932.44 $9,163.64 $346,682.85Jul $346,682.85 $7,182.68 $5,738.17 $1,444.51 $39,670.61 $10,608.15 $340,944.68Aug $340,944.68 $7,182.68 $5,762.08 $1,420.60 $45,432.69 $12,028.75 $335,182.60Sep $335,182.60 $7,182.68 $5,786.09 $1,396.59 $51,218.78 $13,425.34 $329,396.51Oct $329,396.51 $7,182.68 $5,810.19 $1,372.49 $57,028.97 $14,797.83 $323,586.32Nov $323,586.32 $7,182.68 $5,834.40 $1,348.28 $62,863.37 $16,146.11 $317,751.92Dec $317,751.92 $7,182.68 $5,858.71 $1,323.97 $68,722.08 $17,470.08 $311,893.21
YearBeginning Balance Payment Principal Interest
Cumulative Principal
Cumulative Interest
Ending Balance
2016 $311,893.21 $86,192.16 $72,238.05 $13,954.11 $140,960.13 $31,424.19 $239,655.162017 $239,655.16 $86,192.16 $75,933.88 $10,258.28 $216,894.01 $41,682.47 $163,721.282018 $163,721.28 $86,192.16 $79,818.80 $6,373.36 $296,712.81 $48,055.83 $83,902.482019 $83,902.48 $86,192.16 $83,902.48 $2,289.68 $380,615.29 $50,345.51 $0.00
Inputs Key FiguresLoan principal amount Annual loan paymentsAnnual interest rate Monthly payments
Payments in First 12 Months
Yearly Schedule of Balances and Payments
Loan period in years Interest in first calendar yearBase year of loan Interest over term of loanBase month of loan Sum of all payments
Keystone Developoment Center Appendix B: Page 7 December 2015

Annual PTA Household Food Market
$102,933,030 $4,090 Avg Groc Exp per household Revenues ‐‐ Weekly
$8,234,642 8% Natural foods segment PTA Weekly Food Sales ‐‐ Households $11,528
$2,141,007 26% Small‐independent grocery Student Weekly Food Sales $673 Total Food$599,482 28% Mkt Share STA Food Sales $1,500 $13,702
NonFood Revenues $2,603Weekly $11,528 Yearly Total Weely Revenue $16,305
Monthly $49,957 599,482$ $18,000Estimate for Revenue Model
AssumptionsTot HH in PTA 25,167NonFood Items 19%
Group Housing Secondary Trade Area Individual Exp $1,704 Retail Traffic from out of PTA Per Day Per Year Per weekTotal in Group Qtrs 4410 Average vehicle per day pass by corner. 5,000 Tot food at home mkt $7,515,375 Percent attracted to market 0.25%Discount because student 80% Average $$ food purchase per stop 20
$6,012,300 Total Revenue from STA 250$ 78,000$ 1,500$
$480,984 8% NS segment
$125,056 26% Ind Groc Number Customers per Day 12.5$35,016 28% Mkt Share
$673 weeklySTA=secondary trade area
Avg number in consumer unit -- NE 2.4 Reality CheckAvg food at home/per person $1,704.17 Total Hours Open/Week 62
Average Total $$ per Trans 49$ Customers per Hour 6
$420,187.62 Customers per Day (10 hrs/day) 60 Total Sales per Week 18,228$ Annual Sales/Retail Sq Ft 386$
$4,090coefficients of variation, Consumer Expenditure Survey, 2014
Keystone Developoment Center Appendix B: Page 8 December 2015
kate007
Typewritten Text
Revenue Model Background Calculations

Appendix C: Survey Results (Preliminary Analysis)
637 Participants (as of 12.30.2015 6:00 AM).
Little less than half from Indiana Borough (43.5%). White township is approximately another 22%.
130 undergraduates, 28 graduate students and all other not students (474). (5 skipped question)
86% responded they are somewhat to very satisfied with their primary grocery store. Only 4% are very satisfied.
Martin’s Food Markets are getting most of the grocery business (29%). Giant Eagle has 18% with Walmart at 28.6% and Aldi at 13%. Those four are getting just under 90% of the business.
60% (n=365) know something about the co‐op model, with another 159 answering “not sure”.
94% think a downtown food co‐op would be somewhat to very important to their household.
Keystone Development Center Appendix C: Page 1 December 2015

Just under 98% said they would be somewhat to very likely to shop at the cooperative. (48.4% said very likely)
$31,484 per week in estimated co‐op sales. This number is calculated by combining the average grocery expenditures per week and the percent of those expenditure that are predicted to be spent at the cooperative. The survey allows for ranges of numbers so the midpoint in the range was used for the calculations. 535 answered both questions.
Location is far from unanimous. 53.4% want downtown Indiana. Just under 17% prefer White Township.
$42,200 in willingness to pay for first‐time membership fee. For those that answered the question (n=526), this averages to $80. Eight‐seven answered a willingness to pay of $0.
Keystone Development Center Appendix C: Page 2 December 2015

55.6% willing to join co‐op with 36% not sure
25% willing to volunteer at co‐op with 54% not sure.
Keystone Development Center Appendix C: Page 3 December 2015

73% anticipate living in Indiana area for at least 5 years.
Keystone Development Center Appendix C: Page 4 December 2015