Indian Organic Chemicals Import Overview - Analysis ... Organic Chemicals Import Overview - Analysis...
29
Indian Organic Chemicals Import Overview - Analysis -February 2013 www.planetexim.net|[email protected]|+919831677758|Kolkata|India ©Mahavir Law House Analysis by Mita Mehta
Transcript of Indian Organic Chemicals Import Overview - Analysis ... Organic Chemicals Import Overview - Analysis...

Indian Organic Chemicals Import Overview - Analysis -February 2013
www.planetexim.net|[email protected]|+919831677758|Kolkata|India
©Mahavir Law House
Analysis by Mita Mehta

Graphical Overview of imports in India under ch. 29 during February 2013 from around the Globe.
Port Value Air 9 BillionsICD 4 BillionsSea 68 Billions
Port - ICDs ValueAnkleshwar 26 MillionsBangalore 89 MillionsBaroda 138 MillionsDadri - STTPL 6 MillionsDadri-ACPL CFS 147 MillionsDadri-CGML 28 MillionsFaridabad 7 MillionsGarhi Harsaru - Gurgaon 19 MillionsHyderabad 77 MillionsKanakpura - Jaipur 5 MillionsLoni 19 MillionsLudhiana 117 MillionsMulund 47 MillionsNagpur 1 BillionsNoida-Dadri 204 MillionsPakwara 5 MillionsPatli 6 MillionsPatparganj 77 MillionsPithampur 3 MillionsSabarmati 798 MillionsTiruvallur-ILP 16 MillionsTughlakabad 894 MillionsVapi 2 MillionsMandideep 22 MillionsThar Dry Port 53 MillionsRewari 21 MillionsBhagat ki Kothi - Jodhpur 3 MillionsBhusaval 3270460.8Maliwada 2023610.75
India imported more than 81 billion worth of products under Ch. 29.
29 ICD fragmented the clearance of 4 Billion goods during the month.
Ankleshwar1%
Bangalore2%
Baroda4%
Dadri - STTPL0%
Dadri-ACPL CFS
4%
Dadri-CGML
1%
Faridabad0%
Garhi Harsaru - Gurgaon0%
Hyderabad2%
Kanakpura - Jaipur0%Loni
0%Ludhiana3%
Mulund1%
Nagpur26%
Noida-Dadri5%
Pakwara0%
Patli0%
Patparganj2%
Pithampur0%
Sabarmati21%
Tiruvallur-ILP0%
Tughlakabad23%
Vapi0%
Mandideep1%
Thar Dry Port1%
Rewari1%Bhagat ki Kothi - Jodhpur
0%
Bhusaval0%
Maliwada0%
IMPORTS UNDER CH 29 AT VARIOUS ICDS OF INDIA FEB 2013
Chart 1.2
9 Billions 4 Billions
68 Billions
IMPORTS OF ORGANIC CHEMICALS UNDER CH 29FEBRUARY 13
AirICDSea
Chart 1.1
www.planetexim.net|[email protected]|+919831677758|Kolkata|India
©Mahavir Law House

Graphical Overview of imports in India under ch. 29 during February 2013 from around the Globe.
Sea Ports ValueChennai 8 Billions
Cochin 313 Million
Dahej 1 Billions
Ennore 1 Billions
Goa 1 Billions
JNPT 24 Billions
Kakinada 367 Millions
Kandla 14 Billions
Kolkata 7 Billions
Mangalore 224 Millions
Mumbai 9 Billions
Mundra 1 Billions
Pipavav 95 Millions
Tuticorin 34 Million
Vizag 3 Billions
Air Ports ValueAmhedabad 427 Millions
Bangalore 238 Millions
Chennai 2 Billions
Cochin 0 Millions
Dabolim 0 Millions
Delhi 1 Billions
Hyderabad 1 Billions
Kolkata 72 Millions
Mumbai 4 Billions
Nava Sheva / JNPT showed the highest share of import of organic Chemicals among all the seaports of India accounting for more than 24
billion of imports under Ch. 29.
9 Billions of goods are imported via 9 different airports of India
8 Billions
313 Million
1 Billions
1 Billions
1 Billions
24 Billions
367 Millions
14 Billions
7 Billions
224 Millions
9 Billions
1 Billions
95 Millions
34 Million
3 Billions
Imports under ch 29 at all Sea Ports of India Feb 2013
Chart 1.3
1
427 Millions 238 Millions
2 Billions
0 Millions 0 Millions
1 Billions 1 Billions
72 Millions
4 Billions
IMPORTS UNDER CH 29 AT ALL AIR PORTS OF INDIA FOR THE MONTH OF FEB 2013
Chart 1.4
www.planetexim.net|[email protected]|+919831677758|Kolkata|India
©Mahavir Law House

Graphical Overview of imports in India under ch. 29 during February 2013 from around the Globe.
Port Value
Amhedabad Air 149 Millions
Ankleshwar ICD 18 Millions
Bangalore Air 77 Millions
Bangalore ICD 37 Millions
Baroda ICD 33 Millions
Chennai Air 1 Billion
Chennai Sea 5 Billion
Cochin Sea 24 Millions
Dadri-ACPL CFS ICD 21 Millions
Dadri-CGML ICD 2109334.5
Delhi Air 615 Millions
Faridabad ICD 2 Millions
Garhi Harsaru - Gurgaon ICD 4 Million
Goa Sea 18 Millions
Hyderabad Air 748 Millions
Hyderabad ICD 67 Millions
JNPT Sea 11 Billion
Kanakpura - Jaipur ICD 1 Millions
Kandla Sea 238 Millions
Kolkata Air 41 Millions
Kolkata Sea 122 Millions
Ludhiana ICD 57 Millions
Mulund ICD 43 Millions
Mumbai Air 2 Billion
Mumbai Sea 30 Million
Mundra Sea 30 Millions
Nagpur ICD 6 Millions
Noida-Dadri ICD 80 Millions
Patparganj ICD 64 Millions
Pipavav Sea 94 Millions
Sabarmati ICD 665 Millions
Tughlakabad ICD 438 Millions
Tuticorin Sea 20 Millions
Vizag Sea 826 Millions
Thar Dry Port ICD 53 Millions
Bhagat ki Kothi - Jodhpur ICD 3 Millions
Maliwada ICD 2 Million
74 countries supplied goods to India among which China was the highest one accounting for 29% of the trade.
Among the 37 point of contact JNPT and Chennai Sea show the maximum trade.
1%
0%0%0%
0%
4%
23%
0%
0%
0%
3%
0%
0%
0%
3%0%
46%
0%
1%
0%
1%
0%
0%
8%
0%0%
0%
0%
0%
0%
3% 2%
0%4%
0%
0%
0%
5%
Export from China to India under ch 29Feb 2013
Amhedabad Air Ankleshwar ICD Bangalore Air Bangalore ICD Baroda ICD
Chennai Air Chennai Sea Cochin Sea Dadri-ACPL CFS ICD Dadri-CGML ICD
Delhi Air Faridabad ICD Garhi Harsaru - Gurgaon ICD Goa Sea Hyderabad Air
Hyderabad ICD JNPT Sea Kanakpura - Jaipur ICD Kandla Sea Kolkata Air
Kolkata Sea Ludhiana ICD Mulund ICD Mumbai Air Mumbai Sea
Mundra Sea Nagpur ICD Noida-Dadri ICD Patparganj ICD Pipavav Sea
Sabarmati ICD Tughlakabad ICD Tuticorin Sea Vizag Sea Thar Dry Port ICD
Bhagat ki Kothi - Jodhpur ICD Maliwada ICDChart 1.5
www.planetexim.net|[email protected]|+919831677758|Kolkata|India
©Mahavir Law House

Graphical Overview of imports in India under ch. 29 during February 2013 from around the Globe.
State Value
Andhra Pradesh 4303 Millions
Delhi 2012 Millions
GOA 526 Millions
Gujarat 16 Billion
HARYANA 53 Millions
Karnataka 551 Millions
Kerala 313 Millions
Madhya Pradesh 25 Millions
Maharashtra 39 Billion
Punjab 117 Millions
Rajasthan 8 Millions
Tamil Nadu 10396 Millions
Uttar Pradesh 409 Millions
West Bengal 6637 Millions
Row Labels Total Value
ASEAN COUNTRIES 15 Billions
EAST ASIA 113 Millions
EUROPEAN FREE TRADE ASSOCIATION(EFTA) 1 Billions
EUROPEAN UNION(EU) 10 Billions
INDIA 165 Millions
LATIN AMERICA 164 Millions
NORTH AFRICA 30 Millions
NORTH AMERICA 4 Billions
NORTH-EAST ASIA 32 Billions
OTHER COMMONWEALTH OF INDEPENDENT STATES(CIS) COUNTRIES 78 Millions
OTHER EUROPEAN COUNTRIES 13 Millions
OTHER WEST ASIAN COUNTRIES 4 Billions
SOUTH ASIA 251621.93
SOUTHERN AFRICAN CUSTOMS UNION(SACU) 348 Millions
WEST ASIA GCC 14 Billions
WEST AFRICA 10 Millions
More than 80% of imports are from Asia & Asian countries with EUROPEAN UNION (EU) has a little over 12 % share
Maharashtra is the highest importer with 48% share while Gujarat is at no. two position with 20% share.
Andhra Pradesh, 5%
Delhi, 3%
GOA, 1%
Gujarat, 20%
HARYANA, 0%
Karnataka, 1%
Kerala, 0%Madhya Pradesh, 0%
Maharashtra, 48%
Punjab, 0%Rajasthan, 0%
Tamil Nadu, 13%
Uttar Pradesh, 1%
West Bengal,
8%Other, 3%
STATE-WISE MARKET SHARE UNDER CH. 29FEB 2013
Chart 1.6
ASEAN COUNTRIES19%
EAST ASIA 0%
EUROPEAN FREE TRADE ASSOCIATION(EFTA)
1%
EUROPEAN UNION(EU)
12%INDIA
0%LATIN AMERICA
0%
NORTH AFRICA
0%NORTH AMERICA
5%
NORTH-EAST ASIA39%
OTHER COMMONWEALTH OF INDEPENDENT
STATES(CIS) COUNTRIES 0%
OTHER EUROPEAN COUNTRIES
0%
OTHER WEST ASIAN
COUNTRIES4%
SOUTH ASIA 0%
SOUTHERN AFRICAN CUSTOMS UNION(SACU)
0%
WEST ASIA GCC18%
WEST AFRICA0%
GLOBAL SUPPLIERS SLICE UNDER CH 29JAN 2013
Chart 1.7
www.planetexim.net|[email protected]|+919831677758|Kolkata|India
©Mahavir Law House

Graphical Overview of imports in India under ch. 29 during February 2013 from around the Globe.
HS code Value
2902 18 Billion
2905 13 Billion
2907 4 Billion
2915 3 Billion
2916 6 Billion
2917 3 Billion
2922 5 Billion
2933 5 Billion
2941 5 Billion
2942 6 Billion
other 20 Billionother
2917: Acyllic polycarboxylic acids, their anhydrides, halides, peroxides, peroxyacids and their derivatives:Polycarboxylic acids, their anhydrides, halides, peroxides and
peroxyacids; their halogenated, sulphonated, nitrated or nitrosated derivatives
2902: Cyclic hydrocarbons; Cyclanes, cyclenes and cycloterpenes:
2905: Acyclic alcohols and their halogenated, sulphonated, nitrated or nitrosated derivatives Saturated monohydric alcohols:
2907: Phenols; phenol-alcohols Monophenols:
2915: Saturated acyclic monocarboxylic acids and their anhydrides, halides, peroxides and peroxyacids; their halogenated, sulphonated, nitrated or nitrosated derivatives
2916: Unsaturated acyclic monocarboxylic acids, cyclic monocarboxylic acids, their anhydrides, halides, peroxides and peroxyacids; their halogenated, sulphonated,
nitrated or nitrosated derivatives, Unsaturated acyclic monocarboxylic acids, their anhydrides, halides, peroxides, peroxyacids - their derivatives:
More than 77% of imports are from from top ten 4 digit Hs - codes
Code Description
2922: Oxygen-function amino-compounds
2933: Heterocyclic compounds with nitrogen hetero-atom(s) only
2941: Antibiotics
2942: Other organic compounds
4 digit HS codes wise share
Chart 2.1
Chart 2.1
www.planetexim.net|[email protected]|+919831677758|Kolkata|India
©Mahavir Law House
Graphical Overview of imports in India under ch. 29 during February 2013 from around the Globe.
4 Dige HS codeValue
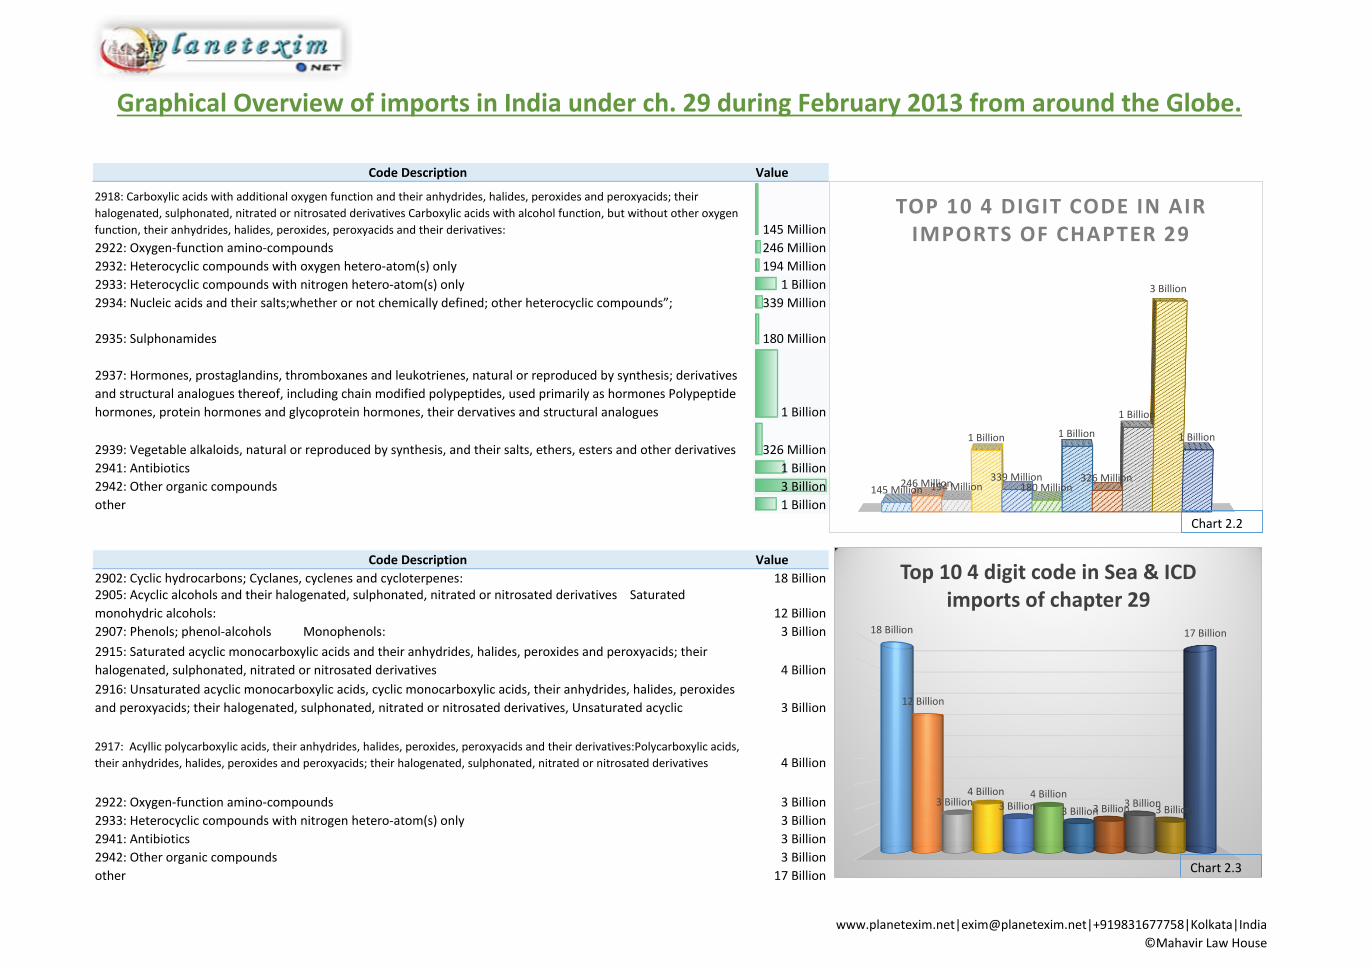
2918145 Million
2922246 Million
2932194 Million
2933 1 Billion
2934339 Million
2935180 Million
2937 1 Billion
2939326 Million
2941 1 Billion
2942 3 Billion
other 1 Billion
4 Dige HS codeValue
290218 Billion
290512 Billion
2907 3 Billion
2915 4 Billion
2916 3 Billion
2917 4 Billion
2922 3 Billion
2933 3 Billion
2941 3 Billion
2942 3 Billion
other17 Billion
2937: Hormones, prostaglandins, thromboxanes and leukotrienes, natural or reproduced by synthesis; derivatives
and structural analogues thereof, including chain modified polypeptides, used primarily as hormones Polypeptide
hormones, protein hormones and glycoprotein hormones, their dervatives and structural analogues
2939: Vegetable alkaloids, natural or reproduced by synthesis, and their salts, ethers, esters and other derivatives
2941: Antibiotics
2942: Other organic compounds
Code Description
2902: Cyclic hydrocarbons; Cyclanes, cyclenes and cycloterpenes:2905: Acyclic alcohols and their halogenated, sulphonated, nitrated or nitrosated derivatives Saturated
monohydric alcohols:
other
2916: Unsaturated acyclic monocarboxylic acids, cyclic monocarboxylic acids, their anhydrides, halides, peroxides
and peroxyacids; their halogenated, sulphonated, nitrated or nitrosated derivatives, Unsaturated acyclic
2917: Acyllic polycarboxylic acids, their anhydrides, halides, peroxides, peroxyacids and their derivatives:Polycarboxylic acids,
their anhydrides, halides, peroxides and peroxyacids; their halogenated, sulphonated, nitrated or nitrosated derivatives
2922: Oxygen-function amino-compounds
2933: Heterocyclic compounds with nitrogen hetero-atom(s) only
2941: Antibiotics
2942: Other organic compounds
other
2918: Carboxylic acids with additional oxygen function and their anhydrides, halides, peroxides and peroxyacids; their
halogenated, sulphonated, nitrated or nitrosated derivatives Carboxylic acids with alcohol function, but without other oxygen
function, their anhydrides, halides, peroxides, peroxyacids and their derivatives:
2922: Oxygen-function amino-compounds
2932: Heterocyclic compounds with oxygen hetero-atom(s) only
2933: Heterocyclic compounds with nitrogen hetero-atom(s) only
2934: Nucleic acids and their salts;whether or not chemically defined; other heterocyclic compounds”;
Code Description
2907: Phenols; phenol-alcohols Monophenols:
2915: Saturated acyclic monocarboxylic acids and their anhydrides, halides, peroxides and peroxyacids; their
halogenated, sulphonated, nitrated or nitrosated derivatives
2935: Sulphonamides
145 Million246 Million194 Million
1 Billion
339 Million180 Million
1 Billion
326 Million
1 Billion
3 Billion
1 Billion
TOP 10 4 DIGIT CODE IN AIR IMPORTS OF CHAPTER 29
Chart 2.2
18 Billion
12 Billion
3 Billion4 Billion
3 Billion4 Billion
3 Billion3 Billion3 Billion3 Billion
17 Billion
Top 10 4 digit code in Sea & ICD imports of chapter 29
Chart 2.3
www.planetexim.net|[email protected]|+919831677758|Kolkata|India
©Mahavir Law House
Graphical Overview of imports in India under ch. 29 during February 2013 from around the Globe.
Value
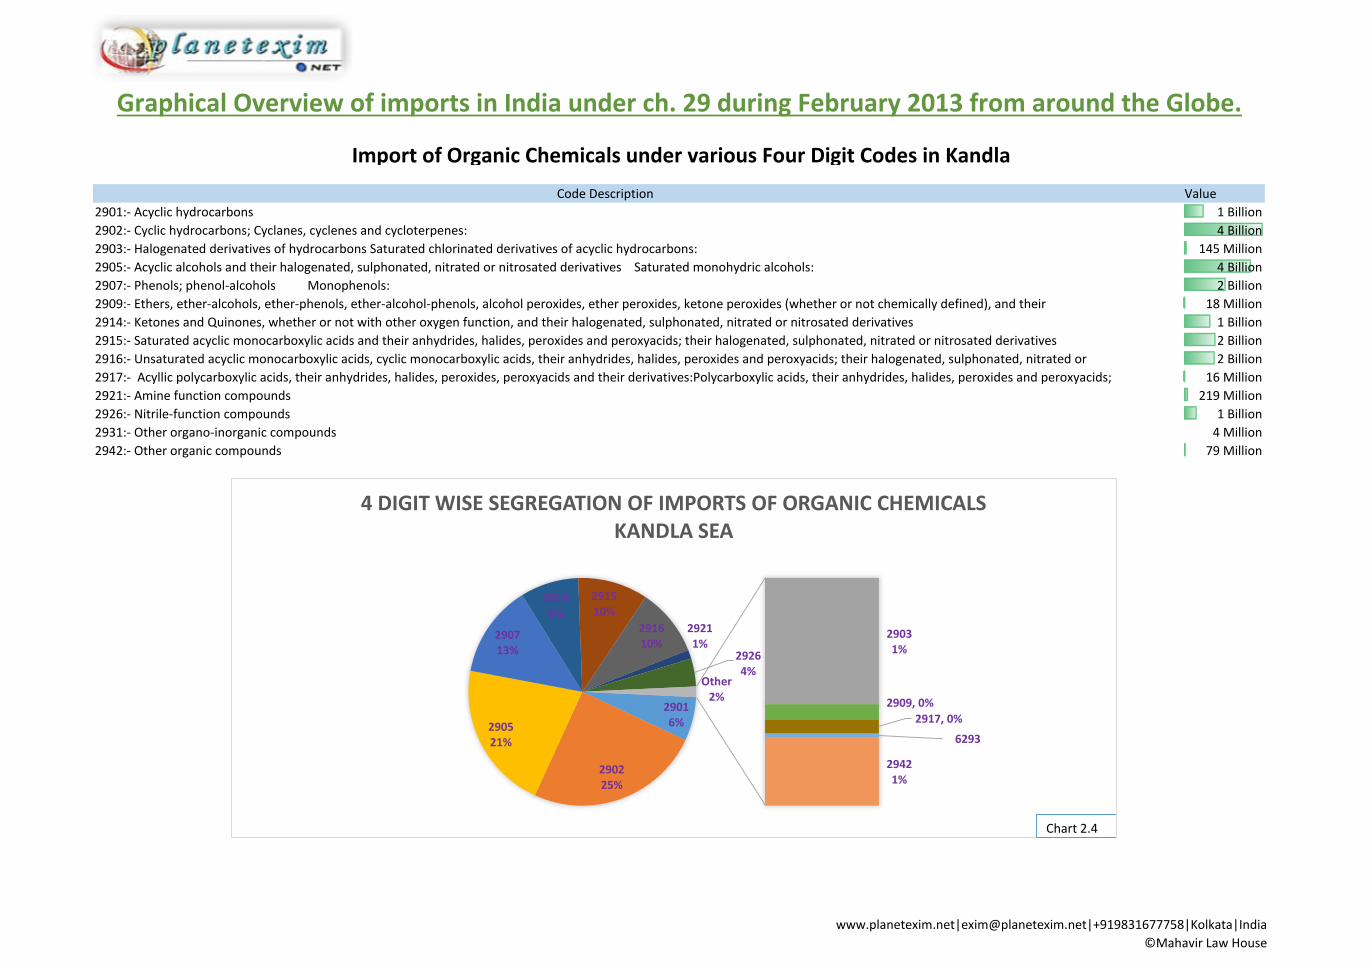
2901 1 Billion
2902 4 Billion
2903 145 Million
2905 4 Billion
2907 2 Billion
2909 18 Million
2914 1 Billion
2915 2 Billion
2916 2 Billion
2917 16 Million
2921 219 Million
2926 1 Billion
2931 4 Million
2942 79 Million2942:- Other organic compounds
Code Description
Import of Organic Chemicals under various Four Digit Codes in Kandla
2901:- Acyclic hydrocarbons
2902:- Cyclic hydrocarbons; Cyclanes, cyclenes and cycloterpenes:
2903:- Halogenated derivatives of hydrocarbons Saturated chlorinated derivatives of acyclic hydrocarbons:
2905:- Acyclic alcohols and their halogenated, sulphonated, nitrated or nitrosated derivatives Saturated monohydric alcohols:
2907:- Phenols; phenol-alcohols Monophenols:
2909:- Ethers, ether-alcohols, ether-phenols, ether-alcohol-phenols, alcohol peroxides, ether peroxides, ketone peroxides (whether or not chemically defined), and their
2914:- Ketones and Quinones, whether or not with other oxygen function, and their halogenated, sulphonated, nitrated or nitrosated derivatives
2915:- Saturated acyclic monocarboxylic acids and their anhydrides, halides, peroxides and peroxyacids; their halogenated, sulphonated, nitrated or nitrosated derivatives
2916:- Unsaturated acyclic monocarboxylic acids, cyclic monocarboxylic acids, their anhydrides, halides, peroxides and peroxyacids; their halogenated, sulphonated, nitrated or
2917:- Acyllic polycarboxylic acids, their anhydrides, halides, peroxides, peroxyacids and their derivatives:Polycarboxylic acids, their anhydrides, halides, peroxides and peroxyacids;
2921:- Amine function compounds
2926:- Nitrile-function compounds
2931:- Other organo-inorganic compounds
29016%
290225%
29031%
290521%
290713%
2909, 0%
29148%
291510%
291610%
2917, 0%
29211%
29264%
6293
29421%
Other2%
4 DIGIT WISE SEGREGATION OF IMPORTS OF ORGANIC CHEMICALS KANDLA SEA
Chart 2.4
www.planetexim.net|[email protected]|+919831677758|Kolkata|India
©Mahavir Law House

Graphical Overview of imports in India under ch. 29 during February 2013 from around the Globe.Code Description Import
29023000 4 Billion
29024300 5 Billion
29025000 8 Billion
29051100 3 Billion
29053100 5 Billion
29071110 2 Billion
29161210 2 Billion
29173600 3 Billion
29419090 2 Billion
29420090 6 Billion
other 42 Billion
29334900184 Million
29335990203 Million
29349900335 Million
29350090180 Million
29371200275 Million
29372100217 Million
29372900204 Million
29391100229 Million
294190901 Billion
294200903 Billion
other 3 Billion
V Import Value
290230004 Billion
290243005 Billion
290250008 Billion
290511003 Billion
290531005 Billion
290711102 Billion
291521002 Billion
291612102 Billion
291736003 Billion
294200902 Billion
other37 Billion
Import Value
29334900:- Other Compounds containing a pyrimidine ring (whether or not hydrogenated) or piperazine ring in the structure:
29335990:- Other Compounds containing an unfused triazine ring (whether or not hydrogenated) in the structure:
29349900:- Nucleic acids and their salts; whether or not chemically defined; other heterocyclic compounds - Other
29350090:- Other IX. –PROVITAMINS, VITAMINS AND HORMONES
29371200:- Insulin and its salts
29372100:- Cortisone, hydrocortisone, prednisone, (dehydrocortisone) and prednisolone (dehydrohydrocortisone):
29173600:- Terephthalic acid and its salts
29420090:- Diloxanide furoate, Cimetidine, Oxyclozanide, Famotidine: Other
other
29419090:- Rifampicin and its salts: Other
29420090:- Diloxanide furoate, Cimetidine, Oxyclozanide, Famotidine: Other
29025000:- Styrene
29051100:- Methanol (methyl alcohol)
29053100:- Ethylene glycol(ethanediol)
29071110:- Phenol, as pure carbolic acid
29161210:- Butyl acrylate
29173600:- Terephthalic acid and its salts
29419090:- Rifampicin and its salts: Other
29420090:- Diloxanide furoate, Cimetidine,
Oxyclozanide, Famotidine: Other
other
29023000:- Toluene Xylenes:
29024300:- p-Xylene
29025000:- Styrene
29051100:- Methanol (methyl alcohol)
29053100:- Ethylene glycol(ethanediol)
29071110:- Phenol, as pure carbolic acid
29152100:- Acetic acid
29161210:- Butyl acrylate
Code Description for Sea and ICD
other
29023000:- Toluene Xylenes:
29024300:- p-Xylene
29372900:- Other Catecholamine hormones, their derivatives and structural analogues
Code Description for Air Imports
29391100:- Concentrates of poppy straw; buprenorphine (INN), codeine, dihydrococodeine (INN), ethylmorphine,
etorphine (INN), heroin, hydrocodone (INN), hydromorphone (INN), morphine, nicomorphine (INN), oxycodone
(INN), oxymorphone (INN), pholcodine (INN), thebacon
184 Million 20
3 M
illio
n
335 Million180 Million 2
75
Mill
ion
217 Million204 Million229 Million
1 B
illio
n
3 Billion
3 Billion
2 8 % O F T O T A L A I R I M P O R T O F O R G A N I C C H E M I C A L S I M P O R T I S D O N E U N D E R
C O D E 2 9 4 2 0 0 9 0
4 Billion5 Billion8 Billion
3 Billion5 Billion2 Billion2 Billion2 Billion3 Billion2 Billion
37 Billion
other
29420090
29173600
29161210
29152100
29071110
29053100
29051100
29025000
29024300
29023000
290230005%
290243006%
2902500010%
290511004%
290531006%
290711103%
291612102%
291736003%
294190902%
294200907%
other52%
48 % OF ORGANIC CHEMICALS ARE IMPORTED IN THE TOP 10 HS CODES
www.planetexim.net|[email protected]|+919831677758|Kolkata|India
©Mahavir Law House
Graphical Overview of imports in India under ch. 29 during February 2013 from around the Globe.
Value
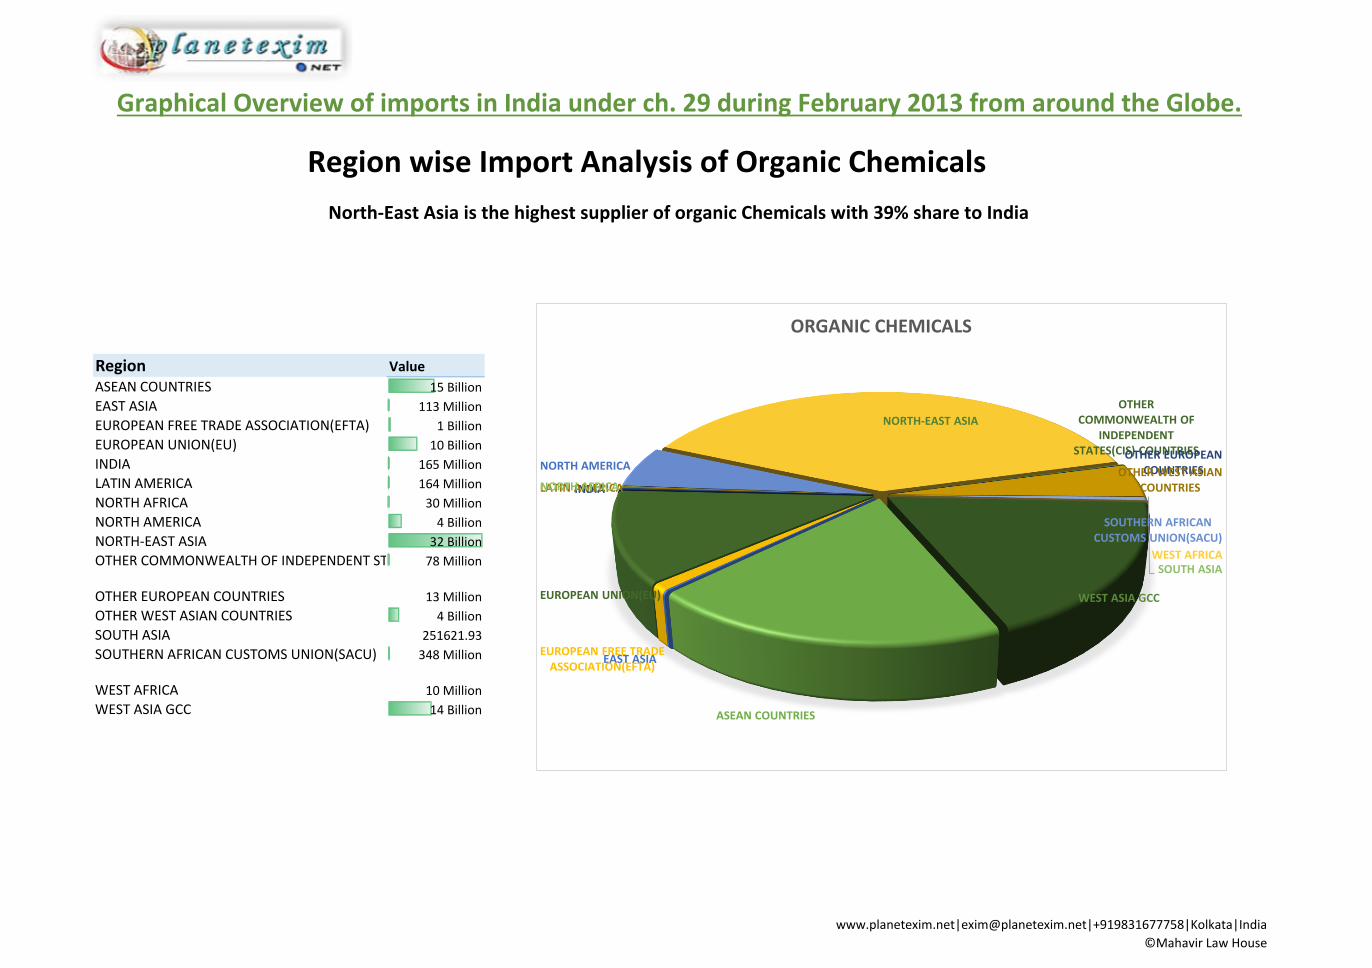
15 Billion
113 Million
1 Billion
10 Billion
165 Million
164 Million
30 Million
4 Billion
32 Billion
78 Million
13 Million
4 Billion
251621.93
348 Million
10 Million
14 Billion
OTHER WEST ASIAN COUNTRIES
SOUTH ASIA
SOUTHERN AFRICAN CUSTOMS UNION(SACU)
WEST AFRICA
WEST ASIA GCC
OTHER EUROPEAN COUNTRIES
Region wise Import Analysis of Organic Chemicals
North-East Asia is the highest supplier of organic Chemicals with 39% share to India
RegionASEAN COUNTRIES
EAST ASIA
EUROPEAN FREE TRADE ASSOCIATION(EFTA)
EUROPEAN UNION(EU)
INDIA
LATIN AMERICA
NORTH AFRICA
NORTH AMERICA
NORTH-EAST ASIA
OTHER COMMONWEALTH OF INDEPENDENT STATES(CIS) COUNTRIES
ASEAN COUNTRIES
EAST ASIA EUROPEAN FREE TRADE
ASSOCIATION(EFTA)
EUROPEAN UNION(EU)
INDIALATIN AMERICA NORTH AFRICA
NORTH AMERICA
NORTH-EAST ASIA
OTHER COMMONWEALTH OF
INDEPENDENT STATES(CIS) COUNTRIES OTHER EUROPEAN
COUNTRIES OTHER WEST ASIAN COUNTRIES
SOUTH ASIA
SOUTHERN AFRICAN CUSTOMS UNION(SACU)
WEST AFRICA
WEST ASIA GCC
ORGANIC CHEMICALS
www.planetexim.net|[email protected]|+919831677758|Kolkata|India
©Mahavir Law House

Graphical Overview of imports in India under ch. 29 during February 2013 from around the Globe.
North East Asian countries Value
CHINA 23 Billion
HONG KONG 28 Million
JAPAN 1 Billion
KOREA,DEMOCRATIC PEOPLE'S REPUBLIC OF12 Million
KOREA,REPUBLIC OF 5 Billion
TAIWAN 2 Billion
EU Value
AUSTRIA 61 Million
BELGIUM 597 Million
CZECH REPUBLIC 472 Million
DENMARK 246 Million
ESTONIA 4 Million
FINLAND 64 Million
FRANCE 599 Million
GERMANY 3 Billion
GREECE 0 Billion
HUNGARY 128 Million
IRELAND 27 Million
ITALY 1046 Million
LATVIA 5 Million
MALTA 10 Million
NETHERLANDS 1513 Million
POLAND 150 Million
PORTUGAL 4 Million
ROMANIA 82 Million
SLOVAK REPUBLIC 6 Million
SLOVENIA 102 Million
SPAIN 809 Million
SWEDEN 126 Million
UNITED KINGDOM 389 Million
LUXEMBOURG 40131.87
LITHUANIA 205333
China supplies 75% of organic chemicals among North East Asian countries
Twenty Five Countries supply organic chemicals from the EUROPEAN UNION(EU)
CHINA, 74%
HONG KONG, 0%
JAPAN, 4%
KOREA,DEMOCRATIC PEOPLE'S REPUBLIC OF,
0%
KOREA,REPUBLIC OF, 15% TAIWAN, 7%
NORTH-EAST ASIA
1%6%
5%
3%0%1%
6%
34%
0%1%0%
11%
0%0%
16%
2%0%1%0%1%
8%
1%4%0%0%
EUROPEAN UNION(EU) AUSTRIA
BELGIUM
CZECH REPUBLIC
DENMARK
ESTONIA
FINLAND
FRANCE
GERMANY
GREECE
HUNGARY
IRELAND
ITALY
LATVIA
MALTA
NETHERLANDS
POLAND
PORTUGAL
ROMANIA
SLOVAK REPUBLIC
SLOVENIA
SPAIN
SWEDEN
UNITED KINGDOM
LUXEMBOURG
LITHUANIA
www.planetexim.net|[email protected]|+919831677758|Kolkata|India
©Mahavir Law House

Graphical Overview of imports in India under ch. 29 during February 2013 from around the Globe.
Country Value(INR)CHINA 23 Billion
SINGAPORE 10 Billion
SAUDI ARABIA 9 Billion
KOREA,REPUBLIC OF 5 Billion
UNITED STATES 4 Billion
GERMANY 3 Billion
IRAN 3 Billion
KUWAIT 3 Billion
MALAYSIA 3 Billion
THAILAND 2 Billion
Others 16 Billion
Country wise Import Analysis of Organic Chemicals
Approx 80% of organic chemicals are supplied by the top 10 countries
23 Billion
10 Billion 9 Billion
5 Billion4 Billion
3 Billion 3 Billion 3 Billion 3 Billion 2 Billion
16 Billion
Top 10 countries contributing to imports of Organic Chemicals
www.planetexim.net|[email protected]|+919831677758|Kolkata|India
©Mahavir Law House

Graphical Overview of imports in India under ch. 29 during February 2013 from around the Globe.
Ports Value of Import
Ennore 43 Million
Kandla 2 Billion
Kolkata 30 Million
Mumbai 1 Billion
Vizag 280 Million
4 Billion
Ports Value of Import Total Qty
Ennore 43 Million 577 MTS
Kandla 2250 Million 29610 MTS
Kolkata 30 Million 400 MTS
Mumbai 1497 Million 19901 MTS
Vizag 280 Million 3444 MTS
4099 Million 53933 MTS
Analysis of Organic Chemical - Toluene
Toluene is imported in only Five ports of India with Kandla having the highest share
Approx 54 thousand MTS of Toluene was imported in India in February 2013
Ennore1%
Kandla55%
Kolkata1%
Mumbai36%Vizag
7%
PORT CONTRIBUTION IN IMPORT OF TOLUENE
0 MTS
5000 MTS
10000 MTS
15000 MTS
20000 MTS
25000 MTS
30000 MTS
35000 MTS
0 Million
500 Million
1000 Million
1500 Million
2000 Million
2500 Million
Ennore Kandla Kolkata Mumbai Vizag
Toulene Value and Quantity
Value of Import Total Qty
www.planetexim.net|[email protected]|+919831677758|Kolkata|India
©Mahavir Law House
Graphical Overview of imports in India under ch. 29 during February 2013 from around the Globe.
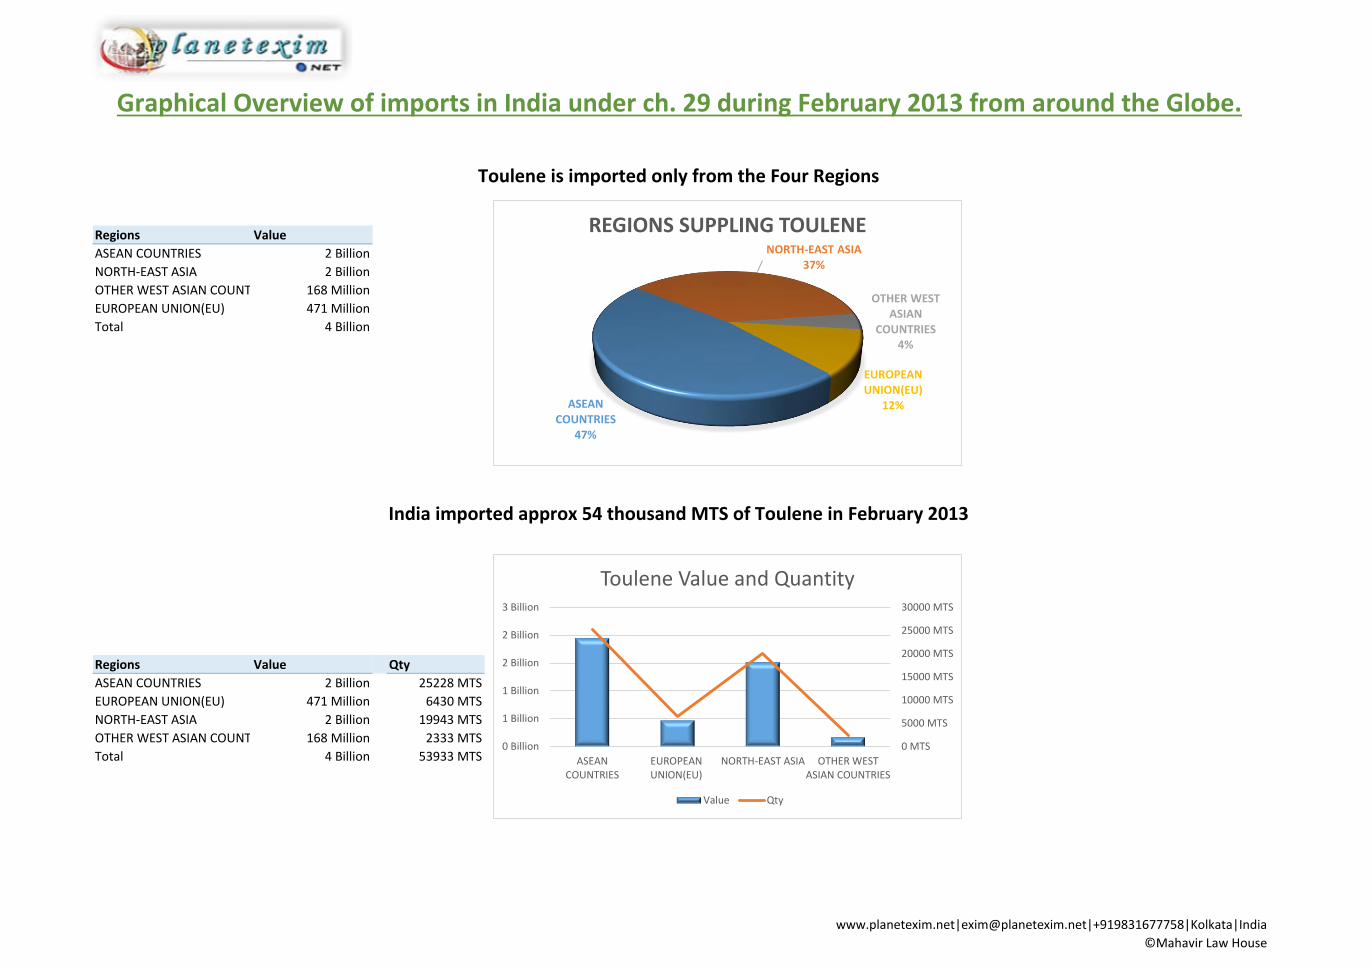
Regions Value
ASEAN COUNTRIES 2 Billion
NORTH-EAST ASIA 2 Billion
OTHER WEST ASIAN COUNTRIES 168 Million
EUROPEAN UNION(EU) 471 Million
Total 4 Billion
Regions Value Qty
ASEAN COUNTRIES 2 Billion 25228 MTS
EUROPEAN UNION(EU) 471 Million 6430 MTS
NORTH-EAST ASIA 2 Billion 19943 MTS
OTHER WEST ASIAN COUNTRIES 168 Million 2333 MTS
Total 4 Billion 53933 MTS
Toulene is imported only from the Four Regions
India imported approx 54 thousand MTS of Toulene in February 2013
ASEAN COUNTRIES
47%
NORTH-EAST ASIA37%
OTHER WEST ASIAN
COUNTRIES4%
EUROPEAN UNION(EU)
12%
REGIONS SUPPLING TOULENE
0 MTS
5000 MTS
10000 MTS
15000 MTS
20000 MTS
25000 MTS
30000 MTS
0 Billion
1 Billion
1 Billion
2 Billion
2 Billion
3 Billion
ASEANCOUNTRIES
EUROPEANUNION(EU)
NORTH-EAST ASIA OTHER WESTASIAN COUNTRIES
Toulene Value and Quantity
Value Qty
www.planetexim.net|[email protected]|+919831677758|Kolkata|India
©Mahavir Law House

Graphical Overview of imports in India under ch. 29 during February 2013 from around the Globe.
Country Value Qtantity
ISRAEL 168 Million 2333 MTS
KOREA,REPUBLIC OF 2 Billion 19943 MTS
MALAYSIA 16 Million 212 MTS
SINGAPORE 1434 Million 18701 MTS
THAILAND 495 Million 6315 MTS
SPAIN 49 Million 696 MTS
NETHERLANDS 290 Million 3925 MTS
BELGIUM 103 Million 1409 MTS
DENMARK 29 Million 400 MTS
4099 Million 53933 MTS
Port Average Rate % change from Avg price
Ennore 74251.87599 -0.671910389
Kandla 75993.62061 1.658053172
Kolkata 74214.9879 -0.721256266
Mumbai 75208.42129 0.607677716
Vizag 81183.59159 8.600772064
All ports 74754.15694
4 Billion of Toulene is imported from only Nine countries around the Globe
Average rate of Toulene at various ports of India during February 2013
0 MTS
5000 MTS
10000 MTS
15000 MTS
20000 MTS
25000 MTS
0 Million200 Million400 Million600 Million800 Million
1000 Million1200 Million1400 Million1600 Million
Country wise import
Value Qtantity
70000
72000
74000
76000
78000
80000
82000
Ennore Kandla Kolkata Mumbai Vizag All ports
Average Rate
www.planetexim.net|[email protected]|+919831677758|Kolkata|India
©Mahavir Law House
Graphical Overview of imports in India under ch. 29 during February 2013 from around the Globe.
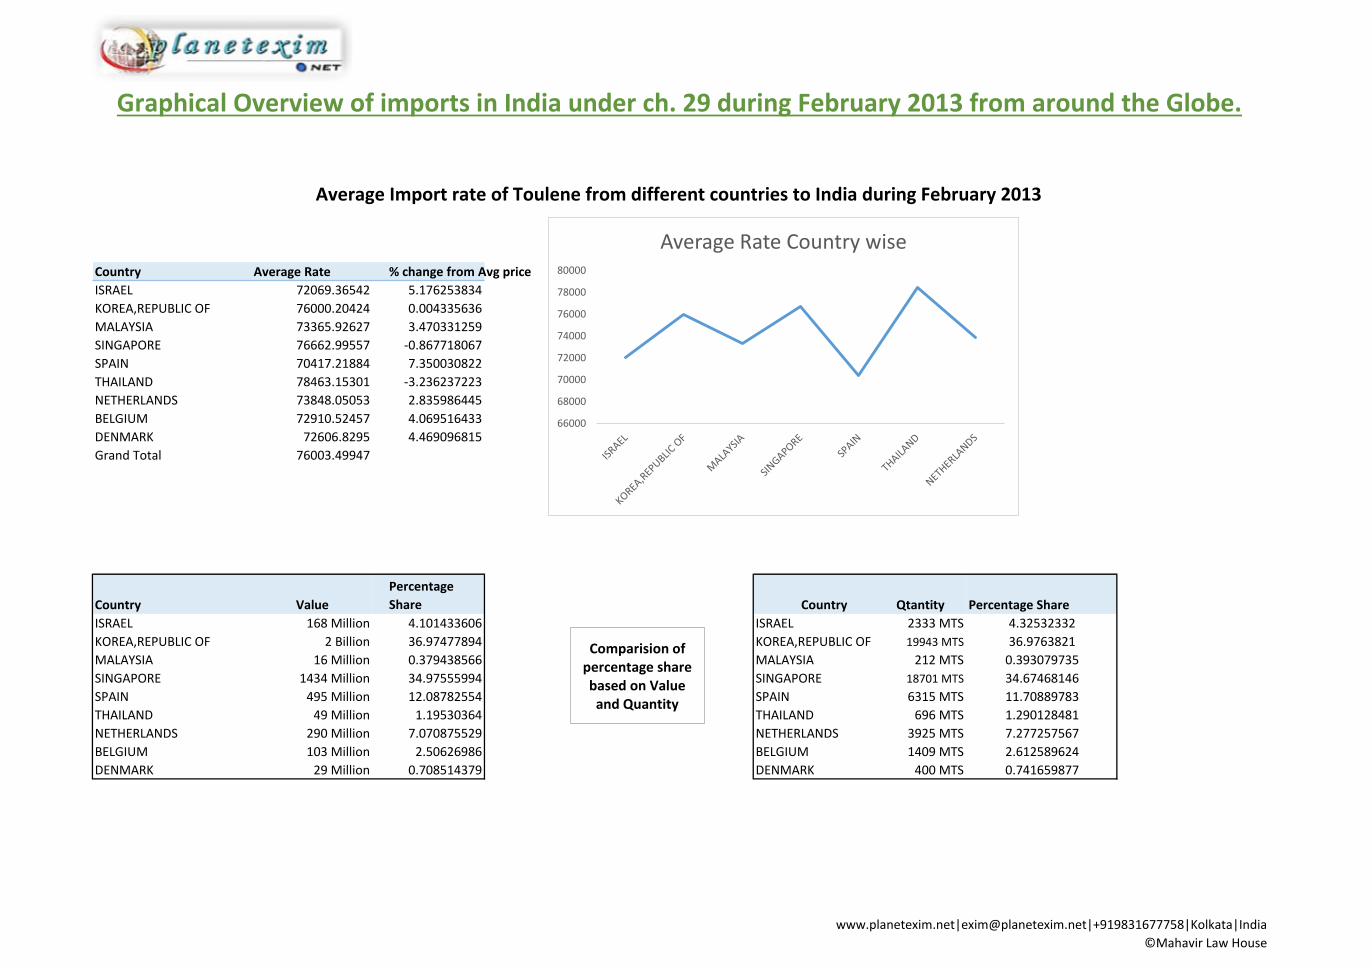
Country Average Rate % change from Avg price
ISRAEL 72069.36542 5.176253834
KOREA,REPUBLIC OF 76000.20424 0.004335636
MALAYSIA 73365.92627 3.470331259
SINGAPORE 76662.99557 -0.867718067
SPAIN 70417.21884 7.350030822
THAILAND 78463.15301 -3.236237223
NETHERLANDS 73848.05053 2.835986445
BELGIUM 72910.52457 4.069516433
DENMARK 72606.8295 4.469096815
Grand Total 76003.49947
Country Value
Percentage
Share Qtantity
ISRAEL 168 Million 4.101433606 ISRAEL 2333 MTS
KOREA,REPUBLIC OF 2 Billion 36.97477894 KOREA,REPUBLIC OF 19943 MTS
MALAYSIA 16 Million 0.379438566 MALAYSIA 212 MTS
SINGAPORE 1434 Million 34.97555994 SINGAPORE 18701 MTS
SPAIN 495 Million 12.08782554 SPAIN 6315 MTS
THAILAND 49 Million 1.19530364 THAILAND 696 MTS
NETHERLANDS 290 Million 7.070875529 NETHERLANDS 3925 MTS
BELGIUM 103 Million 2.50626986 BELGIUM 1409 MTS
DENMARK 29 Million 0.708514379 DENMARK 400 MTS
4099102665 53933 MTS
Country Percentage Share
4.32532332
36.9763821
0.393079735
34.67468146
11.70889783
1.290128481
Average Import rate of Toulene from different countries to India during February 2013
7.277257567
2.612589624
0.741659877
66000
68000
70000
72000
74000
76000
78000
80000
Average Rate Country wise
Comparision of percentage share based on Value and Quantity
www.planetexim.net|[email protected]|+919831677758|Kolkata|India
©Mahavir Law House

Graphical Overview of imports in India under ch. 29 during February 2013 from around the Globe.
Port Jan-13 Feb-13
Ennore 151 Million 43 Million
Kakinada 153 Million
Kandla 3 Billion 2 Billion
Kolkata 106 Million 30 Million
Mumbai 1178 Million 1497 Million
Vizag 21 Million 280 Million
4274 Million 4099 Million
Port Qty Jan 12 Qty Feb 13
Ennore 2056 MTS 577 MTS
Kakinada 2086 MTS 0 MTS
Kandla 35474 MTS 29610 MTS
Kolkata 1428 MTS 400 MTS
Mumbai 15859 MTS 19901 MTS
Vizag 270 MTS 3444 MTS
57172 MTS 53933 MTS
Percentage change
-71.93
-100
-5.67
Percentage change
-71.59
-100
-15.56
-71.99
27.04
1231.43
-4.09
February showed 4.09% decrease in the import of Toulene based on Value
February showed 5.67% decrease in the import of Toulene based on Quntity
1174.71
-16.53
-71.99
25.5
0 MTS
5000 MTS
10000 MTS
15000 MTS
20000 MTS
25000 MTS
30000 MTS
35000 MTS
40000 MTS
Ennore Kakinada Kandla Kolkata Mumbai Vizag
Toulene import in Jan 13 and Feb 13
Qty Jan 12 Qty Feb 13
0 Million
500 Million
1000 Million
1500 Million
2000 Million
2500 Million
3000 Million
Ennore Kakinada Kandla Kolkata Mumbai Vizag
Toulene import in Jan 13 and Feb 13
www.planetexim.net|[email protected]|+919831677758|Kolkata|India
©Mahavir Law House

Graphical Overview of imports in India under ch. 29 during February 2013 from around the Globe.
Regions Value Jan Value Feb
ASEAN COUNTRIES 2 Billion 2 Billion
NORTH-EAST ASIA 3 Billion 2 BillionOTHER WEST ASIAN
COUNTRIES 50 Million 168 Million
EUROPEAN UNION(EU) 42 Million 471 Million
Country Value Jan 13 Value Feb 13 Qty Jan 13 Qty Feb 13
ISRAEL 50 Million 168 Million 687 MTS 2333 MTS
KOREA,REPUBLIC OF 3 Billion 2 Billion 34863 MTS 19943 MTS
MALAYSIA 205 Million 16 Million 2738 MTS 212 MTS
SINGAPORE 1 Billion 1434 Million 13332 MTS 18701 MTS
THAILAND 375 Million 495 Million 4973 MTS 6315 MTS
SPAIN 42 Million 49 Million 578 MTS 696 MTS
NETHERLANDS 290 Million 3925 MTS
BELGIUM 103 Million 1409 MTS
DENMARK 29 Million 400 MTS
Total 4274 Million 4099 Million 57172 MTS 53933 MTS
NORTH-EAST ASIA was the highest looser in terms of % in supply of Toulene in India
Spain exported 696 MTS of Toulene for 49 Million INR which is chepest for the month of February
Percentage change
24.48
-42.15
238.55
1022.77
2 Billion
3 Billion
50 Million 42 Million
2 Billion
2 Billion
168 Million
471 Million
ASEAN COUNTRIES NORTH-EAST ASIA OTHER WEST ASIANCOUNTRIES
EUROPEAN UNION(EU)
Regions exporting toulene to India
Value Jan Value Feb
0 MTS
5000 MTS
10000 MTS
15000 MTS
20000 MTS
25000 MTS
30000 MTS
35000 MTS
40000 MTS
0 Million
500 Million
1000 Million
1500 Million
2000 Million
2500 Million
3000 Million
Toulene import from different countries
Value Jan 13 Value Feb 13 Qty Jan 13 Qty Feb 13
www.planetexim.net|[email protected]|+919831677758|Kolkata|India
©Mahavir Law House

Graphical Overview of imports in India under ch. 29 during February 2013 from around the Globe.
Port Value
Ennore 371 Million
Kandla 2 Billion
Mumbai 3 Billion
Vizag 1 Billion
Dahej 1 Billion
JNPT 222 Million
Mangalore 129 Million
Total 7648 Million
Port Value Qty
Ennore 371 Million 4183 MTS
Kandla 2026 Million 21691 MTS
Mumbai 3263 Million 34435 MTS
JNPT 222 Million 2375 MTS
Vizag 1019 Million 10551 MTS
Dahej 617 Million 6439 MTS
Mangalore 129 Million 1359 MTS
Total 7648 Million 81033 MTS
7.5 Billion worth of Styrene is imported in Seven ports of India in Feb 13
Mumbai or BPT is the highest impoter of Styrene
Ennore
Kandla
Mumbai
VizagDahej
JNPT
Mangalore
STYRENE import port wise
0 MTS
5000 MTS
10000 MTS
15000 MTS
20000 MTS
25000 MTS
30000 MTS
35000 MTS
40000 MTS
0 Million
500 Million
1000 Million
1500 Million
2000 Million
2500 Million
3000 Million
3500 Million
Styrene Value and Qty port wise
Value Qty
www.planetexim.net|[email protected]|+919831677758|Kolkata|India
©Mahavir Law House
Graphical Overview of imports in India under ch. 29 during February 2013 from around the Globe.
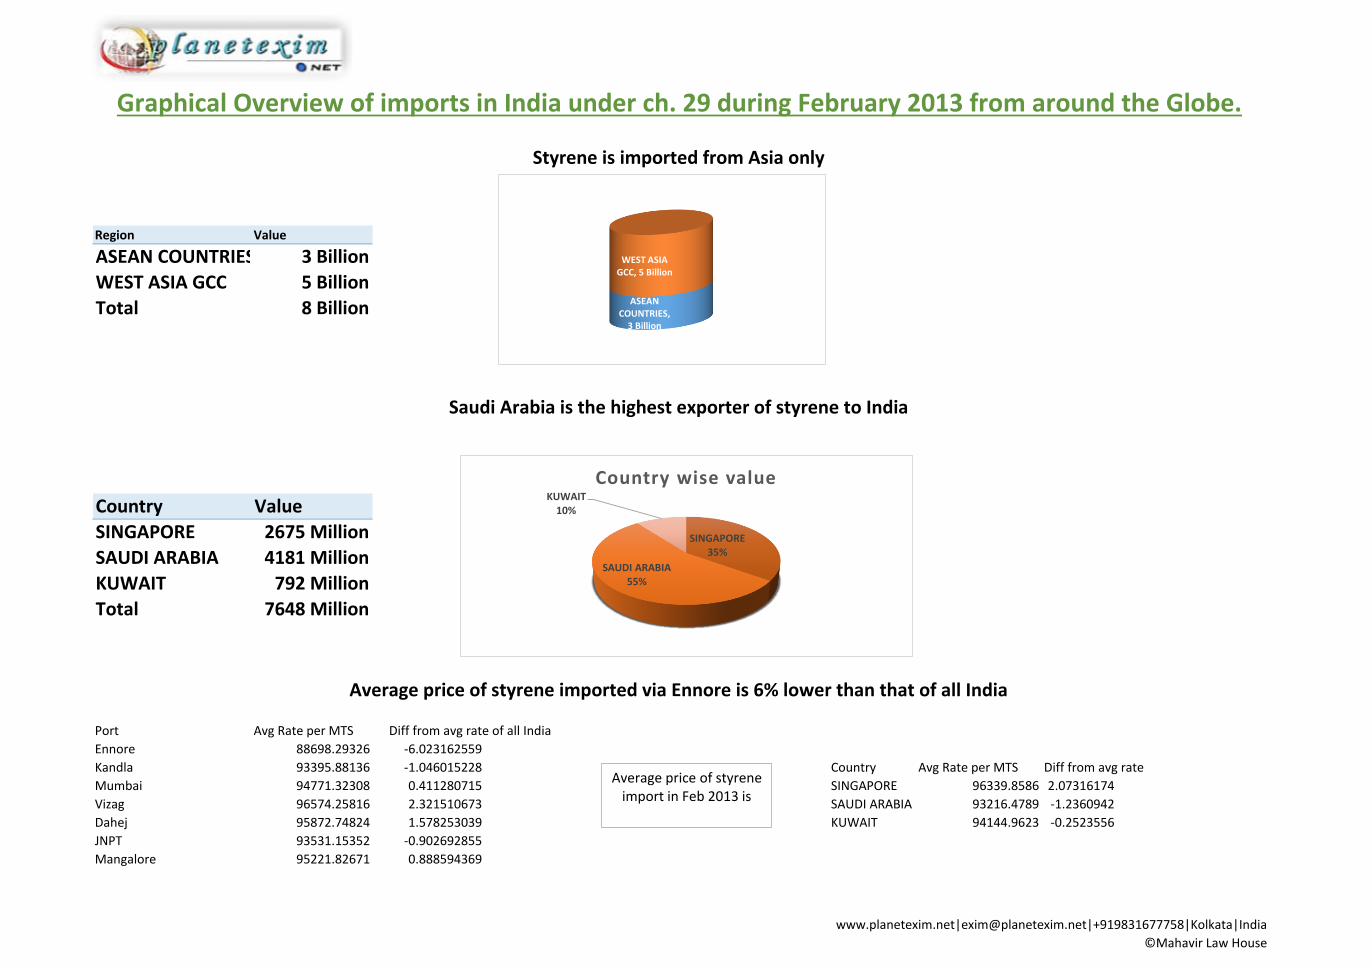
Region Value
ASEAN COUNTRIES 3 Billion
WEST ASIA GCC 5 Billion
Total 8 Billion
Country Value
SINGAPORE 2675 Million
SAUDI ARABIA 4181 Million
KUWAIT 792 Million
Total 7648 Million
Port Avg Rate per MTS Diff from avg rate of all India
Ennore 88698.29326 -6.023162559
Kandla 93395.88136 -1.046015228 Country Diff from avg rate
Mumbai 94771.32308 0.411280715 SINGAPORE 96339.8586 2.07316174
Vizag 96574.25816 2.321510673 SAUDI ARABIA 93216.4789 -1.2360942
Dahej 95872.74824 1.578253039 KUWAIT 94144.9623 -0.2523556
JNPT 93531.15352 -0.902692855 All 94383.1434
Mangalore 95221.82671 0.888594369
All 94383.14341
Styrene is imported from Asia only
Saudi Arabia is the highest exporter of styrene to India
Avg Rate per MTS
Average price of styrene imported via Ennore is 6% lower than that of all India
ASEAN COUNTRIES,
3 Billion
WEST ASIA GCC, 5 Billion
SINGAPORE35%
SAUDI ARABIA55%
KUWAIT10%
Country wise value
Average price of styrene import in Feb 2013 is
www.planetexim.net|[email protected]|+919831677758|Kolkata|India
©Mahavir Law House

Graphical Overview of imports in India under ch. 29 during February 2013 from around the Globe.
Port Country
KUWAIT
MALAYSIA
OMAN
SINGAPORE 2 Billion
13007 MTS
4752 MTS
18579 MTS
16944 MTS
Qty
Kolkata
With over 5 Billion worth of import, P-Xylene has the second largest share in terms of total imports of organic Chemicals. The item is
imported only in Kolkata from Four countries of Asia. Oman has the largest share in supply of P-Xylene
Value
1 Billion
438 Million
2 Billion
0 MTS
2000 MTS
4000 MTS
6000 MTS
8000 MTS
10000 MTS
12000 MTS
14000 MTS
16000 MTS
18000 MTS
20000 MTS
0 Billion
0 Billion
0 Billion
1 Billion
1 Billion
1 Billion
1 Billion
1 Billion
2 Billion
2 Billion
2 Billion
KUWAIT MALAYSIA OMAN SINGAPORE
Kolkata
P-Xylene import in India
Value Qty
www.planetexim.net|[email protected]|+919831677758|Kolkata|India
©Mahavir Law House

Graphical Overview of imports in India under ch. 29 during February 2013 from around the Globe.
Ports ValueKandla 1 Billion
Mumbai 1 Billion
Mundra 1 Billion
Vizag 242 Million
Cochin 166 Million
Mangalore 47 Million
Kolkata 11 Million
3 Billion
Port Value Quantity
Kandla 1270 Million 68199 MTS
Kolkata 11 Million 600 MTS
Mumbai 807 Million 45476 MTS
Vizag 242 Million 12492 MTS
Mangalore 47 Million 2618 MTS
Mundra 599 Million 31478 MTS
Cochin 166 Million 9204 MTS
3142 Million 170067 MTS
Region Value Quantity
ASEAN COUNTRIES 12 Million 700 MTS
OTHER WEST ASIAN COUNTRIES 2 Billion 115129 MTS
SOUTHERN AFRICAN CUSTOMS UNION(SACU) 7 Million 429 MTS
WEST ASIA GCC 986 Million 53808 MTS
3142 Million 170067 MTS
3 Billion worth of METHANOL (METHYL ALCOHOL) was imported via 10 ports of India in Feb 2013
170 thousand tons of Methyl Alcohol was imported under HS code 29051100 in Feb 2013
With 115 thousand MTS of export OTHER WEST ASIAN COUNTRIES became the largest supplier of Menthol to India
0 Billion
1 Billion
1 Billion
2 Billion
Port wise share in Methanol import
Kandla Mumbai Mundra Vizag Cochin Mangalore Kolkata
0 MTS
20000 MTS
40000 MTS
60000 MTS
80000 MTS
0 Million200 Million400 Million600 Million800 Million
1000 Million1200 Million1400 Million
Menthol Value and Quantity distribution accross India
Value Quantity
0 MTS
50000 MTS
100000 MTS
150000 MTS
0 Million
500 Million
1000 Million
1500 Million
2000 Million
2500 Million
ASEAN COUNTRIES OTHER WEST ASIANCOUNTRIES
SOUTHERN AFRICANCUSTOMS
UNION(SACU)
WEST ASIA GCC
Menthol Value and Qty distribution from different regions
Value Quantity
www.planetexim.net|[email protected]|+919831677758|Kolkata|India
©Mahavir Law House

Graphical Overview of imports in India under ch. 29 during February 2013 from around the Globe.
Country Value Quantity % share in Qty
SAUDI ARABIA 551 Million 29173 MTS 17.53% 17.15%
IRAN 2 Billion 115129 MTS 68.01% 67.70%
UNITED ARAB EMIRATES389 Million 22089 MTS 12.38% 12.99%
SOUTH AFRICA 7 Million 429 MTS 0.23% 0.25%
OMAN 46 Million 2545 MTS 1.46% 1.50%
BRUNEI 12 Million 700 MTS 0.39% 0.41%
Port Value
Mumbai 2 Billion
JNPT 2 Billion
Kolkata 493 Million
Chennai 12 Million
Tughlakabad 194385.56
Total 5 Billion
Region Value
WEST ASIA GCC 4 Billion
OTHER WEST ASIAN COUNTRIES 423 Million
ASEAN COUNTRIES 221 Million
EUROPEAN UNION(EU) 9 Million
NORTH-EAST ASIA 194883.54
Total 5 Billion
Methyl Alcohol is imported from 10 countries with Iran having the Largest share of 68% amounting to more than 2 Billion ruppees
% share in value
5 Billion worth of Ethylene glycol(ethanediol) is imported via 5 ports of India from Five different Regions around the globe
Mumbai
2 Billion
JNPT
2 Billion
Kolkata
493 Million
Chennai
12 Million
Tughlakabad
194385.56
NORTH-EAST ASIA
EUROPEAN UNION(EU)
ASEAN COUNTRIES
OTHER WEST ASIAN COUNTRIES
WEST ASIA GCC
www.planetexim.net|[email protected]|+919831677758|Kolkata|India
©Mahavir Law House

Graphical Overview of imports in India under ch. 29 during February 2013 from around the Globe.
Country Value Qtyntity % share in Qty
MALAYSIA 1 Million 30 MTS 0.02% 0.04%
SINGAPORE 220 Million 3486 MTS 4.47% 4.26%
GERMANY 1 Million 22 MTS 0.02% 0.03%
SAUDI ARABIA 3 Billion 51272 MTS 63.25% 62.59%
KUWAIT 1 Billion 19400 MTS 23.37% 23.68%
IRAN 423 Million 7556 MTS 8.58% 9.22%
UNITED ARAB EMIRATES6 Million 95 MTS 0.11% 0.12%
UNITED KINGDOM 8 Million 54 MTS 0.17% 0.07%
Country Value Quantity & value % Qty
Port Value Region Value KOREA,REPUBLIC OF315 Million 3658 MTS 15.28% 14.97%
Kandla 2 Billion NORTH AMERICA 1 Billion SINGAPORE 13 Million 145 MTS 0.63% 0.59%
Kolkata 113 Million NORTH-EAST ASIA 1 Billion THAILAND 396 Million 4602 MTS 19.20% 18.83%
JNPT 16 Million ASEAN COUNTRIES 409 Million SOUTH AFRICA96 Million 1286 MTS 4.66% 5.26%
Chennai 3 Million SOUTHERN AFRICAN CUSTOMS UNION(SACU) 96 Million TAIWAN 432 Million 5058 MTS 20.93% 20.69%
Total 2 Billion Total 2 Billion UNITED STATES811 Million 9695 MTS 39.28% 39.66%
Approx 82 thousand MTS of Ethylene glycol(ethanediol) is imported in Feb 2013 from Eight countries around the Globe
% share in value
29071110:- Phenol, as pure carbolic acid
Chennai
3 Million
JNPT 16 Million
Kolkata -113 Million
Kandla -2 Billion
29071110:-Phenol
NORTH AMERICA
ASEAN COUNTRIES
SOUTHERN AFRICAN
CUSTOMS UNION(SACU)
NORTH-EAST ASIA
0 MTS
2000 MTS
4000 MTS
6000 MTS
8000 MTS
10000 MTS
12000 MTS
0 Million
100 Million
200 Million
300 Million
400 Million
500 Million
600 Million
700 Million
800 Million
900 Million
KOREA,REPUBLIC OF SINGAPORE THAILAND SOUTH AFRICA TAIWAN UNITED STATES
Country wise Value and Qty
Value Quantity
www.planetexim.net|[email protected]|+919831677758|Kolkata|India
©Mahavir Law House

Graphical Overview of imports in India under ch. 29 during February 2013 from around the Globe.
Port Value
Kandla 361 Million
Kolkata 81 Million
Mumbai 1 Billion
Dahej 107 Million
JNPT 271 Million
Mundra 166 Million
1499 Million
Region Value Quantity
ASEAN COUNTRIES 908 Million 36254 MTS
NORTH-EAST ASIA 281 Million 11598 MTS
OTHER WEST ASIAN COUNTRIES 254 Million 10329 MTS
WEST ASIA GCC 56 Million 2216 MTS
Country Value Qtyntity % share value% share Qty
MALAYSIA 387 Million 15171 MTS 25.81% 25.12%
SINGAPORE 521 Million 21084 MTS 34.75% 34.91%
SAUDI ARABIA 51 Million 1993 MTS 3.39% 3.30%
IRAN 254 Million 10329 MTS 16.93% 17.10%
UNITED ARAB EMIRATES 5 Million 223 MTS 0.36% 0.37%
TAIWAN 209 Million 8661 MTS 13.92% 14.34%
CHINA 72 Million 2937 MTS 4.83% 4.86%
29152100:- Acetic acid
Port wise share
0 MTS
20000 MTS
40000 MTS
0 Million
500 Million
1000 Million
ASEAN COUNTRIES NORTH-EAST ASIA OTHER WEST ASIANCOUNTRIES
WEST ASIA GCC
Region Value and Quantity
Value Quantity
0 MTS
5000 MTS
10000 MTS
15000 MTS
20000 MTS
25000 MTS
0 Million
100 Million
200 Million
300 Million
400 Million
500 Million
600 Million
Countrywise Value and Qty
Value Qtyntity
www.planetexim.net|[email protected]|+919831677758|Kolkata|India
©Mahavir Law House

Graphical Overview of imports in India under ch. 29 during February 2013 from around the Globe.
Port Average Rate Diff from avg rate Country Average Rate Diff from avg rate
Kandla 24779.08186 0.146466078 MALAYSIA 25496.486 -2.744494
Kolkata 25836.5575 -4.114897637 SINGAPORE 24702.21 0.45623914
Mumbai 24799.89853 0.06258008 SAUDI ARABIA 25509.833 -2.7982805
Dahej 25407.83285 -2.38724397 IRAN 24570.237 0.98805961
JNPT 24112.77449 2.831518962 UNITED ARAB EMIRATES 24551.964 1.06169617
Mundra 25280.52134 -1.874210266 TAIWAN 24094.026 2.90706957
All ports 24815.42804 CHINA 24648.75 0.67167151
All Countries 24815.428
Port Value Qty Country Value Quantity
Kolkata 34 Million 506 MTS KOREA,REPUBLIC OF 1 Billion 19206 MTS
JNPT 1 Billion 22623 MTS MALAYSIA 204 Million 3035 MTS
Nagpur 1 Billion 14465 MTS THAILAND 924 Million 13353 MTS
Total 2519 Million 37595 MTS IRAN 62 Million 1000 MTS
UNITED ARAB EMIRATES 65 Million 1000 MTS
Total 3 Billion 37595 MTS
2.5 Million worth of Terephthalic Acid was imported in India in Feb 2012
40 % of Terephthalic Acid is imported from Nagpur ICD which accounts for 98% of total import at the said ICD
KOREA,REPUBLIC OF is the highest expoter of Terephthalic Acid to India
Average price of Acitic Acid import in Feb 2013
0 MTS
5000 MTS
10000 MTS
15000 MTS
20000 MTS
25000 MTS
0 Million
500 Million
1000 Million
1500 Million
2000 Million
Kolkata JNPT Nagpur
Portwise Value and Qty
Value Qty 0 MTS
5000 MTS
10000 MTS
15000 MTS
20000 MTS
25000 MTS
0 Billion
0 Billion
0 Billion
1 Billion
1 Billion
1 Billion
1 Billion
1 Billion
KOREA,REPUBLICOF
MALAYSIA THAILAND IRAN UNITED ARABEMIRATES
Countrywise Value and Qty
Value Quantity
www.planetexim.net|[email protected]|+919831677758|Kolkata|India
©Mahavir Law House

Graphical Overview of imports in India under ch. 29 during February 2013 from around the Globe.
Regions Value
NORTH-EAST ASIA 1 Billion
ASEAN COUNTRIES 1 Billion
WEST ASIA GCC 65 Million
OTHER WEST ASIAN COUNTRIES 62 Million
Port Value
Kandla 1 Billion
JNPT 402 Million
Mangalore 48 Million
Chennai 35 Million
Baroda 2 Million
Total 2 Billion
Country Value
KOREA,REPUBLIC OF 71 Million
MALAYSIA 409 Million
SINGAPORE 284 Million
GERMANY 48 Million
SOUTH AFRICA 2 Million
TAIWAN 129 Million
UNITED STATES 472 Million
INDONESIA 15 Million
CHINA 85 Million
FRANCE 6 Million
Total 1522 Million
Terephthalic Acid is imported from different countries of Asia only @ 67000/ MTS
2 Billion of BUTYL ACRYLATE was imported in India in Feb 13
Terephthalic Acid
NORTH-EAST ASIA
WEST ASIA GCC
OTHER WEST ASIAN
COUNTRIES
ASEAN COUNTRIES
Kandla
JNPT
Mangalore
Chennai
Baroda
0 Billion 0 Billion 0 Billion 1 Billion 1 Billion 1 Billion 1 Billion
KOREA,REPUBLIC OF, 5%
MALAYSIA27%
SINGAPORE19% GERMANY, 3%
SOUTH AFRICA, 0%TAIWAN8%
UNITED STATES31%INDONESIA
1%
CHINA6%
FRANCE0%
COUNTRY WISE SHARE
www.planetexim.net|[email protected]|+919831677758|Kolkata|India
©Mahavir Law House

Graphical Overview of imports in India under ch. 29 during February 2013 from around the Globe.
Country Average Rate Diff in Avg Rate
KOREA,REPUBLIC OF 103897.75 2.11
MALAYSIA 101339.39 -0.40 Port Average Rate Diff in Avg Rate
SINGAPORE 112428.06 10.50 Kandla 104302.57 2.51
GERMANY 103602.22 1.82 JNPT 94420.89 -7.20
SOUTH AFRICA 103206.85 1.43 Mangalore 107196.6 5.35
TAIWAN 105138.33 3.33 Chennai 112418.5 10.49
UNITED STATES 95145.76 -6.49 Baroda 108125.55 6.27
INDONESIA 108999.82 7.13 All ports 101748.16
CHINA 102377.65 0.62
FRANCE 91005.29 -10.56
All Countries 101748.16
Air Port Value
Mumbai 1 Billion
Chennai 579 Million
Hyderabad 483 Million
Delhi 386 Million
Amhedabad 121 Million
Bangalore 50 Million
Kolkata 25 Million
Total 3 Billion
29420090:- Diloxanide furoate, Cimetidine, Oxyclozanide, Famotidine: Other
Over 3 Billion of chemicals are under HS Code 29420090 is imported in India via seven Air ports. Mumbai is an number one with a share of
33% at 1 Billion Rupees in Feb 2013
Malaysia is the highest expoter of Butyl Acrylate to India and more then 50% of is imported Butyl Acrylate comes via Kandla
Average Rate comparision of BUTYL ACRYLATE ports and
countries
29420090
All Ports
3 Billion
Mumbai
1 Billion
Hyderabad
483 Million
Amhedabad
121 Million
Kolkata
25 Million
Bangalore
50 Million
Delhi
386 Million
Chennai
579 Million
www.planetexim.net|[email protected]|+919831677758|Kolkata|India
©Mahavir Law House
Graphical Overview of imports in India under ch. 29 during February 2013 from around the Globe.
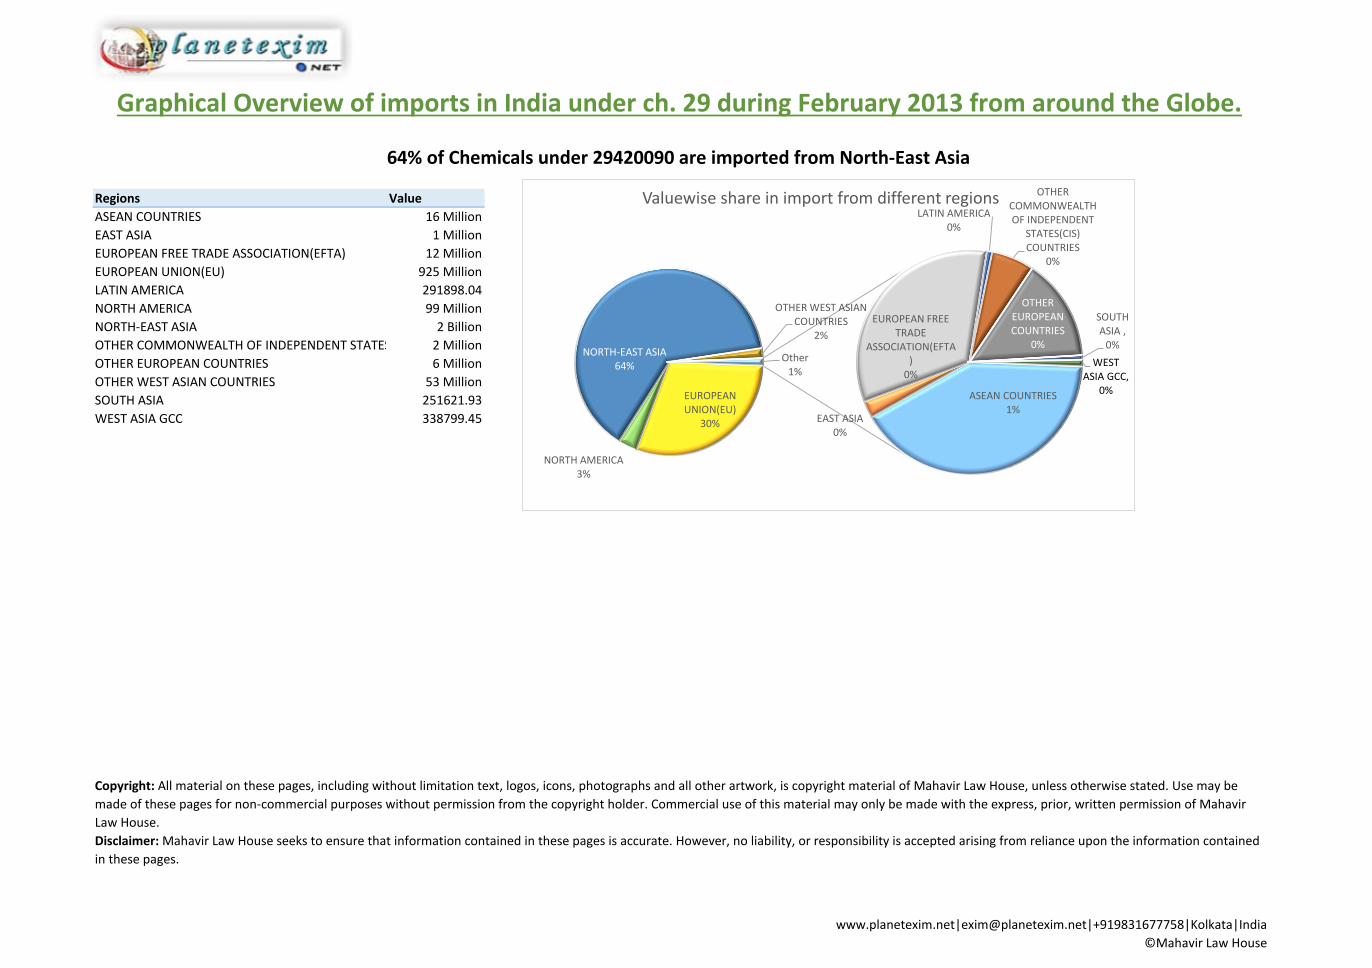
Regions Value
ASEAN COUNTRIES 16 Million
EAST ASIA 1 Million
EUROPEAN FREE TRADE ASSOCIATION(EFTA) 12 Million
EUROPEAN UNION(EU) 925 Million
LATIN AMERICA 291898.04
NORTH AMERICA 99 Million
NORTH-EAST ASIA 2 Billion
OTHER COMMONWEALTH OF INDEPENDENT STATES(CIS) COUNTRIES 2 Million
OTHER EUROPEAN COUNTRIES 6 Million
OTHER WEST ASIAN COUNTRIES 53 Million
SOUTH ASIA 251621.93
WEST ASIA GCC 338799.45
64% of Chemicals under 29420090 are imported from North-East Asia
Copyright: All material on these pages, including without limitation text, logos, icons, photographs and all other artwork, is copyright material of Mahavir Law House, unless otherwise stated. Use may be
made of these pages for non-commercial purposes without permission from the copyright holder. Commercial use of this material may only be made with the express, prior, written permission of Mahavir
Law House.
Disclaimer: Mahavir Law House seeks to ensure that information contained in these pages is accurate. However, no liability, or responsibility is accepted arising from reliance upon the information contained
in these pages.
ASEAN COUNTRIES1%
EAST ASIA 0%
EUROPEAN FREE TRADE
ASSOCIATION(EFTA)
0%
EUROPEAN UNION(EU)
30%
LATIN AMERICA 0%
NORTH AMERICA 3%
NORTH-EAST ASIA64%
OTHER COMMONWEALTH OF INDEPENDENT
STATES(CIS) COUNTRIES
0%
OTHER EUROPEAN COUNTRIES
0%
OTHER WEST ASIAN COUNTRIES
2%
SOUTH ASIA ,
0%
WEST ASIA GCC,
0%
Other1%
Valuewise share in import from different regions
www.planetexim.net|[email protected]|+919831677758|Kolkata|India
©Mahavir Law House