Indian Child Welfare Act of 1977 Hearing before the United States … · 2015-02-24 · 10...
35
..... 1 •... 9 ij .. •.•• . .•. j. j APPENDIX G INDIAN CHILD WELFARE STATISTICAL SURVEY, JULY 1976 ASSOCIATION ON AMERICAN INDIAN AFFAIRS, INC. The Association on American Indian Affairs (432 Park Avenue South, Ne\v York, New York 10016) Is a private, non-profit, national citizens' organization supported by members and contributors. Founded In 1923, It assists American Indian and Alaska Native communities in their efforts to achieve full economic, social and civil equality, and to defend their rights. Policies and programs of the Association are formulated by a Board of Directors, the majority of whom are Indian and Alaska Native. One of the special publications of the Association is "Indian Family Defense," a newsletter exclusively concerned with Indian child welfare issues. (537)
Transcript of Indian Child Welfare Act of 1977 Hearing before the United States … · 2015-02-24 · 10...
···.··~I;·.~1
.....1•...9:~;ij
..
•.••.~.•.j.":~
j
APPENDIX G
INDIAN CHILD WELFARE STATISTICAL SURVEY, JULY 1976
ASSOCIATION ON AMERICAN INDIAN AFFAIRS, INC.
The Association on American Indian Affairs (432 Park Avenue South, Ne\vYork, New York 10016) Is a private, non-profit, national citizens' organizationsupported by members and contributors. Founded In 1923, It assists AmericanIndian and Alaska Native communities in their efforts to achieve full economic,social and civil equality, and to defend their rights. Policies and programs of theAssociation are formulated by a Board of Directors, the majority of whom areIndian and Alaska Native.
One of the special publications of the Association is "Indian Family Defense,"a newsletter exclusively concerned with Indian child welfare issues.
(537)
538
IN'f1\OllUCTIOK
~l'his report presents the results of a nation-wide Indian child-welfare stntlstienl'Snl'H'y (lone hy the Associntion on American Iudinu Affairs (AAIA) nt the request'Of the American' Indian Policy Review Commission, an agency of the UnitedStatcs Congress, in .lnly 19iO.
'I'hp report inrlicnt es thnt Indian children are heing removed from their faml liesto \lI' plnced in adoptive care, foster care. special institntions, and federnl boardin~ schools at rates far out of proportion to their percentage of the population,
~rhe clispnrity in placement rates for Indian und non-Indian children is shockingnnrt cr ies out for sweeping reform at all levels of government, .. In'::\laiup, Iudlan chttdren.are tadar placed in foster care' at a percnpitn rate10 t luu-s grenter thnn thn t for non-Indin n chl ldreu. In Minnesotn, an Indian chlhli", Ii t imes more likel~'than a non-Indlnu child to ue placed in foster care. In~onl h Dakota 1>('1' cnpitn foster-care rate for Indinus is 22 times the rate for
.nnn-Iudtans. The statistics from other states dem'bnstrated that these rates arellot uncommon elsewhere,
"[o",t. of the Indian children in foster carl' are placed with non-Indinn fumi lies,.I n "ll1i11C. for example. 64 per cent of Indian roster clrildren nre living witn nonItulin n f.lmilips. In New York npproxi mntely Oi per cent of Indian foster clnlrlren111'(' iun.m-Indin n families, 'and ill Utah 88 per cent of the Indian foster-care placenu-nts nre with non-Indian frunl lles ..
Indian ch ilrlren lire nlso placed- in ndoptlve homes nt n rnte far disproport iounteto thnr for non-Incllnn children. In GalifClrnin, Inrlinn children were ll(lo\ltec! in'10,;' nt a por cupitn rate 8 times thnt for nou-Indian children, and D.3 PCI' cent of'~l1cll ndnpt ions were made 'b~' nou-Inrunn parents. In Montnnn, Indlnn chilrlrennre nrloptecl lit a' per capitn rate almost 5 times thnt for non-Indian, and Siller
,rellt of snchadoptlons were mnrleby non-Indians. .III stnres sueh as Alnskn, Artzoun. nnrl New ·;'Ilexico. which hnvr- Inr!!p numbers
o{ Judin n cluldreuIn bonrrlmg schools or boarding home nrogrruns, the rates nt'"Ilil'h Inrlinn chi ldren ure sepn rntcrl frrun thelr fnmUip'l iud ir-u ts- nn even ;;reatpl'lli~[lro\lorti,m til the non-Indinu rate, In ":P\Y lIlpxico, when nrloptlvo cure, roster«a re. nnd fpr!cral honrdtng school placements are added together, Indinn childrennrc Ill'ing sl'parntC'd from their families todny Ill. 11 per cnpitn rnte T4 tinws thatfur nou-l ndiuu childrCll. '. Kntionwidp,ino;'e t.han 2[1,000 In.dian ehildren (mallY as yonng as six years old)an' 1,lncpt! in V.s. Bl11'Plln of lnrlinn Affnirs lJonrdin,l( srhool",. Enrnlllllpnt in.BIAlHlnnlil1g schools Ilnrl c\ormitories \" not. hllsed primarily Oil the ('dllrntionnl l1l'eds·of tll(' ('hildl'pn ; it i~ rhiplir a mel111S of pro'l"idillg' sllJ1.~titute cnre. '1'he standards{Ol' tnkin~ ('hihlrl'n f)'l>1Il thpir hOllies for honl'(lilll! I'chool \llnl'elllcnt nl'e I1S \'nl;ne'nIl(l as arhitrllr~' as nre i'tnnrlnrrl'" for, Illclinn fo"tpr cal'p plar'l'nlents.
'J'hl' rlntn hl1se for I'llr inc]l\·i(\.nnl statp re\lortl' consi",ts of "tllti~tic~ Sl1llplicll to;fhp AAIA by rrspol1sihle fprlpl'l1) ~l1d state I1geIlPip". '1"lJe stllti"'tip~ ,10 lint illl'1ndl'1l1111l.Y llll]inn rhihlrPIl livill~ ol1tsi(l(' thcil' IIntllml fl1l1lilicl' for wlJkh therp are 11f)~latj;:ti('~, among' them: (1) informal pln('ell1elltl' of Indian rhildrrn tlJat rIo 110tgo Ihl'Ol1l;h any ll'gallll'oce~l'; (2) pri"l1te hOllrdin~ home progrnms which, in 80me\1'('1'11'1'11 ~tat('s, plll(,[' tholl"nIH]", of lnclinn ('hilclrl'n nWllr from their families forth" rlltil'e school ~'pnl': (3) ]lH]inll·tn·Illclil1ll on'],~:(,I"'l1tinn plo('ell1ent.Q whil'lJ,whill' lll·"fprnhle to II!neelllPllts With 1l0l1·lnr1iall flll1lilips otT the reseryntioll, lireIlP\'pl'tllp]ess I1n indirntion of fnmlly breakdown; and (4) I\l(llnn juveniles inrar·('('rnlpd in correctiollnl institutions.
'1"h(' ~tllte·widp figures preselltrd hprp nftell mnsk illl[lOrtl1nt 'l"nrintions within11 slnte. Thosr f<tatp,q for which the As!<ocintioll hns hepn I1hle to rIo coullty-hyronnl~' hrenkrlowl1R of 111rlinn fORter carp generall~' demonstrate n widp Ynrintlon1'1'1 \\'PPII cOllllllllnltlrs. 'l'lJiR indiC'atpf< n need for e:renter IJreciRlrm In how child·w('lfare f<tntiRt.l(,R nre cOlllpiled and nnalyzed lJy the states and federal go"em·1lJel1t.
..:....:;'..,.'~.
·t
539
The separation of Indian children from their families frequently occurs 1JIl'situa tlons where one or more of the following exist: "
(1) the natural parent does not understand the nature of the documents orproceedings Involved; ,
(2) neither the child nor. the natural parents are represented by counselor' .otherwise advised of their rights; .
(3) the public officials involved are unfamiliar with and often disdainful of"Indian culture and society; ,
(4) the conditions which led to the separation are not demonstrably harmful'or nre remediable or trnnsitory in eharacter :and. ., ";')
(5) responsible tribnl authorities and Indiau community agencies are not COJla'sultcd a.hout or even informed of the actions, . " './
On August 27, 1976 Senator James Abourezk, Chairman of the U,S. Sennt",':"Sllbc~11lmittee on Indian Affairs, introduced a hill drafted by the Association on:'.American Indian Affairs and entitled the "Indian Child Welfnre Act of 1970" .: ,(S .. .3i77): 'I'hat .bill, if enacted, would establish standards for the placement of"::'Indian children III foster or adoptive homes, assure that Indian famllies will be"ac~orded a fU.lI and fai.!' hearing when child placement is at issue, establish a prl.'·';01'1t.;" for In~1Jan adoptive and foster families to care for Indian children, support· ..·Indla~1 fam11y development programs, and generally promote the stabllity· and"security of Indian family life. .r I,"
. "Jr' ..
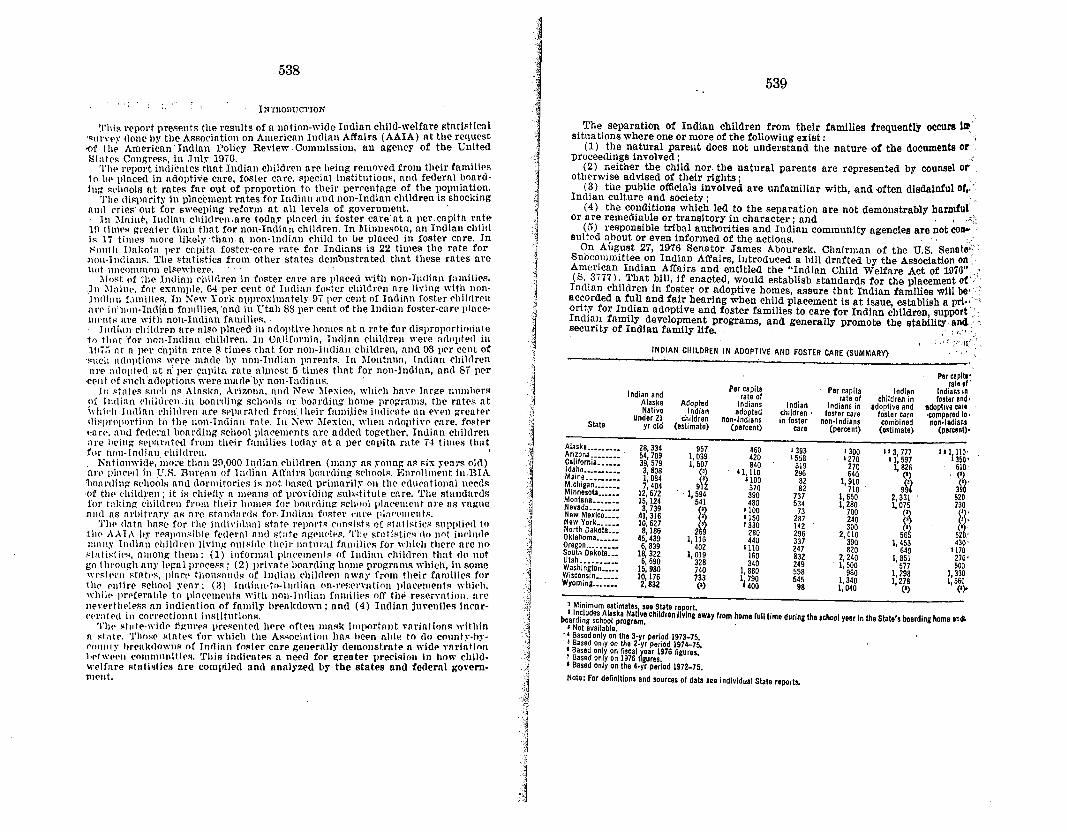
~NDIAN CHILDREN IN ADOPTIVE AND FOSTER CARE (SUMMARY) . '..
Per capll.~
Per capitaral. of'
Indianand Per capita Indian Indian'Inrat. of rat. of ehildrenin fo,t.r and;Alaska Adopt.d Indians Indian Indiansin adoptiveand adoptive CIIINativ. Indian adopted children' rost9r care tester care ,compar.d 10'
Stateunder 21 children non·lndians in foster nen-tndlens combined non-Indian,yr old (estimate) (percent) care (percent) (estimate) (p.rcenl)-
Alask •••••• _••• 28,334 957 460 1393 1300 .. 3,777 II 1,110'Arizona __ ...... ___.. . 54,709 1,039C.lifornia_.__ •• 420 1558 1270 11,597 '350'39,579 1,507 840 319 270 1,826 610Idaho••_••• ___• 3,808 (a) 41,110 296 640 (I) (I)Mame._............. 1,0849\'~ '100 82 1,910
~1~~~:;t3:::::: ~) 3~~'7,404 370 82 710 9 412,672 'l,m 390 737 1,650 2,331 520Montana ___ ._.• 15,124 480 534 1,280 1,075 730N.vada.• ____ •• 3,739
~:~1100 73 700 (')
~rNewMexico____ 41,316 '150 287 240
~:iN.w York_•.••• 10,6272 '~
r330 142 300 ('North Dakota__• 8,186 280 296 2,010 56 52 'Oklahoma.._••• 45,489 1,116 440 337 390 1,453 430'Oregon ... _._••• 6,839 402 1110 247 820 649 1170South D.kote__• 18,322 1,019 160Utah.__ .•• ____ 832 2,240 1,851 270'6,690 328 340 249 1,500 577 500Washinglon•••__ 15,980 740 1,880 558 960 1,298 1,330Wisconsin .._____ 10,176 733Wyoming_•• _••• 11 ~~~ 545 1,340 1,278 1,5602,832 (.) 98 1,040 (I) (1)0
1 Minimum eslimat.s s.e Slate r.porl.bola~gfA~d:~h~~s~~o~~~~~ children liVing ew.y from homefuliUme duringthe school y8lr IntheState's boarding home endl
I Nolavailable,.• Bas.donlyon the 3-yr period1973-75,• Bas.d oniyon the 2.yr p.riod 1974-75,• Bas.d onlyon fi,cal y.ar 1976 figures,! Bas.d onlyon 1976 figures.I Bas.d onlyon the 4-yr period1972-75,
Note: Fordefinitions and sourcesof dala see individual State reports,
540
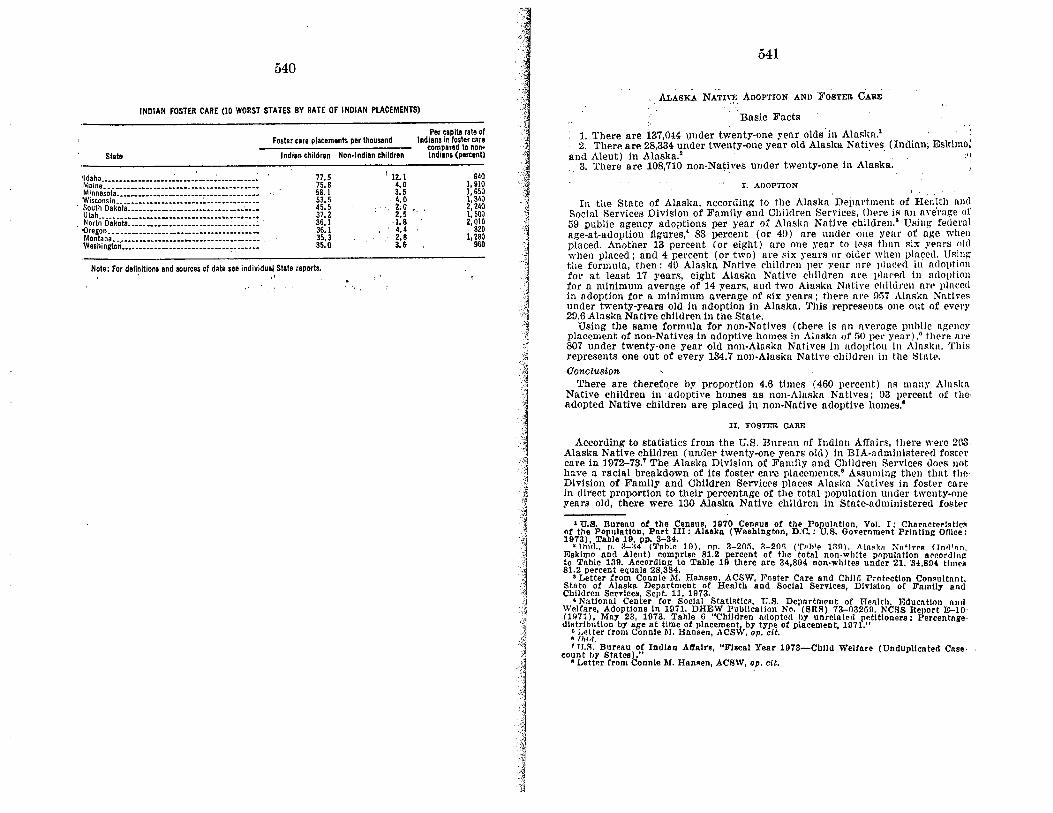
Note:Fordefinitions andsources of data see individual State reports.
INDIAN FOSTER CARE (10 WORST STATES BY RATE OF INDIAN PLACEMENTS)
II. FOSTIm CARE
According to statistics from the U.S. Bureau of Indlnn Affnirs, there were 203.Alaska Native children (under twenty-one years old) in BIA·ndministered fostercare in 1972-73.' The Alaska Division of Family and Children SerViCI'R does nothave a racial breakdown of its foster care placements." ARsuming then thnt theDivision of Family and Children Services places Aluakn Natives in foster carein direct proportion to their percentage of the total populatlon under twenty-oneyears old, there were 130 Alaska Native children in Stute-aduunlstered foster
I. ADOPTION
541
In the State of Ataslca, according to the AlaRIca Depa rt.ment of Henlth findSocial Services Division of Fnmilv and Children Services, there is fill n veruge of59 public agency adoptions per year of Alnskn Native children." Using feelerlllage-at-adoption figures,' 83 percent (or 4ll) fire under one year of nge whenplaced. Another 13 percent (or eight) arc one year to less than six yen rs (1](1when placed; and 4 percent (or two) are six rears or older when placed. URinl:"the formula, then: 4D Alaska Native children pel' year a re plucerl in nrlopt ioufor at least 17 years, eight Alaska N"ative children are plal'eel in arloptlonfor a minimum average of 14 yearR, and two Alaska Nntive chi ldreu nn- placedin adoption for a minimum avernge of Rix years; there nro 057 Alaska Nativesunder twenty-years old in adoption in Alaska. ~'his represents one out of every20.6 Alaska Native children in the State.
Using the same formula for non-Nntlves (there is nn nveruge public ngpncyplacement of non-Natives in adoptive homes in Alaska of 50 pel' year) " there nre807 under twenty-one year old non-Alaska Natlves in udoptiou ill Alnskn, Thisrepresents one out of every 134.7 non-Alaska Native children in the State.
Oonclusioltl'here are therefore hy proportion 4.6 times (460 percent) ns many Alnskn
Native children in 'adoptive homes as non-Alaska Natives; 03 percent of tileadopted Native children are placed in non-Natlve adoptive homes.'
ALASKA NATn:~ ADOPTION AND 'FOSTER CARE.Basic Facts
1. There are i37,044 Hilder twenty-one year oldsIn Alaskn.'2. There are 28,334 under twenty-one year old Alaska Natives (Indian; Eskimo;
and Aleut) in Alaska! . . ,'J. 3. There are 108,710 non-Natives under twenty-one in Alaska.
• U.S. Bureau ot tbe CensuR, 1970 Census of th .. Population, Vol. I: CbnracterlRtlcRot the Population. Part III: Alaska (Wasblngton, D.C.: U.S. Government Printing Otllce:19T3), Table 19, pp. 3-34.
• lhld .. p. 3-:14 (Table 1.11), np. 3-20~. 3-20n (T"h'p. 1~1l). A1n.k" ~n'I,""R (hlllinn.Eskimo and Aleut) comprise 81.2 percent or the total non-whf te populntlon arcordlnl:to Table 139. According to Table 19 there are 34,894 non-whites under 21. '34,8114 times81.2 percent equals 28,334.
• Letter from Connie M, Hansen, ACSW, Foster Care and Chllrl Protection Consultnnt,Stnt.. or Alaska Department ot Health and Social services, DIvision or Fallllly andChildren Services, Sept. 11. 1973.
• National Center tor Social StatlRtlcR, U.S. Depnrtment of Health. FJducatlon AndWclfRre, Adopttons In 11171. DHEW Publication No. (SRS) 73-032ull, NCSS Repor-t E-10'(971). May 23, 1973. TRhie 6 "Children adopted hy unrelated pettttoners r Percentnge..dlstrlbntion hy age at time or placement/,by type of placement, 11171,"
u Letter from Connie M. Hnnsen, ACSW, op. cit .., n,I/I.'TJ.R, Bureau or IndIan Affairs, "Fiscal Year 19'T3-Chlld WeJ(are (Undupllented Cnae
eount by States)."• Lett..r from Connie III. Hansen, ACSW, op. cit.
6401,9101,6501,3402,2401,5002,010
8201,280
960
r 12.14.03.54.02;02.5
,1.84.4
'N
77.575.858.153.545.537.236.136.135.335.0
Foster care placements perthousand
Indianchildren Non·lndian childrenSlate
'Idaho.••••••••••••••••••: •••••: •••• : ••••••••••:Maine•• .......__..__.. ........ .. .... ....__..
·ro:~~;~~i~~: ~::::::::::::::::::::::::::::::::::~. South Dakota•••••••••••••••••••••••••••••••·••••
Utah., •• _._._•• _._•••••••••••••••••••••_••••••
.~~;~~~.a.".0!~:::::::::::::::::::::::::::::::::::Montana .. _.. __ ,,:. .10. ..
Washi nglon••••••••••••__••••• _.- •• -_.-- c•• - _•••
I. ADOPTION
II. FOSTER CARE"
r;,-: !
In the State of Arizona, according to the Arizona Department of EconomicSecurity, there were an average of 6ti public agency adoptions per year of American Indian children from 1969-1972.' Using federal age-at-adoption figures,"83 percent (or 54)' are under one year of age when placed. Another 13 percent'(or eight) are one year to less than six years old when placed; and 4 percent'(or three) are six years or older when placed. Using the formula, then,
54 Arizona Indian children per year are placed in adoption for at least 17 years,eight Arizona Indian children are placed in adoption for a minimum average of,14 years; and three are In.adoption.ror a minnnum average of three years; thereare 1,039 Indians under twenty-one year olds in adoption in Arizona; 1'his repre-sents one out of every 52.7 Indian children in the state. ,
Using the same formula for non-Indians (there were an average public agencyplacement of non-Indians in adoptive homes in Arizona of 104 per year froll1'1969-1972) " there are 3,111 under twenty-one-year-old: non-Indians In adoptionin Arizona. This represents' one out of every 220.4' non-Indian, children in theState.Oonclusion
By rate" therefore, Indian children are plriced in adoptive homes' 4.2 times(420%) mote often than non-Indian children in Arizona.
Basic Facts
1. There are 740,460 under" twenty-one-year-olds in the State of Arizona,'2. There are 54,709 under twenty-one-year-old American Indians in' the State:
or Arizona,' , ' ,3. There are 685,751 non-Indians under twenty-one in the State of' Arizona~,
543
ARIZONA ADOPTION AND FOSTER CARli: STATIBTIOEl
In the State of Arizona, according to statlstlcs from the Arizona Departmentof Economic Security, there were 130 Indian children in foster care in April 1976under a State contract with the U.S. Bureau of Indian Affairs.' There are nostatistics giving a racial breakdown for the other State-administered foster careprograms that' include Indian children. However; malting the most conservativeassumption possible, that is, that' the Arizona Soclaf Services Bureau; placedIndian children in, foster care in direct proportion to theiz percentage of thepopulation, there were an additional 208 Indian children in State-administeredfoster care.' (That this is indeed a most conservative' assumption is, demon.atrated bY'the- appendix to this;report. The appendix, based on a ran~om sam-.',
1 U.S. Bureau of tbe Census, Census ot Population: 1970, Volume' r, Cbllraeterlstlcs otthe Population, Part 4, Arizona. (U.8. Government Printing Otllce :Wasblngton, D.C.:1973) h pp. 4-30.
I a.",. Bureau ot the Census, Census o,r Population: 1970, Subject Reports, Flnnl ReportPC(2)-lF, ".American Indians" (Wasblngton, D.C.: U.S. Government PrInting Offlce:1973). Table 2, ".Age of tbe Indian Population by Sex and Urban and Rural Residence:1970," p. 6.
:: (lIn('f1 of RefH'Inrrh Ilnd llpnortR, ~nclnl Rpr\·I~(>,q 'Rp,,("n11. Ii rJ7-f'lll'l Dpnnrtmp.nt or Rpn~
nomic Security, "Cblldren placed In adoption during 1969, 1970, 1971 and 1972" ('Chllrt)• I\'a'tionlll Center for SOCIO,I ~'tatlstlcs, l;,~. Dp.lJurtlllent of Henlth, Ed"cn tJon ni"l WelfRre:
"" ,!oorion. in 1 fl71," nHJ1)W r::'''l'"" tlon No. (!'Inl'l) n-()~2~fl. NI;!'I!'I Re"ort F~10(1971), 'MIlY 23, 1973, Table 6, Children adopted by unrelated petitioners: PercentagedlAtrJbutlon by IIge st time of placement, by type of placement 19'71,"
• "Children plllced In adoption during 1969, 1970, 1971, and 1972" 01'. cit.• Telephone Intervlew wltb Mr. WallT Earl, .Arizona Department otlIlconomlc Security
July 22. 1976. 'T {hid. ,\ rl1-On', reporlerl 2,8()fl ehllrJren In foster rAre In April 1016, exclndlnl1 tho ..
on the BIA contract. Indian children comprise 7.4 percent of tbe oncler twenty-one yearoldl In .Arizona. 2,809 times .014 equals 208,
542
care In 1073.' The combined figures (808 children) represent one out of every
72 Alnskn Native ehlldreuin the S~~~i I f Family and Children Services alsoBy eompnrlson (~sSulmn~ th~ . n ~?n 0 ortion to their percentage of the
places non-~ath'es III fOS~9t Call' ;:~t1~~e~tR~~~n In foster care In 1973,'· repre-~~N~l::~ig~~'o~~~~ee~~::: 210);~~;:Native children in the ,State~"
ConclUsion ;,,:, " " :: '.'. . laced iI~ fostl';' homes 3,0 timesBy rute, therefore: Alaska ?\atn'e Cll1l~lrenfl;~~e ~atl\"l'R in Alasl,a. (Because
(800 percent) more oft.en than non Ala, . liable to supply a raclnlthe'Divi"ion of }<'alllily,and Chll~ren Serv~c{~R~lf~llu tile conR~rvath'e assumpbreakdown for foster care,. these gures 1I~ t~;t Alaska ~ati~es represent the,tlons stilted above. ,Vere It to b~ assumte as tlley do adoptive placements, thesame percentage of foster care 11 acemen s . th double) ,l1iRpropotrion In' foster care rates would more nn .
, III. ADOPTIVE cARE, FOSTim CARE, AND BOARDING PROGRAMS,
, '. r . ' y froin home full-time during theA large number of Nat!ve studen~)Hi ~~,u 2585 village Native students ill
school yeur, In 1972-73, 2,427 (94?o 0 Ie. l' home or boarding school propublic high schools were enro~led III ~. boa:I?~1I~umber of Indian children who~l'IUl1,1t A more. proper way a CO:llPIl In~ of A1aska is to include the boarddo not live in their nntural homes III the State bi ed total of Native children iniug school figures. When this is done, tdih,e con~ gl~ams is 8777 representing onefORter homes ndoptive homes und boar ng pIO , , '
, .! 5 Al I- ~ative children in the State.uu I'. of every I.. as ca I Nntiv ist enroll in boarding programs, th.e non~
Since .few, If n~y,. nonI-d. a nrs ,n~\ ptf,e homes and foster homes remains theNattve figure of 1,303 ch I ren u nOT lves 'same, representing ,on~ in every 88.~ non-Nat!" ' '
CC>I!clllsicY/t , " . i lames and In foster homes, adoptiveAlaskn ~ative children all' out of tJ~e ~1 ~ times (1110 percent) greater than
homes, or in hoarding progrnms at a ra ~' , "thnt f()rnon'~l\tive~iI,l Alaska. t' I d placements made by private, agencies.
TIll) AllIsl,a statlst.lcs do no me u e ,aud therefore ~re UliniInum figu~is. ie statistics.-The Alaska State D.ivision of
Melhod,ologlcal note' to the a.s a . few Native children from their parentsChildren Services pr?ha1JI~' re!:lOves ~~~Ion base for this report is all Natives,in the sma ll rurul Villages. 'I Ie pop f children outside their natural homes wnsrural lind urban; if the p~rcrn,tage °Ulation-lil,ely the most revealing compa.ribased on only the urban_Ida I; e,~fse be nincn higher. It' is virtually' certam,son-the percent.age WO\u 0 C .. .' ,therefore, that these are absolutely minunum figures ,
, , .. D rtment of Heal-th Eilu'cntion and ',elfRre,n Kntlonnl Cruter for SbOICl!lIIJt~t~~lc;g~ri~ies rf;d Voluntary Cblld Weltare AgenClets ~ng
"Children Served by Pu c en, II tion No (SRS) 76-03258 NCSS Repor -Institutlous MnrC\~~J3~ B~f\~,dh\\~r~~ recel;l~g soclnl services ?rotmtSbta\e ta~dulg~:~(iI/73), November '" a 7 l: dl people comprise 20.7 percent 0 e 0 apublic "'clfare agencies, p. 'f 'il a~ Tnere were 626 children In foster family home.rwr-nrv-oue y<tllr tit nopulntlon 0 n~ n, . I
In Uri3 626 tlmes 20.7 perceu t equals 130.'0I bi';. mw til'"'' 71J.•:~ p"rc"nt l'<Jua~ 406' H me" (Fairbank.: Center for Nortbern Educa·11 Judltb Kleinfeld, A Long tW:y lafoEcox:'omlc and Government Researcb of tbe Unlver-
tlonal ReseRrch Rnd Instltute 0 ,oc '" " " ", .. ,.", ,', ,slty of Alaska: 1913). p. 3.' ,':" I '" ' . ' ,,. . :" . 1,'1, ' •• ;. J
544545
IV. YUMA COUNTY
. In Yuma County, in a random saluple f tl . .foster care made by the Arizona S . 1 aS l~ clnldren 111 state-administeredpercent of the children were Amerlc~~\n ~rv\~es Bureau in March 1974, 13the rlln?om sample were non-Indian." II . dian. 87 perce1?t of the children illpopulatIOn. of Yuma County." Assumin;dt~lIn people comprIse 3.7 percent of theby the SOCIal Services Bureau is re 1''' en, thnt the random sampling mariecare population throughout Yuma pcese~tatlve of the state-administered fostercan be drawn. oun y, t~e following tentative conclusion
childr~n in the random sample were known to be nou-Indlau." Indian peoi,lrfJ~lll~TlS~ 1.9 perce?t of the population of Yavapai County.' Ass\;ming Wen thnt
e rnnc om s~mplll1g made by the Social Servlcas Bnreau is representative or~~fios:.llte-ta(1Jtmltlilstered foster care population through Yavapai County the
wing en a ve conclusion can be drawn. 'Oonchiston.
asTl~~~:II~~~a~y proportion 18.4 times (1,840 percent) ns manv Iudiun childrenArizona. children in state-administer!'!l fOl<ter care in -Yo. vapai Couutr,
II. NAVAJO COUjI,"'fY
In Navajo County in a ra d I .foster care made by the Arizo~~ao~~ar§ e ?f the ch ildren in state-administererlwere known to be American n . I~ ervices Bureau in Murch 1974, 77 percentsample were known to be no~.f~~?· ~9IP~:cent of the clutdren in the randomthe population of Nava' ,Jan. n .Inn people cornprrsr, 48.3 percent ormade by the SOCiutSeT';'o co~nty. A:ssunllng then. that the random samplingfoster care POPuI~tion -tl~~~~gh~~~a~IS ~ep~sentll tlve of the etate-admmjsterertclusion can be drawn. avajo ounty, the follOWing tentative con.
Conclusion
There are by proportionas. non-Indian children inAl'1zona.
1.G times. (.160 perccnt j us many Indian children'state-admlll!stered foster care in Navajo Countr,
III. COCONINO COUNTY
In Coconino County, in a random sa I f tl 'foster care made by the Arizona Soc'a~l~e 0;. '\clllldrel~ in state-administeredcent of the children in the random s I I er;,1(:es ~ur~lIu III M.nrch 1974, 58 perthe children in-the random sample w~mp e \\t~.Am.el'1ca.n IlHlIan.7 42 percent ofpercent Of the population of Coconin re non- ~~ Inn. Indian people comprise 24.8sampling made by the Social S ,0 C~untJ. ~\ssllmmg then that the randomf.idininistered foster car~ POPUI:!i~~e~hrdlrE':u IS rellre.selltatives of the stateing tentative conclusion can be drawn. ug' out Coconiuo County, the follow-Oonclusion
There are therefore by proportion 23 .children as non-Indian children in t t tldme.s, (230 percent) as many IndinuCounty, Arizona. ' s a e-a nlll1Istered foster care in Coconino
ple of children in State-administered foster care made. by tl~e Arizona. SocialServices Bureau in Murch 1974 demonstrates that Indian children nre 1Il tuctplaced In state-administered fo~ter care at rates far disproportionate to theirpercentage of the populatlon.) Thus, there was. a comb.lned}otal of 3~7 Indinnchildren in State-administered foster care during AprIl 19,6. In addition, theNavajo and Phoenix area offices of the BIA report a combined total of 211 Indianchildren in foster care in Arizona during April 1076.' Combining the State andnIA figures, there were at least 558 Indian children in foster care in April 1076.'l'l1is represents one out of every 98 Indian children in the State. By comparison, there were 2,601 non-Indian children in foster care in April 1976,' representing one out of every 263.6 non-Indian children.
·i,Cone/us'ion '
By rate, therefore, 'Indion children are placed in foster care at least 2.7 times(2.0 percent) more often than non-Indians in Arizona.
See the county-by-county analysis in the appendix for projections of tile actualrates at which Indian children are placed in state-administered foster, 'care.
III. COMBINED FOSTER CARE AND ADOPTIVE CARE
Using the nbove figures, a total of 1,597 under twenty-one year old IO(11anchildren are either in foster homes or adoptive homes in the state of Arizona.'l'his represents one out of every 34.3 Indian children. Similarly, for lion-Indiansin the state, 5,712 under twenty-one year otds are either in fost.er care or adoptive care, representing one in every 120.1 non-Indian children.Conclusion
By rate, therefore, Indian children are removed from their homes-and placedin adoptive or foster care 3.'3 times (350 percent) more' often than nonIndian children in' the State of Arizona.
• Tlie BTA Phoenix Area Office reportnrl 300 Indian children In foster cn re In Arl7.onnIn April l076. (Telephone Interview w lth Mr. Bert Grabes, Divtston of Sorln! Rerylcc",Phor-u lx Aren Office, .Tuly 23, 1976,) The BIA Navnjo Area Office reported 50 Inllinnclil1(lren In foster care In Arizona in Aprll 1976, (Telepbone interview with Mr. SteveLucv, Child Welfare Speclnll.t. Nnvajo Aren Office, Jnly 26. 107/1.) Tll1I" the 'RTA hncl nro",!Jlned totnl of 350 Indinn cbllclrrn In foster enre In Arizona, from which those under theRIA roster care contract with the Stnte should be subtrncted : :150 minus 1311 rona I" 21l.
• Telephone Interview with Mr. Walley Enrl, 01'. cit. There were a total of 2.048 childrenIn ro.trr cnre In April 1076, We hnve estimated that 347 of these are Indian (see Ttrport).2,0408 minus 347 enunls 2,601.
to Ornce or Indln n Education Pro ernma. U.S. Bureau or Indian AlrnlrR, "F'Iscal >pnr, 074 Rtnt!Rt!cR conccrnlng Indian Education" (Lawrence. Kans. : Haskell Inrllan JnnlorCottece : 1075). Table 4, "Boarding Schools Operated by the Bureau or Indian Affair••FIRCIII Ypnr 1074." pp. 1~-15.
U Rtnlp of Arizonn Social Services Bureau. Prozrarn Deve lopment Bnd Evnlllatloo, "FoRterr.nre r;vnlllntlon Program (July 1974)," District III Foster Care Evaluation, AppendIx I.Yn"npal County: Evaluation of Foster Chlldren Recorda, p. 13. , .
U.S. 'BUREAU OF INDIAN AFFAIRS BOARDING SCHOOLS
More than 10,000 Indian children in Arizonn, in addition to those In fostercare or adoptive care, are away from home and their families most of the yearnttending hoarding schools operated hy the U.S. Bureau of Indian Affairs. (SeeNote on boarding sehools.) These children properly belong in any computationof children separated trom their families. Adding- the 10,977 Indian children inferlerul bonrdiug schools in Arizona 10 to those in adoptive or foster care, thereare a minimum of 12,574 Inrllan children separated from their families. Thisrepresents one in every 4.4 Indian children in Arizona.C.onol'11$ion
By rate, therefore. Indinn children are separated from their families to OE'placed in adoptive care, roster care, or federal boarding schools 27.3 times(2,730 percent) more often than non-Indian children in Arizona.
ApPENDIX TO THE ARIZONA STATISTICS
I. YAVAPAI COUNTY
In Yavapai County in a random sample of the chfldren in State-administeredfoster care made by the Arizona Social Services Bureau in ?>farch 1974, 3;')percent of the children were known to be American Indian.' 42 percent of the
V. GILA COUNTY
546
Ccmelus'ionThere Jlre therefore by proportion 3.5 times (3GO percent) as many I~din?
children as non-Indian children in state-administered foster care in YumaCounty, Arizona.
Gila County, in a random sample of the children ~n state-adlll~niste!edfostercare made bv the Arizona Social Services Bureau III March 19/4. 1 t % of thechildren were known to be American Indian." 7D% of the children in the randomsample were known to be non-Indian." Indian people comprise 1~.7% of thepopulation of Gila County." Assuming then. that the random sa!?l~llllg made b~the Social Services Bureau is representative of the state-n(~nlllllstered. fostercare population throughout Gila County, the following teutntive coucluslon cnube drawn.Conclus'ion
'l'here are by proportion 1,1 times (110 percent) as manr Indian chil<h:en aMnon-Indian children in state-administered foster care in Gila County, Artsoun.
VI. GRAHAM COUKTY
In Graham County, in a random sample of the children in stute-ndmiulstererlfoster care made by the Arizona Social Services Bureau in March 1D7o!. 18%of the children were American Indian." 81% of the children in the sample wereuon-Indinrr." Indian people comprise 10.1% of the population of Graham County." Assruning then the random sampling made by the Social Services Blll'l'an. isrepresentative of thc state-administered foster care population throughout GllnCounty, the followiug tentutive conclusion can be drawn.COllclusion'
There are b~' proportion 1.8 times (180 percent) as many Indian children asnon-Indian children in state-administered foster care in Graham County,Arizona.
VII. COCHISE COUKTY
In Cochise County, In a random sample of the children in state-administeredfoster carl' made LJ~' the Ar izona Social Services Bureau in March 10;4, !) percentof tile children were American Indian,'" 91 percent of the children in the randoms:1llljlle were nou-Indinu." Indian people comprise 0.2 percent of the population..r Cochise Countv." Assuming then that the random sampling made by theSocial Services Bureau is representative of the state-administered foster carepopulation throughout Cochise County, the follo'l'fing tentative conclusion can bedrawn.
Conc/.u8'ionThere are hy proportion 45 times (4500 percent) as many Indian children as
non-Indian children in stnte-adminlstered foster care in Cochise Oountr, Arizona.
VIII. PINAL COUNTY
In Pinal County. in a random snrnnle of the clrlldren in Stn to-ndmtntsteredfoster ell 1'(' made hy the Arizona Social Services Bureau in March 1D74, 20 percentof the children were known to be American Indians." 74 percent of the children Inthe rnndom sample were known to be non-Indian." Indian people comprise 9.4
"f\tnte of Arl7.onn Soclnl Services Bureau, 01'. nit .. District V Fo.ter Cnre Evaluation,Apl'e.llllx lIT, Glln Coun ty: 1']"nluntlon of Foster Children Records. p. 16.
" n.i«, The rnco of 4 percent of the chtldren wns unknown. (Ibid.)rs "Rnce of the Population by Count,.: 1070," op, cit., p. 5.10 State ot Arizona Social Ser..-Ices Bureau, op, clt., District VI Foster Care Evaluation,
AIIll("HlIx lIT. Glln Countv : J~"nll\ntloll of ~'ostN' Chllrlron Record s, P. 1Ii. ,11 T"j". 1 percent of the children are unaccouuted for by the Social servtces Burenu.
(Ibid. )10 "Rnce of the Population by Countv: 1970," op. ctt., p. 5.,. Stnte ot Arizona. Soclnl Services Bureal!a op. cit, District VI FOBter Care Evaluation,
ApnelH1lx V, Cochise County i 1']vnluatlon ot JroBter Care Children RecordB, p. 24.» nna." "Hnre or the Population b:<" Connty : 10iO," 01'. ctt., p. ~ ... State ot Arlzonn Social Services Bureau. o\:: cit, District V Foster Care Evaluation,
A~~m(l~h~I~~~eC~~nJ"p:e~c';.~l~~\IOt~:fc~~~ltre;n~.~~r,~~!n;~~~~Bjl't~~·fll!'w, used In till.report were to be based only oa the percentage ot chlldren tor whom race IB known, Indianchttdrcn would comprtse 21 percent of the foster care placements In the random aample-«thus further Increnslng the disproportion between IndIan and non-Indian placements.
547
percent of the population of Pinal County." Assuming- then that the random.sarupllug made by the Social Services Bureau is representutive of the stnte.administered foster care population throughout Pinal County, the lollowingtentative conclusion can be drawn.
-Oonclusion.There are by proportion 2.1 times (210 percent) as many Indian children as
non-Jndtan children in state-administered foster care in Pinal County, Arizona.
IX, MAUICOPA COUNTY
In Maricopa County, in a random sample of the children in state-administeredfoster care made by the Arizona Social Services Bureau in 1I1arch,1074, 7 percentof the children were known to be American Indian .... 86 percent of the childrenin the random sample were known to be non-Indian." Indian people comprise1.2 percent of the population of Maricopa County." Assuming then that tilerandom sampling made by the Social Services Bureau is representative of tilestate-administered foster care population throughout Maricopa County, tilefo llowing tentative conclusion can be drawn.
ConclusionThere are by proportion 5.8 times (580 percent) as many Indian children as
non-Indian children in state-administered foster care in Maricopa County,Arizona.
X. PIMA COUNTY
Tn Pima County, in a ramdom sample of the children in stnte-admtnisteredloster care made by the Arizona Social Services Bureau in March 1974, 12%of the children were known to be American Indian.'" 83 percent of the childrenin the random sample were known to be non-Indlan." Indian people comprise2,5 percent of the population of Pima County." Assuming then that the randomsampling made by the Social Services Bureau is representative of the stateadministered :easter care population throughout Pima County, the following ten'tative conclusion can be drawn.Conclusion
There are by proportion 4.8 times (480 percent) as many Indian children asnon-Jndian children in state-admrutsterod foster care in Pima COllllt~·.Arizonu.
Methodologioal notcs.-(I) Since the data on which this appendix is basedcomes fr?m a rando~ .sample (comprising 462 children out of a total of 1,808children 111 s~ate-admllllstered faster care) 31 made by the Program Developmentand Evaluatio~ Department of the Arizona Social Services Bureau, it is subjectto the uncertainty of the random sample itself.. (2) It should be emphasized that these statistics include only state-ndmtna~ter~d placements.; no BIA; placements-which would undoubtedly be substan-tial III some counties-are Included, ,
:: "Race of the Popul,atlon by County: 19iO," op, clt., p. 5.f\t" I.e of Arlzona Social Service" Durenu. op, clt., Diatrf ct I FORter Cnre FlvnIuntlo n
,~ppendlx I: Evaluation of Foster 'Children Records, p. 12. Confirmed by telephone Inter:,~k~io~~:h Mr. Bob, Hooglstraat, Program Development and Evnluation Departmen't, July
;,:1\ Ju«.:; "Rnce of the Populntlon by County: 19iO," op. ctt., p. 5. -
A State of Arizona Social ServlceB 'Bureau, op, clt., Dtstrlct II FOB tel' Cure Evaluntionft~enMIX ~: ~v.£luatlon of Foster Children RecorclB, p. .11. Confirmed by telephone Intervle;;
1916. r, 0 ooglBtraat, Program Development and Evaluation Department, July 12,
; rn [/d'<l. The race of 4 percent of the children was unknown' and '1 ~)ercent or the-Cllll~fen were unaccounted for by the Social ServlceB Bureau. (Ibid.')
eo Raes of the Poputatton by County' 1970" op elt p 511 State of Arizona Social Services Bu'reau, op. cit" P: 1: . ,
548
CALIFORNIA ADOPTION AND FOSTER CARE STATIsTIOS
BASIC FACTS
1. There are G,OG9,30i under twenty-one-year-olds ill. the sta~e of Oaltfornin.!2. There are 39,5i9 under twenty-one-year-old American Indians in the state
of California." . ' .3. There are 6,929,i28 non-Indians under twenty-one lD the state of California.
I. ADOPTION
In tile state of California, according to tile C~liforllia Department. of. Healt;).there were 93 Indian children placed for adoption by public agencies III 10i<J.Using federal age-nt-adoption figures,' 83 percent (or ii) are under one. year offI,(e when placed. Another 13 percent (or 12) are one year to less than SIX yearsold when placed j 3 percent (or three) are six years, but less than twelve ye~r~old when placed; and 1 percent (or o~e) are twelve year's of age a.nd older: Usingthe formula then that: 7i Indinn children per year are placed III adoption forat least Ii years,12 Indian children are placed in'~doption.fora minimum nverage of 14 years, three Indian children are placed 1Il adoption for an average ofnine years, and one Indian cllild is placed for adoption for an average of th:eeveal'S' there are 1,50i Indian children under twenty-one years old in adoptlonat any 'One time in the State of California. This represents one in every 26.3Indian children under tbe age of twenty-one in tbe State. ..
Using the same formula for non-Indiana (there were 1,942 non-Indian ehildren placed for 'adoption by public agencies in 1975)' tbere are 31,52fi nonIndians under twenty-one years old in adoptive homes at anyone time; representing one in every 219.8 non-Indian children.
OOlLol'u.8ionThere are therefore, by proportion, 8.4 times (840 percent) l1S many Indian
children as non-Indian children in adoptive homes in California; 92.5 percentof the Indian cbildren placed for adoption by public agencies in 1975 were placedin non-Indian homes,"
rr, FOSTER CARE
According to statistics from the State of California Department of Healththere were 319 Indian children in foster faIl)il~' homes in 19i4.' This representsone out. of every 124 Indian children in the State. By comparison there were20,590 non-Indian cbildren in foster family homes in 19i4," representing one outof every 336.6 non-Indian children in tile state.Oonolltsion
There are therefore, by proportion, 2.i times (2iO percent) as many Indiancbildren as non-Indian children in foster fsmily homes in California.
1 U.S. Bureau of the Census, Census of Populntlon: ,1970, Volume I, Characteristics ofthe Population, Part 6, Section 1, Oalifornla (U.S. Government Printing Omce: Wasb·Ington...D.C.: lll73), p. 6-88.
, U.". Bureau of the Census, Census of Population: 1970; Subject Reports, FInal ReportPC(2)-lF ",American IndIans" (WashIngton, D.C.: U.8. Government Printing omce:1lI7:li. '1'nhJe 2, ",Age of the Indian Popututron by Sex nnd Urban and Rural Restdcnce ;1970."p. 6.
• AAIA chlld-welfnre survey Questionnaire completed by Mrs. T. Chu and Ms. BetsyStrong. Center for Health Statistics, Calltornla Department of Health, July 16, 1976.
• Nntlonnl Center tor Roclnl Stntlotlco. Tl.S, Depnrtment of Henlth. Ednc"tfon. nnd.Welfare, "Adoptions In 1971." DREW Publlcatlon No. (BRS) 73-0.~25G, NCSS ReportE-10 (1971), May 2.3, 1973. Table 6, "Cblldren adopted by unrelated petitioners; Percent·age dtstrtbutfon by age Itt time of placement. ~i" type ot placement. 1971."
• AAIA chlld·welfare survey questionnaire. OPt ct.• I hid.., {hid.
• Ibid.
549
III. OOMBINED FOSTER CARE AND ADOPTIVE CARE
Using the above figures, a total of 1,8:!6 under-twenty-one Indian children areeither in f.oster homes or a~oPtive homos in the state of California. This repreRents one III every 21.7 Indian children, Similarlr for non-Indians ill the state,52,115 \In.der-twe~lt~'-one-olds are either ill foster homes or adoptive homes,representiug one III every 133 non-Indian children,Oonclusion
By per capita rate, Indian children are removed from their homes and placed inadoptive homes and foster homes G.1 times (GI0 percent) more often than nonIndian children in the state of California.
The above figures are based only on the statistics of the California Depart.ment o~ Health and do not include private agency placements. They are there.fore munmum figures.
~OTI'. In addition to the above figures, approximately 100 California Indiancllll.dren. between the ages of thirteen and eighteen attend a bourdlng school inCaliforDla.ope\ated by.the l!.S.•Bureau of Indian 4-ffairs (Shermilll Indian HighScbool, Hlverslde,. Cahforma). An additional 175 California Indian childrenattend B,IA boardmg schools in Utah, Nevada, Arizona, and New Mexico.'· 'Werethese clll,ldrell ~o. be added to the total above, Indian children would be awayfrom thell' fnnnl!es at a per capita rate i.l times (ilO percent) grenter thanthat for non-Indians.
• Ibid.re Ibid.
550
CALIFORNIA: ApPEN DIll:
County-by-Oounty Analysis of California Foster Care Statistics
ALAMEDA COUNTY
In Alnmedn County, according to statistics from the California Departmentof Health, there were 24 Indlnu children in stnte-admintstered foster fnmilyhomes in 1974.' There are 2,548 Indian children under twenty-one years oldin Alnmerln County." Thnsone out of every 106.2 Indian children is in a fosterfomlly home.OOllclusio'll
In Alameda County Indian children are in state-administered foster famllyhomes nt a per capita rnte 3.2 times (320 percent) greater than the stuts-wlderate for non-Indians in Californin.
II. ALPINE COUNTY
In Alpine County, according to statistics from the California Departmentof Health, there was one Indinn child in a state-ndministered foster family homein 1974.· There are 43 Indian children under twenty-one yenrs old in AlpineCounty. t Thus one out of 43 Indian children is in a faroily foster home.OOltclll.si01l
In Alpine County Indian children are in state-administered foster homes ata per capita rate 7.8 times (780 percent) greater than the state-wide rate fornon-Indians in California..
III. AMADOR COUNTY
In Amador County, according to stntistics from the California Departmentof Health, there were no Inclian chlldren in atnte-adrntutstered fost!'!r famll~'
homes In 1974." There are 72 Indlnn chlldren under twenty-one years old inAmndor County.j
IV. DliT'rE COUNTY
In Butte County, according to statistics from the Cnlifornla Department ofHealth, there were six Indian children in stnte-adminlsteredfoster fnmlly homesin 1974.· There are 399 Indinn children under twenty-one years old in ButteCounty. t ~'hus, one out of every 66.5 Indian children is in II foster fnmily home.Ooncl11·.ri011
In Butte County Indian children are in stnte-adminlstered foster familyhomes at a per capita rate 5.1 times (510 percent) greater than the statewiderate for lion-Indians in California.
V. CALAVERAS COUNTY
In Cnlaveras County, according to statistics from the California Departmentof Health, there were five Indian children in state-ndministered foster tamlly
'AAIA chlld-"~elfare survey questionnaire completed by :Ms. TUlane Chu, Public Hr·h1(11Stattsttelan, Center for Health Statistics, California Department of Health, July 111, PT6.
• 44,8 percent of the CalifOrnIa Indlan population IB under twenty-one yearn old. [U.S.Bureau of the 'Census, Census of Popnlatton i 1970: SubJeet Report PC(2)-lF, "AmericanIndians" (Washington, D.C.: U.S. Government Prlntlnl\' Office: 1913). Table 2, "Al\'eof the Indian Population by Sex and Urban and Rural Residence: 1970," pp. 6-7. J Thetotal Indian population of Alameda County Is 5,688. [U.S. Bureau of the Census, Censusof Population: 1970 Supplementary Report PC(Sl)-104, "Race of the Population byCOllnty": 1970 (Wuhtnl(ton, D.C. : U.S. Government Prlntlng omce: 1975), p, 6.1 5,688times .448 equllla 2,648. The same formulll la used to determine the Indian under twenty.one ~'rnr old oponulatlon In the other California eountfes, Hereafter cited as "Race."
• All 1/1 O"pntlnnnoirp. o». elf.tfincr of the Populatton b;V Counly: OJ). cit. 11170: II. 7.
551
hOmes In 1974.· There are 77 I d .Calaveras County. t Thus one 0 nt i~l children Ull<ll'.r twenty-one years old infamiIy home. • u 0 every 15.4 Indian children is in a fosterCmcluBion
In Calaveras County Indian childre .h~~es nt a per capita rate 21.9 timesn (~1~9~1 state-ndminlstered foster fnmilyWI e rate for non-IndIans in Californin.' percent) greate.... than the state-
VI. OONTRA OOSTA COUNTY
In Contra Costa Count .men,t of Health, tbere ~;~r:Cri~rd~~g.to sta,tiRtics ~rom the Callf,ornla Departff~ll.llYChOmes in 1974. $ 'I'here are 7g~aI ci?lldrr~ In state-admiuistered fostero III ontra Costa County. t n Ian c 1IIdreli under twenty-one years
VII. DEL NORTE: COUNTY
In Del Norte County, accordin to t "of Health, there were 15 Indian
gChll~ atIsl.!CS from the California Department
~ome~ III 1974.· There are 326 Indlnn ~~~I~n state-administered foster family"fa~if,.o~te County.t ThUll, one out of every ~~I~ ~ndd~r twent.y-one years old in
, orne, "'. n Inn children is in a foster001lclusion
I~ Del Norte County Indian chill .iap~ta rate 15.5 times (1550 percent) ren n~ e In foster fnmily homes at a per
ndians in Californln. . .' grea er than the state-WJde rate for non-VUI. EL DORADO COUNTY , .
In El Dorndo County a 'd'of Health, there were 'n CCOI .Illg to .stntistics from the Californl .~~~es in 1
0974.• There al?e ;'~~I~~d~~~d~~~ldi~l Iltnte-n(]millistered afO~~~?~~~~,~
orado ounty.t ' I len under twenty-one years old in. . IX. FRESNO COUNTY . .
In Fresno County aecordin I. ' ';'1:eall.b, there were' 22 Inai;n °c~~ftist.!c~ from the California Department of~';~~~~ 13oJ~i:'; :;rere are 961 Ind:n~r~~liid~e~t~;I;;~~n~~:lst?red foster familyhome. . IUS, one out of every 43.7 Indian htld en .y;one years old III
c I ren is In a foster famllyOonolusion ., " .
In .rre.~no·.'&untY Indian cbildren nre . . . .~~~lf~~~it~mes (770 percent) greater thanl~b~O:~~~/~dIIYbtomfes at a per capita
. . .... .: . I e ra e. or non-Indians in. x. GLENN COUNTY! ", .
In Glenn County, nccordn ..'Hpalth. thl!re ~'m'e flv I'" to Rlntlstlcs from the Cnlif .hOllll'R in 1914. Ti ve Inlllan chllrlrl'lI In Rtatp ~d I orma Departml'lIt ofCounr, •.t Thu~ on~ere tar; 84 Indian chllrlt'en 11IH1pr t~vel~i/~slered fORt.er fallliJ.~·a I
. ' au 0 every 16.8 Indian Children Is in - fne,:veal's old In Gleunono lI8101'l a ester family horn«In Glenn Countv I 1" " .
rate '>() time (200 ncIan children a re In foster fillIn Califo~ia~ , 0 percent) greater than the, stR~:'lVfcl IOmtesat a per rnpitfl
, ' era e for non-Indlflns. . '" . XI•. HUMBOLDT COUNTY .
In Humboldt Co t" . . . . ,of Health tbere ?n s, RCcorcllng to stntistlcs frolli' til . 'hllllles in 1974. "ere 18' Indian children In state- e California DepartmentHnmholdt Cou'nt~e~~are 1,869 Indian chlldrl'll llncJ~~m(nistrf'd fORter tamil.vfllmily borne. r , • • UR, one out of every 76.1 India 'lVhellll y-one Yl'ars old in
. .. . . n c dren is In a foster
tORAAI A Q'''!.t1onUAlr~ oft cIt ' ' . . ..ace of thePl' ,.. .
. opu allon by County: 0". cit. 1970; fl, 7.
552
O,0tl~ZIl8jOll in foster family homes at a perI Humboldt County Indian childrg~~af:: than the state-wide rate for noncnpl~a rate 4.4 times (440 percent)
Indians In California. xrr; IMPERIAL COUNTY
" C lIfornia Department' , . to statistics from the a er familYIn Imperial County, accordlJ1f children In state-administered rost s old inof Health, there were seven31~dI~~lan children under twe~~y-oneiSYr~ra fosterhomes in 1974.· There are out of every 56.9 Indian chi renImperial Oountr.t Thus, onefamily home. . '
Oon~ZI/,8ioll , , • in foster family homes at a perIn Imperial County Indian Chll}dren ~~~ than the state-wide rate for noncnplta rate 5.9 times (590 ~ercent grea
Indians in California. XIII. INYO COUNTY , , :
' " . ' C lIf nia Department of' dl t stn tlstlcs from the a ?r ed taster familyIn Inyo County, accor mgeli0
children In state-administer 8 old in
Health'i:h~~;4.-:,e~e~r;r;n52:nIndian ChlIld~~nU:~fJr:~~ti~n: lo~~~r familyhomes t Tb one out of every 65.5 nInyo County. us,horne,
('onelI/8;011- ' St t administered foster family homes. In In~'O County Iudian c.hlldre(~fo·ep~~cen~tgreaterthan the State-wide rateat a per capita rate ~.1 tunes "
for non-Indians in California.
, XIV. XEBN COUNTY
, . . rom the California Depnrtment. ofIn Kern County, according .to s:l~N(~~e~~ ~I State-administered foster ~f~~I:~
Healthintl~e;~4.~Ve..f~e~~r~;eI~~~a~~dian c3hoi41~re:n~n~l~fli~~n[:-i~~~~~:[eSr familyh.?,ll1es C ty t Thus one out of every n Ih.11lg'S oun. ,home.
Ormolusion'. . d 'nistered foster family homesIn Kern County Indian ~hl1dre(~On;~ ~~r~~~~)-~r~~terthan the State-wide rateat a per capita rate 10.5 times ,
for non-Indians in California.,
, , xv. KINOS COUNTY ,
' . . f OIll the Cnllrornla Department ofIn Kings County, nCi~~i~~gC~~l;;:~I~~l~~at~_administeredfoster ~~3Iil~ ~i~I:;
~Iel1lt~l, ~h¥he ~e~r~v:60 Indian childre!1 under twe~ty:on:lo~~~~ family home.III 19 t 4. er t f everv 32 Jndlan children s m ' .:, ' ,County. t 'l'hus, one ou 0 " , , ,
Co"elll.~iolt '. 'i State-administered foster familyTn Kings County Indlan :hl.ldren(f~';.o~ercent) greater than the state-widehomes at n per capita rate 10.0 t.lDles .uo
I'll te for non-Indtans in Cnllfornin.
XVI. LAK~; COUNTY
.. f m the Cnlifornla Department ofTn Lake County, accordlug to statJstl~s I;Ostate-administered foster familyIIenHh, there were two Infl~nI;J\I~~r~hlldren under twenty-one le~rs l;~i~~homes In 1974.· There are t 'f \"ery 725 Indian children is In a as erLa ke Oounty.t Thus, one ou 0 e .home.
°AATA QlIP.t1pOnnallr~·lori\~'~oonty: »». cit. 1970; 6, 7.t Raee oC the opu a
----"'-'------"-'"-'-'-.~-~.--:._:~:_ .._":..,;
553
OonelURion
In Lake Couny Indian children are in state-ndminlstered foster flllnily homesat a per cllpita rllte 4.6 times (460 percent) grenter than the State-Wide rate'fol'non·Indians in California.:;' '" , ", , " 'I :"
XVII. LASSEN COUXTY
In Lassen County, according to otatistics from the Calif01'11 in De!lartmellt ofHealth, there was one Indian child in a Stllte.arlmJnllltered. fo~ter famil.'!' hOlllein 1974.· There are 156 Indinn 'children under b:ventt-one yellr~ old in LassenCounty. t Thus; one out of 156 Indian children is In a 'foster family home.Gonelusi-on ,r;, , ,'" '" ',' '" "", ,,' "
In Lassen County In(lilln children are in Stnte·administered foster famil.vhomes at a pel' capita rate 2.2 times (220 percent) greater than the State-w'iderllte for non-Indians In California. ,
XVIII. LOS ANm;u:s COUXTY
In Los Angeles County, according to statistics from the California Departmentof Healt.h, there were 45 Lntli an children in Statp-Il(hninisteretl foster fnmil~'homes in 1974.· There'are 10,980 Indian children under twentY.one years old inLos Angeles COunty. t ThUll, 'one out of eye I',}' 244 Indian children'ie In n foster'family home. j", ,
00llelus'ion
In JJos Angeles County Indian children are in State-administered foster fnmil.\'homes at a jJer capita rate 1.4 times (140 percent) the State-Wide rate for non-Indians in California., ,
XIX. MADERA COpNTY
In Madera County, according to statistics from tbe California Departmentof Health, there were two Indian children in State-administered foster familyhomes in 1974.· There are 335 Indian children under twenty-one years old inMadera County. t Thus, one out of every 168 Indian children is in a foster familyhome. , ' "Oonelus-ion
In Madera County Indian children are in Stat.e-administered foster familyhomes at a per capita rate 2.0 times (200 percent) greater than the State-WIderate for non-Indians In California.
XX. MARIN COUNTY
In Marin County, according to statistics from the California Department ofHealth, there Were no Indian children in State-administered foster family homesin 1974.· Tllere are 171 Indian children under twenty-one years old in MarinCounty.t
XXI.' MENDOCINO COUNTY
In :lHendocino Count.v, according to statistics from the California Departmentof Health, there were eight Indian children in State-administered foster familyhomes in 1974.· There 'are 642 Indian children \Illder twenty-one years old inMeiHlocino County. t Thus, one out of every 80:3 In(]Jan children Is in n fostf'l'family home.
OoncZusion
In Mendocino County Indian children are ill Stnte-ndministered foster familyhomes at a per capita rate 4,2 times (420 percent) greater than the State-wIderate for non-Indians in California. '
XXII. MERCED COUNTY
In ?llerced County, according to statistics fl'om the California Department ofHealt.h, there wall one Indian child in a State.admlnfl<tered foster family homeIn 1,074.• There are 1GO Indian children In Merced County.t Thus, one out of HiOIndian children Is In a fOllter family home.
°AATA QllesUonnRfre. op, olt.tRace of the POpulaUon by ClJunty: op. cit. 1970: 6. 1.
554
• AAJA' Questionnaire. op. ctt,tRnce' of the Population by County: on. cit. 19iO; 6, i.
XXXIII. SAN BENITO COUNTY \
In San Benito County. according to statlstica from the California Departmentof Health, there were no Indian children in State-administered foster familyhomes in 1074.* There lire 24 Indian children under twenty-one years old' inSan Benito Oounty.t . ' I, ,
:I XXXIV. SAN BERNARllINO COUNTY " ,"
In Snn Bernardino County, according' to stnttstlcs from thc Ca'lifo~nill Departmen.t. of Hen lth, there were foul' Indian children in State-ndmlniatered fosterfaml!y homes in 197~." There are 1,548 Indian children under twenty-one yearsol~ In Snn Rern~rdlllo County.t Thus, one out of every 387' Indian childrenis m a fnster famIly home. ' '
Ooncln"i,onIn, San Bernnrdlno Cou.nty Indian children !Ire in Stnte-admlnlstered foster
familv ~lome~ at a per capita rate, 0.9 times (90 percent) the State-wide rate fornon-Indians III Cal'ifcrni a.
"AA TA Ql1•• tlonnnlre. Oil, cit.tRnce of the Populntron by County: ov. cit. 10iO; 0, T,
555
:U:U:. PLAcER COUJ.'{TY
In Placer County, according to statistics from the .Callfornia Depa~:tment ofHealth, there was one Indian child In a State-administered foster family homein 1914." There are 185 Indian children under twenty-one years old in PlacerOounty.t Thus, one out of 185 Indian children Is in a foster family home.Oonclusi,on
In Placer County Indian, children are in State-administered foster 'tamilYhon~es a.t a per capita rate 1.8 times (180 percent) the State-wide rate for non-Indl ans III California. , ,
xxx. PLUMAS COUNTY , ,
In Plumas County, according to statistics from the California Department ofHealth" ther! ~ere five Indian children In State-administered foster familyhomes in 19/4. There are 137 Indian children under twenty-one ,years old inPlumas County. t Thus, one out of every 27.4 Indian children is in a foster familyhome.Conclusion
In Plumas County Jndlanielnldren are in State:~dministered foster famill"homes at a per capita, rate ~2.3 ~imes (1,230 percent) greater than the State,widerate for non-I~dlans InOallfornia , : , '
XXXI. BIVERSIlJI!: COUNTY
In Riverslde County, ~ccordjng to statistics from tJle Californla Departmentof Hea.lth, the~e, were SIX Indian children in State-administered foster familyh~mes.1I1 1074. There are 1,309 Indian children under twenty-one years old in~lv~rSlde County.t Thus, one out of every 218 Indian children Is In a fosteramlly home." ,,' I :":
Oonclusion" In' Rtverslde Countv Indinn childr~n nre in State-administered foster familYhon:es a.t a pe.r captta rate 1.5 times (150 percent) the Statewide rate for nonlndl!lns III California.
XXXII. SACRAMEJ.;TO COUNTY
In SaCl'amento County, according to statl stlcs from the California Departmen.t of Heal~h, there were nine Indian children, in Stat.e-udnituiatared foster:fam;IY homes 111 1974." There are 1,196 Indian children under twenty-one years-old III Sac~amento County.j ThUS, one out of every 132.9 Indian children :Is in afosterfamily home. ' ' , "
Oonelusion.In Sacramento County Indian children are in Sl:at~-ndminiAtererl foster familY
110me8 at a per .capita rate 2.5 times (2;-;0 percent) greater than the State-widel'ate for non-Indians In California. '
XXVIII. ORANGE COU~TY
In Orange County, according to statistics from the California Department ofHealth, there were three Indian children in State-administered foster familyhomes in 1974.* There are 1,756 Indian children under twenty-one years old inOrange County. t ThUS, one out of every, 585 India n children Is in a foster familyhome. ' ' '
Concllillion. In Orange County, Indian children are in State-administered foster familyhomes at a per capita rate 0.6 times (60 percent) the State-wide rate for nonIndians in California.
XXVII. NEVADA COUNTY
In Nevada County, according to statistics from the California Department ofHealth, there were no Indian children in State-administered foster family homesin 1014.* There are 50 Indian children under twenty-one years olrl in NevntlnCounty.r
Conclusion ' ,,' ,In Merced County Indian children are in State-administered foster family
homes at '1\ per capita rate 2.1 times, (210 percent): greater than the State-wideratefornon-Intlians in California. ' ,
XXIII. MODOC COUNTY
In Modoc County, according to statistics from the California Department ofHealth there were seven Indian children In State'admlnistered foster familYhomes in 1974.• There are 78 Indian children In lIIodoe County.t ThUs, 'one out ofevery 11.1 Indian children Is in a foster family, home.
ConclusionIn Modoc County Indian children' are' in State·administered foster family
homes at R per capita rate 30,3 times (3,030 percent) greater than the Stat~.wide rate for non-Indlans-In California: . ' '
xxrv. MONO COUNTY
In 1\10110 County, according to statistics from, the California Department ofHealth, there was one Indla~,child In' a State.administered'iioster family homeIn 1074.* There are' 85 Indian children under, twenty-one years old in MonoOounty.t Thus, one out of 85 Indian children' is 'in a foster family' home.
ConclusionIn Mono County Indian children are In State-administered foster family homes
at a per capita rate 4.0 times (400 percent) greater than the State-wide rate fornon-Indians in Calif6rnia. " , '
"xxv, MONTEREY COUN'TY
In Monterey County, according to statistics from the California Departmentor Health, there were no Indian children in State-administered foster familyhomes in 1974.* There are 510 Indian children under twenty-one years old inMontereyCounty.t ' , ' "
XXYI. NAPA COUNTY
In Napa County, according to statistics from the California Department ofHealth, there was one Indian child in a State-administered foster family homeIn 1974.* There are 96 'Indian children under twenty-one years old In Napaoountr.r ThUS, one out of 96 Indian children is In' a foster family home.
OonclusionIn Napa County Indian children are in State-administered foster family homes
at a per capita rate 3.5 times (350 percent) greater than the State-wide rate fornon-Indians In Onliforntn.
, I ' j ,'" ~ !
556
XXXV. SAN DIEGO COUNTY
In San Diego County, according to statistics from the California Departmentof Healtb, there were three Indian children in State-administered foster familyhomes in 1974.· There are 2,634 Indian children under twenty-one years old inSan Diego County.t Thus, one out of every 878 Indian children are in fosterfamlly homes. 'Conolusion
In San Diego County Indian elrlldren are in State-administered foster familyhomes at a per capita rate 0.4 times (40 percent) the State-wide rate for nonIndians in California.
XXXVI. SAN FRANCISCO COUNTY
In San Francisco County, according to statistics from the Calirorntn Department of Health, there were 11 Indian children ill State-administered fosterfamily homes in 1974.· '1'here nre 546 Indian children under twenty-one ~'ellrs
old in San Francisco County.tT'hus, one out of every 118.1 Indian children is inII foster family home.Conclusion.
In San Francisco County Indian children are in State-admintstered fostprfamily homes at a per eaplta rute 2.9 times {290 percent) greater than theState-wide rate for non-Indians In California. '
XXXVII. SAN JOAQUIN COUNTY
In San Joaquin County, according to statistics from the California Departmen t of Health, there were three Indian children in Btare-ndministered fosterfamily homes in 1974.· There are 546 Indiaan children under twenty-one yearsold in San Jonquln Countr t 1'hus, one out of every 182 Indian chlldren is in afoster family home.COl1o!usfotl , "
In SlIn' Joaquin County Indian children lire in State-administered fosterfamily homes ut-a per cnpita- rate 1.8 tlmes (180'percent) tile State-wide ratefor non-Indians in California.
XXXVIII. SAN I,UIS OBISPO COUNTY
In San :Luis 'Obispo County, according to stattsttcs from the CaliforniaDepartment of Health, there were no Iridian children in 'State-adminlsterl'dfoster family bomes in 1074.· 'Tilere are 232 Indian chlldren under twenty-oneyears old in San Luis Obispo Oounty.t
XXXIX. SAN 'MATEO COUNTY
In San Mateo County, according to statlstics from the Cnltfornln Departmentof Health, there were no Indian children in Stnte-adminlstered foster familyhomes in 1974.· There are 600 Indian -chlldren under twenty-one years old inSan Mateo County. t
XL. SANTA ,BARBARA COUNTY
In Santa Barbara County, according to' statistic!' from the California Dopnrtment of Henlth, there were no Indian clrlldren in Stnre-ndmlnistered fosterfllmily hOO1(':'; in 1074.· There are 452 Indian children under twenty-one yearsold in Santa Barbara County. t
XLI. SANTA CLARA COUNTY
In Santa Clnra County, accnrdlug to stotisties 'from the California Department of Hen lth, there were 15 Indinn children in State-administered fosterfamily homes in 1974.· There are 1,814 Indian children under twenty-one yearsold in Santa Clara County.tThus, one out of every 120.9 Indian children is In afost.er fnmily home. '
·AATA QueRtlonnnlre. op, clf.tnnce of the Populntlon bv County: Opt cit. 19iO; 6. 7.
557
Oonclu ..ion I:
Iio~lll~~~:~t~ C,~~.r~aC?nnty In9ian .children a I'C ; '. C''n/'~-a<1ministered fostel', famllrrate for nou-~ndian~ ~~ ~~~~f;~'~ll~,mes (280 peru'" [) greater than .the State-wide
I . ;. - '':'' ltj. ~'(·,Hj.H~,~ ,_
.. . ~ ")' ~ l P ff:'! .i:-XLII. SANTA CRUZ COUNTY , ', "; :;), ...;
In Santa Cruz County accord' t t t· t' ' " ,of Health, there was o;le Indi~ll~g ~i~da, IS lC'Sfrom t.he.C~lifol'l1ia Department~ome in 1974.• '1'here are 161 Indian hiNd ~ tate-admllllstered roster-rauiltrSanta Cruz countr.j Thus one out of lc61 Irde~ ulld~r twe~ty.-one years, old inhome. '" Il IIlI1 elllidren,ls lila foster, fa mil1. , ';Oonclusi.on ~~.. ~'.
In Santa Cruz County India I lld . " ' ,"homes at n per capita rnts 2.'1
11tfl:lle 1(;18re In State-~dl11inisterl'tl foster familyrate for non-Indians in California. ,s, percent) gleater than the, StatC1Wide
J • • ! ' "".: : l i J,II, ~
XI.llI. SHASTA COUNTY
In Shasta County flccording to t tl ti f " -: 'Health, there were'13 In'dian h' sa .IS I~B rom t!l~ California Departmsnt.ofill 10i4. There lire 592 Indi~n l~~~~~ 111 Sta~e-arlml1llstererJ foster fnmily homesCounty.] Thus, one out of every 4G ~.( ~eldl.llII el-~ltwent:v'?ne year old in, ShastaC ,
. . n IUn c 11 dren is III a foster family home011olus'lon' •
I?O~~leBS~lf~ape~o~~;;'~aI:~::I~.~I~~~~~~n(~:~ i~~ Stute-a(lmiui~tered foster familyrate for non-IndIans in California. ' " P cent) greater than the State-wide, . " .
, 'XLIV. SIERRA COUNTY I '
In Sierra County, according to statist! l' . .: ' " "Health, there were 110 Inclian children in ~~tron~ t~le Oallfornla Depart.ment ofin 1974,· There are ,17 Indian chlldre de-a m nistered foster ,family homesOounty.j n un er twenty-one years old, in Sierra
XLV. SISKIYOU COUNTY
In Siskiyou County according to st tl t' fHealth there were 11 'Indian childre ~ ISS~C~ rom the California Department ofin 1974.· There a~e 434 Indian Childn III ~ e-administered foster family homesCounty. t Thus" one out of every 39.5ri~d~n erh[;-denty~one years old in. SiskiyouGono!u8ion an c " ren.ts in a foster family home
In Siskiyou County Indian children ar" . ' '" .homes at a per capita rate 8 5 ti (850 e III State-admmistered foster familyrate for non-Indians in Calif~rni~~es percent) greater than the State-wide
XLVI. SOLANO 'COUNTY :".
In Solano County, according to statistic f " :Health,~here was one Indian child in St S rom. t~e California Department of1974.· 'lhere are 470 Indian childre~ ate-admllllstered foster family home inCounty. t Thus, one out of 470 Indian I 'i!lndder ~wenty-one years old in SolanoOono!u8ion ' , c 11 Ten IS in a foster family home.: '
In Solano County Indian children" . . ' ,homes at a per capita rate 07 times (~~e In State-admllllstered foster familyIndians in California.' percent) the State-wide rate for non-
XLVU. SONOMA COUNTY •
In Sonoma County according t t . .ilIef~Vl, til ere were 18 Indian cliilgr:na[~s~gs/ro~n the Calif01'llia Department ofn 4.· There are 727 Indian Childre a e-a ministered foster family homes
Oounty,t Thus, one out ot every 40.4 rDdl~~d~hut;entY.one years old in Sonoma• ren is in 'II toster tamily home.t An A I A QueStlonnnlre' op cit
ace of the Pop I t'l . '.u a On by 'Coun ty: OPt cit. 1970: 6, 7.
558
00110hi.sionIn Sonoma County Indian children are in State-administered foster family
homes at a per caplta rate 8.3 times (830 percent) greater than the State-widerate for non-Indians iuCn'liforuia, ' ,
XLVIU. STANISLAUS COUNTY
In Staulslnus County, according to statistics from the California Departmentof Health, there were five Indian children in State-administered foster familyhomes in 1974.* There are 307 Indian children under twenty-one years old inStanislaus Oounty.t Thus, one out of every 61 Indian chlldren is in a foster familyhome.Gonolusion
In stnntstaus County Indian children are in State-administered foster familyhomes at a pel' capita rate 5.5 times '(550 percent) greater than the State-widerate for non-Indians in Oalifornla.
XLIX. SUTTER COUNTY
In Sutter County, according to statistics from the California Department ofHealth, there were three Indian children in State-adjninlstered foster familyhomes in 1974.* There are 94 Indian children under twenty-one years old in SutterCounty. t Thus, one out of every 31.3' Indian children is in a foster famllY home.
Oonch/sionIn Sutter County Indian children are in State-aclministered fost.er famll;\"
homes at a per capita rate 10.8 times (1,080 percent) greater than the State-widerate for non-Indians in Cnlifornia. . " '
L. TEHAMA COUNTY
In Tehama County, according to statistics from the California Department ofHealth, there was one Indian child in a State-administered foster family homein 1974." There are 137 Indian children under twenty-one years old in 'l'ehamaCounty.t Thus, one out of 137 Indian children is in a foster family home.Ooncl1/sion
In 'I'ehnma County Indian children are in State-administered foster familyhomes at a per capita rate 2.5 times (250 percent) greater than the State-widernte for non-Indians in California.
LI. TULARE COUNTY
In Tulare County, according to statistics from the California Department ofHealth, there were 15 Indian children in State-administered foster family homesin 1974." There are 613 Indian children under twenty-one years old in TulareCounty.t ThUS, one out of every 40.9 Indian children is in a foster fnmlly home.ConOlltsion
In 'I'ulare County Indian children are in State-administered foster familyhomes at a per capita rate 8.2 times (820 percent) greater than the State-widerate for non-Indians in California.
LII. TUOLUMNE COUNTY
In Tuolumne County. according to statistics from the California Department ofHealth, there were two Indian children in State-administered foster family homesin 1974.· There are 24G Indlan children under twenty-one years old in TuolumneCounty.t Thus, one out of every 123 Indian children is in a foster family home.00nol1tsion
In Tuolumne County Indian children are in State-administered foster familyhomes at a per capita rate 2.7 times (270 percent) greater than the State-widerate for non-Indians in California.
• AA IA Qt1~stlonnnlre, op. eft.tRace of the Population by County: op. eft. 1970; 6, 7.
559
LIII. VENTURA. COUNTY
In Ventura County according t tati ti f '. .\Health, there was on~ Indian chilJ i~ a St l~S ~on~ t.he Cahforl1la Department of ,1974.* There are 515 Indian childre ade-a t mllllstered foster family home iOl ,'.Oounty.r Thus, one out of 515 IndiannC:inlder :-veinty-one ,Years ?ld in Venturll:J"C
ren IS n a foster famlly home .;,;oncuuto« . , "In Ventura County Indian children . S .
homes at a per capita rate 07 tim are In . tate-admilllstered foster familyIndians in California. . es (70 percent) the State-wide rate for no~...
LIV.YOLO COUNTY
In Yolo County accord' t tatlati .."Health, there wa~ one I~Jla~ s a.bsb.cs froni the California Department of i
h,ome in 1974.* There are 213 I:U~~~ ~g'l~ State-administered foster fam!lY'Yolo County.t Thus, one out of 213 Indian\h~!~ un~le~ twenty-one years oldInConcZusion ren IS 111 a family foster home.,.!
In Yolo County Indian children are i St . . ." !
!tt a per capita rate 1.6 times (160 per~ent)atteb.ad.;utlUtlste~ed foster family homes111 California.. e o a e-wlde rate for non-Indians
LV. YUBA COUNTY
In Yuba County, according to statist! fHealth, there were no Indian cl lld cs j .rom the California Departmsnt of~omes in 1974.• There are 94 IDdlilanre~'ldn State-administered foster family I
Yuba County.t. c 1 ren under twenty-one years old in'• I
LVI-LVIII. COLUSA, MARIPOSA AND ~RINITY COUNTIES
The California Department of Health . " . '.data for Colusa. Mariposa and Trinity co::~ u~a~,rhe to supply any foster careunder twentY-one years old in these tl e~. ere are 278 Indian children_ ,1reecountlss,*t,· ..
. . . 1
• AAIA Questionnaire, op. cit. ' .tRace of the Population by County: op; tiU.11170; 6, '7. ",'
,I' I.,
560
IDAHO INDIAN ADOPTION AND FOSTER CARE STATISTICS
Basic Facts
1. 'I'here are 302.170 under twenty-one year olds in the Stat.e of Idaho.'. 2. There are 3,808 under twenty-one year old American Indians in the State of
Idaho.'3. There are 298,902 non-Indians under twenty-one years old in the State of
Idaho.I. ADOPTION
In the State of Idaho, according to the Idaho Department of Health andWelfare, there were an average of 14 public agency adoptions per year ofAmerlcnn Judiun children from 1973-1975.3 l'his data base is too small to allowrealistic projection of. the total number of Indian children in ad?ptive care.We can say though that during 1973-1075 1.1 percent 'Of Idaho Indian childrenwere placed for adoption.
During 1073-1lJ75, according to the Idaho Department of Health and 'Velf~rp,
there were an average of 109 public agency adoptions per year of non-Indiauchildren in Idaho.' Thus,during 1973-1975, 0.1 percent of Idaho non-Indianchildren were placed for adoption. ' .
OoncZ1tSi.O?L
Based on the three-year period 1973-1975, and not including any prlvateagencr placements, Indian children were placed for adoption at a per capita rate11 tinles (1,100 percent) greater than that for non-Indian children; 88 percentof tile Indian children placed ill adoption by public agencies in Idaho in 1975were placed in non-Indian homes;"
'II. FOSTER CARE
According to statistics from the Idaho Department of Health and Welfare, therewere 296 Indian childrenIn foster care in Fiscal Year 1976.' This represents oneout of even' 12.9 Indian children in the State. By comparison there were 3,615lion-Indian 'cllildren in foster care during Fiscal Year 1976,' representing one outof every 82.7 non-Indian children in the State.Ooncll/siOIl
There are therefore, by proportion, 6.4 times (640 percent) as many IndianChildren as non-Indian children in foster care in Idaho.
III. COMBINED FOSTER CARE AND ADOPTIVE CARE
Since we are unable to estimate: the total number of Indian children currently in adoptive care in Idaho, it is not possible either to estimate the totalnumber of Indian children receiving adoptive and foster care. The foster carestntistics alone, and the adoption data we do have, make it unmistakably clear
'1',1'1. Hur.nu of the Censu •. Census of Populatton : 1970, Volume I, Cbnrnctsrtattcs ofthe Population, Part 14, "Idaho" (U.S. Government Printing Office: Washington. D.C. :19T5), pp, 14-48.
• Ibtd., pp. 14-48 (Table 10), pp. 14-265 (Table 130). Indian people comprlse 114 percentof the total :non·whlte population according to Table 180. According to Table 19 thereaze 7,051 non-whites under twenty-one. 7,051 times .54 equals 3,808.
'Telephone intervtew with Ms, Shirley Whea tley, Adopttons Coordlnntor, Idaho Depnr tmr-nt of Hpnlth end Welfare, July 23. 107(1. A tom I of 41 Indlnn children were placedfor ndontf on hr the Idnbo Dennrtoment of Health nnd Welfare dtlrln~ these three renr•.
• Ibid. A total ot 828 non-Indian children were placed tor adoption by the Idaho Department ot Health and Welfa:re during these three yeam.
, Ibid."Telephone Interview wlth ~I!. Rnth PelleY/l Bureau of Research and Statistics, Idaho
De.pglr:ent of Health and Welfare, J'oly 28, 1 76.
561
that Indian children are removed from their families at rates fRr exceeding thosefor uon-Iudian children.
The above figures are based only on the statistics of the Idaho Department ofII('alth and Welfare and do not include private agency placements. Tiley aretherefore minimum figures.
IDAHO ApPENDIX
County-by-County Analysis of Idaho Foster Care Statistics
I. DENEWAH, BONNER, DOUNDARY, I(OOTENAI AND SHOSHONE: COUNTI!':S
In Benewah, Bonner, Boundary, Kootenai and Shoshone counties accordingto statistics from the Idaho Department of Health and Welfare, th~re were 33Indian children in State-administered foster care in Fiscal Year 1076.' Tilere are440 Indian children under twenty-one years old in these five conn ties.' '.rhus onein every 13.5 Iudian children is in foster care.Conclusion
In Benewah, Bonner, Boundary, Kootenai and Shoshone counties Indianchildren are in State-administered foster care at a per capita rate 6.1 times (610percent) greater than the Statewide rate for non-Indians in Idaho.
II. CLEARWATER, IDAHO, LATAH, LEWIS AND NEZ PEnCE COUNTIES
. II~ Clearwater, Idaho, Latah, Lewis and Nez Perce counties, according to statIstICS from the Idaho Department of Health and Welfare there were 62 Indian'children in State-administered foster care in Fiscal Yeal: 1976.3 1'here are 827,lad ian children under twenty-one years old in these five counties.' Thus one inevery 13.3 Indian children is in foster care.Crmclusion
. In Clearwa.ter, Idaho, Latah, Lewis and Nez Perce counties Indian children areIII State-admlDlstered foster care at a per capita rate 6.2 times (620 percent)greater than the Statewide rate for non-Indians in Idaho.
III. ADAMS, CANYON, GEM, OWYHEE, PAYETTE AND WASHINGTON COUNTIES
In A?a!lls Canyon, Gem, Owyhee, Payette and Washington counties, accordingto s,tatlstl~s from. th~ Idaho l?eJ;lartment of Health and. Welfare, there were 20Ind.ian chll~ren 1!l State-admullstered foster care in Fiscal Year 1976." Thereare ~98 Indian chlld~en un.der t~enty.one years old in these six counties." l'husone III every 14.9 Jndian children IS in foster care.Conclusion
In Adams,. Canyon, Gem, Owyhee, Payette and 'Washington counties Indianchildren are III State-administered foster care at a per capita rate 5.6 times (560percent) greater than the. Statewide rate for non-Indians in Idaho.
1 Letter and table ("Foster Care by Region") from Ms Ruth Pelley R h A J tI1dafho Department of Health and Welfare, July 27, 1976: These counties ~~:~~Ise ~~g)~zi
o the Idaho Department of Health and Welfare2 The totn! Indian populatton of Benewah Bo'nner Boundary Kootenai nnd SI I
f?e.~ntlte~bs(u?, /oY~:lurea? t f ~he CensllS: CP.IlBUB 'of P0.f)"latlon: 1970 SUPlllen',~~~~~;;()'ti1,~r. WaSblnrton' D to C? hi~j ~guII'i!-l~ ~yJountr: 1~o~ ru.s, Government PrJntfi"iirT'J"j~.D P9puJ.afJOD ~~f _&DP"~b~ 8"JIJnftV"~ P~~'n11'fI:.;.~mK~~J ~~~ arf~f':;~~??~':!~ q,~H.W;.Jt' _t(1 :ti~ ¥'!f~"~~rv:,!~- .~. -~".s!$rr..~(~f -1.1' .~rd .~.fl!fr,lf ,jlft1t1[ift'fl1rf rtf [iC!tIU1, ·'iGj~~rP;~:\;;
.:lr'" IIllf1f'l1'"' t~P.T1tt·"np. .\"I!A.rM otn. (,ll1~r~ Rr~ :L~08 Ilneler tWf'nty-one yp.llr old Am~ri(lllnInr11n". 10 Idaho out of a total Indian population of R,31'5, See footnote 2 to the Idaho,tatlslics. and the U.S. Cenaus Bureau references cited th~eln.) 789 tlmCfl ,603 equals 446total Indian population under twenty-one years of age In these five couutrss. Thl' same~tl~:;;,u~~a\,ao ~~~~nt~~a.determlne the Indian uoder twenty-one year old population in the
of 'J~~lt~u:~dP~~lrar~~' cit. These coontles comprise Region II of the Idaho Department, "Race of the Populntlon by County," loco cit."MB. Ruth Pelley, op, cit. These counties comprIse Region III of the Idaho Departmen t of Health and Welfare." "Race 'of the PopUlation by' County," tee, cit.
II. FOSTER CARE
562
IV. ADA, BOISE, ELMORE AND VALLEY COUNTIES
In Ada. Boise. Elmore and Yalley counties, according to stattstles from theIrln ho Department of Health and Welfare, there were 17 Indian .children inRtnte-administered foster care in Fiscal Year 1976.; There are 2'13 Indlnn childrennnrlor twenty-one years old in these four counties. Thus one in every 14.3 Indianchildren is in foster care.Conclusion
In Ada Boise Elmore and Vnlley counties Indian children are in State-administered f~ster c~re at a per capita rate 5.8 times (580 percent) greater than theState-wide rate for non-Indians in Idaho.
V. BLAINE, CAMAS, CASSIA, GOODING, JF.:ROME, LINCOLN,MINIlJOKA, AND TWIN FALLS COUNTIES
In Blaine, Camus, Cassin, Gooding:, .lerome. Lincoln, Minidoka and Twin F~llscounties, according to statistics from the Idaho Department of Health and" elfare, there were 19 Indian children in State-administered foster care in Fiscal1"l'ar lO76.· There are 236 Indian children under twenty-one years old in theseeight counties," Thus one in every 12.4 Indian children is in foster care.
C011Cl7lsionIn Blain, Camas, Cassia, Gooding, Jerome, Lincoln, Minidoka and 'I'wln Falls
counties Indian 'children are inState-administered foster care at a per capitarate 6.7 times (670 percent) greater than tile State-wide rate for non-IndIans inIdallo.
vr, BANNOCK,' BEAR LAKE, BINGHAM, CAIDBOU, FRANKLIN, ONEIDA, AND POWERS, COUNTIES
In Bunnnck, Bear Lake, Bingham, Caribou, Franklin, Oneida. and Power connties, according to statistics from the Idaho Department of Health and Welfare,there were 128 Indian children in State-administered foster care in Fiscal YearlU76.u There are 1,647 Indian children under twenty-one years old in these sevencounties." Thus one in every 12.9 Indian children is in foster care.
Conoll/sionIn Bannock, Bear Lake, Bingham, Caribou, Franklln, Oneida and Power coun
ties Indian children are in State-administered foster care at a per capita rate6.4 times (640 percent) greater than the State-wide rate for non-Indians In Idaho.
\'II. BONNEVILLE, BUTTE, CLARK, CUSTER, FREMONT, JEFFERSON', LEMHI, MADISON ANlJTETON COUNTIES
In Bonneville, Butte, Clark, Custer, Fremont, Jefferson, Lemhl, Madison andTeton counties, according to statistics from the Idaho Department of Henlth anrlWelfare, there were 17 Indian children in State-administered foster care in FiscalYear ID76.'· There are 335 Indian children under twenty-one years old in thesenino counties." Thus, one in every 19.7 Indian children is in foster care.
Thus one in every 19,7 Indian children is in foster care, :Ooncluslon.
In BNui'!'....il.!I>. Bnrre, C1art.. Cu;:tiPr. FrE'mont. Jl:'fff'r.:onn. IA:'ll1hl. :\(llrli~'''n 1I1~,1Teton count!e,," Indian dtifdren are in &ate-aillnlnisttc-reti fut:cet' l'tl.n' at It 1"0'1'capita rate 4.2 times (4200/0) greater than the State-wide rate for non-Iudinus InIdaho. " ': '. . " . , .'
• Ms. Ruth Pelley. op. cit, ,These counties comprise RegioD IV of 'the Idaho Departmentof Henlth and Welfare.
• "Race of the Population hy County," Joe. cit.• ~1". Huth PeRo)·. op, cit. These counties comprise Region V of the Idaho Department
of Hen.lth Rnd WeJfar~, 'ie "Race of the Population by County," loco cit.u Ma. Ruth reney. on, cit. These counties comprise Region VI of the Idaho Department
or Henlth and Welfa.re.1J "Race of tbe Populutton by County," loco cit.
, ot '';l::it~U~~lW:r'a~r.· cit. These counties comprise RegioD VII ot the Idaho Department" "Race or the Population by County" ; loc. cit.
'Ici
j.I
'":...J'~j
.~
j
563
. ,MAINE INDIAN ADOPTION AND FOSTER CARE STATISTICS
Basic Facts
1. There are 396,110 under twenty-one year olds in Maine.'2, There are 1,084 under twenty-one-year-old American Jndlnns in the State of
Maine."3. There are 395,026 non-Indians under twenty-one in Maine.
I. ADOPTION
In the State of Maine, according to the Maine Department of Human Services,there was an average of two public agency adoptions per yenr of Indian childrenduring 19i4-1975.· This data base is too small to allow realistic projection of thetotal number of Indian children in adoptive care. We can sny though tilat during1974-1975 0.4 percent of Maine Indian children were placed for adoption.
During 1974-1975, according to the Maine Department of Human Services, anaverage of 1,057 non-Indian children wereplaced for ndoptlon In Maine.' 'rhus,during 1974-10i5, 0.3 percent of Maine non-Indian children were placed foradoption. I," 'I '
ConolllsionsBased on limited data, and not in including any private agency placements,
Indian anrl non-Jndlan children are placed for adoption by publlc agencies at approximately simila~.rates.
According'to statistics' from the Maine Department of Human Services in1975 there were 82 Indian children in foster homes." This represents one out ofevery 13.2 Indian children in the State. By comparison there were 1,(;(18 nonIndian children in foster homes in 1975,· representing one out of every 2(;1.9 nonIndian children in the State. ' .Conclllsion
By rate, therefore, Indian children are placed in foster homes 19.1 times(1,9100/0) more often than non-Indians in Madne, As of 1973, tile last year forwhich a breakdown is available, 64 percent of the Indian children in foster carewere in non-Indian homes:
, III.' COMBINED FOSTER OARlll AND ADOPTIVE OARE
Since we nre unable to, estimate. the total number of Indian children cur.rently In adoptive care in Maine, it is' not possible either to estimate the totalnumber of Indian children receiving adoptIve and foster care. The foster carestatistics alone make it unmistakably clear that Indian children are removedfrom their famllles at rates far exceeding those for non-Indian children.
1 U.S. Bureau ot the 'CeDsus, 1970 Census of the Population...Volume I: CharacterIsticsot the Population, Part 21: "Maine" (Washington, D.C. : U.s. ,"overnment PrlntlDg Omce'IOn). Table 19. p. 21-4~{. •
'lhl<1.. n, 21-43 (Tahle 10). n, 21-2~7 (Tn!>1p '~fl). Tn<1lnn people pomn"IRP ~r, pprcpntat the total Don-white popUlation according to Table 1'39. According to Table 19 there are3,0~~ Don-whites under twenty-one. 3,~08 times lie> percent equals 1,084. '
:J .1 elpnhoJle inh'rl"1eW8 with i\1~. Ii rerln )JIUIIJ14~\·. Huhfo;tltnte C~TP Co naul-trmt. 1\IofnpPif:.rtment ot Human Services, June29~O, 1976. Letter, from Ms. Plumley. July 18;
• "'elenhnnp In torvlpw. ,vlt" MR. l'rpr1ft 1"'1111111"y. on, pi t, r.r. NlltlnnaJ 'Cpnfpr fnr ~nplrilSt.tlstlcs, U.S. Department ot Health..t Education and Weltllre, "Adoptlons In 1974" DREWPublication No. (SRS) 76-08251), NC~S Re,vort m-l0 (1974), April 1976. Table 1 ;'ChlJdreDfor Whom adoption petitions were granted p. 7. '
• Telephone Interviews With Ms. Freda Ptumle:r, op. e1t. ' '• Ibid.• Ibid.
.! .
II. FOSTER CARE
564
I . I "I.'
, ApPENDIX: ,HISTORICAL NOTE TO ,THF: MAINE FOSTER CA~E SUTIS'I'XCS
I. I D6D
In 10G9, according to statistics from the Maine Department :of Human ServIces,' there were 82 Indian children in foster homes. ' ~'his 'represented one out ofevery'13.2 Indian children in the State. By comparison, there were 2,OfJO nonIndian children in foster homes in '1960,', representing one out of every, 188.2non-Indian children in the State. "'Colle/.u,lion' . '
In 1069, Indian chlldren were placed in foster homes at a rate, ~4.3 times(1,4300/0) greater than that for non-Indians in the State of Maine. ,,'
II. I D72. "I' , '; ,.; "
In 1072, accordlug. to, statistics from ,the Malne Department of Human Services, there were 136 Indian children in foster homes.' This represented one outof every eight Indian chlldren in the State. By comparison, there were 1,918non-Jndlan chlldren in foster homes in 19i2,' representing one of every 206 nonIndian chlldren in the State.Conell/slon
Br rate. therefore, Indian chlldreu are in foster care at n per capita rate 25,8times (2,580%) greater than that for non-Indians in the State of Maine.
III. I D72-AROOSTOOK COUNTY
Aroostook County (home of the Micmac and lIIalecite tribes accounted formore than half of the Indian foster care placements in 1072, In AroostookCounty alone, aecordlng to statistics from the Maine Department of HumanServices, there were 73 Indian children in foster care in 1972." This representedone out of every 3.3 Indian children in Aroostook county.'Cline/lis/on.
In Aroostook County in 1072 Indian children were placed ill foster homes ata rate 62.4 times (6,240 percent) greater than the State-wide rate for nonIndians.
IV. ID73
In 1073 according to statistics from the lIIalne Department 'of Human SeJ;vices, ther~ were 104 Indian children in foster homes: This represented one outof every 10.4 Indiun children in the State. By comparison, there were 1,861 nonIndian children in foster homes in 1973,' representing one out of every 212.3non-Indian children in the State.COllo/,lIsion.
In 10i3, Indian children were placed in fogter homes at a rate 20.4 times(2,040 percent) greater than that for non-Indians in the State of lIIaine.
1 Telephone Inte ....le...s with III.. Freda Plumley~ Substitute Care ConllUltanti
!\falne Denartmen t ot Human Services, June 2D-80, 1976. Letter trom Ills. Plumley. Ju y 13, 1976.The years Included In thIs historIcal note are the last years tor which the Maine Department of Human Services Is able to supply statistics.
, Ibid., Ibid.• IbId.• Ibid. ID72 wns the only year for Which the l\Ialne Department ot Human ServIces was
able to supply a eouuty-by-county breakdown of Indian toster care placements.ftTIH' 1"otnl Inrlln n ponnlntlon of Aroostook COll11tT' fR 436. (H.R. Bureau of the Cpn~l1f:1.
CenRus ot Population: ID70 Supplementary Report PC{Sl)-104, "Race ot the Populationby County: 1970" (U.S. Government Printing Office: Washington, D.C.: 1975), p. 22.)ASRumlng that the a,l\'e breakdown ot the IndIan poputatton ot Aroostook County Is similarto the state-wide np:e breakdown of the Indian poputatton In 1\Ialne, 155.3 percent undertwenty-one years old. (There are 1,084 under twenty-one year old American Indians InMlllne out of a total Indian population of 1,961. See footnote 2 to the Maine statistics.and the U,S. Census Bureau references cited therein.) 486 times 115.3 percent equals 241total Indlnn I'0pl1lntlon I1n'lor twontr-one ;voars ot age In Aroostook County.
T Statistics trom Ms. Freda Plumley. op. cit.• IbId.
565
MAINE INDIAN AIlOPTION ANIl'FOSTF.R CARE STATIs'rICB
.. \' i· ,,\L:~':)
Basic Facts . ,, .... , I .
1. There are 396,110 under twenty-one year olds in Maine. ' " ~ ,,:-.' f2. There are 1,084 under twenty-one-year-old American Indlans In the State of
Maine.' '3. '£here are, 395,026 non-Indians under twenty-one in Maine.
I. AnoPTIoN
In the Sta't~ of Maine, according to the Maine Department of Human Services, :there was an average of two public agency udoptions per year of Indian children ,during 1074-1975,' ~'his data base is too small to allow realiRtic projection of-thetotal number of Indian children In adoptive care. We call RaJ' though that during "1974-1075 0.4 percent of Maine Indian children were placed for adoption. , •
During 1974-1975, according to the Maine Department of Humun Services; anaverage of 1,057 non-Indian children were placed for adoption in Maine,' 'rhus,during 1974-1075, 0.3 percent of Maine non-Indian chlldren were placed for'adoption. " ' ' 1
, ,Conclusions
B:ased on limited. data, ,and notIn Including any private agency placements,Indian and non-Inrlian chtldrenare placed for adoption uy public agencies at apprOXimately si~lar rates.
Accordtngr» statistics' from the lIIaine Department of Human Services In1975 there were 82 Indian children in roster homes.' This represents one out ofevery 13.2 Indian children In the, State. By comparison there were 15GB nonIndian children in foster homes in 1975,' representing one out of every 251.9 nonIndian children in the State. .Conclusion
By rate, therefore, Indian children nre placed in roster houies 19.1 tilJ1PS(1,?100/0) more ofte? tha~ non-Indians In Maine. As of 1973, the last year forwhtch a breakdown IS available, 64 percent of the Indian children in foster carewere in non-Indian homes:
III. COMBINED FOSTEROARE AND ADOPTIVE OARE
Since we are unable to .estimate, the total number of Indian children currently in adoptive care in Maine, it is not possible either to estimate the totalnumber of Indian children receiving adoptive and fost.er care. The foster carestatistics alone make It unmistnknbly clear that Indian children are removedfrom their tamll1es at rates far exceeding those for non-Indian children.
l n.s, DurGAI1 ot the -ConHUj{ 1970 Census Of the p~ulatlon Volume I: Characteristicsr57~.f)e. ~,~~\l~~tAon.,~~~~1:" alne" {Washington, D.• : us, Government Printing Omce:
• Illlel.. p, 21':'.8 r'l'ahle 10>' P. 21-2.~7 (Tnble ,~O). Tnd lnn people eomn"!.,p:l~ pPI'centof the total non-white populatron according to Tahle l'3D. According to Table 19 there are3,098 non-whttas under twenty-one. 3.0D8 times '315 percent equals 1 084
n tr~lf'lIllOne interviews wlt h l\lfl:. 11'r~(ln PIUJII]ll\". :-;;l1h~tltllte CprpA Cf')n~l11't!lnt. i\rlJln~Pif~rtment ot Human Services, lune 29-'30. 1976. Letter,trom Ms. Plumley, July 13,
''J'eJenhonp IntervIew" with MR, Fr-odn PI11I1l]e;v, nn, ~It. Cf,Nntlonal ('pnter rnr Rocl,!Statistics, U.S. Dp.parfment of Health..t Education and Weltare ",Adoptions In 1974 .. DHEWfP UbllCa ti on No. (SRS) 76-03259, NC;:;S Reoort E-10 (1974) A.prll1976 Table 1 ;'Chlldrenor whom adoption petitions were granted n p. 7. • • •" Telephone Interviews With Ms. Freda PIumle;r op cit. ' ; " " ,• Ibid. • • ,• Ibid.
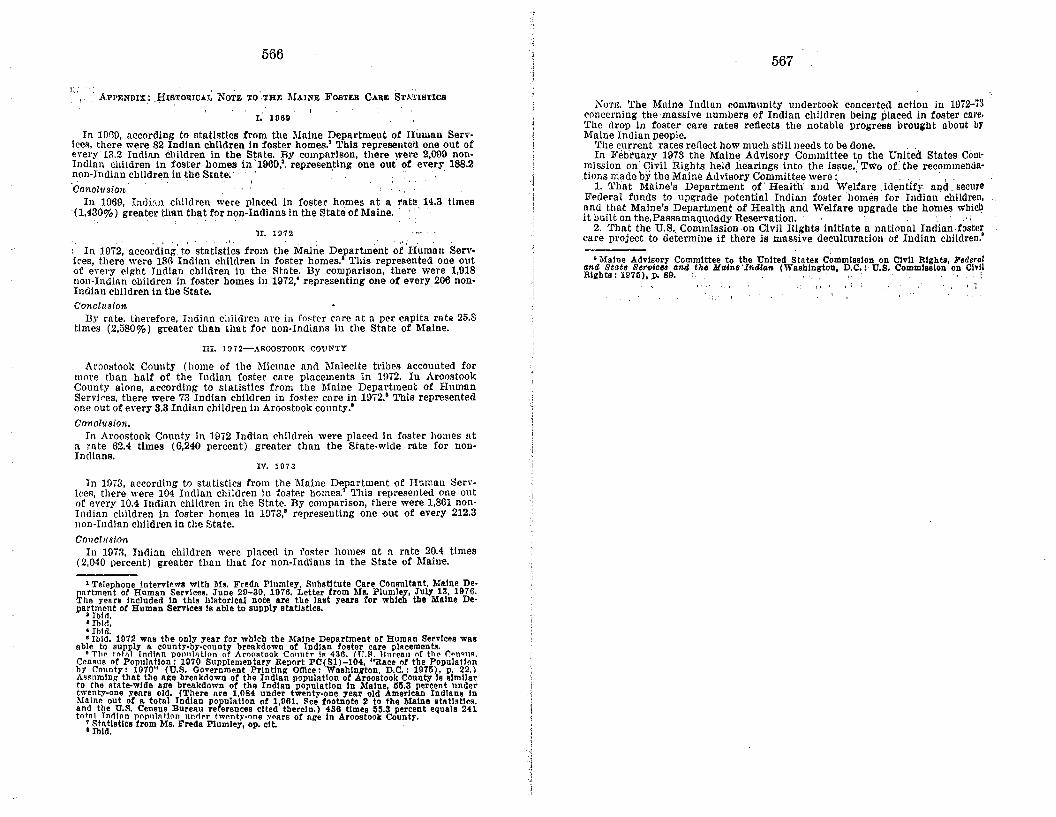
1'-
566
, ApPENDIX: .HISTORICAL NOTE TO ',TBJl: MAINE FOSTER CARE Sl'NrISTICS
I; 1060
In IDGO, according' to statistics from the lIIalneDepartmellt of Human Servoices, there were 82 Indian children In foster homes.' 'I'hls 'represented one out ofeverv 13,2 Indian children In the State. Ry comparison, there were 2,OVIl nonIndian children In foster homes in 'lOOO,'. representing one out' of every 188.2non-Indian children in the State;" , . ..''Oonclu8ion'
In 1069, InrJir<ll children were placed in foster homes at 0. rate 14.3 times(1,430%) greater than that·for non-Indlans In the State of Maine.' ,I'
rr, 1072
: In ID72, according'to statistics from the MRlne Department of ;H'uman Sen',ices, there were 13G Indian children in foster homes.' This represented one outof every eight Indian children In the Stnte. By comparison, there were 1,1l1Snon-Indian children in foster homes in 1972,' representing one of every 206 nonIndian children in the State.Conclusion
By rnte. therefore, Indian children are in ro~ter cnre at a per capita rate 25.Stimes (2,580%) greater than that for non-Indians in the State of Maine.
III. 1072-AROOSTOOK COUNTY
Aroostook County (home of the Micmac and 1\Ialeclte tribes accounted formore than half of the Indian foster cnre placements "in 1972. In AroostookCounty alone, according to statistics from the Maine Department of HumanServloes, there were 73 Indian children in foster care in 1972.' This representedone out of every 3.3 Indian children in Aroostook county.'Conolu.sion.
In Aroostook County in 1972 Indinn children were placed in foster homes ata rate 62.4 times (6,240 percent) greater than the State-wide rate for nonIndians.
IV. 1073
In 1073, according to statistics from the lIIaine Department or Human Sel"\"·Ices, there were 104 Indian children in foster homes: 'I11is represented one outof every 10.4 Indian children in the State. By comparison, there were 1,861 nonIndian children In foster homes In 1973,' representing one out of every 212.3lion-Indian children in the State.Oono1118lon
In Hli.'l, Indian children were placed in foster homes at a rate 20.4 times(2,0-10 percent) greater than that for non-Indians in the State of Maine.
1 Telephone Interviews with ~h. Freda Plumley, Substitute Care Consultant, Maine Department at Human Services, June 20-30, 1076. Letter trom Ms. Plumley, July 13, 1976.The yean Included In this historical note are the last years tor which the Maine Department of Buman Services Is able to supply atatlsttcs,
, Ibid., Ibid,• Ibid.'Ibid. 1972 was the only year for which tbe Maine Department of Human Services was
able to supply a countr-br-county breakdown of IndIan foster care placements.'1'h~ intal Indtnn ponnlatlon of Aroo.took Cnnn tv \. 436. (I).fl. Hnrean of the ~.n'""
CenRUs of Population: 1970 Supplementary Report PC(Sl)-104, "Race of the Populationby County: 1070" (U.S. Government Printing Olllce: Washington, D.C.: 1975), p, 22.)Assuming that the age breakdown of the Indian population of Aroostook County Is similarto the sblts-wlde age breakdown of the Indian population In Maine, 65.3 percent undertwenty-one yenrs old. (There nre 1,084 under twenty-one year old American Indians InMaine out of a total Indian population of 1,961. See footnote 2 to the Maine statistics.and the U.S. Census Bureau references cited thereIn.) 486 tImes 55.3 percent equals 241totnl Indin n popnlntlon und er- tweritv-one ;VNIrS of age In AroostOOk County.
; ~~.lstiCI from Ms. Freda Plumley, op. cit.
567
J\"01'E. 1'he Mnine Indian community undertook concerted action in 1972-j3concerning the 'massive numbers of Indian children being placed in foster care.The drop in foster care rates reflects the notable progress brought about byMaine Indian people.
The current rates reflect how much still needs to be done. ....In February 1973 the Maine Advisory Committee to the United States Com·
mission on' Civil Rights held hearmgs into the Issue;' Two or. the recouunenda-.tions made by. the Maine AdVisory Committee were:.' , '.. ' ""
1. That Maine's Department of' Health' and Welfare iuentifr· and. secureFederal funds to upgrade potential Indian foster 'homes for Indian' children,and that Maine's Department of Health and Welfare upgrade the homes-whtchit built on the, Passamaquoddy Reservation. .';
2. That the U.S. Commission on Civil Rights Initiate a national Indian.fostercare project to determine if there is massive deculturation of Indian children.'
• Maine Advisory CommIttee to the UnIted States Commission on Civil Rights, Federaland Stat. 8er1l(01l8 and thll MrUnll'Indian (WashIngton, D.C.:· U.S. Commission on CivilRights: 1975),.;110 89. . . i
. I':

568 569
1. There are 3,727,438 under twenty-one year olds in the State of l\Iichigan.'2. 'l'here are 7,404 under twenty-one year old Amercan Indians in tbe State
of Michigan.' "3."Ther~ life ?,720,034pon~Indiansunder twenty-one In the State of i:lIichiglln.
'U.S. Bureau of the Census, Census of Population: 1970, Volume I, Cbaracterlstlcs oftbe Populatton, Part 24, "Michigan" (U.S. Government Printing Olllce: Wasblngton, D.C.:(1013), pp. 24-6:;.
:l ".s. f'turPfll1 of 1hp. Cpn.QI\~. f:enf:m!=l. of Ponuln tf on : 1('17110: ~11l).i~rt Rf"nOrtR F'Irin l p",nOl'tPC(2)-lF, "American Indians" (Wasblngton, D.C.: U.S. Government Printing Office:1973). Table 2, "Age of tbe Indian Population by Sex and Urban and Rural Residence:1910." n. 8.
'Letter from R. Bernard Houston, Director, MichIgan Department of Social Services,FebruarY 23, 1913. '
• Leter from Bethanv Christian Home. N.E. Grand Rapids (4 children)' CathollcSocial Servlccs, of the bloc~Re ot Grand Rapids (11 chlldren)i' Catholic SocIal Services,Pontiac (1 child): Cblld and Family Services of Michigan, nc., Alpena (2 chlldrenJ,BrlA'hton (15 chlldren), Farmington (15 children), Fort Huron (2 children); Child andFamily Services of the Upper Peniuaula, Marquette (1 child): Famlly and Child CareService, Traverse City (1 child) '1 Clarence D. Fischer (1 child): MIchigan Children'sand Family Service, Traverse C ty (1 child): Regular Baptist Chlldren'a Home (2children) .
• National Center for Social Statistics, U.S. Department of Health" Education andWelfare. "Adoptions In 1914." DHEW Publication No. (SRS) 76-032,,9, NCSS ReportE-10 (1974), April 1976. Table 10 "Children adopted by unrelated petitioners by ageat time of.placement, by state, 1974," p. 16. (AbSOlute nnmbers converted Into percentagesfor 7\lIrp08.8 nf thl8 rool'rt.
"The median age at time of placement ot children adopted by unrelated petitioners Inlll14 In MlchlJmn was 11.4 months. fblrl.. n. 15.
7 National Center for Social, Statistics, U.S. Department of Health, Educatlon andWclfare, "Alloptlons In 1973," DREW Publication No. (SRS) 76-03259, NCSS Report E-JO(1973), JUly 1970. Table 1, "Children for whom adoption petitions were granted In 41reportln~ States," p. 4.
"In the State of Michigan, according to the Michigan Department of SocialServices' and 12 private child placement agencies In Michigan,' there were 112Indlnn children placed in adoptive homes during 1973. Using State figures reported to the National Center for Social Statistics of the U.S. Department ofHealth, Education and Welfare," 63 percent (or 39) are under one vear of IIgewhen placed. Anotuerzupercent (or 12) 'are one rear to less tban six years 01<1when placed i 13 percent (or eight) are six yeara, but less than twelve whenplaced : and 4 percent (or three) are twelve years and over." Using the formula,then that: 39 Indian ,children per year are placed in adoption for lit least ]7~'enrs, 12 Indian children: are placed in adoption for a minimum average of 14years, eight Indian, children are placed in adoption for an average of ulneyenrs, and three Indian children' are placed in adoptionfor an average of threevears: there are 912 Indian children under twentv-oneyears old in adoption atanyone time in tbe State 'of MIChigan. 'l'hls represents one out of even' 8.1Indian children in the State. " , ', TIH're were 8,302 non-Indiana under twenty-one )'ears old placed in adoptive
homes in Michigan in 1973.7 Usingfhe same formula .as above. there are 122,BOOnon-Indians in adoptive homes in Michigan, or one out of every 30.3 non-Indianchildren.
ConclusionThere are therefore by proportion 3.7 times (370 percent) as many Indinn
children as non-Indian children in adoption in Michigan.
MIClIlOAN bmIAN ADOPTION AND FOSTER CARE STATISTICS
Basic Facts
....,.".....
.,' .• :.!.
II. FOSTER CAR&:
Acc.ording !o stnt~tics from the Michigan Department of Social Sl'rvJ~';:'and seven private child placement agencies' there were 82 Indian chlldren IQ"~:foster homes in 1973. Tl~~ represents one out of every 90 Indian children in lhfl,':'Sta~e. B:v: comparison there were 5,801 non-Indian children in foster hom",.:1;~representing one out of every 641 non-Indlanehlldrsn in the State, " ,,; "':''''''::;\',Concl1l8-ion ';iJi"
~y rate therefore Indian children' are placed in foster homes 7.1 times (i1it:;}pel cent) more often than non-Indian children In the State of Michlgan,',rr"h;/lo":::'
" I!:' ., 1".,Ll' ~-.~ ~;,'~"".,
III. COMBINED FOSTER CAREl AND ADOPTIVE CARE • "':;,: 'il/"'t"~l«;:
Usi~g' the. above figures a total of 994 under twenty-one year old Indian chlld~enX;~re .either III foster ~OIllE'S or adoptive homes in the State of Michigan. Thlsi':,represents one out or every 7.4 Indian children. Similarly for non-Indians In.:'';'th~ State, 128,~1 under twenty-one year olds are either in fo~ter care oradoptlve}~care, representtng one in every 28.9 non-Indian children. , "hl'/'[.,,;,: ~'~,
Conol'U8ion " ""if,pl,',"!. By rate therefore Indian children are removed from their homes ,land 'placed <,III adoptiye care or foster care 3.9 times (390 percent) moreorten than non-Indianchildren 111 the State of Michigan.' , , ,I' "
, , . . :,;'I I I ~ ",I :I ~I{• Let tor- from R. Bernard Houston op. cit " , ' " ,'. "~,I ,
• Letters trom Bethany Christian Home, N.E. Grand Rapids (16 chlldren/' CatholleSi~l~l ~ervlce~ of the Diocese of Grand Rapids (3 children) ; Child and Fam ly. Services(2 cl~lld¥~ri'f. ~~~1r;a4~arJ~I~~tec(1C~J1~; De~olt Baptist Children's Holil8J."Royal OakChildren SerVices of the Kallimazo~rl e ce, averse Cltfu (15 children) ; J!'amlly andSef.vlces. Traverse City (2 children). rea (2 cblldren) ; Mlc gan Children's and lI'amll1W Natlo~,nl Center tor Social Statistics, U.S; Department of Health Education andA elfare, Chlldren Served by PUblie Welfare Agencies and VoluntarY. Child WelfareRgenCies and Institutions March 1971," DREW Publlcatlon No. (SRS) 73-032158 NCSS
ep?rt E-9 (3/71), April 27, 1973. Table 8, "Children receiving social service's frompub Ie welfare sgencles and voluntary child welfare agenelel and Institutions" ',"','
~ • 1'. • !, I, \"
I. ADOPTION",I'"
.q,
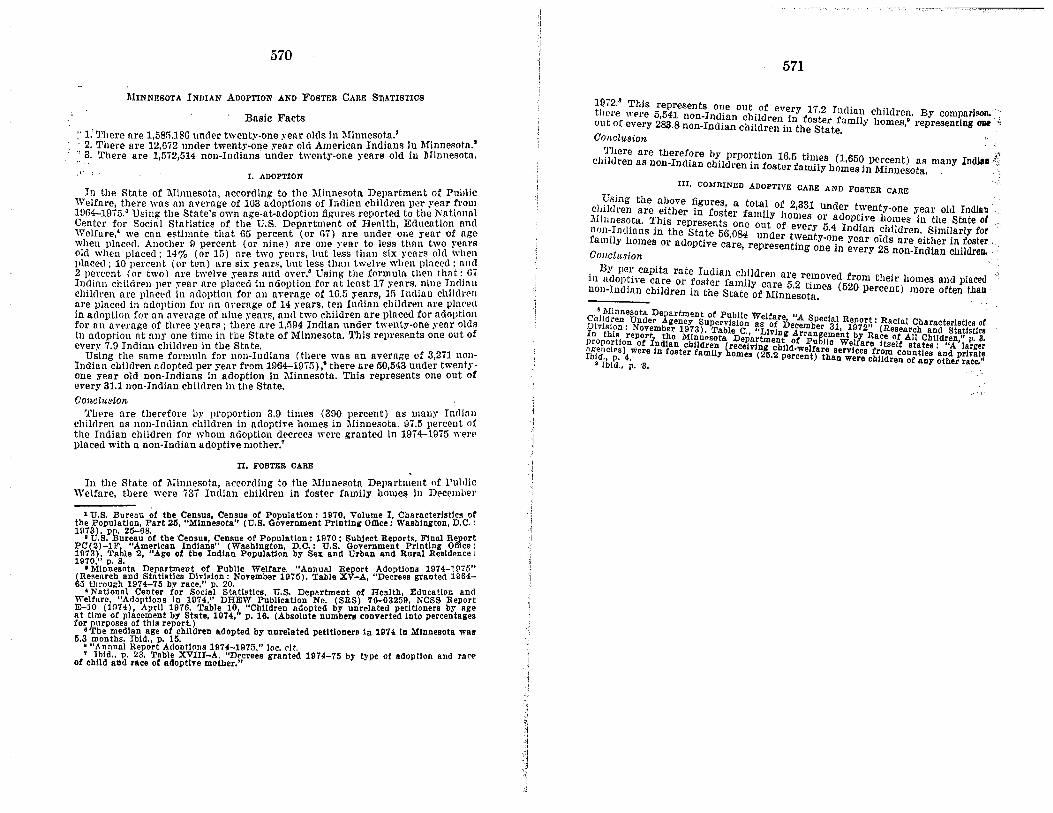
570571
MINNESOTA INDIAN ADOPTION AII"D FOSTER CARE S'I1ATIBTICS
Basic Facts
~' 1.'There are 1,585.18(3 under twenty-one vear olds in :lIinnesota!, 2. There are 12.(372 under twenty-one year old American Indians In lIIinnesota.·., 3. There are 1,572,514 non-Indians under twenty-one rears old in Mlnnesota.
In the State of Mlnnesotn, according to the Minnesota Department of PublicWelfare, there was an average of 103 adoptions of Indian children per year from1964-1975.' Using the State's own age-at-adoption figures reported to the NationalCenter for Social Statistics of the U.S. Department of Health, Education andWelfare,' we can estimate that 65 percent (or (7) are under one year of ageWhen placed. Another 9 percent (or nine) are one ~'ear to less than two yearsold when placed; 14'70 (or 1[i) are two years, hut less than six years old whenplaced; 10 percent (or ten) are six years, hilt less than twelve when placed : nnd2 percent (or two ) are twelve years and oyer." Using the formula then that: 07Indian children per year are placed in adoption for at least 17 years. nine Indianchildren are placed in adoption for an average of 16.5 years, 1fi Indian childrenare placed in adoption for an nverage of 14 vears, ten Irnlinn children are placedin adoption for an average of nine years, and two children are placed for adoptionfor an average of three years : there are 1,594 Indian under twenty-one year oldsin adoption at any one timo in the State of Minnesota. 'l'his represents one out ofevery 7.0 Indian children in the State.
Using the same formula for non-Indians (there was an avernge of 3,271 nonIndian clJilrlren adopted per yenr from 1964-19iG),' there are 50,543 under twentvone yenr old non-Indians In adoption in Minnesota. This represents one out ofevery 31.1 non-Indinn children in the State.Oonclusion
'I'here are therefore Uy proportion 3.9 times (300 percent) as maur Inrllnuchildren as non-Indlnn children in adoptive homes in Minnesota. 97.5 percent ofthe Indian children for whom adoption decrees were granted in 1974-1975 wereplaced with a non-Indian adoptive mother:
." I. ADOPTION
11)72.' This represents one out of ev 1~? . .there were 5,541 non-Indian ch i ldr- ery f ,.- In(han children. By cornparlson,out of every 283.8 non-Indian childre~\I~~h~gt~:t:.amlIYhomes,· representing OM'
Oonr;l-usion
There are therefore by prporti 16" tl -children as non-Indian cbildL'en il:~~st '''f 1~lles (1,650. per~ent) as many Indlaa'¥:
er ann y homes llll'vI1nnesota, .
III. COMBINED ADOPTIVE CARE AND FOSTER CARE
Using the above figures a total f 2331 -children are either in foster falI' a , under t~venty-one year old Indiau -Minnesotll. ~l'his represents one Ol\~~y homes or adopt.lve ho.mes in the State ornon-Indians in the State 56084 d o~ every 5.4 Indilln cluldren. Similarly forfamily homes 01' adoptive c~re re~)~e;~n~~venty-o~eyellr olds are either in foster,Conciusto« " lIlg one 111 every 28 non-Indian childreu.
. BJ' per capita rate Iudlan children ar. .In adoptive care 01' foster familv c 5e2re,moved from their homes and placednon-Indian children in the State 'of ~!ic;1I1~so~~u:es (520 percent) more often thau
".• J
• Minnesota Department of PUblic Welia "Ag\,;l~foeg. ~~~~r Ab gen1c9Y73Supervision as o/1>ecemSte~Clli R;C~2r~: (RRnclal Characteristics ofI thl' m er ). Table C "Living A ' esearch and Statlstlcsn s report the Minnesota De"artm rrnngement by Race at AI! Children" 3
P.~~R~f~~Jnw~~/rd}ant children [recf!vlng ~~1IJ_~iJ;ab~~cse'::l:aret Itself etates: "A' la~ge;Ibid. P 4 n os er family homes (25:2 percent) than weres hW:f counties and private
• Ibld~, P. '3. e c ren of any other race."
rr, FOSTER CARE
In the State of j\Iinnesotll, according to the Minnesota Department of PuhlicWelfare, there were 737 Indian children in foster family homes in December
1 U.S. Burenu of the Census, Census of Populatlon: 1970, Volume I, Characteristics ofthe Population, Part 25, "Minnesota" (U.S. Government Printing 01l1ce: Washington, D.C. :1973). pp. 25-68.
• U.S. Bureau of the Census, Census of Population: 1970; Subject Report., Final ReportPC(2)-lF
b"American Indians" (W8.8hlngton, D.C.: U.S. Government Prlntlng Omce:
1973). Ta Ie 2, "Age of the Indian Populatlon by Selt and Urban and Rural Residence:1970." p, 8.
o Minnesota Department of Public Welfare, "Annual Report Adoptions 1974-1975"(Research and Statistics DivIsion: November 1975). Table XV-A, "Dccrees granted 196465 through 1974-n by race," p, 20.
• National Center for Soclal Stntlstlcs. U.S. Department of Health, Education andWelfare "Adoptions In 1974." DREW Publication No. (SRS) 7a-03259. NCSS ReportE-IO dOH), Aprll 1976. Table 10 "Children adopted by unrelated petitioners by ageat time of plncement by State, 1974,1' p, 16. (AbSOlute numbers converted Into percentagesfor purposes of this report.)
"The medlsn age ot children adopted by unrelated petitioners In 1974 In Minnesota was15.3 months. Ibid., p. 15.
""Annual Report Adoptions 1974-1975." lac. cit.• Ibld., p, 23. Tnble XVIII-A. "Decrees granted 1974-75 by type of adoption and race
of child and race of adoptive mother."
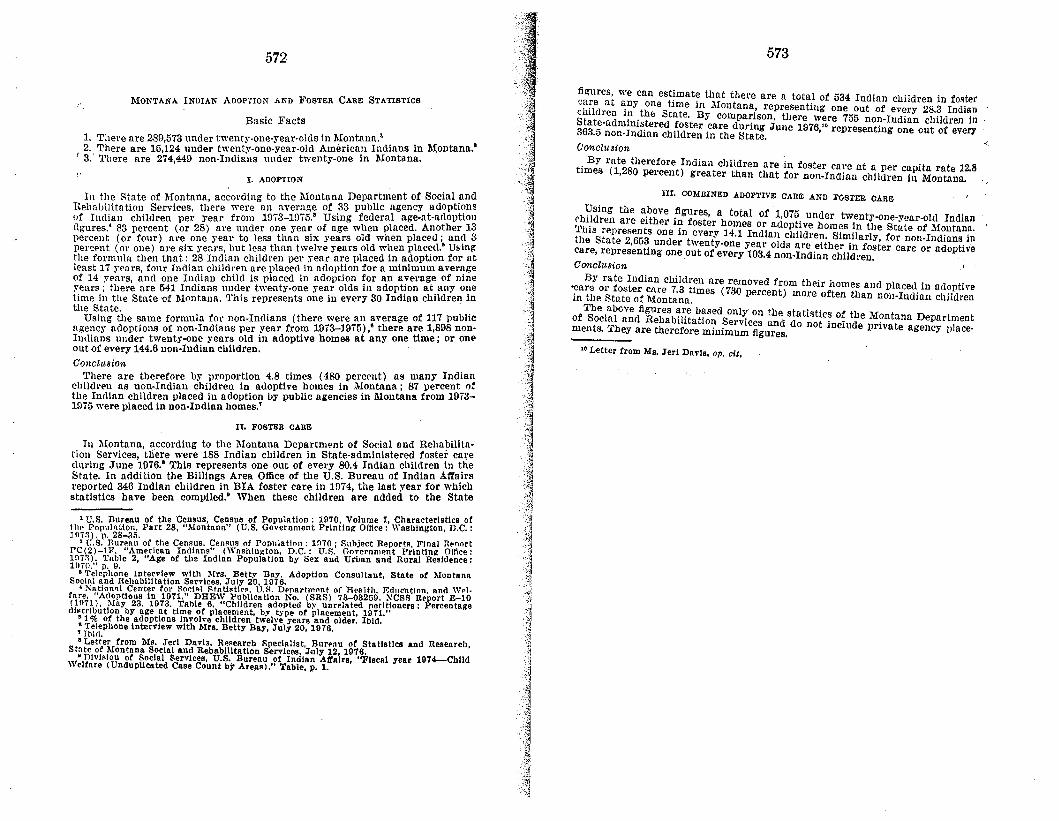
572
MONTANA INIJIAN ADOPTION AND FOSTER CARE STATISTICS
Basic Facts
1. There are 289,573 under twenty-one-year-olds in Montana.'2. There are 15,124 under twenty-one-year-old American Indians in Montana."
I 3.' There are 274,449 non-Indians under twenty-one in Montana.
I. ADOPTION
In the state of Montana, according to the Montana Department of Social andRehnbiutntfon Services, there were an averag-e of 33 publlc agency adoptionsof Indian children per rear from 1973-1975." Using federal age-at-adoptionfigures.' 83 percent (or 28) are under one year of age when placed. Another 13percent (or four) are one year to less than six years old when placed; and 3percent (01' one) are six yenrs, but less than twelve years old when placed." Usingthe formula then that : 28 Indian chilclren per year are placed in adoption for atleast 17 vea rs, four Indian children are placed in adoption for a minimum averageof 14 YNlrs, and one Indian child is placed in adoption for an average of nineyears; there are 541 Indians under twenty-one year olds in adopt.ion at anyonetime in the State 'Of Montana. This represents one in every 30 Indian children inthe State. .
Using the same formula for non-Indians (there were an average of 117 publicagency adoptions of non-Indians per year from 1973-1975)" there are 1,898 nonIndians under twenty-one years old in adoptive homes at anyone time; or oneout of every 144.6 11'On-I11dian children.Conclusion
There are therefore lJy proportion 4.8 times (480 percent) as many Indianchildren as non-Indian children in adoptive homes in :Montana; 87 percent 0:the Indian children placed ill adoption lJy pubUc agencies in ~Ioutana from 19731975 were placed in non-Indian homes:
II, FOSTER CARE
In Montanu, according to the Montana Department of Social and Rehabilitation Services, there were 188 Indian children in State-administered foster careduring June 1076.· This represents one out of every 80.4 Indian children in theState. In addition the Billings Area Office of the U.S. Bureau of Indian Affairsreported 346 Indian children in BIA foster care in 1974, the last year for whichstatistics have been compiled." When these children are added to the State
1 U.S. Bureau o! the 'Census, Census o! Population: 1970, Volume I, 'Characteristics ofth~ Populntion. Part 28, "Montana" (U.S. Government Printing Office: Washington, D.C. :J 97:\). p. 28-35. .
, u.s. Burenu of the Census. Cen.us of Population: 1!l70; Ruhjcct Reports F'lnal n~nnrtPC(2)-' F. "AmerIcan Indlnns" (Wnshlnl'(ton. D.C.: U.S. Govcrnment Prlntlnl'( Office:1!l7,1). 'I'able 2, ",Age of the Indian Population by Sex and Urban and Rural Residence:11170," p. 9.
"Telephone Interview with Mrs. Bett.. Bnv. Adoption Consultant, State of lIIontanaSocl'!l and Rehabilitation Services. July 2'0, 1076.
'1'\ntloMI Cen-ter for ~ool.·1 ~tntl.tlr". U.~. Denar-tmnnt or Health. F:duC'ntlon. nnd Wol.fnre. "Adoptions In 1971," DHE'V Publication Ko. (SRS) 73-03259 :-less Report E--I0(1971). lIIay 23. JOia. Tahle 6. "Children adopted by unrelnted petitioners: Percentagedl.t'·lbution by age at time at placement. by t)'pe of placement, 1071,"
" J % of the adoptions Invo)ve chlldren twelve yenrs and older. Ibid.: ;~~~~Phone Interview with 1111'S. Betty Bay. July 20, 1976.
• Letter from ?tIs. Jeri Davia, Research Rpeclallst Burenu of Statistics a.nd Research,St~te of Montana Social and Rehabilitation Servlc!lll, 'J,uIY 12, 1976.
V Dlvlslou of Soclal Services. U.S,. Bureau ot Indian Atralrs. "Fiscal year 1074-Chlld, eltnre (Undupllcated Case Count by Are",s)." Table. p, 1.
573
~:~ere:, we can est~mat~ that there are a total of 534 Indian children in fosterchildre~ ~~y t~neStime m Montana.. representing one out of every 28.3 IndianState-admtnl ste dt~te't ~y compa~lson, there were 755 non-Indian children in363.5 non-In~i:~eChil~~:~ i~~~edSf~~:. June 1976,'· representing one out of every
Conclusion
tl By rate therefore Indian children are in foster care at II percaplta rate 128imes (1,280 percent) greater than that for non-rndlan children in Montana.'
III. COMDINED ADOPTIVE: CARE AND FOSTER OARE
Using the above figures a total of 1 07" dchildren are either in fost~r homes or ad ~. unher tWienty-one-year-Old Indian'I'his rep ts ona t op I ve omes n the Stn te of Montanathe Stat:e;~~3s OD1 1llt every 14.1 Indian children. Similarly, for- non-Indians i~
care, repreS'e~tiDugno~~ o~~e~i~'~~r~~~~~4o~~~'~~~i~i;~~il~r:~~tercare or adoptiveConclusion
By rate Indian children nre removed f th' I'Care 01' foster cnre 7.3 Urnes (730 percen~)om elr
fl0mesand placed in udoptive
in the State of Montana. more 0 ten than nOli-Indian childrenThe above figures are based only on th t t' tl f
of Social anrl Rehabilitation Services an~sd~ ~o~c~ 0 1 ~e Montana Departmentnlents. They are therefore minimum tlguras, IDC u e privata agency place-
ao Letter from Ms. Jeri Davis, op, cit,
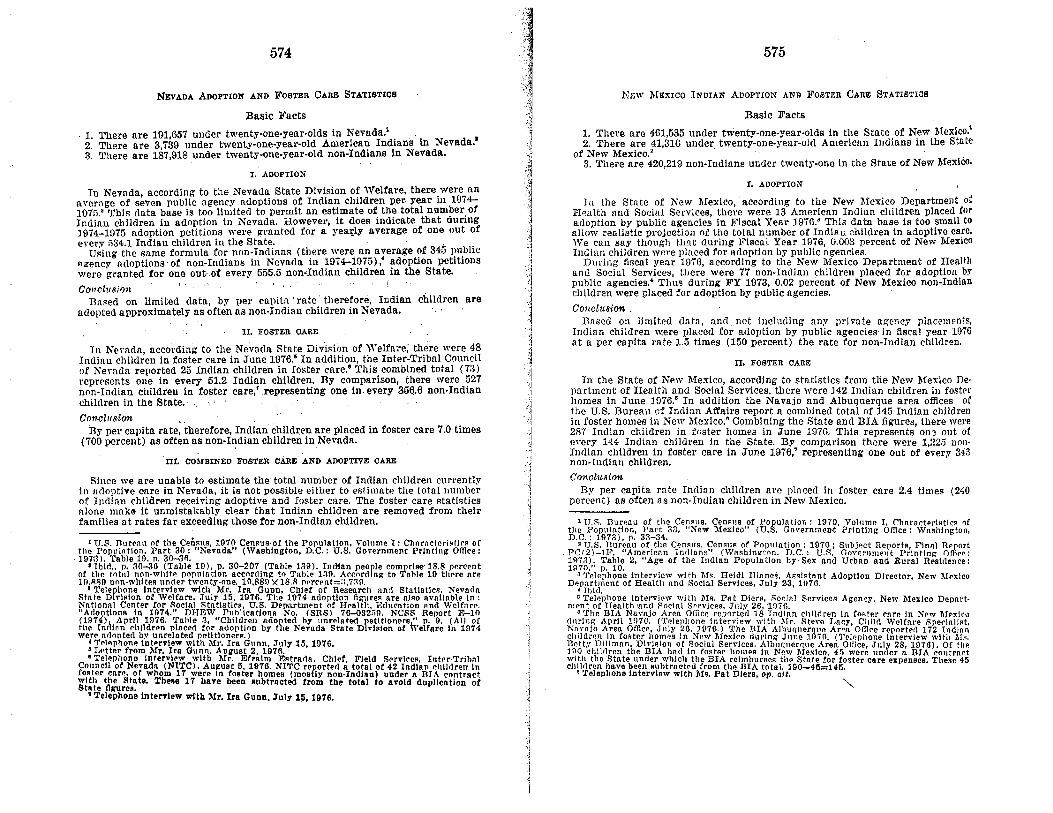
574
NEVADA ADOPTION AND FOSTER CARE STATISTIOS
Basic Facts
1. l'llere are 191,657 under twsnty-one-year-olds in Nevada.'. " I
2. Tllere are 3739 under twenty-one-rear-old American Indians in Nevada.3. There are 1!h,918 under twenty-one-year-old non-Indians in Nevada.
I. ADOPTION
In Nevada according to the Nevada State Division of Welfare, there were anaverage of s~ven public agency adoptions of .Indlan children per, year in 1974197ii.' This data base is too limited to permit an estimate of the total number ofIridiau children in adoption in Nevada. However, it does indicate that during] 974-1075 adoption petitions were granted for a yea~ly average of, one out ofevery :i34.1 Indian children in the State. ",
Using the same formula for non-Indians (there were an ayerage ~f345 pU.blicnzency ndopttona-or non-Indians in Nevada in 1974-1(75), adoption petltionswere granted for one-out-or every 555.5 non-Indian children in the State. '
ConclusionBased on limited data, by per capita' rate' therefore, Indian children are
adopted approximately as often as non-Indian children in Nevada.
II. FOSTER OARE
In Nevada, according to tile Nevada State Division of Welfare; there were 48Indian children in foster care in June 1976.' In addition, the Inter-Tribal Councilof Nevada reported 25 Indian children in foster care;' This combined total (73)represents one in every 51.2 Indian children. By comparison, there were 527non-Indian children in foster care,'representing one in every 356.6 non-Indianchildren in the State. ,; ,"
Concllls,ion " ,By per capita rate, therefore, Indian children are placed in foster care 7.0 times
(700 percent) as often as non-Indian children in Nevada.. ,
'III. OOMBINED FOSTER OARE AND ADOPTIVE OARE
Since we are unable to estimate the' total number of Indian children currentlyin ndoptive care in Nevada, it is not possible either to estimate the total numberof Indian children receiving adoptive and foster care. The foster care statlstlcsalone malt" it unmistakably clear that Indian children are removed from theirfamilies at rates far exceeding those for non-Indian children.
1 U.S. Bu ren u or the Census, 1070 Census-of the Population, Volume I: Chnrnctcristir. ofthe Populn tf on, Part SO: "Nevada" (WashIngton, D.C.: U.S. Government Printing Office:107;11. Table 19. n, So-3R.
• Ibid .. p. 30-36 (Table 10), p. 30-207 (Table 1S9). InlHan people comprise' 18.8 percentof tlie totul non-white nonulntlon accorrllnz to Tnble 1:l!1. Aceordln~ to Tnble 10 tliere arellJ.RSO non-whites under twenty-one, 10,880 X 18.R nrrcent==:1.7:l11.
• Telephone Interview with Mr. Ira Gunn, Chlet ot Research nnd Statistics. Nevn,lnStnte Division ot Welfare, July 15, 1076. The 1074 adoption th:ures are nJso nvntlnble In:Nntlonnl Center tor Roelnl Stntistics, U.S. Department of Health. Edurntion nnd Welfare."Aclootlons In 1974," DHEW Publteattons No. (SRSl 7G-OS2~1l. NCSS Report F~10(1074) April 1976. 'rahle 3, "Children adopted by unrelated petitioners," n, 9. (All ofthe Inrllnn children placed for adoptlon by the Nevada Stnte Dlvtston of Welfnre In 1974were ndoptecl by unrelated petl ttoners.)
• Tel"phone Interview wIth Mr. Ira Gunn. July 11i, 1976., Letter from Mr. Ira Gunn. August 2, 197(\.'Telephono IntervIew with Mr. Efrnlm F.strarlR, Chief. Field Srrvl~es. Inter·Tribnl
Councll ot Neva.dn (NITC), Aueuet 5, 1976. NITC reported a total of 42 Indlnn ehilnre" infORter enre, or whom 17 were In toster homoa (mostly non-IndIan) under II BIA contract'8:~~e w:u~~~te. These 17 bave been subtrneted trom tbe total to avoid duplication ot
• Telephone Interview with lrtr. Ira Gunn, July 11i, 1976.
575
!'Jr.w ME:XICO INDIAN ADOPTION AN9 FOEmeR CARE STATISTIOS
Basic Facts
1. There are 461,535 under twenty-one-year-olds in the State of New Mexico.'2. There are 41,316 under twenty-one-year-old American Indians in the State
of New Mexico.' ,3. There are 420,219 non-Indians under twenty-one in the State of New Mexico.
I. ADOPTION
In the State of New Mexico,"according to the New Mexico Department ofHeu ltli and Social Services, there were 13 American Indian children placed foradoption by public agencies in Fiscal Year 1976." This data base is too small toallow realistic projection of the total number of Indian children in adoptive care.We can say though that during F'Iscal Year HJ76, 0.003 percent of New MexicoIndian children were placed for adoption by public agencies.
During fiscal year 1976, according to the New Mexico Department of Healthand Social Services, there were 77 non-Indian children placed for adoption brpublic agencies.' Thus during FY 1973, 0.02 percent of New Mexico non-Indianchildren were placed for adoption by public agencies.
Concl118'ion .Based on limited data, and not including anv pr lvate agency placements,
Indian children were placed for adoption by public agencies' in fiscal year lfJ76at a per capita rate 1.5 times (150 percent) the rate for non-Indian children.
II. FOSTER CARE
In the State of New Mexico, according to statistlcs from the New Mexico Depnrtment of Health and Social Services, there were 142 Indian children in fosterhomes in June 1976.' In addition the Navajo and Albuquerque area offices ofthe U.S. Bureau of Indian Affairs report a comlJined total of 145 Indian childrenin foster homes in New Mexico.' Combining the State and BIA figures, there were2i'l7 Indian children in foster homes in June 197G. This represents ona out ofevery 144 Indian children in the State. By comparison there were 1,:!25 nonIndian children in foster care in June 1976,' representing one out of every 343non-Indian children.Conclusion.
By per capita rate Indian children are placed in foster care 2.4 times (240percent) as often as non-Indian children in New Mexico.
1 U.S. Bureau of the Census, Census of Populntion: 1970, Volume I, Chnrneter1Rtlcs ofthe Pcpulnrlon, Part 33, "Xew Mexico" (U.S. Governmen-t Printing Office: Wnshlngtou,D.C.: 1973), p.3R-34.
'U.S. nureau of the Census, CenRuR of Population: 1970; Subject Reports. Finnl Report. PC(2)_lII'. "Amertcrm Indta ns" (Wnsh lneron. D.C.: U.:-;. nO"~rnml"ut Pr ln t i njr OffiN":
11l7R). Table 2, "Age ot the Indian Population by Sex 'and Urban and Rural Realrlsnce :lA70," p, 10.
• Te.lephone Interview with MR. Heidi Hln nes. ASRIAtnnt Adoptlon Director, New ~!exlcoDepnr tment ot Henlth nnd Social Services, July 213, 11170.
• Tbid.• Telephone Interview with Ms. PRt Diers, Soelnl Services Agency, New Mexico Dcpnrt
men t of Health ilI.ncl Sncinl Sr-rvlces, July 26, 107f..• The BIA Navnjo ArM omce reported 18 Indlnn chlldren in fnRter cnre In New Mexico
clurlng AprH 1070. ('felephone Interview with Mr. Steve LIICY, CI,ilcl Wclfnre "perlnliRt.Nn vn.jo Area Office, ,July 2G, 197G.) The BIA Alhurjuernue Aren Office n'porterl 172 Iodinnchll dren In foster nornes In New MexIco durinA' J'u ne 107n. (~·~lephonl.' Illterview with "IA.Bett.v Dillman, Division 01 Socinl Ser....ices. Albuquerque Area Onlce, July 28, 1970), Of th,e100 chi lrIren tile BIA hncl In fORter homes In New Mexico. 45 were under n BIA contractwith the State uncler which the BrA relmhurRes the State for foster care expenses. These 45entlrl rnn have been subtrncted from the IlIA total. 190-411=14fi.
, Telephone Interview with Ms. Pat Diers, op. cit.',,-
576
III. COMBINED FOSTER CARE AND ADOPTIVE CARE
1 b r'ot Indian children currentlySince we are t1Jl.ab~e to esti~nte i~~ t~~~ ;~s~ib~e either to estimate the total
in adoptiye care III New Mexico, s tive and foster care. The foster carenuruber of Indian children re~eIYi~gtnd~~ do nave make it unmistakably clearstatistics alone, nnd the adophond fa a their famdies at rates disproportfonntethat Indian children are remove r~mto their percentage of the population.
577
J tr.s, BUWU OF INDIAN AFrAIRS BOARDING SCHOOLS' : ,
In addition to those Indian children in foster care or adoptive care, 7,428 Indianchildren in New Mexico are away from home and their families most of the yearattendiug boarding schools operated by the U.S. Bureau of Indian Affairs.· Anadditiouall,324 Indian children in New Mexico live in BIA-operuted doruutortesWhile attending public schools." '.fhese 'children properly belong In any computation of children separated from their families. Addiug the 8,702 Indian childrenin federal boarding schools or dormitories in New Mexico to those in foster careulone, there are a minimum (excluding adoptions) of 9,039 Indiun children separated from ,their families. This represents one in every 4.6 Indian childreu inNew Mexico.Conclusion
By per capita rate therefore Indian children are separated from their familiesto be placed in foster care or boarding schools 74.6 times (7,460 percent) moreoften than non-Indian children in New Mexico.
• Office of InclJan Education Programs, U.S. Bureau ot ·Indlan Affairs, "Fiscal Year1974 StatistIcs Concerning Indian Educa:tlon" (Ilawrence, Kansas: Haskell IndIan JuniorCollegoe: 1975). pp. 12-13.
• Ibid., pp.·~28.
578
'NE~ YORK A~O~IO~AND FOSTER CAB~;STATISTICS.. : '.,. -: ':":.'. . . .,,' -Basle Facts
-, ''''. . ". ld in the State of New York.!1. There are 6,726,515 under' twenty-on~-~~fJ"1m~rlcanIndians in the State of2. There are 10,627 under twenty-one-re .r . . . ". ,..
.New York," , ; . . 888" ~Indi~~s under twenty-one in the State of New York.3. There are 6,715, non
I. ADOPTION '
, th N wYork Board of Social Welfare,In the State of New York, according to e1 ~ion as of June 1976." This data
there were 12 Indian children placed ~ort.a( °gf the total number of Indian chillmse is too small to allow realistic p[~Jec~o~hat as of June 1976, 0.1 percent ofdren in adoptive care. We can say, ougu, tion . .New York Indian children w~re placed ~r ad~p;k State Board of Social Welfare,
As of March 1976, according to thed~w a~(lPtion in New York.' 'I'hns, ns of1.807 non-Indian children were placi dl or children were placed for adoption..March 1976, 0.030/0 of New-York non- n Ian .
,ConcZusion . . . n are laced for adoption at a per capitaBased on limited data, Indltan /hlld~:.India~ children ill New Yorl"rate 3.3 times (3300/0) the ra e or n
IX. FOSTER CARE
. N w York State Board of Social Welfare, thereAccording tostatr,stics f~om the (f mil ) boarding homes in JUlie 1976." Thill
'were 142 Indian children III foster ~an ~hildren in the State. By comnnrlsonrepresents one out of every 1ii~ .Indln foster (family) boarding hnmes iu Marchthere were 30,170 non-Indlatn ~ lyen2226 non-Indian children in the state,Hl76,' representing on~ ou 0 .ever, :.'
,aO;~l1~~~ncaPita 'rate therefore Indian childrh~nld.are 'pla~~~i~o~~ster homes 3,0O t) s often as non-Indian c I ren III ,
times (30 perce9n6 5: f th Indian children in foster (family) boarding homesAn estimated . yO a e 7
.are placed in non-Indian homes.
III. COMBINED FOSTER CARE AND ADOPTIVE CARE
.' t' t th total number of Indian children currentlySince we are u~ahle. to ;s Im!l ~ n~t ssible either to estimate the total num-
in adoptiv.e care III New 'Y.orik, It ~~ptiv~nd foster care. TlJe foster care statisticsber of Iridian children receiv ng a
t Po utatton : 1970 Volume I Characteristics ofL U. S. Burenu ot the Censuls, C1en~)~ 0 Yolk" (U.S: Government Printing Olllce: Wasb-the Popula tlon, Part 34, Sect on. ew
tncton, D.C.: 1973), p, ~4-75. t P I tton : lIHO; Subject Reports, Final Re~ort; U.S. Hurenu or the Cenius. ge'(WR Obi ~t~~ aD C'. ·U S Goverumerit Prtnttne Oflice :
PC(2)-lF, "American tIntell anIS dl n ~sOP~latlO~ by Sex a'o'd Urban and Rural Residence:J !17~). TnhJe 2, "Age. 0 ie n a
1970." p. 10. d tel' print-out trom Mr. Bernard S. Bernstein. Director, Bureau ot"Letter nn cornpn k St t B -d or soctat Welfare July 16, 1976,
,Chil,]ren's 'ScrYlccs, INew ~tohr 'I nJi rnona:d S BernsteIn New York State Board ot Social• ~relephone interv ew WI .I.l r, ernnrn js. J
"~ITFartet' .TlIl; 12~o~~7:ter prInt-out tram Mr. Bernard S, Bernstein, op. cit.,t. or a , Itl M B r arel I', Bernstein op Cit
·1"elcph~ne Inte,,';ew ~ 1 t r he n I te;,oJews trom' J'ui y 22-27, 1976 ....Ith Department'ThiR estllllllte Is bn.se on e ep one n EJ' NI lrarn anel O"onelsll''' cOllnties. 1lr>
.~r Socinl Services PeI?oJlnel 'iil~ra~a~~8;~~Ubl~~·cnr.aln toster (famll)') bonrdlnl: homeR
.ont of n totnl of ~351 n ln~nc t'hesee
four counties-and approximately 111 ot such place-III June 1076 WeIe p nee( 1 •.ments were In non-Indian homes. .
579
alone, and t.he adoption data we do have, make it unmi!ltakabl~ clear that Indianchildren are removed from their families at rates far exceedrng those for nonIurlian children.
NOTE. A report on the numbers of American Indinn children In adopt~on illNew York State would be incomplete without mentioning those Indian childrenplaced by the Indian Adoption Project, a cooperative eITect of the U.S, Bureauor Indian Affairs and the Child W(llfare League Of Armel'len:. Froln 1058-1967, thenine full years of operation by the Indian Adoption Project, 74 Indian children,mostly from Arizona and Sonth Dakota, weteplaced·for adoption in New York.'
N'EW YORK ApPEND'!:!!
Analysis of Upstate New York Countles With Greater Than 1,000 Total Indian. .. Po,pulatiou'
I. CATTA1RA'(j(JUB' COUNTY
In Cattaraugns COunty, acccrding to stattstles frOm the' NeW' York stl\t1!":f!()ardot 80cirrl \V€,lfare, there' were 23' Indian children In loste!:' (famll'y) bonrdlng'homes in June 1976,'" There ate 548 Indian children under tWenty-one yeats oldin Cattaraugus C6tmty.' Thus one' outor every 23.8 Indiil'nchlldren 1II'il1 a foster(family) boardinghome.' "Conclusion
In Cattaraugus County Indian children are in foster (famil.V') boardlng nomesat a per capita rate 0.4 times (940 percent) greater than the State-Wide rate fornon-Indlans in New York.
rr. EllIE CO'O'NTY •
In Erie County, according- to statistics from the New York State Doard of SocialWelfare, there were 53 Indian Children in foster (family) boarding homes inJune 1976.' There are 1,654 Indian children under twenty-one years old in ErieCounty.' 1'hu5 one auto! every 31.2 IndianChiidren"ill in It'foster (family)' board.ing home, . ' . , .,. ','Con.cllision
III ]~rle County Ill(]inn children are in foster (family) boarding homes at aper capita rate 7.1 times (710 percent) greater than the State-Wide rate fOJ: non,Indians in New York. .
m. FRANKLIN COtHI'!'''''·
III Franklin County, according to stlltistics J'r'lm tile New York' State Board ofSocinl Welfare. there were five Indian children in foster' (family) boarding homesin June 1976."There are 696 Indian children under twenty-one years old in Frank.lin ('ount;V.' Thus one out of every 139.2 Indian children i~ in a foster (family)bourrllng horne.
Conclusion
In Franklin County Indian chtldren are in fo~t~l' (fnmilY) boa.t1i'ng·hom,;s ata per capita rate 1.6 times (160 percent) the State-Wide rate for nOiJ.'Imliuus ill:NewYork.
_.' pavlrl FanRheJ. Par From. tti« ReRet'l.'ationl The rrltn8rrrclal Arloptlon of Amerlcrr"Inrl.an Ch,.ld,·e" (M~tuchen. N,J., The Senrecrnw PreB~. Inc.: 1~72) lit>' ll4>-35 TheT.r.
d ill l1 Adoption Proj(Lct pln ced n. total of 30:) Amprleon IcrHnn chl1dre;~ i'or adoption In
26 sNlIeR nnrl Puerto Hleo, Yirtually always witb non,Inelinn fnml!le".II'! Lp.ttpr Jlnd C0mrHitpr nrint-out from :\Cr. J1ernard R. Bern~te1n, Dii.'"~r:tor, nUt-can of
Cl~llr~l',;n" Scrvlce~. Ne.!", York Stnte nosr,] of Soc!n.l Welfare, ,Tilly 1G. J 076..14',1.')';1,) o{ tllf- ::\pr·..· lO~'k lnc11/l11 POj)UllltJon fA nndp'l' twenty-one :"~~llr~ olrl, [U.~. Hurran
or tllr. Cpnsl1S, CrmstHI. or ,~){}nlll:lt.lon: In70: '~IJbj{'ct UeIloL't ,PC(2)-lF', "Am~r!r.an Tn(Hnn::;a(\Vn:;1hln~ton. ~,C'.: U.K Siovel'nlilent Printing- O.ffic:e: '107;Q), Tnhle 2
1"A¥.e ;)f the Iilflii:n
POplIlatlon h;V >lc>:< nn.l Urhan nnd RlIrnl ReRidenee: 1Il70," P. 10. j The toi'nl In'Hnllp
n1'1I.ls110nof CllttnrnllA'lIg ('ollnl'y l~ l,lll8. [TT.~; BIIl'rau or th€ COlleU". CCIlRlIB of Popnln
tlo!'. 1.D70 SUllP)e~lontnr)' Rf'jJort I'C(Sl)-104. Race or tile I'opnl'Rtion bv COllnt)': 1970"
(Wnshlnl;toll D.C.. V.fl. Go"ernm,~nt Prillting On,ee: 11175); ,p.32<1 1.H1RX.41l1:="48; The~~:p~ ~~~'ni·~;~ ~~~~t;~~~etermin. Ihe Indian under twentY-one year old popUlation In the
8 :"orr. np.rn~rr(] S. i31'!rn~tpjn, qp. cU.'''Race of the POpu!l\i!onby County: 1970," op. ctf., p. 32.
580 581
.",.,1. ,"NORTH DAKOTA ADOPTION AND Foam CABE STATISTI08'
Basic Facti!
; 1. There are 261,998 under twenty-oneyear {lIds in the St.nte (If North Dlllmtn.'2. ~'here are 8,186 under twenty-one-year-old American Indians in the State
ot North Dakota" '3. There are 253,812 non-Indians under twenty-one in the State ot North
Dakota.'I. ADOPTION
In the State of North Dakota, aecordlng to the Social Service Board of NorthDakota, there were 16 Indian children placed for adoption In 1975" Uslng.St~te. /ftmirea reported to the National Center for Social Statistics of the U.S. Department of Health, Education and Welfu'e,' we can estimate that 86 percent (or 14)are under one yoor of age when placed. One child 1s between one and two years-old : and one child is between two and siX years old." Using the tormule. theJlthat: 14 Indian children are placed in adoption for at least:t7 years, one Indianchild is placed in adoption tor 16.5 yeara, and one Indian child is placed In.adoptlon tor 14 years; there are an estimated 269 Indian children in adoptionin North Dakota.. This represents one out of every 30.4' Indian children in the~~ .. .
Using the same- formula for non-Indians (there were.178non;Indian childrenplaeed for adoption in, Korth Dakota in 1975) " there are an estimated 2,943under twenty-one-year-old non-Indians in adoption in North Dakota. This represents one out of every 86.2 non-Indian children in the State.(JlJncllt"ion
There are, therefore, by proportion 2.8 times (280 percent) as 'many Indian-chtldren as non-Indian children in adoptive homes in North Dakota :'75 percentof the ,Indian children placed for adoption in ~975 were placed ,in"'llon-Indlanhomes, . .. ..... ; '... . , ..
II. FOSTER O.~RE
In the State of North Dakota, according to the Social Services Board of NorthDalwta, there were 218 Indian children in fostei" care in May 1976." This represeuts one out of e,ery 37.6 Indian children in the State. In addition, there were78 North Dakota Indian children :cecelving foster care from the U.S. Bureau of
:1; .i ~ .
IV. MONROE COUNTY
. I f the New York state Board ofIn Monro~ County, according to st~~ISt ~tll~Or~nin foster (fumlly) boarding
:.social Welfare, t~ere ,were fou~2~nIl~~~an children under twenty-one years oldhomes in June 10/6." 'Ihere are f . 130 Indian elrlldren Is in a foster (fam-in Monroe County.· Thus one out 0 ,~,elY .' .. , " \ ~., ,'''.:i1y) boarding home> .:, .':., I" ;,'
·Conc!u.sion > ." . i foster (familY) boarding homes at aIn Monroe County Indian children ag t~l e State-wide rate for non-Indians in
per capita rate'l.7 times '(170 pe~cen 1 . 1\: ,.,', .; ,'.
~ew York.· ..... ' I ," ·'v. 'NIAGARA COUNTY ." .. '!
,'; .' . .. . . . I .: tti~tic~ f~o~ the N~~Y~~k State Board ofIn Niagara County, accor~~g ~f s nh'ldren In foster (family) boarding homes
Social Welfare, there w~r~ 1 n. an c .1 dren under twenty-one. years old in ~iain .Tune 1976.". There ale 1~9flndlalyl ~~I~ Indian children Is In aroster (family)gura County.· Thus one .ou. 0 ever . . .boarding hO~e.' I .,: I. ,
·Conc,!1tai01i '" ~ . ': .... '.:' .'." f r "(family) boarding homes at aIn Niagara County Indla
3n60clllidrent a)rger~~t~rSi~an the State-wide rate for non-per capita- rate 3.6 times '(percen . ' .. .ludlans in Ne~.1;0rk. . . ':, ·VI. ~NONDAGA COUNtt .' '.
. . ," .. . . . . t t tl tics from the New, York State BoardIn O.nondaga County, aCCO~d1D~ I~Ji:nl~ildren in foster (familY) hoarding
of SocI~1 Welfare, Ifere were 2942.Indian children under twenty-one years oldhomes In,June·l97~..•There are t of every 349 Indian children Is in a fosterill Onondaga.C?unty, ,Thus.one. ou '. ,. . .... ': ',', ~(family) boarding home. .' ".
·Conc!'usion .. ; , .;. : I;' ,'y' . t (family) boarding homesIn Onondaga CountY4Int~ian c(~grpe~r::~t;ng~~~t~~ than the State.wide rate
.at-a per capIta. ra~e 6. imes .for non-Indians in New .york,' .', .' '..,- " . ',.' '.~ , ,- ,~l'·· I'; r .
• Mr Bernard S. BernsteIn, 0". cit. -0" It P 83• "R~ce of the Populatlon by County: 10, , 0". e .,' •
1 U.S. Bureau of the Censue. Ceneus of Population: 1970, Volume I. CharacterIstics of.'"the Population, .Part. 36, "North Dakota" (U.S. Government Printing Office: WashIngton,D.C.: 1973) •.p. 86-R8.
• U.S. Bureau ot ,the Ceneus, Censue of Population: 1070; Subject Reporte, Fln'll.1 Renort'PC(2)-lF, "Amertcan Indians" (W....hln~ton. D.C. ~ U.S. Government Prlntlnl!' Office:197.1). Taole 2, "Age ot the Indian PopulatIon by sex and Ul'ban and R1nral Resldencs:1070." n, 12.
• Telephone lnt~p'jew with Mr. Donnld Rchmld, Admlnlst~ntor, Child Welfare Serv!cee,f'toC'in.1 Services Board of North Dahotn, -Tilly '21. 1976, These children were placed by"three prlvate agencies that do virtually all the adoptions In North Dakota, The SocialBerv!C'eR Board rarely, If ever, hnndles ndoptlonR.
• National Center tor Roclnl RtatletlcR, U.S. Department ot Health, Edllcatlon andWelfare, "Adoptions In 1974." DHEW .Publlcatlon No. (SRS) 76-032~9, NCSS ReportF.-I0 (1974), April 1976, Table 10, "Children adopted by unrelated petltloners by ag-e at"tIme of placement. by State, 1974.' p. 16. (Absolute numbers converted Into percentagesfor nurposes of thIs report.)
• ~ % of the children are between six and twe.lve YOllrs old: and 1 % are twelve or older.( fbid.). The median age tor children placed In adoption In North Dakota was two months.Ibid.. p. 15.
• Telephone Interview With Mr. Donald Schmid, op. olt. (See footnote 3.)7 ",1,T.• Ibid.
583
I' : I . f: 1.' I :". r JI' c:'. ~~ .OKLA.KOMA INDIAN. ADOPTION AND FOSTES bABE STATISTIOS
:.,'.') ......, .: "Basic Facts '. ",.,. ':: " .. !
. 1. There are 974,937 under twentv-one-year-olds in the: State of Oklahoma,.lI2. There are 45;489 runder. twenty-one-year·oldAmerican· Indians .in the State'
of, Oklahoma.", -: . ,', J' ",.; ; ,J! "", " ' ' .... ', '..!
, 3. There are 929,448 non-Indiana under twenty-one in the State of Oklahoma," I
I. ADOPTION"!! li""1 •. '. '," 'j-
\, In the State of Oklahoma, according to the Oklahoma Public Welfare Commission, there:were('i9 Indian children placed in adoptive homes in 1~72.· Usingfederal age-at-adoption figures,'.83 percent (or 57) .are under one year ,of agewhen placed. Another 13 percent (or nine) are one year to less than six yearsold when; placed ; 3, percent (or, two) are six years, but less than twelve yearsold when piaced ;.,and' 1 percent' (01' I ) are twelve years of age, and older,' Usingthe formula then that: 571ndiau children per year are placed in adoption for: atleast 17 years, nine Indianc;b.ildren are placed in adoption for a mlmmum average of 14 years, two' Jndlauehildren are placed in, adoption for, an average of.nine years, and one Indian child,is placed fOl' adoption for an-average of threeyears; there are an estimated 1,116 Indian children in adoption in Oklahoma.This represents one out of every 40.8 Indian children in the State.
Using the same formula for non-Indians (there were 817 non-Indian childrenplaced in adoptive homes in 1072) ,. there are an estimated 5,144 under twentyone year old non-Indians in adoption in Oklahoma. This represents one out ofevery 180.7 non-Indian. children in the State.Oonolusion
There are therefore by proportion 4.4 times (440 percent) as many Indian,children as non-Indian children in adoptive homes in Oklahoma.
582
• bi ed t tal of 296 Indian. children In fogt~l"Indian Affairs In May 1076. The com n °hildren In the State. By comparisoncare represents one .?udtiof e~h~ridYr27en';J~~;~r ccare in May 1976,'° representing onethere were 4::;1) non-m an c Iout of every 551.8 non-Indian children.
Oonclusion t) ny Indian~'here are therefore by proportion 20.1 times (2,010 peDce~t as rna
children as non-Indian children in foster care in North a a.
m, COMBIl'lEIl ADOPTIVE CARE' AND FOSTER OAllE
, ' . f 56- der twenty-one-year-old Xrllllan, Using the' 'a.bove' figures, a total 0 o ~n homes in the State of Northchildren I are either' in foster hOfe~ ~~e~~O~~l~eIndian children. Siml.larly forDalwta. This represents ~n:9~u ~e twenty~ne year 'olds are elther in fo'stpl'non-Indians in the State', Itlin ~ne out of every 74.7 non-Indian children.care or adoptive care, represen ng ,
Conclusion • • didBy per capita 'ratefIntdian..aCrhell~rinti~:~re(~~;e:e;:~)th~~:O~:e~llfhaE ~~~.
in adoptive care or oser.. !J.
Indian children in the State 'of North Dakota.
-~~In~ervJ.e~8 ~lt~'Mr. Roger Lonnev!l, and l'.l~e~eoMZ ¥:?vg'2~2i~I~~7~~Social ~erVlcdee1'14u'N'S' BtlnrDe~nUkoOt! I~~:::' th~t'J~:n~~~~:r:r care In 1IIa'y Hlt6.
thAa of A,!'!ll
The 'BlA ba' or 1 ~ t tl tI BIA Indlcatea that e numoer»1976 (the last month ior lwhtlCh thme nBtIbAt~l~o~fb) a 3~sr';;d1an children 'Were In foMer care-do not fluctuate significant s . rom 0 , -36-78.' .adn.inletered by the State. but paid tor by the BIA. 114 oU. - ,
.. Telephone interview 'With .Mr. Donald Schmid, op. ' ,.' • J
rr, FOSTER OARE
In the State of Oklahoma, according, to the Oklahoma Public Welfare Commission, there were 385 Indian children in State-administered foster care in,August 1972.· In addition, there were two Oklahoma Indian children receivingfoster care from the U.S. Bureau of Indian Affairs in 1972: The combined total'of 887 Indian children in foster care represents one out of every 135 Indianchi1dren in the State. By comparison there were 1,757 non-Indian children in,foster care," representing one out of every 529 non-Indian children.
1 U,S. Bureau of the Cen,."s, Census of Population: 1970. Volume I, Characteristics orth .. PnnnlotJon. Part 88. "Oklahoma" (U.S. Government Printing 'Office: Washington, D.C.:1978). p, 38-48.
• U.S. Burenu of the Census, Census of Population: 1970; Subject Repo~ts, Final RenortPC(2)-IF. "American Indians" (Wnshinaton. D.C.: U.S. Governrment Printing Omce:1973). Table 2, "Age of the Indian Population by Sex and Urban and Rural Residence:1970," p. 12.
• Letter from L. E. Riarler, Director of Instttutlons, Social and Rebabllltatlve Services"Oklnhoma Publlc Welfnre Commission. May 2, 1974.
'National Cent..r tor 'Social RtntlstlCR, U.IS. Department of Henlth. E!luclltlon and Welfare, "Adoptions In 1971." DI-TEW Publtcn.tlon No, (SRS) 7'3-03259 NCSI'> Report F~ln'(1971), May 2.3, 197R Tnhle 6, "Chllilren ad opted by unrelnt.ed netltlOllers: Percentagedlstrlhutlon by a~e I1t time of placement. by type or placement 1971,f
• Letter from L. E. Rader, op. cit. • •• run.7 DIvision of Socinl Services, U.S. Burenu of InrHnn AffaIrs. "Fiscal year 1972--Chlld'
Wolfnre-Undnpllcate!! CnRe connt [h:v I'>tntes]" (Tnble).• N/f,tlonal Center for Social StatiRtlcs, U,S. Department of Health. Educatlnn and Wel
tnre, Children Served b.v Public Welfare AJ!"enc!es and Voluntarv Chlld Welfnre AJ!"encles'and Institutions Marcb 1071." DHEW Publlcation No. (SRS) '73-08258' NCSS Report'E-9 (March 1971), April 27, 1973, Tabls 8. '
584
,:'.-l
585
.OIlEGON .ADOPTION AND ·FOSTER ,CARE,. STATISTIOS'
Basic ,Facts,
'1. There are 807,211 under, twenty-one year olds in the State of Oregon.'2. There are 6;839 under 'twenrr-one-year-old American Indians in the state
of Oregon."3. There are 800;372 non-Indians under twenty-one in ,the .State of Oregon.
J '" I.' .ADOPTION
In the State of Oregon, aecordiug' to the Oregon CWldren's Services 'Dlvlslon,there were 26 American Indian children placed in adoptive homes during fiscalyear 1975.' Using the State's own figures reported to the National Center forSocial Statistics of the U.S. Department of Health, Education and Welfare"61 percent (or 16) were under one year of age when placed. Another 8 percent(or two) were between one and two years old; 17 percent (or five) were between two and six years old; .and 12 percent (or three) were between six andtwelve years old." Using the formula then that: 16 Indian children are placedin adoption for at least 17 years, two Indian children are placed in adoptionfor an average of 16.5 years, ilve Indian children are placed in adoption for anaverage of 14 years, and three are placed in adoption for an average of niueyears; there are 402 Indian children under twenty-one years old in adoption atIlny one time in the State of Oregon. This represents one out of every 17Indian children in the State.
Using the same formula for non-Indians (2,742 non-Indian children wereplaced in adoptive homes during Fiscal Year 1975)." there are 41,716 non-Indianchildren in adoption at anyone time in the 'State of Oregon. This representsone out of every 19.2 non-Indian children in the State.OoncZUBi.on
There are therefore by proportion 1.1 times (110 percent) as many Indianchildren as non-Indian children in adoption in Oregon.
II. FOSTER OARE
According to statistics from the Oregon Children's Services Division, therewere 247 Indian children in fORter care as of June 1976: This represents, oneout of every 27.7 Indian children in the State. By comparison there were 3,502non-Indian children in foster care as of April 1976," representing one out of every228.5 non-Indian children in the State.OoncZuaion
By rate therefore Indian children are placed in foster homes 8.2 times (820percent) more often than non-Indian. children in the State of Oregon.
1 U:8. Bureau ot the Census, Census ot Popnlntfon t 1070. Volume r, Chnrncterlstics otthe Population. Part 89, "Oregon" (U.S. Government Printing Office: Washington, D.C.:1973), p. 39-47.
• U.S. Bureau ot the Census, Census of Population: 1070; Su'bject Reports, Final ReDortPC(2)-lF, "American IndIans" (Washington, D.C.: U.S. Government Printing Office:1973). Table 2, "Age ot the In<lian Population by 'Sex and Urban and Rural Residence ~1970," p. 111.
• AAIA chlld-weltare survey questionnaire completed by Mr. George Boyles, Manager,Research and Statistics, Oregon Children's Ser"lces Division, July 16, 1976.
• NatIonal Center tor SocIal Statistics. U.S. Department or Health, EducatIon and WeItare. "AdoptIons In 1974.," DHEW Publloatlon No. rsns) 76-0:321;0, NCS'S Report E-1O(1074), April 1976. Table 10, "Children adopted by unrelated' petItloners by A.ge at timeot nlncement, by State, 1974/' p. 16. (AbSOlute numbers con'l'erted Into percentages forpurposes ot this report.)
"2% ot the children were twelve years otage or older. The median age at time ot plneement of children adopted by unrelated petitioners In 1974 In Oregon was 13.9 months. Ibid.
: ?b~~~tlonnaire completed by Mr. George Boyles, op. ott.'IM~ ,
: .• ,'t, .'" ,',"
586
m. COllBINED FOSTEB OABII: AND ADOPTIVE CABIIl
, Using the 'above figures, a total of 649 Indian children tire' either In fosterhomes or in adoptive homes In the State of Oregon. This 'represents one in every,10.5 Indian children. Similarly, tor non-Indians in the State, 45,218 nndertwenty-one year olds are either in foster care or adoptive care, representing onein every 17.7 lJoon-IlI.dian children.Conclu8ion"" ',' '~ ,
By rate therefore Indian chlldren are removed from their homes and placedin adoptive care or foster care 1.7 times (170 percent) as often as non-Indianchlldren in Oregon. The similarity in adoption rates in Oregon dominat~ thecombined rates given above, and leads to a combined rate, of Indial;l childrenremoved from their families that is-in comparison to other States w1thsigniflcant Indian populations-relatively low. This may be deceptive. It is li~elYthat the vast majority of Indian adoptions reported by the Children's SerVlcesDivision involve children adopted by unrelated petitioners. This report comparesthat figure with the total number of related and un:related adoptions in Oregon.Of that total, 72 percent 'involve children adopted, by related petitioners.' Werethe adoption eomparisoa to be made only on the basis of unrelated adoptions,the comparative rate for Indian adoptions and the combined rate for adoptiveand foster care, would be several times higher than indicated here. '
OREGON: APPElVDIX
County-by-County Analysis of Oregon Foster ,Care Statistics
I. BAKEB COUNTY
In Baker COlmty according to statistics, from the Oregon Children's ServicesDivision there was' one Indian child in foster care in January 1975." There are16 IndiR~ children under twenty-one years old in Baker County'." Thus one out of16 Indian children Is in foster care.Concll18ion. '
In Baker county Indian children are in foster care at a per capita rate 14.3 times(1,430 percent) greater than the State-wide rate for non-Indians in Oregon.
n. BENTON COUNTY
In Benton County, according to statistics from the Oregon Children's ServIcesDivision, there were two Indian children in foster care in January 1975.· There,are 75 Indian childrell. under twenty-one years old in Benton County.t Thus oneout ot every 38'Indian children is in foster care.ConclltBion
In Benton County Indian children are in foster care at a per eaplta rate 6.0time!l·(lOO: percent) greater than the State-wille rate for non-Indians in Oregon.,
:, I: 'trx.. 'CLACxAMAS .,COUNT'!'
In Clackamas County, according to statistics from the Oregon Children's,Services Division, there were seven Indian children in foster care in January1975.· There are 304 Indian children under twenty-one years old in Clackamas<Jounty.f
Thus one out ot every 43.4 Indian children is in foster care.
, "Adnptlonl' ,in 1974." op. cit. Table 1; "Children tor WhOM' adoption' petitions weregrante(l," p. 7. .. , ' ", "AAIA chil<l-welfare survey qupatlnnnolre complcte<t by Mr. Geor!!e :R~)I1es. Manager
ot Research anll StatlstlcB. Orezon Children's Services DIvIsIon, 'July HI. 197~.• ~1.8% nf the 0rel!on IndIan population 10 under twenty-one year. old. [U.S. Bureau
(If the Census, Census ot P0-.pulatlon: 19'1:0 : Subject Report PC(2)-lF. "AmericanIn(l1nna" (Wnshln!!ton, n.c.: U.R Government Prlntln/: Office: 1973). Table 2. "Al!'e ofthe Indian Pnpu]"t!on by Sex n.nd Urban and Rurnl Residence: 1970," p.. 13, I The totalTndlan !'opulaUnn ot Bnker County- Is 31. fU.S. Burelln of the Cenous, Censns ot theT'opulatlnn: "1970 'Supplementary Reoort PC(Sl)-104.· "Race of the' Ponullltlon by"nunty:" 1970 ,tWnshlnl!ton. D.C.: U,!'!.· Government Prlntlnl\' Office: 1975), p. 38.]~1 x .1118= 1~. Tbe same formUla Is used to determIne the IndIan nnder twenty-one yearold population In the other Orel!on counties.
°AAIA Queatlonnolre. 011. elf.tRace of the PoPulatIon by 'County: op. cit. 1970: 61 7•.
587
Oonctusiow : ';:.'.') ::'(.' ':.~, '.J 1,j'- '\ : ,,; "") :t.i.' ,:,: I ,':'; 1.~ I .~.'
5 In. Olaekamas C(;mn,tY"Indian, children are in foster .care at a per .eaplta- rate.d~e t~n.ef:l: (53:0 .p~r~ept) :,g1=~~~!lr .tjl,an thl\ ,staj;e~"'ide, .rate. fo~jnon-IndianSlDl'''I~\ ..p .': ';i· ."'J;',', '~r: l r: ~,r :'.', :l", I . ".• :'.~ _r ,i,,~j~: .'l' ,1:"-, 1'1~J\" I ,'til
"'ll", -.\ .i.~li: 'oJ',-: ,! .~",!.:' I.';:j,~ h~V·~.P~180F~:·COVry·T'r-. ::, .,,,., : fo' : ,',' I
.II?- Clatsop County, according to statistics from"the';Oregoti'bhtldt'e;l's ServicesDlvtslon, there ~ere four Indian children in foster care in January 1975.·' There ,are 64 Indian .chlldren ,undertwenty·one years old.In Clatsop.County.t ,Thus oneo,ut of eveq ~6 fnqian children is In-roster care, "!'":''' 'I'., ,,: !.
eon-elusion :'1 ~, ":1. {1~!" ~.~ ,'j i ': ,·i " , I :l:-~ l " .,~ (\ I'; (' ,Or'
J.In Clatsop 'County' India'n' ~hil(lreri are 'iJdoster care at a per capita fate 14.3 'times 0",430 p.~rce~t) g,re~te~ th,ay)' the ~~ate-widerate f6r:n,on-Indi!',n~!in,Oregon~
.. ) ":' 'f' V.OOiUMDU"COUNn:' ,," \'. . . , I . I' '.
,.I~ Cclumbia County, aceordmg to statistics from the Oregon Children's Servi~es!Dlv1sl~n, th~re was 'one Indian child in foster care in January 1975.~ There are'46 Indla~ ch1ld:en un~e~ twenty-one years 01<1 In Columbia Oounty.j' Thus 'one out'of 46 Iridian cnildren 1S III foster care. . , . ,, ,00l1clu.siott' ,i,- 'I '/ 1~1.1: fi. j' ..... ;. I " '
In ,Columbia County Indian children' are in foster care at a per capita rate~~ei~~:es (~OO percent) greater than the State-Wide rate for n~n-I\lldians in
VI. coos COUNTY.
D.IIl .Coos .County, accordin.g to statistics from' the Oregon Children's Services1vlslOf;l. the~e was one Indian child in foster care in Janullry 1973.~'Thereare
1~8 Indian chIldren under twenty-one s'ears old in Coos County. t ,." .
VII. CROOK COUNTY ,, '
In ~rook County, aecordingt« statistics from the. Oregon Children's' Services'DivislOn, the~e were no Indian children in foster care in January' 1975.'" Thereare 47 Indian children under twenty-one years old In CrookCounty.t'., " I " I
..nIi:·cUlmY' COUNTY
n:n;".Cu·rry,Co.unty: ,accordirig to statistics' from the '6regoii.Chlldreri;~Ser~i{'es.1 V1Sl(lD.~bere ,were' no Ind~an children' in 'foster care in Januad 1975.•, Th~i'e ~
are 93 Ind1an' children under twenty-one Y/lars old in (Jurry (Jounty.t" i ,. ", ". 1.' ...1' l o!, 1,'
IX. DESOHUTES COUNTY
nlIn pescbut'es'County; according to staIsticsfrom the OregOn'Childreii's ServicesiVlslOn, t~ere were four Indian children in foster care in January 1975.• There'
are 48 Indian children under twenty:one years old in Deschutes Oounty.] Thusone out of every 12 Indian children is in foster care.Ooncllts'ion . , ~
"r~ Deschutes, County Indian 'cl;ilclren are 'in foster Care at a per capita rateb~~g~~~es (1,900 percent) greater than the State-Wide rate for non.Indlan~,;~?,
. "x. ;OUGLAS' COUNTY
i' In'~ol11Ias County, aCCOrding- to 'statlsti~,) frornthe'Oregon: Ohik>,>n'" SE'r"r:t~s IVs on,thel:~ wer~ no Indlan children in foster care .in January 1976.'"'. ere are, 214 .Indian chlldrsn under. twenty-one years, in Douglas CountY.f' '"
xr. GxLLIAM courlTY
l' In' G;i1)iam County, 'according' to' statl~tlcs from the ,Or('~on Chlldren's Ser;'~ces DIVIsion, there wel'~ ITO Indian chj]dr~n in foster ca~e in JnTIua;y :1975,'"~~ere ar~ve, ~,ndian, ch\I~J:'eIl under. t~\!nty·.oneiyel\:r;8 old. In 1J1llillm County.t~
°AAIA Q1Je8t1onnlllre, 011. cit. ' , ,: ,"tRace of the PopUlation by 'C<i\trtt:rfop: eft, 1970: 6, T.; ,i .. ' :""" ,,'. ,,'
588
XII. GRANT COUNTY
In Grant County, according, to statistics from the Oregon Children's ServicesDivision,. there were no Indian children in foster care in January 1975.- There,are 15 Indi~n' children under twenty-one years old in· Grant County.t
xrn, HARNEY COUNTY
In Harney County, according to statistics from the Oregon Children's ServicesDivision, there were five. Indian children in foster care in January 1975.- There'are 66 Indian children under twenty-one years old in Harney Countz.t Thusone out of every 13 Indian children is in foster care. '
.conclusion. , .In Harney County Indian. children are in foster care at II per capita rate 17,6
times (1,760 percent) greater tban the State·wide rate for non-Indlans in Oregon.
XIV. HOOD BIVER COUNTY
In Hood River County, according to statistics from the Oregon Children'sServices Division, there were no Indian chlldren in foster care in .Ianuary 1975.~There are 58 Indian children under twenty-one years old in Hood River Oounty.j
xs. 'JACKSON COUNTY
In Jackson County, acccrding to statistics from the Oregon Chil<1re~l's Servo'ices Division, 'there was one Indian child in foster care in January 1975.· Thereare 224 Indian children under twenty-one years old in Jackson County.j Thusone out of 224 Indian children is ill foster care.
Ccnclusion.In ,Tacl<son County Indian children are in foster care at a per capita. rute
jrlelltical to the State-wide rate for non-Indians in Oregon.
XVI. JEFFERSON COUNTY
In Jefferson County, accordlng to stntlstics from the Oregon Children's Sen-,ices Division, there were 21 Indian children in foster care in January 1975,*There are 686 Indian children under twenty-one years old in Jefferson County.]Thus one out of every 33 Indian children is in foster care,
·ConelusionIII Jefferson County Indian children are in foster care at a per capita rate
fI.fl, times (690 .percentj greater than the State-wide rate for non-Indians in'Oregon.
XVII, JOSEPHINE COUNTY
In Josephine County, according to statistics from the Oregon Children's ServIces Division, there were no Indian children in foster care in January 1975.*There are 122 Indian children under twenty-one years old In Josephine County. t
XVIIr, KLAMATH COUNTY
In Klamath County, according t.o stntlatles from the Oregon Clrlldrr-u's Services Division, there are ::l2 Indian children in foster care in January 1975,*There are 736 Indinn children under twenty-one years old in Klamath County. t'I'hus one out of every 23 Indian children is in foster care.
CO/lclusionIn Klamath County Indinn children are in roster care at a per capita rate
~,9 times (990%) greater than the State-wide rate lor non-Indians in Oregon.
XIX. LAKE COUNTY
In Lake Connt.y, according to statistics from the Oregon Children's ~eT\"i('t'R
Divlsion, there were no Indian children in foster care in January 1975,· Therea re 3u India.n children under twenty-one years old in Lake County.]
tnnr~ or the Ponuln tlon hy County: 1970, on. cit.• AAIA Questionnaire, Oll. cIt.
589
XX.· LANE COUNTY'
In ,Lane County, according to statistics from the Oregon Children's ServicesDlviston, th~re were three Indian children in foster care in January 1975.* There'are 300 Iudian chlldr~nunder twenty-one years old in Lane County.t Thus one:out of every 132 Jndian children is in foster care.Oonotueton. "
In Lane' County Indian chlldren are .iii foster care at a 'per capita' r,~te 1.'7,times (170%) the State-Wide rate fOl; non-Indians in Oregon,. .~ . .... '..
XXI.: LINCOLN COUN'!'Y
In Y;,iJ:;tc,oln County, according, to statistics from the Oregon Chlldren's Serv-'ices D~VtS10n, ther~ was one Indian child in toster care in January 1975.* Thereare 160 Indian children under twenty-one years old in Lincoln County.t Thusone out of 165 Indian children is in foster care.Oonclusion
In Lincoln County, Indian chil?ren are In foster care at a' per capita rate ]..4times (140 percent) the State-wide rate for non-rndtans in Oregon." '
::UII. LINN COUNTY.
,II;' !,inn County, according to statistics from the Oregon Children's ServicesDIVIS10~, ther~ Was one Indian child in foster care in January 1975.- There are.1~8 Indtan"clllldr~nunder ~wenty-one years old in Linn Oounty.j Thus one outof 148 Inman children is In foster care. . .' . .Oonclusion.
In Linn County Indian children nre in foster care at a per capita rate 1.5'times (150%) the State-Wide rate for non-Indians in Oregon,'
XXIII. MALHEUB COUNTY
In ~~a,l~eur County, according to statistics from the Oregon Children's Services Dlv~Slon, the~e wer,e no Indian children tnfoster care in January·1975.*.There ate 43 Indian children under tweutr-ons years Old in Malheui' County.t
XXIV; 'MABION COUNTY
In Mllrion County, according to statistics from the Oregon Children's Services Division, there were.20 Indian children in foster care in January 1975.*?-:here are 429 Indian children. under twenty-ons years old in Marion Oountz.fIhus one out of every 21 Indian children is in foster care, .Conclusion ' ,. . , ,
In Marion County Indian children are in foster care at apet capita rate 10.9times (1,090%) greater than the State-wide ratero» .non-Indiaua in Oregon. .
xxv, MORROW COUNTY
In ~!?,r~ow County, according. ~o stat,istlcB from the Oregon Children's SerY.ic~s Dl\JSlOn, the~e wer~ no Indian chtldren in laster care in January 1975."~nere are 15 Indian children unoer twenty-one ~'ears old in Morrow County. f
XXVI. POLK COUNTY
.r~ ,Poll\ County, accord ill?, to ~~lltistics from the Oregon Children's ServicesD~vIslon, th~re were no Indian children in foster care in January 1975.* Ther{!ale 143 Iridian children under twenty-one-years old in Polk Oountr.]
XXVII. SHERMAN COUNTY
i In R,h~r~nn COl~ntY, according .to statisticR from the Oregon ChildrE':J's Serv;p.s Division, there were no Inchan children in foster care in Januar'" 197"'
here are 12 Indian children under twenty-one years old i~ Sh~rman Count;: t• IAT,I Q,,""tfrmnnlre, "p, cit,tRace ot the Population by County: 1970, 01/, cit.
590 591
"'1·"r"
XXXVI. MUL·.rNO~{AH COUNTY
In. Ml,lltJI0~lih,County, according' to stntistlcs from the Oregon Clllldren'Jl.Sel'vIces :Oi~iBion, there were 88 Indian children in foster care In January 1975.- 'There a~e 1,385 Indian children in Multnomah County. t Thus one out of every36.4 Indian children is In foster care.' , "" ',."Conclusion ' ,
, In: Multnomah c,ounti Indianchild'ren are in fostercaraat a per capita rate6.3 times (630 percent) the State-wide rate for non-Indians In Oregon. '
• AAIA Questlcmnalre, op. cit. ',' '".'tRaceo(~be P~pul,atlon by Co~nty, ,:,1970, op. cit.
'I ,;. l r , • 1 " ' • I ~ ,XXIX. UMATILLA COUNTY
In Umatilla County, according to stlitf~'ticsNOln'thl! Ol'(>'i6rtCl\l1i1~~n'S' Sl!l:vices Dlvision, there were 23 Indian children in foster ca~e in .Ta~1Uary 1975,*'I'here are 506 Indian children under twenty-one years old in Umatilla County.jTitus one out of every 22 Indian children is in roster care.
ConclusionIn Umatilla Count.y Indian children nre in foster .care lit a per capita rate lOA
times (1,040 percent) greater than the State-wide rnte for non-Indians in Oregon.
xxx, UNION COUNTY
In Union County, according to statistics f'l"om the Oregon Children's ServicesDivision, there were no Indian children in foster care in January 1975.- Thereare 44 Indian children under twenty-one years old in Union Countr.t
Conclusion i c" ". In '1'lllamook: County; ~ndia.n .cb,ildren are in fos~~l', .CIlre: ,Il:t, a per .Fapita rate
3.7 times. (310 .pe,l'centh: gl~at~r }llan the-.Stllte.wl<ler/l~e {()r iwti)n4i All s' InOregon.
X:;:;V1H. nI.LA~loql~ COUNTY
..In Tillamook Counts, aceordlngtn stntistlcs from the .Oregon Cl!il\l~~l~s,Setvi~s',Divi8ion, there was one Indian child in roster ,€!lre l,11 January :19",: 'rh!lre"ace ,G]' Indian llhildren' under, twenty-one years. old 11l-~lllalll~ok County~t 1'l1U8,'"lie out of 61 Indian children is in foster care., ,. l ',I'i ,,'"'' ,"! ".: '
XXXI. WALLOWA COUNTY
In watlown Count.y, according to statistics from the Oregon Ohildreu's ServIcesDivision, there were no Indian children in foster care in January 1975.* There aresix Indian children under twenty-one years old in Wallowa County.t .'
xxxn. W Aseo COUNTY
In Wasco Counts, according to stntistics from the Oregon Children's ServicesDivision, there were six Indian children in foster care in January 1975.* Thereare 248 Indian children under twenty-one years old in Wasco Countz.t Thus oneout of every 41 Indian children is in foster care.
ConclusionIn Wasco County Indian children are in foster care at a per capita rate 5.G
times (560 percent) greater than the State-wlde rate for non-Indians in Oregon.
XXXIIr. W ASHINOTON COUNTY
In Washington County. according to statistics from the Oregon Children'sServices Division, there were no Indian children in foster care in January 1975.*There are 183 Indian children under twenty-one years aid in Washington Oountz.j
XXXIV. WHEELER COUNTY ,
In Wheeler County, according to statisttcs from the Oregon Children's Services:;:)\vlsion, there were no Indian children in foster care in January 1975.* Thereare two Indian children under twenty-one years old in Wheeler County.t .'
:il:X:XV. YAMHILL ,COUNTY
In Yamhill County, according to statistics from the Oregon Children's ServicesDivision, there was one Indian child in foster care in January 1975.- There are173 Indian children under twenty-one years ohl in Yamhill Oounty.] Thus one out0;' 173 Indian children is in foster care.(lollolllsion
In Yamhiil County Indian children are In foster care at a per capita rate 1.3times (130 percent) the State-wide rate for non-Indians in Oregon. .
-.\AlA Ql1eRtlonnnlr~,op, elf.tRaep. of the Populatlon by County: 10jO, op. cit.
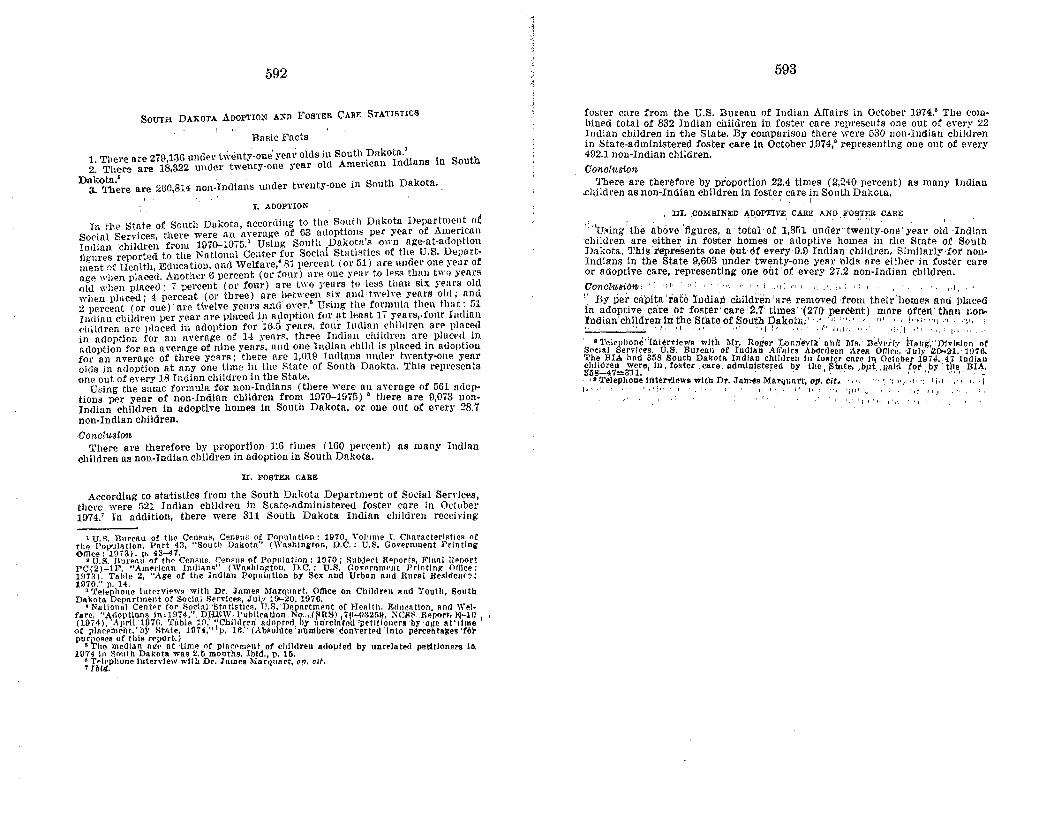
; -"," '1 1'1': ,',', "I
592
SOUTH DAKOTA ADOPTION A);D FOSTER CARY. STATISTICS
Basic Facts
1. There are 270,136 under twenty-one yeal; olds in South :nakota.' .2. There are 18,322 under twenty-one year old American IndIans in South
Dak<>tn.· .3. There are 260,814 non-Indians under twenty-one in South Dakota.
I. ADOPTION
Iu the State of South Dakota, accortl ing to the Sr).nt.h Dakota l)"pa.rtrucn.t ofSocial Services, there were an average of 63 ndopttons per year of Awel'l~allInrlinn 'children from 1970-1075.' Using Sout~l Dnko~u'~ own age-nt-adoptionllgnres reported to the National Center for Social Statistics of the U.S. Department ()f Health, Educa tlOI1, and Welfare,' 81 percent (or 51) are under one yeur ofage when placed. Another 6 percent (or four) nre oue yen r to less th!~n two ~'CiJrSold when placed; 7 percent (or four) are 1\\'0 years to less than SIX rears oldwhen plnced : 4 percent (01' tbree) are between six and-twelve years old; nnd2 percent (01' one) are twelve years and' OYN.· Using the formula then that: GlIndiun children per year are placed In adoption for lit INlst 17 years"fonr Indianchildren are placed ill adoption for 16.;; Jel\r~. rour Iudlnn children are placedin adoption for nu nverage of H Jenr~, three Indian chtldren are plucerl inadoption for an average of nine yenrs, and one Indian child is placed in adopt loutOt' an average of three years : there are 1,019 Indlaus under twenty-one yearolrls In adoptlon at any one t.Ime in the state of Sonth Daokta, ',fhls representsone out of every 18 Indian children in the State.
Using tile same formula for non-Indlans (there were an average of 561 ndcptlons per year of non-Indlan children from 1070-19'0'5) • there are 9,Oi3 nonIndian children in adoptive homes In South Dakota, or one out of ererv 28.7non-Indian children, .
Conclusion'There are therefore by proportion 1:6 times (l(lO percent) as many Indian
children as non-Indian children in adoption in South Dakota.
rr, FOSTER CARE
According to statistics from the Soutb Dakota Department of Social Services,til ere were ;;21 Indian children in State-administered foster care in October1974.' In addition, there were 311 South Dakota Indian children receiving
'U.S. Burcnu of the C~MU~, Census of Populn tlon : 1970. Volnrne r, Chnrncterl.tic8 oftile Populatton, Par t 43, "South Dakota" (WashIngton, D,C.: U.S. Government PrintingOmce: 1li73). p, 4'3--47.
, U.S. Burenu of the Cen,qn". Census of Populat lon : 1070; I';ubjert Rerort. Flnnl llAnortPC(2)-H', "Amerlcnn Imlinna" (Wn.hlng-ton, D,C.: U.S. (lovArnnwnt P':lntln~ Omee'lUn). Tnl,le 2, "Age of the Indian Population by Sex and Urban and Rural lleslden("~:1070" p. 14, • ,
a T'elephoue Interview. with Dr. James Marqunrt.Omce On Children and Youth SoutbDnkotn Department or Soclnl Senlc,,", Julv 19'-20. 19';6. '
• Na tl ounl Center tor Roclnl 'Statistics, IJ:S.'Dr.pnrtment or Henlth. Educntlon and W.l·fure~ '~A,do~IU{)J\S In,~!~74,".DiU';W..l'uhUrntlon.No... (1'lIlS) l'ifh-(l:~2r.l!, "CllR,R"port,'N~i()· ,(10d), ,April; IP7r.. JablA lO,"Chllr1r~n llUOj,terl. by nnrelafAlFpetltioners 'by'llile lit'lirne'"e plncAtnent, by StII:te; 1074,'" p; 16:' (Ab~o Ilte' numbers' con\'ertr'd .into perCeMAl1;cs'torl,urpoRes of this report.)
• Tho medilln niCe at 'lImA of plnri'ment ot children arlopted by unrelated petitioners iii1074 In Routh DakotR wno 2.5 mouths. Ibid. p. 15; jbld~hOne interview 'With Dr. Jluoes l\Znr'tlllnrt,· op, cit.
593
foster care from tbe U.S. Bureau of Indian Affairs in October 1974.' The COIUbined total or 832 Indian children in foster care represents aile out of every 22Iudian children in the State. By comparison there were G30 non-Iridian chil(lrenin State-administered foster care in October 1974,' representing one out of every492.1 non-Indian children.
ConClltSWn?-'bere are tMref?re by. proportion 22.4 times (2,240 percent) as many Indian
.ehi ldren as non-Indian children in foster care in South Dakota'i •
• III, COMBIN!'D ADOPTIVE CARE AND <'OSTER CARE
" '~~ing: the' a~6~e '~gures, a' total of 1,801 un(l~r' t~en'tY·on~' ;ea~ old -Indlnn'clllldl'en are either 111 foster barnes or adoptive homes in the State of SouthDakota. ?'hIS represents one out Of every 0.9 Indian' ehlldren.: Similarly ,for' nonIndians Il1 the State 9,603 under twenty-one year olds nre either in foster careor adoptive care, representing one out of every 27.2 non-Indian chIldren.UOfl.CltuBit}nji ,': 1;/. ' ;': ,•.. ,.: '" I , I .. 11: ,·J'I ': .". ':.' I , .,.' ", ~.
'.: By percaplta 'rate Indlanchfldran 'are removed :from thel~lhomes and illncedIl1 l~doptlve care or foster' care 2.7' times' '(27(} percent) more ortenfharrnon:rndlUn children In the State of South Dakotn.' '.' :" '''' "n' .. 'i.·.' ....",·,.,·", :I • I' I • ' . . • i ',.' ; l' I, j I I; ", • ;'.", • ~, ".: I' I , \
.~ .1'elel)honc"lnt~n"ie"," with1\o!r. Roger :Lontievlk' "nil lIf•. B~hrry hntlg;:D1vl.lon of.,(lelll] Services, U.S" Bureau ot Indian AffaJrs Ab6rrJecn Arell Office, 'Julv 120--21, '11176.The BrA. had a~8 South Dakota Indlnn chllrlren In foster care i" Oetober i974.47 Indian~~k'~4e7~3'il~e, In, roster . care. administered by the, ~'lnte, ,bllt. ,Raid ts«. ,by : ~l1,e•. BI4.'. Telephone ItlterYlews withDr. Jaln·e. l'>Iar~llart, op. (lit. ','. '" '.., "i ""': 'i" " ,.,i
J I" ," : • . ",': I' I J I , I ", I I . r, ~ .. 11 I I , '.~ J J I , " '.' I .
i ,
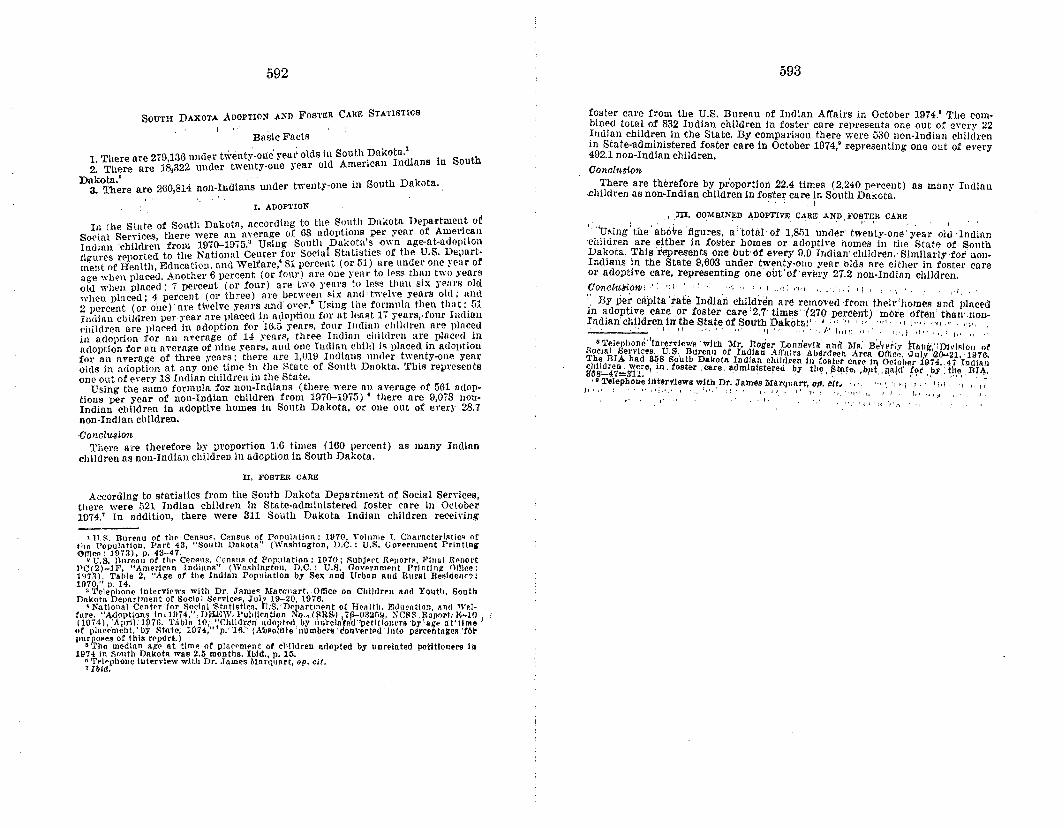
592 593
, .••. '1'1 'I': "'i". "1
foster care from the U,S. Bureau of Indian Affairs in October 1974.· The combined total or 832 Indian children in foster care represents one out of ever" 22!ud!an childr:e~ in the State. By comparison there were G30 non-Indian chilZlrenIn State-administered foster care in October 1974' representing one out of every492.1 non-Indian children. 'Oonclusion
There are therefore by proportion 22.4 times (2,240 percent) as many Indian.children as non-Indian children in foster care in South Dakota.
I
, .m, ,COMBINED .ADOPTIVE. CARE AND .'OSTER CARE
." '~~i~g: the' a?6~e '~gures, ~: total' of 1,801 \lnd~r', t.~en'ty-one' Yl:'a~ oltl :Indianchildren ~re either 1Il foster homes or adoptive homes in the State of SouthDa~ota. :rhiS represents one but, of every 0.0 Indian' children.' Slmllarly-ror non.I~dlans ~n the State 9,603 :under twen~y-one year olds are either in foster care01 adoptive care, representing one out of ,every 27.2 non-Indlan children.Conol-u8i6tV:·': ':1' ' .1' ". , •. ; 'I' I , I .,q; 1'1'1 ':,' I: .11 I .' • • _/ •
'.: By pe~ capita 'rate India'pchiIdi;en 'are removed :from thel~lhomes an~ ;)I~CedIII l~doPtlve care or foster' care '2.7' times"(27(} percent) more ottlln' thnnuion:radIan children in the State of South Dakota.' ' .. ;,; "', " '" I "I i' '. t': .." ," , "",
,'" " I I • r . , t .' I.' . If ( . l' I.ill: 'I '. '. I ,!. "0' ", _'I ,:
"'l.'elephone'!nten-Ie",s with 'Mr. noger :Lontievlk'lltIiI lIfR. B~\'~r;v }rnt,",D!v!alon ofS,oelnl Services. U,S., Bureau of Indian AO'nlra Aberdeen Arell Office. 'JUlv"l'ao.-21, '1976'IJ~~/lIA. had 3~8 South Dakota Indian chrldren In foster care 1'1 Octobar i97tl.,47 Ind lan~58,-W~3il;e, in , foster, care administered by the, ,state, ,b,'t, ,~a!dO f!?t "bY: tll,e, ,BI4.,. !l'elephone ItltervJews with Dr. Jam'es 'Marquart, op; tilt. ',', ","", i "'0" Ii"'''' I.' i'
~ I ' " ~, " , ": I' , 'I ": ~ I I I,' I I "' t ~ •• rIll , '.~ I' I r r r .• I ~l I
, I,
SOUTH DAKOTA ADOPTION .A);'1l FOSTER CARE STATISTICS,
Basic Fncts
1. 'ruere are 279,136 under t\'i'enty-olle' yeal; aids in South :nakota.' .2. There are 18,322 under twenty-one year old American mdians in South
Dakota.' , c< th D k t3. There are 260,814 non-Indians under twenty-one in sou a 0 a.
I. ADOPl'ION
In l'he State of South Dakota, according to the Soyth Dakota nlo'pa,rtmen.t ofSo('ial Services, there were an average of 63 adoptIOns pel' yenr of Awel'l~anIndian 'children from 1970-1075.' Using Sout~l Dako~a'~ own age-at-adoptionligures report.ed to the National Center for Soctal Stntrstics of the U.S. Departnlent of Health. Education, and 'VelfaI'e,' 81 percent (or 51) are under one yeur ofage when,placed. Another 6 percent (01' rour) are one year to less thl~n two yearsofu when placed; 7 percent (or four) are two years to les8 than SIX years oldwhen placed : 4 percent (or three) are netween SIX and-twelve rears old; and2 percent (o~ one) are twelve years. and' o\'~r.· Using the f012n\lln then thnt:. 51Jndilln children, per~'ear nre plaeed In a\loption for at If,ast 1, y,ears,.fonr Inrliunchildren are placed in adoption for 16.;:; fellrs, four Indln n children are placedin adoption for all average of H J'eul's, three Indlnn cnlldren are placed inadoption for an average of nine years, aud one Indian chi lrl is placed in adontloufor an average of three yea rs : there are 1,019 Indians 111\(11:'1' twenty-one yearolds in adoption at uny aile time in the State of South Dnokta, '.ruls representsone out of en~ry 18 Indian children in the State.
Using the same formula for non-Indians (there were an average of GG1 adoptlons per year of non-Indian children from 1070-1975) • there are 9,073 lionIndian children In adoptive homes In South Dakota. or one out of every 28.7non-Indian children.
,OonclusionThere lire therefore by proportion ]:6 times (lOO percent) as many Indian
children as non-Indlan children in adoptlonln South Dakota.
rr, FOSTER CARE
According to statistics from the Sonth Dakota Department of Social Sen-ices,there were 521 Indian children in State-administered foster care In October1974.7 In addition, there were 311 South Dakota Indian children receiving
1 U,:-, Bureau of tho Cen sus, Census of Ponuln tion : 1970. "oll1me r. Cbnrnctertsttes ofthe Populn tfon, Part 43, "South Dakota" (Washington, D,C,: U.S. Government Printingomce: 1973). p. 4'3-47.
• U.S. Htlreau of the CeMlw, Census of Pnpu lat lon : 1070; lIuhjprt RPflort. Final RpnortPC(2)-H'. "American Irnltn ns" (Washing-ton, D.C.: U.S. (lovprnnwnt Prlntln,ll' nOle.. :IOn), Tahle 2, "Age ot the Indlan Populatton by Sex and Urban and Rural Ilesldellr~:
1070" p. 14.3 Telephone Interviews with Dr, Jnme. IIInrqnart.Office on Children nnd Youth. South
Dakota Department of Soclnl Servlc",", Julv 190-20. 1976.• National Cen tr-rTo r Social 'Sfn tts tiea, \J;S.Depnrtment of Hen lt h. Education. Rnd We!'
t ure~ "J\doptlnns In,l!l,14,", DfU';W ..I'uhllcn tlon ,l'o-o.,(~RS) ,.r....(l:{2r.», :-;Cl'lS ,Ro/lOrt,'N"'lO ' ,(10/4), April; lll7f:. 'JabiA 10" ';Chlldpm Ildol,ted,OY nnrelafAu"pHJUoner9 'by'uge nt'tlme I
"f plneeO,ent, bY Hhl:te, 1014,' p: HI.' (A1J~o ate 'numbers 'coa\'ertPd 'Into perce~tR!leM 'f6rpuqloses of this rpp~rt.)
• Tho median nile at time of placem..nt of ehlldreu adopted by unrelated petitioners ill1914 In Smith Dnkota was 2.5 month•. IbId., p. 15.;i;II;;~hODC Interview with Dr . .TlIwes Mar'll/lIrt, op. cil.
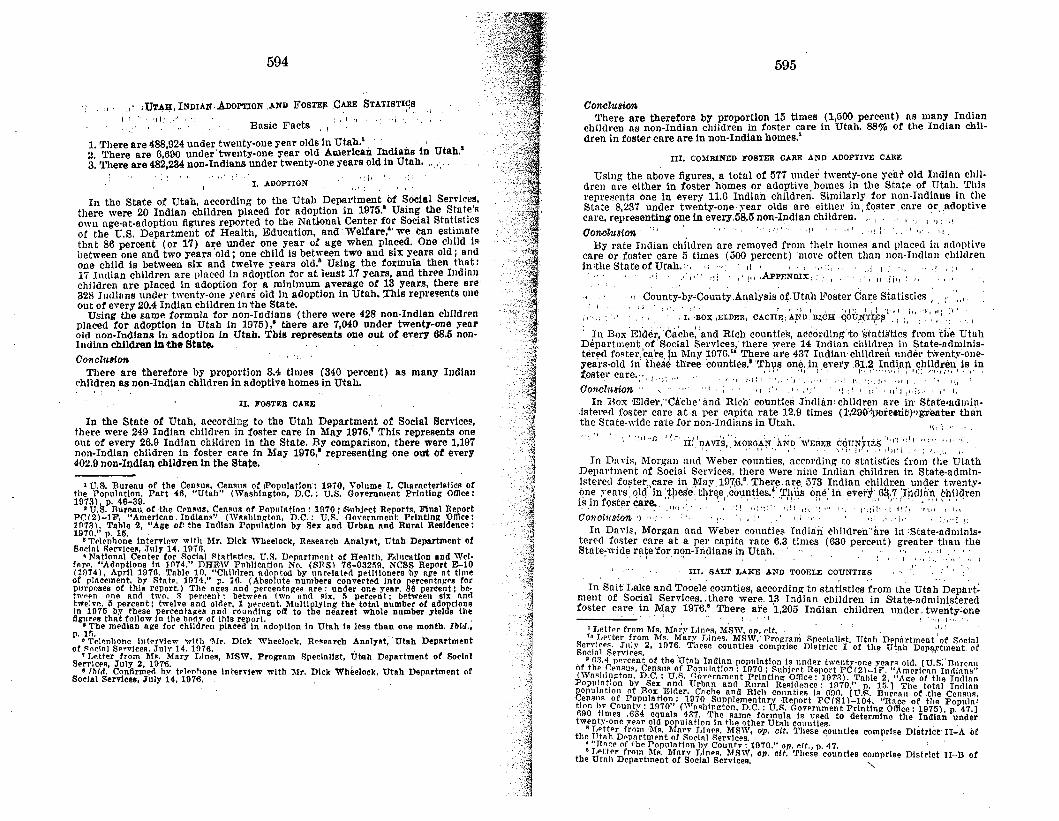
594
II. FOSTER CARE
In the State of Utah, according to the Utah Department of Social Services,there were 249 Indian children in foster care in May 1976.' This represents oneout of every 26.9 Indian children In the State. By comparison, there were 1,197non-Indian children in foster care in May 1976,· representing one out of every402.9 non-Indlan children in the State.
,UTAH, INDIAN,A.DOPTION ,AND FOSTEJl .CARE STATISTlqs
I . .', 'II' ." ,," Basic Facts "1:' I ., ."
1. There are 488,924 under twenty-one yenr olds in Utah.' . . . .' J
2. There are 6,600 under' twenty-one year old Americ8u Indians in Utah.3. ~'here are 482,234 non-Indians under twenty-one years old in Utah. ".'.
, .In SnIt La~l:e and T?oeJe counties, according to statistics from the Utah Depart:
ment of SOCial Services" there were. 13 Indian children in State-administeredfoster care in May 1976.· There are '1,205 Indian children under, twenty-one____....;._., . ,'1 ,
··'f··l1'·
: I,etler from ~r.. MIl;Y Lines. MS~". 01>..dt.. , ';,: ." Letter from Ms, Mary Line.•. MSW,' Prom-am SpeclllllRt. Utnh Deportment of Social
~~~T~tS·er·~.il~;s.2, 1076. These counties comprise District I of the Utah Depn,rtment. of
, • G3.4 percent ot the Vtah Indian poplIlatlon I. un,le.r twenty·one years old. [U.S;'n'Il'eallof the (;pn-u., C.nRlI. of Popllintlon: 1070: Rubjpet. Report PC(2)-1F, "Am~rlcon In'lInns"
(\V'a_hln~ton. D.C. : U,R. f:o"ernmcnt PrlntlnJ: Office: 197'~). TallIe 2, "AJ:e of th~ Tn,lIllnPopnlnt.lon by Sex lIn,l Vrbnn .an,l Rurnl Re.l<1ence: 1D70." p. 15.1 The total IndianJ)opulotlOn of Box Elder. Cnche and Rich Conn tie. I. GOO. [U.'S. Bnr.nn ot .the CensnR,CenAn_ of PopulatIon: 1970 Supplementarv ·Report PCi'S1 )-104 "Rnce of tho Popnln'tlon h,- Count)·: 1R70" (Wnshln~ton. D.C.: U.S. Government Prlntl'll~ Office.: 1975). p. 47.]690 tim ....634 equals 4:-17. The Ram. formula In lI~e<1 to determine the Indian undertw:nt)'-one year old popnlatlon In the. other Vt"h counties. . .
Letter from 'lifo. Mnrv J,jneo. MSW, Oip. clt.'l'hese countlea comprise Dlstrlet II-A ofth. Utnh Depnrtm.nt of Social Services .
: "Roce of the J'opul"t!on hy Countv: 1970." Oil. elt., p. 47,Lejter from Ms. Mnrv Lin •• , MSW. op. cit. '.rhese eountl.s comprise District II-B ot
the Utnh Department of Social Services.
III. SALT LAKE AND TOOELE COUNTIES
595
.. ·.UI·J~ ':'·····ri:!'DAVIS .. :!.roROA'N·l!.NO.."'EUER COuN!,.ms,·,·1 "" "I': .. "I!. . I, " C"I" " ",.,' j, !lr, 1_ ':1 (JI' i.,,: : -. '" I'
In Davis, Morgan and Weber counties, according to statistics from the UtnthDepartment of Social Services, there werenine Indian children in State-adminIstE:re.llfoster.,care in May 197,6.' There. are 573 Indian children under twen tv?n.e ~f·eatrs:.OI4 in Jpese tl~r~e, .countles.' .r,ll~s one,' in ,.everj;'. ,Oq-,7 ;I!1{Un,n, ~~i!drenl~,ln QS ~rca\r~, ,'Iq ... :~ .":'::" I;i! 1'( ,~,:. I', I'::;'!' ,I f~~~ "'·1:' ,1'l
Oonclusion ') .,~!, : :~I ! !'. Ii,:; " ,.j" -:/:'i ~;
In Davis, Morgan and Weber counties IndlanchlldreJl"nre ill' -State-ndmlnlstered foster care at a per capita rate 6.3 times (630 percent) greater than theSta te-wl de rate for non-Indians in Utah." .. . " '" ""., .
., ;.I" ' " :, I 'I.·' .',,'
III. CO~IBINED FOSTER CARE AND ADOPTIVE CARE
Using the ab~ve figures, a total ot'577 under twenty-one ~'e'ar' old Indian children are either in foster homes or adoptive homes in the State of Utah. '.rhlsrepresents one in every 11.6 Indian children. Similarly for non-Indians In theState 8,237 under twenty-one-veaz olds are either in,fostercar\,! or,.adoptlvecare, representing one in every,5!l.5 non-Indian children. . 'I "',': ,,,,,
Oonclusion :0 ,.,' , : '", I :
By rate Indian children are removed from their homes and placed in nrloptivecare or foster care 5 times (500 percent) more often than non-Imllnn childrenIntlie State of Utah.r. :I', . ,":,,, .,r I:'" .' ':'
-": .'"1' ! :1: ' t',!,. ,A,pPENP.IX;::, .,:1. tl .iili : ;,
ConclU8ionThere are therefore by proportion 15 times (1,500 percent) as many Indian
children as non-Indian children in foster care in Utah. 88% of the Indian children in foster care are in non-Indian homes.'
" County-by-County.Analysls of.Utah Foster CnreSta tlstlcs : . ,,,I
Ii: ". . :: '. ~"') -I .' I • . I [ ': (\ t "l ., I l , " r I' " r ;\ I
;,".' .I•. ·DOX,ELDER, CACHF;;A?IJ.DJ;CH.qoU,I:1;TJ;E~.,.,:, , ""': ".1
: In Box 'Elder, 'Cache, 'and Rich counties, ac~ordln~'to 'si·~tist.ics fl'om til'e UtahDepartment of 'Boclal Services, there were 14 Indian children in State-admlniater~cl foster,'ca're, In l\Iay llJ7G." ~'here are 437 Indian chllclrel\ under twenty-oneyears-old In thes~ th'ree counttea," 'Th1,ls one, in every 31.2 Indian chlldran is in~oste.r care.;"., ;.;... .' . 'i"1 I':,: j' ~:.',-. :,',1: ,.-~::I ',.,! 1,,:'·,:P:';~::'i':r\ '.'::,/':';l''':!,:.;' ,Oonclu.'Jwn "I ,I, I:' 'l:~ I u' 'lI'l ,,,i,,· , I' I,
In I{ox 'Eldel','Ce:che' and Rich' counties Indian' children are InBtata-admtn·istered foster care ata per caprta rate 12.9 times (11200'<1l1lrcerit)'lgreater thnnthe State-wide rate for non-Indians in Utah.
;:':1'.: 'I. ADOPTION
1 ,.":
In the State of Utah, nccording to the Utah Depal'tment,of ~6eial Servlce~,there were 20 Indian children placed for adoption in 1975. USID~ the S:at~ sown nge-nt-adoption figures reported to the Natkmal Center for SOCial Stntlsticsof the U.S. Department of Health, Education, and Welfare,"we can estimatethnt 86 percent (or 17) are under one year of age when placed. One child I~between one and two years 'old; one child Is between two and six years old; andone child is between six and twelve years old.· Using the fOl;mula then that:17 Indian children are placed in adoption for at least 17 years, and three Indinnchildren are placed in adoption for a minImum average of 13 years, there are328 Judinns under twenty-one renrs old hi adoption in Utah. 'This represents oneout of every 20.4 Indian children in the State.
Using the same formula for non-Indians (there were 428 non-Indian childrenplaced for adoption in Utah in 1975) " there are 7,040 under twentr-ene ~'enrold non-Indlans in adoption In Utah. This represents one out of every 68.5 nonIndian children lnthe State.Cotlclu.t£on
There are therefore by proportion 3.4 times (340 percent) as many Indianchildren as non-Indian children in adoptive homes in Utah.
1 U.S. Bureau of the Census, Census of IPopulatlon: 1970, Volume I, CharacterlAtlcs ofthe Population, Part 4'6, "Utah" (Washington, D.C.: U.S. Government Printing Office:1973) ...p, 46-39.
• V.::!. Bureau. of the Census,. Census of Population: 1070; ~ubject Reports. FInal RenortPC(2)-1F, "American. Indians" (Washlnlrton, D.C,: U.R. Oovernrnent Prlntln!: 'Office:10n1. Table 2, "Age of~ the Indian Population by Sex and Urban and Rural RP.llldence:1970." p. 1~. .
• Telcnhone Intervlc'IV ",I th Mr. DIck Wheelock, Research AIl'alyat, Utah Department ofSoclol RervlceB, .Tuly 14, 11170.
• Notional Center for Roclll! Rtatliltks. U.R. Dr-pnrt men t 0( Health. F,duc'lt!on and Welfore. "Adoptions In 1074." DHEW Pnbltca tion No. (RRS) 76-032~1l. NCSS Report E-IO(1074), Aprll 1976, Table 10. "Ch llrlren Ild0r,tod by unrelated pe tlttoners 'by Ilge nt timeof placement. by Stat., 1974." p. 16. (Abso ute numbers converted Into pereentalrcs forpnrposea of thla reporr.) The ages and pereentn ges are : under one year. 86 percent: b.tween one and two. :-I percent: between two and six, Ii percent: between stx andt'IVelve. ~ percent: twelve and older. 1 percent. 'Multlplylng the total number of adoptionsIn 197~ by these percentazea and rounding off to the nearest whole number ylelda thefigures that follow In the bodv of this report. '.
• The median age for children placed In adoption In Utah Is lesa than one month. I1lld.,~1~ .
'T.l.nhone Int.rvle ........ lth ~Ir. Dick WheelOCk. R••enrch Anolyot.' Utah Departmentof ~nclol ServleeR, Jul'l' 14. 1!l76. :
• T,ctter trom 101•. Mary I,lnen, 101SW. Prolr!'nm Speclollat, Vhah Department of SoelnlServlceR, .Tuly 2. 1f/ro. .
'Thld. Confirmed bv t.lenhone Interview with :Mr. Dick Wheelock, Utnh Department ofSocIal Servlcea, July 14. 197'6. . .
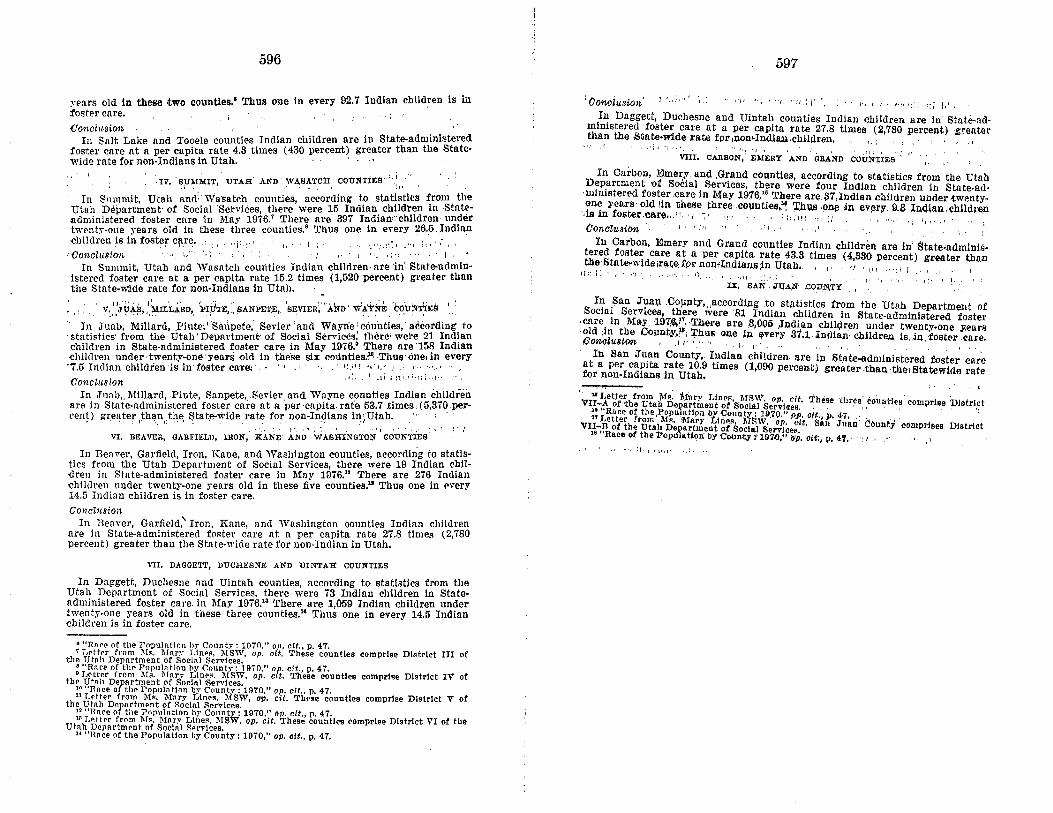
596 597
:"{JoncZ.uaion,' r ',,:,:1' '.,~ o"J' "t '-'r, '":i,l'j' ~ .. I". ( "'~'-\:.' I:; I.',
I~ Daggett, Duchesne and Uintah counties Indian children are in Btate-ndmimstered, foster care at a per capita Tate 27,8 times (2,780 percent)greatar,~ha~ the Sta,~'~?,e rate for 'n:o~-;~ian.chlldren. " 'i " " , '
VIII. CAnBON, EMERY 'AND' GBA'ND COUNTIES"; I', ,
In Oarbon, Emery. and .Grand counties, according to statistics from the UtahDepartment of Soeial Services, tbere were four Indian cblldren in State.ad.-nnnistered fost:r .care in May 1976.'" There are. ;l7,Indian children under twenty.,one years' old lin ~hei!e three ,counties':~ 'J;h\lS.one ,in ev~ry. 9.3 1n41an .ehlldren,isinfoster.care.,·.,'.,,;~, 'I' ,o, ':"'1',.,
I '1. ,". f , • I • r • I ~ 'j I I \' " •
Oonclusil>n ' /I: , ' , , . , , ' . ,
In Carbon, Emery and Grand counties Indian children are in' State'ad;nini~tered foster care at a per capita rate 43.3 times (4,330 percent) greater tbdlll11~~:St~t~~vldeir~.t,;tP~)no~,~nmanli;1n Utah. " ""I" ,;" I ",
IX. BAN . .TVA;N' .cOU:L'l;Ty I", I I
S IJ?- Isa",n J?ul,1 .Co/lntr,,,ac.cordipg .to statistics from the Utllh Department ofocia eervices, there were '81 Indian chlldren in State-administ(\red foster
:~Jei inth'lab 197.~~, ,There are .8,005',Indian chil(1ren under twenty-one yeaI'll
, '" 'in ,e ounty>, i ~hus one ~/1 filvery 31.1. J:ndian' e,I;Iildre.c, is, jn ·tost"r .eare."".one us,on " /. , ", I". '
In San JU,an' County,. 'Indian' cJI;llar~n, are 'i'n' St~~~dlllinist~red .fost.er car~fa t a perl ca
dPiIta rate 10.9 times (1,090 percent) greRtel' !thanthe, Statewirle rate
or non- n ans in Utah.
'vr~_1.e~i~hfrOUmt· br>fDS:' t.ritry LlnoR, MSW. "o». cit. These three count1e~ comprise Dlatrtct,. " e a epartman t of SoclB.l Servlaes. , . ' ,., ; "11 Rnce o~ thePcpulntton btCounty: J9.70," op. ott, p.47.,
VI,~~~e~~eth;,ru'tah~1);'~~!r~~entl~t"so~i~I\~e~c~~~t.S~n .JuRn COunty comprIses DistrictRace ot the'PopulaUoIi by County t 107.0," up. olt;, p. 41.' ", t, , .'"
'. ;
vears old in these two counties." Thus one in every 92.7 Indian children is infoster care.{Jonclu·sion
In Snit Lake and Tooele counties Indian children are in State-administeredfoster care at a per capita rate 4.3 times (430 percent) greater than the State-wide rate for non-Indians in Utah. ' . I,
V. I 'jUAB;,' MnLARD, 1m.lTE,:, SA~PETE; 'SEVIER; 'AND' WA't~~ 'CdUI'lTtES ,:, ." , • ~'I ,.. " ' , • ' • ."', I .••
In Juab,: -Millard, Plute;' 'Silllpete,' Sevier' and Wayne I countles, according to.statistics' from the-UtahDepartmentr of Social Servtces, thMe' were 21 Indianchildren in State-administered foster care in May 1976.· There are '158 Indianchlldren under' twenty-one :years old in' these six counttesz" ,Thus' one, in every'7.5 Indian children Is 'in' foster care,. .: .!.I! :' J," .' i ,., ,." .. ,
Conclitsion ,i:, : r ;1 i ',_:~I.\: 'fi i ,I"
In Juab" Millard, .Plute, Sanpete, .Sevier and Wayne counties Indian childrenare in State-administered roster careat a percaptta.rate 53.7 times ,(5,370 percent) greater \th~:n,:thE\ ~tate-wrde.rate rornon-rndtans iJ~;Utah.
.• to. ,,:' "I ',',
VI. BEAVER, GARFIELD, IRON,. KANE :AND WASHINGTOJ:; COUNTIES
",: .
,IV. B?MMIT, UTAH' AND WASATClI COUNTIES',,,
In Summit, Utah and' WasatCh counties, according to statistics from the:Utah Department of Social 'Services, there were 15 Indian children in .stnteadministered foster care in May 1976.' There are 397 Indian"'children tindertwenty-one years old in these three counties." Thus one in every 26.5. Indianchildren fs In foster care. ':1,: "i:·,·' l,' J; '.".'/' ,:',; '", .
'Concltl8ion . " ,.,'" 'i '; ,;',
In Summlt, Utab and Wasatch counties Indianchildren- are :inl'State-administered foster care at a per capita rate 15.2 times (1,520 percent) greater thanthe State-wide rate for non-Indians in Utah.
In Beaver, Garfield, Iron, Kane, and WaShington counties, according to stattstics from the Utah Department of Social Services, there were 19 Indian children in State-administered foster care in Mny 1976." There are 276 Indianchildren under twenty-one years old in these five counties." Thus one in ('very14,5 Indinn children is in foster care.Conclusion
In Beaver, Garfield,' Iron. Kane, and Washington counties Indian childrenlire in State-administered foster care at a per capita rate 27.8 times (2,780percent) greater than the State-wide rate for non-Indian in Utah.
VII. DAGGETT, DUCHESNE AND UINTAH COUNTIES
In Daggett, Duchesne nnd Uintah counties, according to statistics from theUtah Department of Social Services, there were 73 Indian children in Stateadministered foster care. in May 1976.13 There are 1,059 Indian children undertwenty-one years old in these three counties." Thus one in every 14.5 Indianchildren is in foster care.
: "Rnro of the Populnt lon h)' Countv : 1970." op. crt,. p, 47.'Lott.er from Ms. 1I1nl')' LineR, lIlSW, op, oft. These counties eomprlse DIstrlet III of
the Utah Department of Social Services.: "Rnre of tho Populntlon hy Coun tv : 1970." "P: eii., p, 47.
Lotter from 1I1s. lI[nr .. LineR. lIU;W. op, ctt, These counties comprise District IV ofthe Utah Department or Social Sen'lces
10 "Rnee or the Population bv County :'lll70" op oit p 4711 Le tter from MR. lIlnry T~lnes. Msw, oi>. oit. These counties comprise District V of
the Utnh Department of ::::oclal ::::ervlce~. .:: "Ruce of the Populn tton hy CO\1nty: 1970," on. cit., p. 47., LettPI' from Ms. Mary Line•. MSW, op. cit. These countil'S comprIse District VI of the
Utnh Department of Social ::::el'vlces.U "Hace of the Populatlon by County: 10iO," op. oft., p. 47.
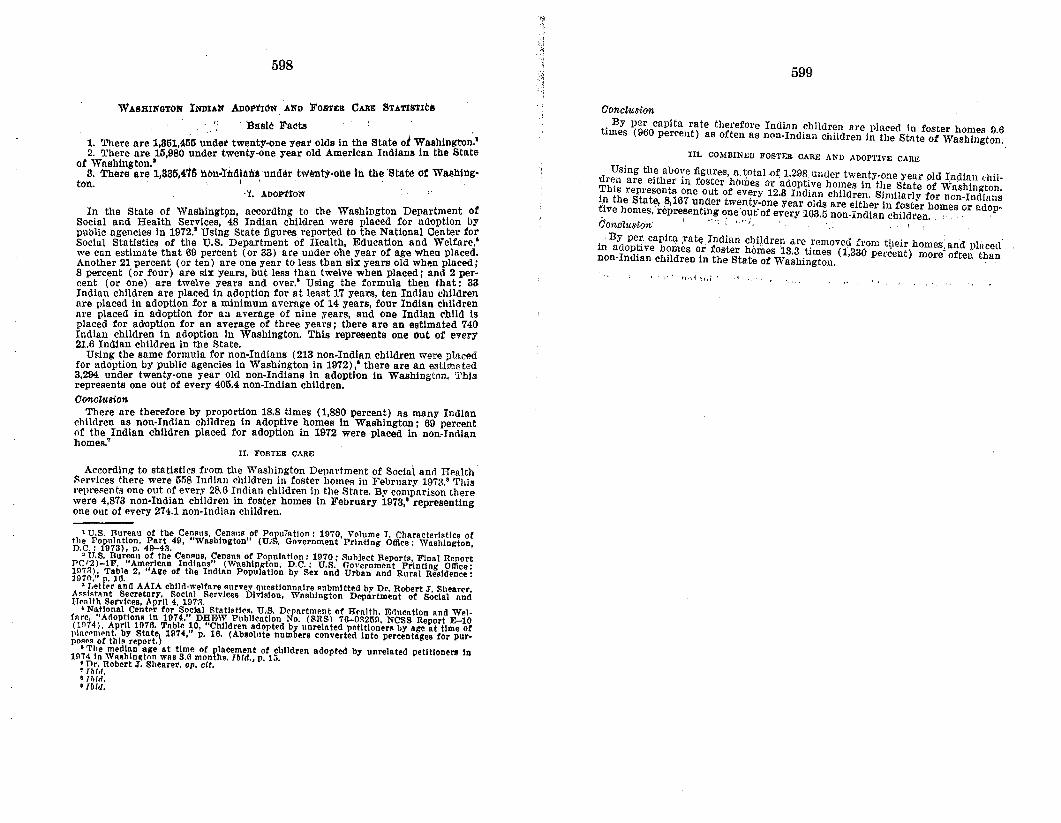
598
"WASHINGTON lNDIAN ADOPTION AND FOS'l'ER CARE STATI!lTItje
" . ~asle Facts
1. There are 1,851,455 undar twerttr-oneyeal' olds in the State of Washington>2. There are 15,980 under twenty-one year old American Indians in the State
of Washington.", . .S. Thete are 1,385,476 1'I6u·ltldlAl'is·under twenty'oil.e In the State of Washing-
ton. I' ,
·t. AMnIoN
In the State of Washlngtpn, according to the Washington Department ofSocial and Health Services, 48 Indian children were placed for adoption bypublic agencies In 1972." Using State figures reported to the National Center forSocial Statistics of the U.S. Department of Health, Education and Welfare,'we can estimate that 69 percent (or 38) are under ohe Year of age when placed.Another 21 percent (or ten) are one year to less than six years old when placed;8 percent (or four) are six years, but less than twelve when placed; and 2 percent (01' one) are twelve years and over." Using the formula then t.hat: 83Indian children are placed in adoption for at least 17 years, ten Indian childrenare placed in adoption for a minimum average of 14 years, four Indian childrenare placed in adoption for an average of nine years, and one Indian rhild isplaced for adoption for an average of three years; there are an estimated 740Indian children in adoption In WaShington. This represents one out of every21.6 Incllan children in the State.
Using the same formula for non-Indians (218 non-Indian children were plneadfor adoption by public agencies in Washington in 1972)," there are an estimn ted3,294 under twenty-one year old non-Indians in adoption in Washington. Thisrepresents one out of every 4015.4 non-Indian children.Oonclusion
There are therefore by proportion 18.8 times (1,880 percent) as many Indianchildren as non-Indian children in adoptive homes In Washington; 61l percentof the Indian children placed for adoption in 1912 were placed in non-Indianhomes.'
II. FOSTER CARE
Accordlnz to statistics from the Washington Department of Social and Health8ervices there were 5158 Indian children in foster homes in February 11l73," 'fIJisrepresents one out of every 28.6 Indian children in the State. By comparison therewere 4,873 non-Indian children in foster homes In February 1973," representingone out of every 274.1 non-Indian children.
1 U.S. Bureau at the .Censua. Census ot Population: 1070, Volume J. Characteristics otthe Population, Part 49, "Washington" (U.'8. Government Printing Office: WashingtonD.C. : 1973), p, 49-43. '
'U.S. Bureau at the Cen"us, CensuA at Population: 1970; 1'lubject Reports, Final Reportpr,r:n-1F. "Amerlean Indians" (Wnshlnj(ton. D.C.: U.S. Government Printing Office'1117H). Table 2, "Age ot the Indian Population by Sex nnd Urban and Rural ResIdence:11170." . 16. ' .
'r,etrpr anel AAIA child-welfare "urve.v questionnaire submitted by Dr. Robert J. Shearer.A•• I.tant Secretary. Social ServIces DIvision, Washington Department ot Social andHealth Services, April 4, 19T3.
• National Center tor SocIal StatlstlCA. U.,S. Department ot Health. lMucation and WeIfare, "AlioptlonR In 1974," DHFJW Publication No. (SRS) 76-032511 NeSS Report E-10Oll74). April lll70. Table 10, "Children adopted by unrelated petltlon"rA by age at time otp,la"elllent. by Statel 1974," p, 16. (Absoillte numbers converted Into percentages tor purno... ot thlA report. J
"The median age at time ot placement ot children adopted by unrelated petf tleners In11174 In W~shln~tnn was 3.6 months. tw«, P. 15.
I nr. Robert J. Shearer. 01'. cit., Ihld.• 17,{d.«rua.
599
Oonclusion
. By per. capita rate therefore Indian children are placed in foster homes 9.6bmes (960 percent) as often as non-Indian children in the State of Washfugton,
III. COMBINED FOSTF.R CARE AND ADOPTIVE CARE
d ,using th~ above figures, a. total.o~ 1,298,under twenty-one year pld Indian chil.u~n are either 111 foster hOmes or adoptIve homes !n the Stata of Washington
th~~ represents one out of every 12.3 Indian children. Similarly for non-Incllfln~l eState, 8,167 under twentv-ons year olds are either In foster homes or adop-,i"e homes, representing one'out'or every 163.5 non-Indian children.. '.' .(Jon,clu8io'jt' , .-;-: -'-'. ' I
. By pe~_ capita :rat~Indianc~i~drenare removed from their homes an~ plncecl'In adoP~lve h?mes or foster homes 13.8 times (1,330 percent) more' ofteu thannon-Indian children in the 'State of Washtngton.
I,." ~ ~ l, i '
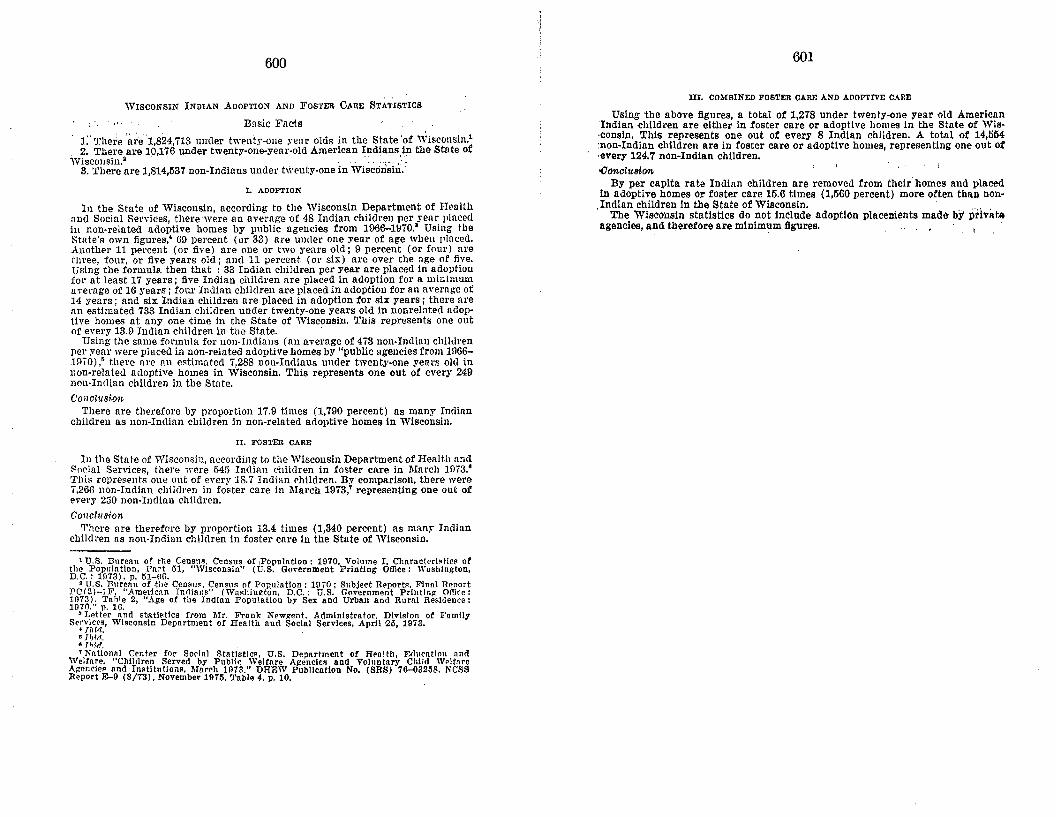
600
WISCONSIN INDIAN ADOPTION AND FOSTER CARE STATISTICS
: " Basic Filets
1:' The~e '~l:e '1,824,713 untler twenty-one year olds in the State 'of wtsconstn.', 2. There are 10,176 under twenty-one-year-old American Indians in the State ofWisconsin.' " , .... : .. , ":
3. There are 1,814,537non-Indians under twenty-one in Wisconsin.'
I. ADOPTION
III the State of Wisconsin, according to the Wisconsin Department of Healthand Social Services, therewere an average of 48 Indian children per renr placedin non-related adoptive homes by public agencies from 1966-1970.' Using theState's own figures,' 69 percent (or 33) are under one year of age when placed.Another 11 percent (or five) are one or two years old; 9 percent (or four) arethree, four, or five years old; and 11 percent (or six) are over the age of five.Using the formula then that : 33 Indian children per year are placed in adoptionfor at least 17 years; five Indian children are placed in adoption for a minimumaverage of 16 years j four Indian children are placed in adoption for an average of14 years; and six Indian children are placed in adoption for six years i there arean estimated 733 Indian children under twenty-one years old in nonrelated adoptive homes at anyone time in the State of Wisccnsln, This represents one ontof every 13.9 Indian children in the State. .
Using the same formula for non-Indians (an average of 473 non-Indian childrenper year were placed in non-related adoptive homes by "public agencies from1l.J6619(0),' there fire all estimated 7..288 non-Indians under twenty-one yellrs old innon-related adoptive homes in Wisconsin. This represents one out of every 249non-Indian children in the State.Conclusion
There are therefore by proportion 17.9 times (1..790 percent) as many Inclianchildren as non-Indian children in non-related adoptive homes in Wisconsin.
II. FOSTER CARE
In the State of Wisconsin, nccording to the Wisconsin Department of Health andSocial Services, there were 545 Indian children in roster care in !\Iarch 1073."This represents one out of every 18.7 Indian chfldran. By comparison, there were7,266 non-Indian children in foster care in lIIarch 1973; representing one out ofevery 260 non-Indian children.Conclusion
There are therefore by proportion 13.4 times (1,340 percent) as many Indianchildren as non-Indian children in foster care in the State of Wisconsin.
1 U.S. Bureau o~ the Cenans, Census of ,Population: 1970. Volume I. Characterl~tlc~ otthe Populatlon, Pnrt 51, "Wisconsin" (U.S. Go,-ernment Printing Office: Washington,D.C. : 1973), p, 51-aD.
'U.S. nur~nu of -the Census, ~ensl1s o~ Population: 1970: subject Reports. Final Rr-nor trC(Z)-lF, American Indians" (Wnshln;:ton, D.C.: U.S. Government Prln tlng' Ofllce :1073). Tahle 2, "Age of the Indian Population by Sex and Urban and Rural Residence:1970," p. 16. .
3 ~etter lind statistics from IIIr. Frank Newg-ent. Administrator. Division of F',mllyS~:'~};i~:' Wisconsin Department of Health and Social Services, April 25, 1973.
• Hid.e J"'i-rf.1 Natlon,~l Cent.er for Social Statistic•• U,S. Department of Health. P.lucatlon nnd
We1far~, Chllrlrcn Served by Public Welfare Al!enclts and Voluntary Chiid WelfareAl!enciep and Instttutlons, March 11173." DREW Publication No. (SRS) 76-{)3258. NCSSReport E-9 (3/73). November 1975. Table 4. p. 10.
601
III. COMBINED FOSTER CARE AND ADOPTIVE CARE
Using the above figures, a total of 1,278 under twenty-one year old American'Indian children are either in foster care or adoptive homes In the State of Wls-consln, This represents one out of every 8 Indian children. A total of 14,554:non-Indlan children are in foster care or adoptive homes, representing one out of·every 124.7 non-Indian children.Conolu8ion I '
By per capita rate Indian children are removed from their' homes and placedin adoptive homes or foster care 15.6 times (1,560 percent) more often than non
.Indlan children In the State of Wisconsin.The Wisconsin statistics do not Include adoption placements made bj' ilrh~t'"
agencies, and therefore are minimum figures. , " .• .: I
602
'WYOYIl'lG ADOPTION AND FOSTER CARE STATISTICS
Basic Facts
1. There are 1.37,339 under twentr-one year olds in 'Wyoming.'2. There are t2,832 under twenty-one year old American Indians in 'Wyoming.'3. There are 134,507 non-Indians under twenty-one in 'Vyoming.
I. ADOPTION
In the State of 'Wyoming, according to the Wyoming State Division of SocinlServices, there were an average of six adoptions per year of Indian childrenfrom 1972-1975.& This datil base IS 'too small to nilow realistic projection of thetotal number of Indian children in adoptive care. We can say though that durlng 1972-1075, 0.8 percent of Wyoming Indian children were placed for adoption,
During 1972-1975; according to the Wyoming State Division of SocIal Services,an average of 73 non-Indian children were placed for adoption in Wyoming,'nlUS, during 1972-1975, 0.2 percent of Wyoming non-Indian children were placedfOl' adoption. . , ' ,Conolusion ' ,
Based on the four year period 1972-1975, Indian children were placed foradoption ata per capita rate four times (400%) greater than that for nonIndians.
II. FOSTER CARE
According to statistics from the Wyoming State Dlvlsion of Social Servic'?s,there were 24 Indian children in foster care in June 1976,' An additfonal 74Indian children were in foster care administered hy the U.S. Bureau of IndianAffairs.·
The combined total of 98 represents one out of e",ery 28,9 Indian children illthe State. By comparison, there were ·446 non-Indian children in foster care inMay 1976,' representing one out of every 301.6 non-Indian children.
OonclusionThere are therefore by proportion 10.4 times (1,040 percent) as many Indian
chlldren as non-Indian chlldren in foster care in Wyoming; 57 percent of thechildren in State-administered foster family care are in non-Indian homes," 51percent of the children in BIA-administered foster family care are in non-Indianhomes.'
1 U.S, Bureau of the Census, Census of Population: 1970. Volume I, Charnctertatlcs of,110 I~OPUlnu."~6 Part 52, "Wyoming" (U.S. Government Printing Office: WasWngton, D.C.:
19n(,id~' g,2riL30 (Tahle 19), p. 52-18D (Table l~P), Iridlun people eomprise 59.2 percent orthe .to tatnon-wbtte populatton nr.eoroing to TobIe lap. A~cordlng to Table 10 therearc 4,783 non-whites under twenty-one. 4,783 tlmes .5P2 equals 2,832.
• Telephone intervtew with Mr .•Iohn Rteinberll, Director of Adoptlon"1 Wyomln/: StateDlvlston of Social Services, July Hi, 1976. A total of 22 Indlnn·cl1l1dren were placed foradoption during these four yearR.
, I b!d. />. total of 293 non-Indian children were placed for adoption ourlng these fouryenrfl.
'Telq)!lone Interview with Ms, Jnnet '::;hrlner, Fos ter Core Consultant, ',Vroming StateDI"I.lon of Socln\ Sorvices, July 20, 11l7G. T"'·~nt~·-three of tbese cblldreu were In fosterf.mlly homes, and one in a reshl~ntlal troatment center.
• T~lephone mtervlew wl th Mr. Cly,]e W. Hobbs. Supertntendcnt. Wind Rlv~r Indln'nAg-ency, July 2:2, 1976. Of these children, 4i ":t":?n! in foster family ho mes, and 27 In!"roup homes, Tbe tribal breakdown was: Shoshone, 12; Aropahoe, 39; l"on-enrolled, 23.The BTA t1llurp." are as of Jnly 107n.
; ir,~;r.Pbone Interview vdth·Ms. JOliet Shriner, op. cit.
" Telephone Interview with Mr. Clyde W, Hobbs, Of). cit.
603
ill. U.S. BUREAU OF INDIAN AFFAIRS ROARDI:'\G SCHOOLS
In addition to the above figures, 134 'Wyoming Indian children between theages of fifteen and eighteen were away from their homes attending BIA boardingschools in other states, These children, all from the ,','ind River Reservation,spent at least part of the 1975-1976 school year in boarding schools in CaliforniaNew Mexico, Oklahoma, South Dakota, and Utah." '
IV. COMBINED ADOPTIVE CARE AND FOSTER CARE
Since we are unable to estimate the totai number of Indian children currentlyin adoptive care in Wyoming, it Is not possible either to estimate the total numherof Indian children receiving adoptive and foster care. The foster care statisticsalone make it unmistakably clear that Indian children are removed from theirhomes at rates far exceeding those for non-Indian children.
NOTE ON FEDERAL BOARDING SCHOOLS
. In addition t~ those Iridian chi'ldren remO\'ed from their famllies to be pl~cedin adoptive care, foster care, or special institutions, thousands of Indian children(many as young as five-ten yea.rs old) are placed in U.S. Bureau of Indian. Affairsboarding schools. Enrollment in BIA boarding schools and dormitories is notbased primarily on the educational needs of the children; it is chiefly a means ofproviding substitute care. The standards .for taking children from their homesfor boarding school placement are as vagq.e and as arbitrarily applied as arestandards for Indian foster care placements, .
The table below presents a state-by-state breakdown of the number of Indianchildren Hying in dormitories while they _attend BIA boarding schools.
BlA boardlnllState: 8chool8t.udent8)Claska 664
)crizona 10,977California 714~fississippi ~_______________________________________ 197Ne,ada 517New ~exico ~ 7,428l'rorth I)akota___________________________________________________ 481Oklahoma 1,973.Oregon ~___________________________________ 549Sonth I)akota ~ 1,2071Jtah 1,093
Total 25,800
=Indian children living in dormitories operated by the BIA for chil-
dren attending public schools '-_______________________ .3,384
~otal -- 29,184
These children should be included in any compilation of Indian children awayfrom their families.
Source: Office of Indian ·Educatlon Programs, U.S. Bureau of Indian Alfairs, "FIscal, Year 1974: Statistics Concerning Indian Education" (Lawrence, Kans.: Haskell IndJan
Junior College : 1975), pp. '12-15, 22-23.
'0 Ibid.
o