India Grain and Feed Annual 2013 - USDAgain.fas.usda.gov/Recent GAIN Publications/Grain and Feed...
34
THIS REPORT CONTAINS ASSESSMENTS OF COMMODITY AND TRADE ISSUES MADE BY USDA STAFF AND NOT NECESSARILY STATEMENTS OF OFFICIAL U.S. GOVERNMENT POLICY Date: GAIN Report Number: Approved By: Prepared By: Report Highlights: MY 2013/14 (April/March) wheat exports are forecast to increase to 8.0 million tons, including 5 million tons of government wheat. MY 2013/14 (October/September) rice exports are forecast lower at 7.0 million tons on relatively tight domestic supplies. India is set for a near-record wheat harvest of 92.0 million tons in MY 2013/14 (April/March) on strong planting and favorable growing conditions. Assuming a normal southwest monsoon this summer, MY 2013/14 (October/September) rice production is also forecast near-record at 102.0 million tons from 44.5 million hectares. Since 2010/11, back-to-back bumper rice and wheat harvests and strong government procurement have resulted in a significant build-up in government stocks, which is likely to increase further in 2013/14. Consequently, Santosh Kumar Singh Allan Mustard 2013 Grain and Feed Annual India IN3012 2/15/2013 Required Report - public distribution
Transcript of India Grain and Feed Annual 2013 - USDAgain.fas.usda.gov/Recent GAIN Publications/Grain and Feed...
THIS REPORT CONTAINS ASSESSMENTS OF COMMODITY AND TRADE ISSUES MADE BY
USDA STAFF AND NOT NECESSARILY STATEMENTS OF OFFICIAL U.S. GOVERNMENT
POLICY
Date:
GAIN Report Number:
Approved By:
Prepared By:
Report Highlights:
MY 2013/14 (April/March) wheat exports are forecast to increase to 8.0 million tons, including 5
million tons of government wheat. MY 2013/14 (October/September) rice exports are forecast lower at
7.0 million tons on relatively tight domestic supplies. India is set for a near-record wheat harvest of
92.0 million tons in MY 2013/14 (April/March) on strong planting and favorable growing conditions.
Assuming a normal southwest monsoon this summer, MY 2013/14 (October/September) rice
production is also forecast near-record at 102.0 million tons from 44.5 million hectares. Since 2010/11,
back-to-back bumper rice and wheat harvests and strong government procurement have resulted in a
significant build-up in government stocks, which is likely to increase further in 2013/14. Consequently,
Santosh Kumar Singh
Allan Mustard
2013
Grain and Feed Annual
India
IN3012
2/15/2013
Required Report - public distribution

the Government of India (GOI) is likely to continue to allow exports of non-basmati rice and wheat
from government stocks in MY 2013/14. MY 2013/14 coarse grain production is forecast higher at
42.2 million tons on expected recovery in acreage and yields. Corn exports in MY 2013/14 are forecast
lower at 2.5 million tons on expected strong domestic demand. Pulse imports in MY 2012/13 are
estimated to increase to a record 4.0 million tons on continued strong domestic demand, and forecast to
increase further in MY 2013/14 provided international prices and the value of Indian rupee remain
stable.

Commodities:
Production:
After five consecutive record wheat harvests (2007-2012), India appears to be heading for a near-record
wheat harvest this summer on strong planting and favorable growing conditions in major wheat growing
areas. Assuming normal weather conditions through harvest (April), Post forecasts marketing year
(MY) 2012/13 wheat production at 92.0 million tons from 29.8 million hectares compared to last year’s
record 94.9 million tons from 29.9 million hectares. The government’s preliminary estimate pegs 2013
production at 92.3 million tons, which is likely to be revised later.
Excellent late season (September-October) monsoon rainfall provided favorable soil moisture
conditions for wheat planting in most growing areas. Despite the delayed announcement of the
minimum support price (MSP) of wheat by the Government of India (GOI), the expectation of
continued increase over last year’s high support price provided sufficient incentive to farmers to plant
wheat. The Ministry of Agriculture’s latest provisional wheat area planted estimates for MY 2013/14 is
29.8 million hectares, marginally lower than last year’s record area.
Although 91 percent of India’s wheat crop is irrigated, winter temperatures and precipitation critically
influence the yield prospects. Widespread scattered rains and low temperatures in January/early
February in major growing areas have provided optimal growing conditions to the standing crop during
emergence and early tillering. There have been no reports of damage due to pests or disease. However,
weather from February through harvest (April) will be critical as an early rise in temperature during
grain filling in March, or rains and hailstorms at harvest in April could affect the overall crop yield and
quality. An unprecedented extended winter and low temperatures through the first week of April 2012
supported last year’s record yield. Assuming normal weather conditions from now on, Post anticipates
the MY 2013/14 wheat yield marginally lower at 3.1 tons/hectare compared to last year’s record yield of
3.2 tons/hectare.
Indian wheat is largely a soft/medium hard, medium protein, white bread wheat, somewhat similar to
U.S. hard white wheat. Wheat grown in central and western India is typically harder, with higher
protein and gluten content compared to wheat grown in northern India. India also produces around one
million tons of durum wheat, mostly in the states of Madhya Pradesh and Rajasthan. Indian durum
wheat is typically purchased by the private trade at a price premium, mainly for processing of higher
value/branded products. Farmers are increasingly shifting from durum wheat to higher yielding non-
durum varieties as the durum yield is significantly lower than regular wheat varieties and the
government’s continued increase of MSP has reduced the price premium.
Wheat

Source: Ministry of Agriculture, GOI; and FAS/New Delhi estimates for MY 2012/13 and 2013/14
India’s wheat production has exceeded trend in the in the last three years on higher area and yields in
response to the government’s consistent increases in MSP and generally favorable growing conditions.
Further growth in wheat area is unlikely, and any future growth in production will have to come from
improved productivity. Indian wheat cultivation is facing two major future threats – global
warming/climate change and Ug99.
Unscientific irrigation practices and over-exploitation of ground water are increasingly causing water
table depletion and soil salinity in the wheat growing areas in northern India. Depletion of irrigation
water resources is likely to press wheat cultivation in north India in the next few years, forcing farmers
to explore less water intensive crops like corn, pulses and oilseeds.
Most of the commonly sown wheat varieties were released more than a decade ago and are showing
signs of obsolescence. The Indian Council of Agricultural Research (ICAR) institutes and various state
agricultural universities (SAUs) continue to develop new wheat varieties with higher yield potential and
better grain qualities, largely through traditional breeding methods. Given that seed production and
marketing are largely done by public sector institutions, the new wheat varieties have failed to make
sufficient inroads due to limited seed multiplication, distribution and extension facilities. Current
biotechnology applications in wheat are limited to experimental marker-assisted breeding for resistance
to biotic and abiotic stresses and for quality traits.
There is a growing concern among the policy makers and researchers about the vulnerability of the
wheat crop to global warming and changing climatic conditions, particularly the rise in temperatures
during March/April at the grain filling stage. Of the 29 million hectares under wheat cultivation,
researchers estimate that about 9-10 million hectares are prone to terminal heat stress. According to
some local research, a one-degree Celsius rise in temperature during the growing season can result in a
3-to-7 percent decrease in grain yield. The Indian Council of Agricultural Research (ICAR), India’s
apex agriculture research agency, along with various state agriculture universities (SAUs) is closely
researching the potential climate risks to wheat to develop appropriate response mechanisms and
technologies to mitigate risks.
Indian wheat also faces the threat of the dreaded wheat rust Ug99, as more than three-fourths of the
wheat varieties planted in India are highly susceptible to the disease. Although Indian agricultural
researchers assert that the agro-climatic conditions in the major wheat belt of northern India are not
conducive to the spread of Ug99, the highly mutative nature of the Ug99 strain could make Indian
wheat varieties vulnerable to this rust. Consequently, the ICAR and the SAUs continuously survey and
monitor the wheat crop for various rusts, including Ug99. ICAR is also screening newly developed
wheat varieties in the country against the Ug99 stem rust. The government has been encouraging
replacing the susceptible varieties with Ug99-tolerant varieties in the major wheat growing area.
Consumption:
Wheat consumption (FSI) in MY 2013/14 is forecast to increase to 83.0 million tons on expected
sufficient domestic production and continued higher supplies of government wheat stocks at subsidized
prices to the consumers through the Public Distribution System (PDS) and local millers through Open
Market Sales (OMS) program. The government is likely to launch the proposed National Food Security
Act in MY 2013/14 before the upcoming national elections in 2014, which could significantly increase
the supplies of food grains, including wheat, through the PDS. Wheat for feed consumption is forecast
to increase to 4.0 million tons on expected strong demand from the dairy/poultry sector and supplies of
damaged/inferior wheat from the large government-held wheat stocks.
Wheat (FSI) consumption in MY 2012/13 is estimated to increase by over three percent to 80.9 million
tons, largely due to higher government wheat sales under the PDS and OMS programs. The
government announced an additional allocation of 5.5 million tons of food grains to the state
governments for distribution through the PDS, and 9.5 million tons of wheat for bulk users and private
traders at subsidized prices through an open market sale program (see IN2155 and IN2089). Local
millers and traders were forced to depend on government wheat supplies as the open market availability
of wheat was relatively tight due to record government wheat procurement.
Wheat for feed consumption in MY 2012/13 is estimated at 3.6 million tons, an increase of over 16
percent over last year, on strong demand from the dairy and poultry sectors and higher supplies of
damaged/inferior wheat from the ‘abnormally large’ government stocks. Market sources report that a
significant portion of the lower quality wheat leaked from the PDS also finds its way into the livestock
feed sector.
Wheat is the staple food for most Indians, consumed in the form of homemade chapattis or rotis
(unleavened flat bread), using custom milled atta (whole wheat flour). Some wheat is also used for
various wheat-based processed products like raised breads, biscuits and other bakery items and their
share is gradually rising. With the growth in the economy and an expanding middle class, Indian
households are diversifying their consumption patterns with an increasing share of high-value and high-
protein items, like fruits, dairy products, meat, and processed foods. Recent National Sample Survey
Organization surveys indicate that per-capita consumption of wheat at household levels has been
relatively flat over the last decade (see IN2026).

Typically, whole wheat is distributed through the public distribution system to be subsequently custom
milled by the household for home use. The balance of production not marketed by farmers, after
retention of some quantities for seed use for the next season, is also custom milled, mostly in the
chakkies (small flour mills). However, branded and packaged wheat atta marketed by large food
companies is gaining market share in urban areas due to convenience. The organized milling sector is
relatively small with about 1,000 medium to large flourmills in India, with a milling capacity of 22-24
million tons, which mill mostly maida (flour) and semolina to cater to institutional demand, and produce
bran flakes for the mixed feed industry. However, the average capacity utilization by these mills is only
around 45-50 percent, processing about 10-12 million tons wheat every year. Some quantity of
government-held wheat (mostly spoiled or of inferior quality) is also used for animal feed. Market
sources report increased usage of wheat in the last two years due to relatively low wheat prices and
leakage from the government PDS system.
Government Procurement and Food Subsidy Swell
Government food grain (wheat and rice) procurement has continued to rise over the last few years due a
steady increase in the government’s support prices and five consecutive record harvests. Government
wheat procurement in MY 2012/13 shot to a record 38.2 million metric tons, a whopping 35 percent
increase over last year. Near-record production and a higher MSP are likely to fuel the MY 2013/14
wheat procurement further to 40.0 million tons. The Food Corporation of India (FCI) and state
procurement and storage agencies are facing a severe shortage of storage capacity, particularly in the
major origination states of Punjab, Haryana, and Madhya Pradesh. With the government’s current
covered storage capacity estimated at around 33.6 million tons (December 31, 2012), large quantities of
government wheat are kept in the open under Cover and Plinth (CAP) storage, especially during the
procurement period (May-July). The government-held wheat stocks peaked to a record 50.2 million
tons on June 1, 2012, precipitating an unprecedented storage crisis (previous record government-held
wheat stocks was 41.03 million tons on June 1, 2002). Market sources report that about 6-7 million tons
of wheat was kept in the open without even CAP storage in the months of June and July. Storage under
these conditions results in significant losses due to damage from rain, temperature fluctuations,
rodent/pests, and to pilferage. The food grain storage crisis is likely to escalate further in MY 2013/14
on expected higher government wheat procurement (40.0 million tons).
Table 1. India: Government Wheat Procurement and PDS Operation
Marketing
Year Production GOI
Procurement1
MSP GOI
Total
Cost
Off take
from
GOI
Stocks
PDS Issue Price Food
Subsidy
(Apr–
Mar) (Million
Tons) (Million
Tons) Rs.
per ton Rs.
Per ton (Million
Tons) Rs. per ton Rs.
Billion
APL BPL AAY 2005/06 68.64 14.79 (21.6) 6,400 10,419 16.71 6,100 4,150 2,000 230.80
2006/07 69.35 9.23 (13.3) 7,000 11,778 11.88 6,100 4,150 2,000 240.10
2007/08 75.81 11.13 (14.6) 8,500 13,118 12.25 6,100 4,150 2,000 312.60

2008/09 78.57 22.69 (28.9) 10,000 13,806 14.89 6,100 4,150 2,000 437.50
2009/10 80.68 25.38 (31.5) 10,800 14,246 22.38 6,100 4,150 2,000 584.43
2010/11 80.80 22.51 (27.8) 11,000 14,944 23.03 6,100 4,150 2,000 638.44
2011/12 86.87 28.33 (32.6) 11,700 15,953 24.27 6,100 4,150 2,000 728.23
2012/13 93.90 38.15 (40.6) 12,850 19,100 33.602 6,100 4,150 2,000 750.00
3
2013/142 92.00 40.00 (43.5) 13,500 na na 6,100 4,150 2,000 na
Source: Ministry of Agriculture and Food Corporation of India, GOI Notes: Exchange rate Rs.53.5 = US$ 1 on February 10, 2013
1 Figure in parentheses is GOI procurement as percentage of total production
2 FAS/New Delhi estimate
3 GOI budget estimate, actual expected to be higher
PDS - Public Distribution System APL - Above Poverty Line BPL - Below Poverty Line
AAY -Antyodaya Anna Yojana (Poorest of the Poor)
The steady increase in the MSP coupled with increasing procurement volumes since MY 2006/07 has
nearly doubled the government’s cost of wheat to Rs. 19,100 ($357) per ton in 2012/13. With the PDS
sales price of wheat unchanged since 2002, the GOI’s food subsidy spending is likely to balloon
significantly higher than the GOI’s budgeted estimate of Rs. 750 billion ($14.0 billion) in Indian Fiscal
Year (IFY) 2012/13 on higher costs (including higher MSP, storage, interest) and larger off-take of
wheat under PDS, and subsidized sales under OMS and export quota (see Trade Policy Monitoring
Annual IN2167).
National Food Security Bill: On December 22, 2011, the Indian Cabinet submitted a National Food
Security Bill to the Parliament that proposes a legal entitlement to subsidized food grains for 62.5
percent of India’s population, including 75 percent of rural and 50 percent of urban dwellers. The bill
was referred to the parliamentary oversight committee, which has submitted its recommendations to the
government. The recommendations, if accepted, will create legal entitlement for 820 million people to
receive 5 kg of food grain every month at a highly subsidized price. This measure will likely raise the
total food subsidy bill to over Rs. 1.02 trillion ($19.1 billion). The bill is likely to be taken up in the
budget session of the Parliament as a section of the ruling government seems to be pushing for an early
implementation of the proposed law. Subsequently, the government is likely to explore a phased
implementation of the act in selected states, covering the country before the next Parliamentary election,
scheduled in May 2014. See GAIN Report IN1213 for more details.
Prices

Source: Agmarket News (http://agmarkweb.dacnet.ic.in), Ministry of Agriculture, GOI
Despite back-to-back record wheat production and stocks, domestic wheat prices in MY 2012/13 have
progressively increased due to tight open-market wheat supplies and strong export demand. Despite the
expectation of another bumper crop, wheat prices in the first week of February 2013 were ranging
between Rs. 14,850-19,060 ($278-356) per metric ton in major states. Market prices during MY
2013/14 are expected to remain steady on higher MSP, government procurement and steady export off-
take.
With the government procuring over 40 percent of the total production, open market availability of
wheat has been relatively tight in MY 2012/13. Most open-market wheat supplies had been covered by
exporters due to strong export demand on relatively strong international prices. Most local mills are
covering a larger share of their wheat requirements through the government’s OMS scheme. The
government is currently selling wheat to local millers and processors at reserve prices ranging between
Rs. 14,030-17,780 ($262-332) per ton, which are below the open market prices in most states.
Trade:
In September 2011 the export ban on wheat was removed, but Indian wheat exports took off strongly
only in August 2012 after the GOI announced exports of wheat from government stocks. Wheat exports
during MY 2012/13 have also been supported by relatively strong international prices. Assuming
continued exports of wheat from government stocks and export price parity for Indian wheat vis-à-vis
other origins, MY 2013/14 wheat exports are forecast to increase to 8.0 million tons, which includes 5
million tons of government wheat and 3 million tons of private exports (open-market wheat procured by
private trade). Due to the forecast bumper crop and expected record government procurement, the GOI
will be under tremendous pressure due to the inadequacy of warehouses/storage facilities. With current
international prices significantly higher than the open market prices and OMS reserve prices in major
wheat producing states ($262-278 per ton), the government is likely to continue to liquidate additional

wheat stocks in the export market in MY 2013/14 and possibly MY 2014/15. However, any significant
weakening of global wheat prices may adversely affect export prospects. If export prices fall below the
OMS sale price ($262 per ton) or MSP ($252 per ton), accusations of subsidization of government
wheat exports are likely to come from other wheat exporting countries (due to World Trade
Organization commitments) as well as the local milling industry and opposition political parties.
MY 2012/13 wheat exports are estimated at 6.5 million tons as Indian wheat has been very price
competitive in the international market, particularly after the government allowed exports of wheat from
government stocks. Global wheat prices have firmed up significantly after the government announced
the 2.0 million export quota in July 2012, which was used up by December 2012. Subsequently, the
government raised the government wheat export quota by an additional 2.5 million tons for export
through June 2013.
Table 2: India: Government Wheat Tenders
Agency Quantity (Tons) Tender Close Shipment Period Price (US$ per ton FOB)
Port of Loading
August-December 20121
Various 2,045,000 End Dec 2012 Aug 2012-Jan 2013 296.70-328.05 Various
January 2013 onwards
PEC 35,000 Jan 3, 2012/2 Jan 10-Feb 10, 2013 318.0 Karaikal
PEC 100,000 Jan 7, 2013 Jan 10-Feb 15, 2013 320.89 Krishnapatnam
STC 50,000 Jan 10, 2013 Jan 21-Mar 5, 2013 323.05 Mundra
STC 100,000 Jan 10, 2013 Jan 21-Mar 5, 2013 318.50 Mundra
MMTC 150,000 Jan 11, 2013 Feb 1-Mar 5, 2013 319.45 Kakinada
MMTC 50,000 Jan 16, 2013 Feb 2013 309.00 Pipavav
PEC 125,000 Jan 17, 2013 Feb 1-Mar 10, 2013 314.00 Kandla
STC 40,000 Jan 23, 2013 Feb 2013 314.00 Chennai
PEC 35,000 Feb 6, 2013 Feb 11-Mar 10, 2013 312.00 Vizag
PEC 55,000 Feb 6, 2013 Feb 11-Mar 10, 2013 312.10 Karaikal
STC 200,000 Feb 7, 2013 Feb 18-Mar 30, 2013 310.21 Mundra
MMTC 35,000 Feb 12, 2013 Feb 25-Mar 20, 2013 NA Mormugoa
MMTC 150,000 Feb 14, 2013 Feb 20-Mar 31, 2013 NA Kakinada
PEC 125,000 Feb 18, 2013 Feb 20-Mar 31, 2013 NA Krishnapatnam
MMTC 50,000 Feb 20, 2013 Mar 10-Apr 3, 2013 NA Pipavav
STC 60,000 Feb 20, 2013 Mar 1-31, 2013 NA Chennai
STC 30,000 Feb 25, 2013 Mar 5-31, 2013 NA New Mangalore
TOTAL 3,435,000
Note: STC- State Trading Corporation; PEC - Project Export Corporation; and MMTC - Minerals and Metal Trading
Corporation 1 – For tender details for August-December 2012, see IN3001.
2 - Addendum 1, and Addendum 2
Government parastatals assigned to export wheat from government-held stocks have floated tenders for
about 3.4 million tons, of which about 3.0 million tons has been allocated to various private exporters in
the price ranging from $296.70 to $328.00 per ton FOB. Market sources report that about 2.5 million
tons of government wheat has been shipped or being loaded for shipment through January 2013, and an
additional 1.0 million tons is likely to be shipped during February-March 2013.

Provisional official trade statistics indicate that wheat exports for April to November 2012 reached 3.8
million tons, with the major export destinations being Bangladesh, Korea, Indonesia, U.A.E, Yemen,
Thailand, Tanzania, Oman and Djibouti (see Table 5). A significant share of India’s wheat exports is
meant for feed use, particularly in South East Asia and the Middle East. Market sources report that
April-November shipment includes 2.6 million tons of private exports and 1.2 million tons of
government wheat. Due to tight open-market wheat supplies, private exports of wheat have come
down significantly since November 2012, and most recent wheat exports have been from government-
held stocks. In addition, wheat product shipment is estimated at around 70,000 metric tons, mostly
wheat flour. At the current pace of exports, MY 2012/13 exports are estimated to reach 6.5 million
tons, 3.5 million tons government wheat and 3.0 million tons private exports and wheat products.
Despite the continuation of the zero import duty policy, opportunities for imports of wheat into India
since MY 2011/12 have been precluded due to subsidized sales of wheat under OMS. Imported wheat
is relatively costlier to the local millers vis-à-vis local wheat after accounting for the shipping, clearance
and inland transport costs.
Stocks:
Despite the government’s efforts to offload wheat in the domestic and export markets, government-held
wheat stocks on February 1, 2013, were was estimated at 30.8 million tons compared to 23.4 million
tons at the same time last year.
Source: Food Corporation of India, GOI
Assuming continued strong exports and domestic off take in February/March, MY 2012/13 ending
stocks are estimated at 23.8 million tons compared to 20.0 million tons for MY 2011/12 ending stocks.
MY 2013/14 ending stocks are forecast lower at 20.8 million tons on expected higher off-take under the
PDS as the higher total cost of government wheat will limit open market sales. However, these stocks
are nearly three times the government’s desired stocks of 7 million tons (4.0 million tons buffer and 3.0
million tons of strategic reserve).

Estimates of privately-held wheat stocks are not available, but are expected to be minimal in parts due to
risks stemming from anti-hoarding provisions of the Essential Commodities Act. The PS&D table does
not include privately-held stocks.
Policy:
Research & Development:
The Government of India (GOI) supports research, development and extension activities for transfer of
new varieties and improved production technologies (seed, implements, pest management) to farmers.
ICAR conducts wheat research and development at the national level, which is complemented by state
agricultural universities, regional research institutions, and state agricultural extension agencies at the
regional and state levels. The central and state governments also support farmers by subsidizing input
supplies and agricultural credit at affordable prices.
In 2007, the government launched a National Food Security Mission (NFSM) (http://nfsm.gov.in/) to
address food security concerns due to the slowdown in the growth of food grain production in the last
decade (2000). The NFSM aimed to increase the country’s wheat, rice, and pulse production by 8, 10
and 2 million tons respectively by the end of the 11th
Five Year Plan (2011/12) to ensure food security.
Given that further growth in area under wheat is limited, the NFSM seeks to bridge the yield gap
through promotion and dissemination of improved technologies – seed, integrated nutrient management,
integrated pest management and resource conservation technologies-particularly in the western and
central states. Given the success of the NFSM in meeting the 11th
five year plan targets, the government
is likely to continue with the program in some form in the as yet unpublished 12th
Five Year Plan (2012-
2017). Besides the NFSM, other targeted programs like the National Agriculture Development Program
(Rashtriya Krishi Vikas Yojana) and Special Program to Bring the Green Revolution to Eastern India
are being implemented by the GOI through the state governments.
Price Support:
The GOI establishes a minimum support price (MSP) for wheat on the basis of recommendations by the
Commission for Agricultural Costs and Prices (CACP). Government parastatals like the Food
Corporation of India (FCI) and various state marketing agencies have the mandate to procure wheat at
the MSP for central government stocks. Subsequently, the government allocates wheat for distribution
through the public distribution system and welfare schemes at a subsidized price. In years of surplus
procurement and stocks, the government sells wheat in the open market to the private trade at market
prices. The government policies relating to the MSP for essential agricultural crops and the price for
the PDS supply serve the twin objectives of providing remunerative prices to farmers and affordable
prices to poor consumers. See Tables 1 and 17 for historical MSPs.
Trade Policy:
On September 9, 2011, the GOI removed the ban on exports of wheat, which had been enforced since
February 2007, with some exceptions – occasionally allowing exports to countries like Nepal,
Bangladesh and Afghanistan on humanitarian grounds. On July 3, 2012, the government approved

exports of two million tons of wheat from the government-held wheat stocks (see IN2095) to bring
down the government food grain stocks to manageable level. Three government parastatals were
designated to undertake the exports through open tenders, and the two-million-ton quota was exhausted
by December 2012. On December 26, 2013, the government approved the export of an additional 2.5
million tons of wheat from government-held stocks for shipment through June 2013 (see IN3001).
Market sources report that the government export quota is likely to be exhausted before June, and the
government is likely to further augment the export quota. Exports of wheat from government-held
stocks are likely to continue unabated during MY 2013/14.
Currently, wheat imports by the government and private trade incur zero import duty. The government
lowered the duty on wheat imports to zero in September 2006 for a short period and this was
subsequently extended indefinitely in October 2007. The GOI’s phytosanitary requirement pertaining
to the 31 specified quarantine weed seeds (wheat sample drawn from a single consignment not to
contain more than 100 quarantine seeds per 200 kg sample) and other SPS issues have effectively barred
U.S. wheat shipments to India.
Marketing:
The rapidly growing fast food industry and modernizing wheat-based food industry generate demand for
specialty flours (used in pizzas and burger buns) that require varieties of wheat that India does not
grow. In addition, market sources report steadily declining acreage under local ‘hard and high-protein’
wheat varieties like Sharbati and Lok-1 grown in Central India could create a shortage of high-protein
wheat for blending of flour for the rapidly growing baking/confectionary industry. However, U.S.
wheat continues to be denied market access to India despite numerous discussions at the technical and
policy levels.
Production, Supply and Demand Data Statistics:
Table 3. India: Commodity, Wheat, PSD
(Area in Thousand Hectares, Quantity in Thousand Metric Tons)
Wheat
India
2011/2012 2012/2013 2013/2014
Market Year Begin:
Apr 2011 Market Year Begin:
Apr 2012 Market Year Begin:
Apr 2013
USDA
Official New
Post USDA
Official New
Post USDA
Official New
Post
Area Harvested 29,400 29,400 29,690 29,860 29,820
Beginning Stocks 15,360 15,360 19,950 19,950 23,800
Production 86,870 86,870 93,900 94,880 92,000
MY Imports 17 17 10 10 0
TY Imports 17 17 10 10 0
TY Imp. from U.S. 0 0 0 0 0
Total Supply 102,247 102,247 113,860 114,840 115,800
MY Exports 891 891 6,500 6,500 8,000

TY Exports 1,699 1,699 8,500 8,500 8,000
Feed and Residual 3,100 3,100 3,600 3,600 4,000
FSI Consumption 78,306 78,306 81,810 80,940 83,000
Total Consumption 81,406 81,406 85,410 84,540 87,000
Ending Stocks 19,950 19,950 21,950 23,800 20,800
Total Distribution 102,247 102,247 113,860 114,840 115,800
Table 4. India: Commodity, Wheat, Prices Table
Prices Table
Country India
Commodity Wheat
Prices In Rupees per uom metric tons
Year 2011 2012 %Change
Jan 14611 13106 -10.3
Feb 14724 13561 -7.9
Mar 13983 13033 -6.8
Apr 13790 13699 -0.7
May 13112 13423 2.4
Jun 12762 13529 6.0
Jul 13164 13961 6.1
Aug 13049 15339 17.5
Sep 12858 15789 22.8
Oct 12274 15780 28.6
Nov 13019 16917 29.9
Dec 13036 16386 25.7
Exchange Rate 53.5 Local Currency/US$
Date of Quote 02/10/2013 MM/DD/YYYY
National Average Monthly Wholesale Price of Wheat
Source: Agmarknet, Ministry of Agriculture, GOI.
Table 5. India: Commodity, Wheat, Export Trade Matrix
Export Trade Matrix
Country INDIA
Commodity Wheat1
Time Period April-March Units Tons
Exports for MY 2011/12 MY 2012/132
U.S. 165 U.S. 0
Others Others
Bangladesh 312633 Bangladesh 1181488
U.A.E 116074 Korea Republic 510685
Thailand 46976 Indonesia 294052
Pakistan 44192 U.A.E 281287
Oman 35489 Yemen 258808

Afghanistan 34937 Thailand 223443
Qatar 34093 Tanzania 197691
Taiwan 25198 Oman 184962
Djibouti 25000 Djibouti 169951
Sri Lanka 18262 Philippines 96171
Yemen 17077 Qatar 62882
Total for Others 709931 Total for Others 3461420
Others Not Listed 37513 Others 374223
Grand Total 747609 Grand Total 3835643
Note: 1 Trade figures in the PSD includes wheat products.
2 Provisional data for the period April thru November 2012
Source: Global Trade Atlas & Directorate General of Commercial Intelligence, GOI
Commodities:
Production:
Assuming a normal southwest monsoon this summer, India’s MY 2013/14 (October/September) rice
output is forecast higher at 102.0 million tons from 44.5 million hectares, marginally higher than the
revised MY 2012/13 production of 100.0 million tons. Despite “delayed and erratic” 2012 monsoon
rains, rice farmers realized good returns due to firm domestic paddy (unmilled) rice prices and good
yields. The expectation of a further increase in the minimum support price (MSP) of paddy rice should
encourage farmers to continue to plant rice in the upcoming season upon the onset of 2013 monsoon.
The government’s continued focus on expanding Green Revolution technology in the rice growing
regions of eastern India through promotion of hybrid rice cultivation, intensification techniques and
other modern production techniques support a MY 2013/14 near-record production forecast of 102.0
million tons (vs. 105.3 million tons record production in MY 2011/12). However, a timely and well
distributed (over country and crop season) 2013 monsoon would be critical as a poor/erratic monsoon
could bring down the crop significantly by 10-12 million tons from the forecast level.
Notwithstanding the delayed 2012 monsoon rains and dry conditions in states like Karnataka,
Maharashtra, and Gujarat, the government’s recently released second advance estimate placed MY
2012/13 rice production at 101.8 million tons ( 90.7 million ton kharif rice and 11.1 million tons rabi
rice). Losses due to “below normal” monsoon rains could have been higher but for the good late season
rains and favorable growing conditions supporting a higher kharif (fall/early winter harvested) rice crop
in the major rice belt of north and eastern India. However, planting of rabi (winter) rice is currently
lagging behind last year’s level and some of the growing areas are facing severe soil moisture stress.
Consequently, Post estimates MY 2012/13 rice production at 100 million tons (90 million tons kharif
rice and 10 million tons rabi rice), slightly lower than the government estimates. Based on the final
Rice, Milled

estimate from the Ministry of Agriculture, MY 2011/12 rice production estimate is revised higher to a
new record 105.3 million tons (92.75 million tons kharif rice and 12.6 million tons rabi rice).
Rice is the most important food crop of India cultivated nationwide and contributing about 40 percent of
total food grain production. Rice is predominantly a rain-fed crop, planted in the kharif season after the
onset of monsoon in June. However, there is a small rabi crop taken in the states of West Bengal,
Andhra Pradesh, Odisha and Tamil Nadu. Although rice production has also shown a steady upward
trend, production is subject to wide year-on-year fluctuations (compared to wheat), as a significant
portion (42 percent) of the crop is not irrigated.
Source: Ministry of Agriculture, GOI; and FAS/New Delhi estimates for MY 2012/13 and 2013/14.
Rice production has been at or above trend since 2010/11, largely due to the significant increase in
productivity. Nevertheless, Indian rice yields are below the world average, and there is wide variation in
the levels of rice productivity among the major producing states in the country. In 2010/11, the
government launched a Special Program to Bring the Green Revolution to Eastern India by promoting
the Green Revolution and other improved technologies to the eastern region of the country comprising
Bihar, Chhattisgarh, Jharkhand, eastern Uttar Pradesh, West Bengal, and Odisha. The government is
also focusing on developing appropriate technologies to enhance rice productivity under rainfed
conditions. The government is promoting a “System of Rice Intensification” technology in some rice
growing states, which requires less water and chemical fertilizer. The recent productivity gains could be
attributed to the government efforts in raising rice yields in the eastern region.
Many agricultural experts have expressed concerns that the current rice production techniques in India
have serious environmental implications and cannot sustain projected food demand. Surplus rice
growing states like Punjab, Haryana, Uttar Pradesh, and Andhra Pradesh follow intensive rice-wheat or
rice-rice cropping systems, and are facing severe environmental issues, including declining water tables,
deteriorating soil health and emergence of resistant disease/pests in the growing areas. Indian rice
cultivation also faces the challenge of climate change as a significant share of the rice crop is produced
in coastal regions, which are susceptible to a rise in the sea level. Climate change issues like glacier

melting and aberrations in the monsoon rain patterns may also potentially affect the rice crop. However,
a significant cropping shift out of rice is not imminent in the near future due to the government’s
continued emphasis on supporting rice-wheat production through minimum support price (MSP)
procurement and a lack of more profitable crop rotation alternatives.
India’s long-grain Basmati rice is grown mostly in Punjab, Haryana and western Uttar Pradesh, and
production has been steady after the introduction of the PUSA 1121 variety, an evolved high-yielding
variety. Industry sources report Basmati rice production in MY 2012/13 at 7.1 million tons from 1.7
million hectares compared to record production of 7.8 million tons from 1.9 million hectares in MY
2011/12. Basmati growers have realized good prices during the current season on strong export
demand. Consequently, Basmati production in MY 2013/14 is forecast to increase to 8.0 million tons
from 2.0 million hectares.
There are about 50 varieties of hybrid rice, most developed by private seed companies, of which 25-26
are popular in the market. The National Food Security Mission set a target to plant three million
hectares to hybrid rice by 2011-12 in order to achieve an increase in rice production of 10 million metric
tons. Despite a strong government push, area under hybrid rice is estimated at around 1.8 million
hectares in 2012/13, mostly in eastern India: eastern Uttar Pradesh, Bihar, Jharkhand, and
Chhattisgarh. Growth of area under hybrid rice is severely hampered by (i) the inability of the existing
hybrids to cater to the vast diversity in consumer preference for rice, (ii) low incremental yields, and
(iii) poor milling quality over traditional varieties. Nevertheless, several private seed companies and
public sector institutions are developing improved hybrid rice varieties targeting quality and yield
enhancement traits, which should accelerate hybrid rice adoption by Indian farmers. Efforts are also
underway, mostly in the private sector, to develop transgenic rice varieties and hybrids to incorporate
resistance to various pests, diseases and abiotic stresses. However, approvals and commercialization of
transgenic rice are still years away.
Consumption:
Rice is the major staple food for about 65 per cent of the country’s population. Rice consumption in
MY 2013/14 is forecast to increase by three percent to 97 million tons on expected sufficient domestic
supplies and higher sales of government rice through the PDS. However, continued inflationary
domestic rice prices could affect rice consumption in MY 2013/14.

Source: Agmarket News (http://agmarkweb.dacnet.ic.in), Ministry of Agriculture, GOI.
Relatively firm domestic prices are likely to slow down growth in consumption in MY 2012/13.
Domestic rice prices in MY 2012/13 have been fueled by the significant (16 percent) hike in the MSP
for paddy rice and relatively tight domestic supplies (higher government procurement and strong
exports). The government is likely to announce additional rice for distribution through the PDS at
subsidized prices. This will both help reduce “abnormally high” food grain stocks and somewhat
counter upward pressure on prices to consumer. Consequently, rice consumption in MY 2012/13 is
estimated at 94.6 million tons compared to 93.3 million tons in MY 2011/12, a modest increase
compared to previous years. The NSSO surveys show that per-capita household consumption of rice
has been gradually declining in recent years as consumers shift to higher value foods (see IN2026).
More than 4,000 varieties of rice are grown in India to meet the varied consumer preferences. For
government procurement purposes, rice is classified into two categories - Common (length to breadth
ratio less than 2.5) and Grade A (length to breadth ratio more than 2.5). In the past, most rice under the
government procurement program came through a mandatory levy on local millers. Depending on the
state, local rice millers must sell the government a fixed portion of their milled rice (ranging from 75
percent in Punjab and Haryana to 50 percent in Andhra Pradesh, and even lower in marginal surplus
states) at pre-established rates, called the “levy price,” which is linked to the MSP of paddy rice plus
milling costs. With the government’s raising the MSP significantly in recent years, local millers have
reduced their purchases of paddy rice for milling and consequently levy rice supplies. Thus, the
government has been procuring larger quantities of paddy rice bought at the support price, which is
subsequently custom-milled by the government by the private millers at government expense for storage
and distribution through PDS.
Table 6. India: Government’s Rice Procurement and PDS Operation
Marketing
Year Production GOI
Procurement1
MSP for
Paddy
(Unmilled
Rice
Common
GOI
Economic
Cost
Off take
from
GOI
Stocks
PDS Issue Price

variety)
(Oct-Sept) (Million
Tons) (Million
Tons) Rs. per ton Rs. Per
ton (Million
Tons) Rs. per ton
APL BPL AAY
2005/06 91.79 27.58 (30.0) 5,700 13,397 na 7,950 5,650 2,000
2006/07 93.35 25.11 (26.9) 6,200 13,912 na 7,950 4,150 2,000
2007/08 96.69 28.74 (29.7) 7,450 15,499 na 7,950 4,150 2,000
2008/09 99.18 34.10 (34.4) 9,000 17,407 25.69 7,950 4,150 2,000
2009/10 89.09 32.03 (36.0) 10,000 18,201 28.35 7,950 4,150 2,000
2010/11 95.98 34.20 (35.6) 10,000 19,831 31.97 7,950 4,150 2,000
2011/12 104.32 35.03 (33.6) 10,800 21,229 31.44 7,950 4,150 2,000
2012/132 100.00 36.00 (36.0) 12,500 26,960 na 7,950 4,150 2,000
2013/142 102.00 na na na na 7,950 4,150 2,000
Source: Ministry of Agriculture and Food Corporation of India, GOI Notes: Exchange rate Rs. 53.5 = US$ 1 on February 10, 2013 1- Figure in parenthesis is GOI procurement as percentage of total production
2 - FAS/New Delhi estimate
3 - GOI budget estimate, actual expected to be higher
PDS - Public Distribution System; APL - Above Poverty Line; BPL - Below Poverty Line; and AAY -Antyodaya Anna Yojana (Poorest of the Poor)
The government raised the MSP for paddy rice by nearly 16 percent for the MY 2012/13 season, and set
a target of 42 million tons for procurement during the MY 2012/13 season against last year’s record
procurement of 35.0 million tons (see Tables 6 and 17). Government rice procurement as of February 5,
2013, was estimated at 24.0 million tons compared to 22.6 million tons last year during the
corresponding period. The recent increase in the open market price of rice may affect government rice
procurement in coming months. Consequently, total GOI rice procurement in MY 2011/12 is expected
to reach 36.0 million tons, a new record, albeit much lower than the government target. As in the case
of wheat, there has been no increase in the retail price of rice distributed through the PDS since July 1,
2002, while the MSP has more than doubled in the last seven years, contributing to the GOI’s growing
food subsidy budget.
The livestock feed industry uses deoiled rice bran, rice waste from the milling industries, and small
quantities of broken/damaged rice in the poultry and livestock feed sectors. However, there are no
official or industry estimates available of feed consumption.
Trade:
Despite increasing domestic prices, the government is unlikely to impose export controls on non-
Basmati and Basmati rice in the near future on sufficient domestic supplies - bumper production, record
procurement and “more-than-sufficient” government-held rice stocks. Based on the current pace of
exports, MY 2012/13 rice exports are likely to reach 8.0 million tons (4.5 million tons non-Basmati and
3.5 million tons of Basmati rice). Assuming no major change in the rice export policy, India’s rice
exports for MY 2013/14 are forecast lower at 7.0 million (3.5 million tons of Basmati and no-Basmati )
on relatively tight domestic supplies and expected firm domestic prices. An expected increase in the

MSP for the upcoming season will likely further prop up domestic prices, and affect negatively MY
2013/14 export prospects.
India emerged as the world’s leading exporter of rice in MY 2012/13. After the government lifted the
ban on exports of non-Basmati rice in September, Indian non-Basmati rice became very competitive in
the global market. Exports in CY 2012 through November were significantly higher at 9.6 million tons
(see Table 9), which includes 6.5 million tons non-Basmati and 3.1 million tons Basmati. Major export
destinations were Nigeria, Saudi Arabia, Senegal, Iran, Cote d’ Ivoire, UAE, and South Africa. Market
sources report that most African countries have shifted to Indian non-basmati rice on competitive prices
vis-à-vis other origins, particularly parboiled rice.
Based on preliminary official trade data, India’s MY 2012/13 rice exports for the first two months are
estimated at 1.74 million tons compared to 1.42 million tons last year during the same period. Although
official trade data are not available, market sources report that exports of non-basmati rice have slowed
down since January on competition from other origins, particularly for raw rice from Pakistan,
Myanmar and Thailand. See IN3001 for more information on MY 2012/13 rice exports.
Stocks:
Due to strong rice procurement in the ongoing MY 2012/13, government-held rice stocks on February 1,
2013, increased to 35.4 compared to 31.8 million tons at the same time last year. At the current pace of
procurement and off take, government rice stocks on April 1, 2013 are estimated at 37.7 million tons,
more than two and a half times the desired stocks of 14.2 million tons.
Source: Food Corporation of India, GOI

On the expected slowdown in government rice procurement in coming months, government rice stocks
on October 1, 2013 (MY 2010/11 ending stocks) are expected to decline to 21.0 million tons compared
to 23.37 million tons on October 1, 2012.
There is no published information, official or industry, about privately held rice stocks. Industry
sources report privately held MY 2011/12 ending stocks were around 1.7 million tons and will be
slightly lower at 1.5 million tons at the end of MY 2012/13. The rice PS&D table includes both
government stocks and estimated privately held stocks.
Policy:
Production:
The government’s production policy for rice is the same as for wheat. Additionally, the GOI, with the
support of state governments, has undertaken various rice-specific development schemes like the
Special Rice Development Program (SRDP), NFSM, Promotion of Hybrid Rice, etc.
Price/Market Support:
The government also undertakes the domestic price support, procurement and distribution program in
rice similar to wheat. Concerns about price inflation led to the GOI to ban futures trading in rice as of
September 2007.
Trade:
On September 9, 20111, the government lifted the export ban on non-Basmati rice, which had been in
effect since September 2007, with only ad hoc humanitarian exports exempted. Exports of Basmati
rice continued without quantitative restriction throughout the period, subject to a minimum export price
(MEP), which changed from time to time. On July 4, 2012, the government removed the MEP
requirement on exports of Basmati rice.
In March 2008, the GOI removed the import duty on rice. The zero duty is currently effective through
March 31, 2013, although there has been no importation of rice in the recent past.
Marketing:
Indian high-quality Basmati and select premium ‘short grain’ varieties compete against U.S. rice in
several markets, particularly Middle East and European countries.
Production, Supply and Demand Data Statistics:
Table 7. India: Commodity, Rice, Milled, PSD
(Area in thousand hectares and quantity in thousand metric tons)
Rice, Milled
India
2011/2012 2012/2013 2013/2014
Market Year Begin: Market Year Begin: Market Year Begin:

Oct 2011 Oct 2012 Oct 2013
USDA
Official
New
Post
USDA
Official
New
Post
USDA
Official
New
Post
Area Harvested 44,100 44,100 43,000 42,500 44,500
Beginning Stocks 23,500 23,500 25,100 25,100 22,500
Milled Production 104,320 105,310 99,000 100,000 102,000
Rough Production 156,496 157,981 148,515 150,015 153,015
Milling Rate (.9999) 6,666 6,666 6,666 6,666 6,666
MY Imports 0 0 0 0 0
TY Imports 0 0 0 0 0
TY Imp. from U.S. 0 0 0 0 0
Total Supply 127,820 128,810 124,100 125,100 124,500
MY Exports 10,376 10,376 8,000 8,000 7,000
TY Exports 10,250 10,250 7,500 7,500 7,000
Consumption and Residual 92,344 93,334 94,600 94,600 97,000
Ending Stocks 25,100 25,100 21,500 22,500 20,500
Total Distribution 127,820 128,810 124,100 125,100 124,500
Table 8. India: Commodity, Rice, Milled, Prices Table
Prices Table
Country India
Commodity Rice Milled
Prices In Rupees per uom metric tons
Year 2011 2012 %Change
Jan 23578 23105 -2.0
Feb 23998 22764 -5.1
Mar 23507 23193 -1.3
Apr 24369 23750 -2.5
May 23935 23324 -2.6
Jun 24936 22827 -8.5
Jul 20915 22940 9.7
Aug 21872 23918 9.4
Sep 21205 23305 9.9
Oct 22999 24079 4.7
Nov 22548 24406 8.2
Dec 23386 25873 10.6
Exchange Rate 53.5 Local Currency/US$
Date of Quote 02/10/2013 MM/DD/YYYY
National Average Monthly Wholesale Price of Common Rice
Source: Agmarknet, Ministry of Agriculture, GOI.
Table 9. India: Commodity, Rice, Milled, Export Trade Matrix
Export Trade Matrix
Country INDIA
Commodity Rice, Milled

Time Period Jan-Dec Units Tons
Exports for CY 2011 CY 20121
U.S. 90788 U.S. 147710
Others Others
U.A.E 833537 Nigeria 1058788
Saudi Arabia 685078 Saudi Arabia 796239
Iran 557478 Senegal 789820
Nigeria 455682 Iran 777354
Kuwait 223158 Cote D Ivoire 666543
Bangladesh 136703 U.A.E 551146
South Africa 132166 South Africa 345357
United Kingdom 129771 Yemen 207069
Iraq 124990 United Kingdom 205129
Cote D Ivoire 123999 Guinea 234947
Yemen 116251 Kuwait 172794
Total for Others 3518813 Total for Others 5805186
Others Not Listed 1142579 Others 3651659
Grand Total 4752180 Grand Total 9604555
Note: 1 Provisional data for the period January thru November 2012.
Source: Global Trade Atlas & Directorate General of Commercial Intelligence, GOI
Author Defined:
COARSE GRAINS
Production:
Assuming a normal 2013 monsoon and weather conditions during the growing season, MY 2013/14
coarse grain production is forecast higher at 42.2 million tons, compared to a ‘below-normal’ monsoon
affected MY 2012/13 production of 37.9 million tons, on expected higher acreage and improved yields.
If realized, it will be the second-highest coarse grain production slightly lower than the record
production of 43.4 million tons in MY 2010/11. The near-record MY 201/14 coarse grain production
includes a 21.5 million tons of corn, 12.5 million tons of millets, 6.4 million tons of sorghum, and 1.8
million tons of barley. Most coarse grains are cultivated in the kharif (fall and early harvested) season
(75-78 percent), with some corn, sorghum and millets and barley taken as rabi (winter) season crop
under rainfed conditions with only 15 percent of the area under irrigation. Therefore, the performance
of 2013 monsoon rains, both in terms of volume and distribution across the country and period (June-
September) will decide the planting and productivity of the coarse grain crops.
The delayed and uneven 2012 monsoon rains and dry conditions in the states of Maharashtra, Gujarat,
and Karnataka resulted in lower planting of kharif coarse grains, which combined with lower yields has
resulted in a significant decline in kharif coarse grains production. However, sufficient late 2012
monsoon rains (September/October) and relatively firm corn prices have resulted in higher planting of
rabi corn. Consequently, Post’s total coarse grain production estimate for MY 2012/13 is estimated at
37.9 million tons, which includes 20.5 million tons of corn, 10.5 million tons of millets, 5.3 million tons
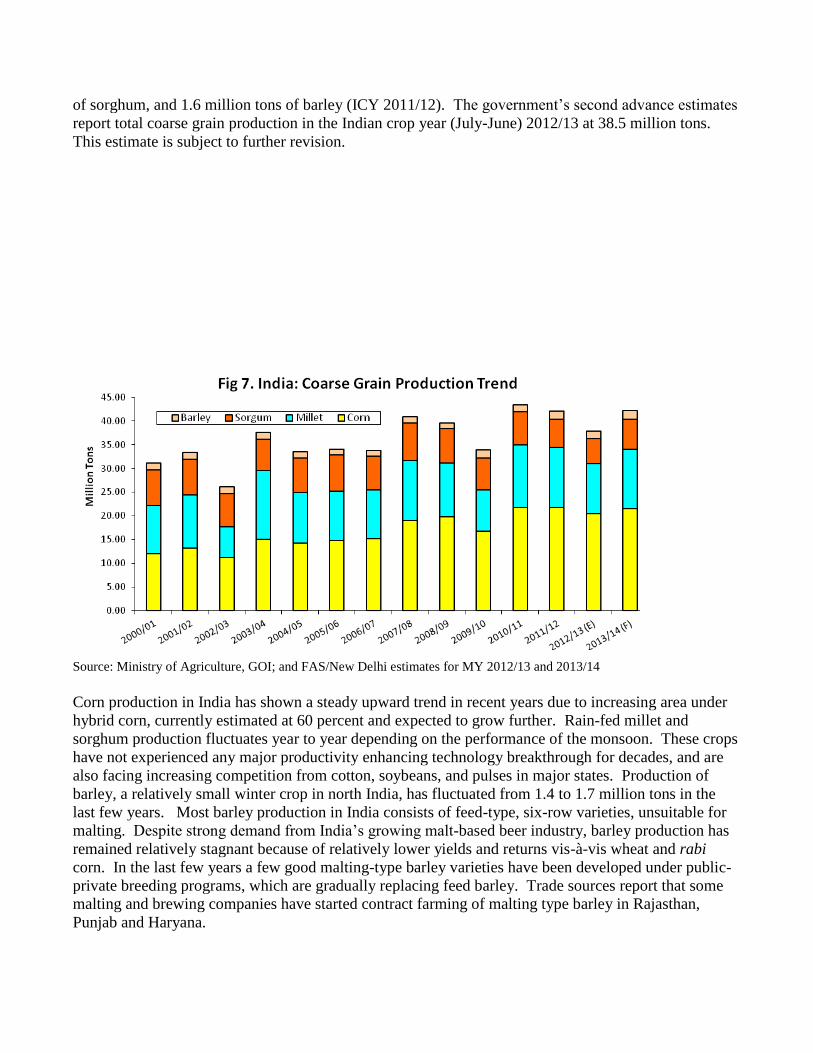
of sorghum, and 1.6 million tons of barley (ICY 2011/12). The government’s second advance estimates
report total coarse grain production in the Indian crop year (July-June) 2012/13 at 38.5 million tons.
This estimate is subject to further revision.
Source: Ministry of Agriculture, GOI; and FAS/New Delhi estimates for MY 2012/13 and 2013/14
Corn production in India has shown a steady upward trend in recent years due to increasing area under
hybrid corn, currently estimated at 60 percent and expected to grow further. Rain-fed millet and
sorghum production fluctuates year to year depending on the performance of the monsoon. These crops
have not experienced any major productivity enhancing technology breakthrough for decades, and are
also facing increasing competition from cotton, soybeans, and pulses in major states. Production of
barley, a relatively small winter crop in north India, has fluctuated from 1.4 to 1.7 million tons in the
last few years. Most barley production in India consists of feed-type, six-row varieties, unsuitable for
malting. Despite strong demand from India’s growing malt-based beer industry, barley production has
remained relatively stagnant because of relatively lower yields and returns vis-à-vis wheat and rabi
corn. In the last few years a few good malting-type barley varieties have been developed under public-
private breeding programs, which are gradually replacing feed barley. Trade sources report that some
malting and brewing companies have started contract farming of malting type barley in Rajasthan,
Punjab and Haryana.

Consumption:
Coarse grain consumption in MY 2013/14 is forecast to increase to 39.1 million tons compared to 35.9
million tons in MY 2011/12 on expected improved domestic production. Coarse cereals are the staple
diet of millions of rural poor in India, particularly in the regions where they are grown. With coarse
grains known for their richer nutrient and fiber contents, their consumption is picking up among the
urban population, particularly “health conscious” and diabetes-prone Indians. Food use accounts for a
major share of consumption of sorghum, millet, and barley, while corn is increasingly being used for
feed, particularly poultry feed. Some new barley varieties are being used for brewing (0.5-0.6 million
tons).
Corn ranks as the third most important grain in India after rice and wheat, because of growing demand
from the animal feed (poultry) and industrial sectors (starch). More than half of the local consumption
goes for feed use (9.4 million tons), primarily for poultry feed, about 1.2 million tons is consumed by
the starch industry, and with the balance for food use. Corn demand from the poultry industry has
recovered in MY 2012/13 and is likely to grow further in 2013/14. Corn demand for starch, mainly
used by the textile industry, has been slightly depressed in MY 2012/13 due to the slowdown in textile
demand. However, the recovery of the global economy is likely to increase demand for starch and
hence corn consumption in MY 2013/14.
Sorghum and millet are largely used for food. Inferior quality products go for cattle feed. The high
tannin content of Indian sorghum restricts its use in poultry rations, but its use in the production of
spirits, industrial alcohol, and starch is reportedly increasing. India does not produce any ethanol for
fuel from cereal grains. Thus, there has been no impact resulting from the domestic ethanol program
(which is based on molasses from sugar) on the domestic market for food, feed and trade of cereal
grains and their byproducts.
Prices
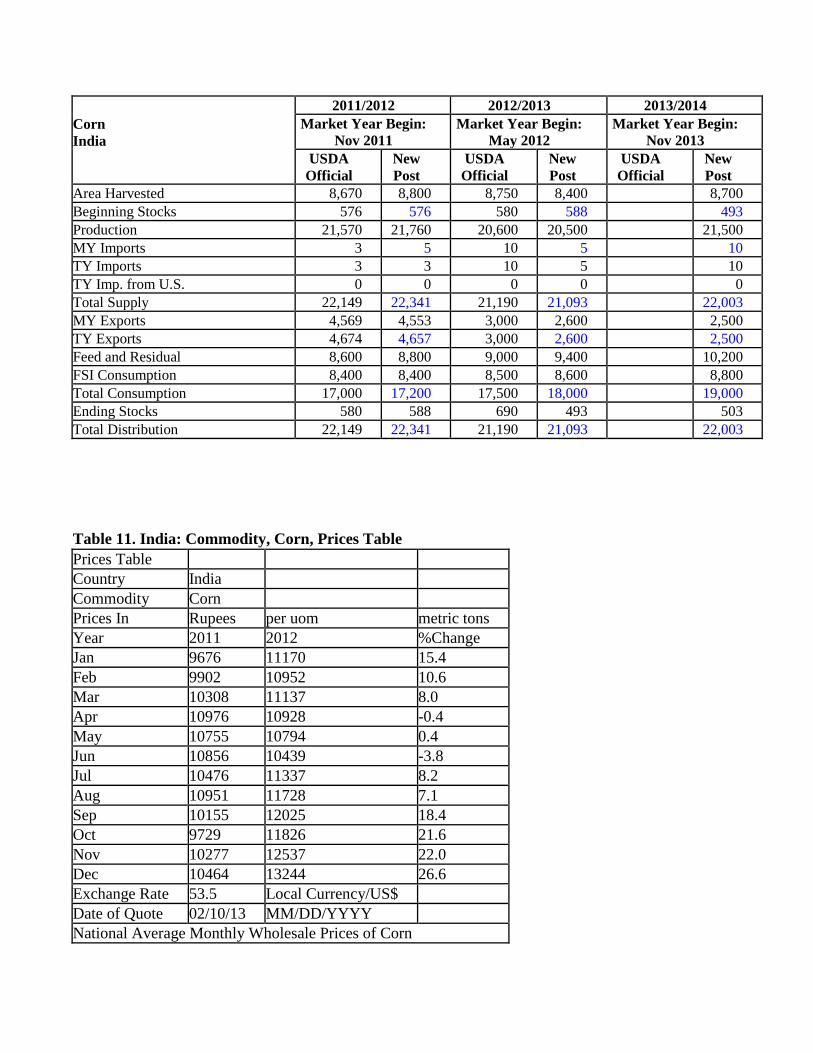
Corn prices have gained strongly in MY 2012/13 on relatively tight domestic supplies and strong
domestic demand, particularly from the poultry sector.

Source: Agmarket News (http://agmarkweb.dacnet.ic.in), Ministry of Agriculture, GOI
Corn prices across the major markets in the first week of February 2013 ranged from Rs. 13,500 ($252)
to 13,900 ($260) per metric ton, about 15-25 percent higher than previous-year prices during the
corresponding period. Prices of other coarse grains have also been significantly higher on lower
production. Sorghum prices across the major markets in the first week of February 2013 ranged from
Rs. 13,750 ($257) to Rs. 17,050 ($319) per metric ton, about 10-20 percent higher than last year, and
pearl millet prices ranged from Rs. 11,990 ($224) to Rs. 13,850 ($258) per metric ton, about 25-40
percent over last year.
Trade:
Assuming the government imposes no export restrictions, India’s corn exports in MY 2013/4 are
forecast lower at 2.5 million tons on expected strong domestic demand. However, corn exports will
largely depend on the price competitiveness of Indian corn in the global market, bearing in mind that
Indian corn is discounted for quality vis-à-vis other origins. India exports most of its corn to southeast
Asian countries like Vietnam, Indonesia, Malaysia, Taiwan, and neighboring Bangladesh.
After record corn exports in MY 2011/12, exports in MY 2012/13 are estimated lower at 2.6 million
tons on relatively tight domestic supplies and weak export demand. Market sources report that Indian
corn is barely competitive in the global market due to the strong surge in domestic prices coupled with
the recent appreciation in the value of the Indian rupee vs. U.S. dollar. Provisional official export
figures for the first two months of MY 2012/13 (October-November 2012) estimate corn shipments at
about 435,000 metric tons compared to 758,000 metric tons during the corresponding period last year.
Market sources report that export shipments during December-January have also been significantly
lower than last year. However, export prospects are likely to improve after the harvest of rabi corn in
March. India’s ability to ship in relatively small lots is also an important selling factor in neighboring
and south Asian markets. Assuming stable global corn prices for the remaining part of the season, MY
2012/13 exports are estimated to reach 2.6 million tons, a 44 percent decrease over the last year’s record
exports.

Policy
Production:
The GOI production policy for coarse grains is similar to that for wheat and rice, except that the focus is
limited on these crops. The government’s MSP procurement program and PDS distribution program for
coarse grain is very limited and less effective than those for rice and wheat. Unlike wheat and rice, the
government does not typically maintain a buffer stock of coarse grains to keep prices in check. The
GOI does not allow use of food grains, including coarse cereals, for ethanol for fuel (see GAIN Report
IN1159). Efforts to produce ethanol from other feed stocks like sweet sorghum stalks and crop waste
are still in an experimental stage.
Trade:
Currently, there are no restrictions on exports of corn, millet, sorghum, or barley, and imports are
allowed subject to the effective import duty and phytosanitary conditions specified in the Plant
Quarantine (Regulation of Imports into India) Order 2003. The basic import duty on sorghum and
millet is 50 percent, and zero for barley. Imports of corn outside the TRQ are subject to a 50 percent
import duty.
India’s existing trade policy allows imports of corn under a tariff rate quota (TRQ) of 500,000 metric
tons at zero duty. To import corn under TRQ at zero duty, the importer must obtain a Tariff Rate Quota
Allocation Certificate issued by the Directorate General of Foreign Trade (DGFT). The Certificate is
issued in accordance with the procedure as may be specified by the EXIM Facilitation Committee from
time to time through a public notice. However, TRQ imports are managed only through specified state
trading enterprises and cooperatives, and thus are not accessible to private trade. The TRQ was not
utilized in 2011/12 and imports under TRQ are unlikely in the coming marketing year.
The GOI’s phytosanitary requirement pertaining to the limitation on weed seeds, ergot and other SPS
issues, and absence of approval of biotechnology events have effectively banned U.S. coarse grain
exports to India, including corn and barley. Imports of any biotech product, including genetically
modified corn and products, are subject to approval by India’s biotech regulatory agency, the Genetic
Engineering Appraisal Committee (GEAC). The GEAC has approved no biotech coarse grains or
byproducts for import.
Marketing
India currently does not import corn or other coarse grains. However, the growth of the poultry and
starch industries may eventually create demand for imported corn, while growth in the brewery industry
may fuel demand for malting barley in future.
Production, Supply, and Demand Data Statistics:
Table 10. India: Commodity, Corn, PSD
Corn
India
2011/2012 2012/2013 2013/2014
Market Year Begin:
Nov 2011
Market Year Begin:
May 2012
Market Year Begin:
Nov 2013
USDA
Official
New
Post
USDA
Official
New
Post
USDA
Official
New
Post
Area Harvested 8,670 8,800 8,750 8,400 8,700
Beginning Stocks 576 576 580 588 493
Production 21,570 21,760 20,600 20,500 21,500
MY Imports 3 5 10 5 10
TY Imports 3 3 10 5 10
TY Imp. from U.S. 0 0 0 0 0
Total Supply 22,149 22,341 21,190 21,093 22,003
MY Exports 4,569 4,553 3,000 2,600 2,500
TY Exports 4,674 4,657 3,000 2,600 2,500
Feed and Residual 8,600 8,800 9,000 9,400 10,200
FSI Consumption 8,400 8,400 8,500 8,600 8,800
Total Consumption 17,000 17,200 17,500 18,000 19,000
Ending Stocks 580 588 690 493 503
Total Distribution 22,149 22,341 21,190 21,093 22,003
Table 11. India: Commodity, Corn, Prices Table
Prices Table
Country India
Commodity Corn
Prices In Rupees per uom metric tons
Year 2011 2012 %Change
Jan 9676 11170 15.4
Feb 9902 10952 10.6
Mar 10308 11137 8.0
Apr 10976 10928 -0.4
May 10755 10794 0.4
Jun 10856 10439 -3.8
Jul 10476 11337 8.2
Aug 10951 11728 7.1
Sep 10155 12025 18.4
Oct 9729 11826 21.6
Nov 10277 12537 22.0
Dec 10464 13244 26.6
Exchange Rate 53.5 Local Currency/US$
Date of Quote 02/10/13 MM/DD/YYYY
National Average Monthly Wholesale Prices of Corn

Source: Agmarknet, Ministry of Agriculture, GOI.
Table 12: India: Commodity, Sorghum, PSD
Sorghum
India
2011/2012 2012/2013 2013/2014
Market Year
Begin: Nov 2011 Market Year
Begin: Nov 2012 Market Year
Begin: Nov 2013
USDA
Official New
Post USDA
Official New
Post USDA
Official New
Post Area Harvested 6,330 6,350 6,300 6,200 6,800
Beginning Stocks 327 327 123 103 103
Production 6,030 6,010 6,000 5,300 6,400
MY Imports 0 0 0 0 0
TY Imports 0 0 0 0 0
TY Imp. from U.S. 0 0 0 0 0
Total Supply 6,357 6,337 6,123 5,403 6,503
MY Exports 134 134 25 0 50
TY Exports 132 131 25 0 50
Feed and Residual 1,100 1,100 1,000 800 1,100
FSI Consumption 5,000 5,000 5,000 4,500 5,000
Total Consumption 6,100 6,100 6,000 5,300 6,100
Ending Stocks 123 103 98 103 353
Total Distribution 6,357 6,337 6,123 5,403 6,503
Table 13: India: Commodity, Millet, PSD
Millet
India
2011/2012 2012/2013 2013/2014
Market Year Begin:
Nov 2011 Market Year Begin:
May 2012 Market Year Begin:
Nov 2013
USDA
Official New
Post USDA
Official New
Post USDA
Official New
Post
Area Harvested 10,800 10,680 8,500 9,100 11,000
Beginning Stocks 990 990 790 650 250
Production 12,800 12,660 10,000 10,500 12,500
MY Imports 0 0 0 0 0
TY Imports 0 0 0 0 0
TY Imp. from U.S. 0 0 0 0 0
Total Supply 13,790 13,650 10,790 11,150 12,750
MY Exports 0 0 0 0 0
TY Exports 0 0 0 0 0
Feed and Residual 1,500 1,500 1,200 1,400 1,600
FSI Consumption 11,500 11,500 9,300 9,500 10,600
Total Consumption 13,000 13,000 10,500 10,900 12,200
Ending Stocks 790 650 290 250 550
Total Distribution 13,790 13,650 10,790 11,150 12,750
Table 14: India: Commodity, Barley, PSD

Barley
India
2011/2012 2012/2013 2013/2014
Market Year
Begin: Apr 2011 Market Year Begin:
May 2012 Market Year
Begin: Apr 2013
USDA
Official New
Post USDA
Official New
Post USDA
Official New
Post Area Harvested 780 780 770 780 790
Beginning Stocks 178 178 263 243 153
Production 1,660 1,660 1,610 1,620 1,800
MY Imports 0 0 0 0 0
TY Imports 0 0 0 0 0
TY Imp. from U.S. 0 0 0 0 0
Total Supply 1,838 1,838 1,873 1,863 1,953
MY Exports 25 45 25 60 50
TY Exports 25 38 25 60 50
Feed and Residual 250 250 280 250 300
FSI Consumption 1,300 1,300 1,400 1,400 1,450
Total Consumption 1,550 1,550 1,680 1,650 1,750
Ending Stocks 263 243 168 153 153
Total Distribution 1,838 1,838 1,873 1,863 1,953
PULSES
Production
India’s MY 2013/14 (Apr/Mar) pulse production is forecast at 17.0 million tons, marginally lower than
MY 2012/13 production of 17.1 million tons due to lower acreage. Delayed and erratic 2012 monsoon
rains and subsequent dry conditions in some states affected planting of kharif pulses (mostly pigeon pea,
mung beans, and black matpe). The government provisionally estimates kharif pulses to decline to 5.5
million tons from last year’s 6.1 million tons in MY 2011/12, and record production of 7.1 million tons
in MY 2011/12. According to the preliminary official planting figures, area under rabi pulses (mainly
chickpeas, lentils, and peas) up to February 8, 2013, is estimated higher at 14.8 million hectares, slightly
higher than last year’s 14.7 million hectares. Soil moisture and weather conditions have been generally
favorable in most growing areas, particularly for chickpeas. Unlike previous years, there have been no
reports of crop damage due to late season rains and frost in central India. Consequently, rabi pulse
production is estimated higher at a record 11.5 million tons compared to 11.0 million tons last year, with
most increase accounted by chickpeas, forecast at a record 8.4 million tons.

Source: Ministry of Agriculture, GOI; and FAS/New Delhi estimates for MY 2013/14
India is the world’s largest producer, consumer and importer of pulses as they are the major protein
source in the largely vegetarian Indian diet. Pulses are grown both in the kharif (1/3) and rabi (2/3)
seasons. With nearly 84 percent of pulse cultivation in rainfed conditions using subsistence agricultural
practices, pulse production depends largely on the monsoon and winter rains. Limited varietal
improvements, low resilience to soil moisture stress, poor pest resistance, and low input use have
contributed to poor yields. Madhya Pradesh, Uttar Pradesh, Maharashtra, Andhra Pradesh, and
Karnataka together account for about 70 percent of the country’s pulse production, with Madhya
Pradesh contributing more than 25 percent. The government has raised the minimum support prices
(MSPs) for pulses relatively higher than for rice and wheat in the last two years (see Table 17) to
encourage a production shift away from rice and wheat. However, pulse production has failed to
respond to the relatively higher MSPs and open market prices due to competition from less risky crops
like wheat and rice. Pulse production has not been attractive to farmers due to low government support
of improved production technology and a largely ineffective procurement policy vis-à-vis wheat and
rice.
Consumption
Economic growth has fueled increased pulse consumption in recent years. Consumption in MY
2013/14 is forecast higher at 21.5 million tons on continued strong domestic demand and expected
stronger imports. Consumption in MY 2012/13 is estimated at 20.5 million tons, including 3.8 million
tons of imported pulses.
Pulses are an important component of the diets of the predominantly vegetarian Indian population.
Pulses are one of the cheapest protein sources in an average Indian’s diet. One kg of any pulse costing
less than $2 can be the protein source for 3-4 meals for a family of five. Due to increasing demand and
purchasing power of Indian consumers, market prices of pulses in the last few years have been relatively
firm compared to cereals and vegetable oils.
Stagnating domestic production over the last two decades has forced India to augment its domestic
consumption needs from the global market. However, the global availability of pulses traditionally
preferred by the Indian consumers, such as pigeon peas, mung beans, black matpe, etc., are limited to a
few neighboring suppliers like Myanmar and African countries. Higher prices of traditional pulses have
forced Indian consumers to shift to non-traditional imported pulses like yellow peas and dung peas
(Australia) as a low-cost substitute. In the last few years, government agencies have imported large
quantities of yellow peas to be made available through various government distribution networks at
subsidized prices. Yellow pea consumption is being promoted by the government to popularize yellow
pea dal (split pulses) as a pulse with “high nutritive value.”
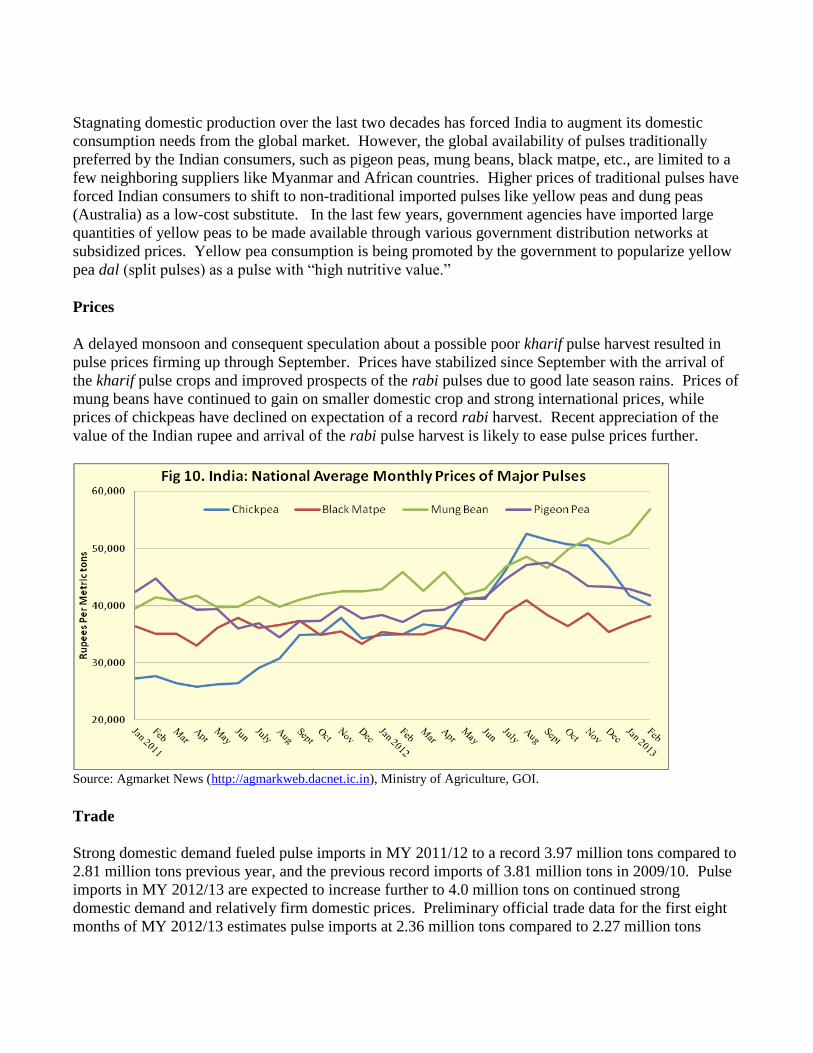
Prices
A delayed monsoon and consequent speculation about a possible poor kharif pulse harvest resulted in
pulse prices firming up through September. Prices have stabilized since September with the arrival of
the kharif pulse crops and improved prospects of the rabi pulses due to good late season rains. Prices of
mung beans have continued to gain on smaller domestic crop and strong international prices, while
prices of chickpeas have declined on expectation of a record rabi harvest. Recent appreciation of the
value of the Indian rupee and arrival of the rabi pulse harvest is likely to ease pulse prices further.
Source: Agmarket News (http://agmarkweb.dacnet.ic.in), Ministry of Agriculture, GOI.
Trade
Strong domestic demand fueled pulse imports in MY 2011/12 to a record 3.97 million tons compared to
2.81 million tons previous year, and the previous record imports of 3.81 million tons in 2009/10. Pulse
imports in MY 2012/13 are expected to increase further to 4.0 million tons on continued strong
domestic demand and relatively firm domestic prices. Preliminary official trade data for the first eight
months of MY 2012/13 estimates pulse imports at 2.36 million tons compared to 2.27 million tons

during the same period last year. Imports are forecast to remain strong in MY 2013/14 provided
international prices and the value of Indian rupee remain stable.
Table 15: India: Imports of Pulses by Type and Major Suppliers
(Quantity in thousand Metric Tons)
Type 2009/10 2010/11 2011/12 Major Suppliers
Dry Peas 1,655.6 1,504.6 2,039.4 Canada, Russia, Australia, USA, France, Ukraine
Pigeon Peas 389.3 346.1 470.8 Myanmar, Tanzania, Mozambique, China, Malawi
Mung Beans 706.2 432.0 429.4 Myanmar, China. Australia, Tanzania, Mozambique
Chickpeas 338.4 100.7 208.9 Australia, Myanmar, Tanzania, China, USA, Russia
Lentils 288.1 161.2 117.9 Canada, USA, Australia, Nepal, China
Kidney Beans 84.7 105.6 63.1 China, Myanmar, Ethiopia, USA
Other Beans 58.0 73.0 128.4 Myanmar, China, Madagascar, Brazil
Other Dried Legumes 287.7 127.7 513.9 Myanmar, Tanzania, Mozambique, China, Malawi
Total 3,808.0 2,851.0 3,971.9 Source: Directorate General of Commercial Intelligence, GOI
India imports dry green peas, yellow peas, lentils and garbanzo beans (chickpeas) from the United
States, which are typically higher-priced. Imports of pulses from the United States had grown strongly
from 2005 to 2009, reaching a record level of 224,250 metric tons in CY 2009, subsequently declining
to 167,209 metric tons in CY 2012. Nevertheless, India remains the second largest export market for
U.S. pulses after Mexico.
Policy
Production:
Traditionally, the GOI’s food grain production programs have focused on rice and wheat, with limited
investment in pulses. Stagnating domestic production, rising imports and escalating domestic prices
have forced the government to assess strategies for enhancing domestic production of pulses. Pulses
were included in the government’s National Food Security Mission. The government also launched a
focus program in targeted 60,000 villages in unirrigated areas for increasing pulse crop productivity and
strengthening market linkages.
Market Support/Intervention:
Over the last three years, the government raised the MSP of various pulse crops by 50 to 100 percent
over MY 2009/10 levels to promote pulse cultivation over rice and wheat (see Table 17). The Indian
government has also disallowed futures trading in pigeon pea and mung beans until further notice under
the erroneous assumption that futures contract trading is responsible for the high prices of pulses.
Several state governments have imposed stocks limits on pulses held by the private trade in an effort to
control the price rise.
The GOI has authorized government agencies/trading companies such as National Agriculture
Marketing Federation (NAFED), State Trading Corporation (STC), Project and Equipment Corporation
(PEC) Ltd., and Mineral and Metal Trading Corporation (MMTC) to import pulses for sale in the

domestic market at subsidized prices. In October 2012, the government approved distribution of
imported pulses through the PDS with a subsidy of Rs. 20 per kilogram ($374 per ton) to the designated
importing agencies. See GAIN report IN2140.
Trade:
In June 2006, the GOI exempted pulses from the applicable 10-percent import duty through March 31,
2009, to control prices in the domestic market. This exemption has been periodically extended and is
currently applicable till March 31, 2013. At the same time, the GOI also imposed a ban on the export
of pulses, with the exception of large chickpeas or garbanzos, called Kabuli chana in Hindi, which has
been periodically extended and is currently applicable till March 31, 2013. The government is
expected to extend the current export bans and imports at zero duty for another year, i.e., until March
31, 2014.
Effective January 1, 2004, pulse (including chickpeas, peas and lentils) imports from all origins to India
were subject to fumigation by methyl bromide at the port of loading, apparently to protect domestic
production from stem and bulb nematode, pea cyst nematode, and bruchids, per the Plant Quarantine
Regulation of Import into India Order, 2003. As methyl bromide is being phased out due to
environmental concerns in most countries, it is increasingly difficult and costly to fumigate pulses with
methyl bromide at the port of origin in many countries. However, the GOI has allowed fumigation by
methyl bromide at the port of arrival in India on an ad hoc basis, granting periodic extensions. The
GOI has granted the methyl bromide fumigation on arrival arrangement for pulses coming from the
United States up to March 31, 2013, which is likely to be extended further.
Marketing
Due to stagnant domestic production and limited scope for increasing area under pulses, India will be a
growing import market for pulses in coming years. However, India is a ‘price buyer’ of pulses with
some resistance to the premium for higher U.S. quality products, especially when lower-cost pulses are
available from other competitors. Key to improving the U.S. position in the Indian pulse market is
expanding the supply of yellow peas and chickpeas at competitive prices. Most U.S. type beans (navy
beans, black beans, pintos, and lima beans) are relatively unknown in India, but can be introduced if
price competitive.
The GOI is encouraging Indian companies to explore opportunities to produce pulses overseas, either
through contract farming or by purchasing/leasing land in several African and South American
countries.
Statistical Tables
Table 16: India: Production of Pulses by Type
(Quantity in thousand Metric Tons)
Pulse\Year 2001/02 2005/06 2009/10 2010/11 2011/12 2012/13 2013/14 (F)
Chick Pea 3.85 5.47 7.06 7.48 8.22 7.70 8.40
Pigeon Pea 2.25 2.35 2.27 2.46 2.86 2.65 2.60
Black Matpe 1.29 1.33 1.17 1.23 1.76 1.77 1.70

Mung Beans 1.03 1.06 1.04 0.69 1.80 1.63 1.25
Others 2.65 2.92 3.03 2.80 3.60 3.34 3.05
Total 11.07 13.13 14.57 14.66 18.24 17.09 17.00
Source: Ministry of Agriculture, GOI; and FAS/New Delhi estimates for MY 2013/14
Table 17. India: Minimum Support Prices for Major Food Grains (Rs/Metric tons)
Crop 2008/09 2009/10 2010/11 2011/12 2012/13
Rice, paddy (common) 9,000 10,000 10,000 10,800 12,500
Rice, paddy (Grade A) 9,300 10,300 10,300 11,100 12,800
Wheat 10,000 10,800 11,000 11,200 12,850
Corn 8,400 8,400 8,800 9,800 11,750
Sorghum (hybrid) 8,400 8,400 8,800 9,800 15,000
Pearl millet 8,400 8,400 8,800 9,800 11,750
Spiked millet 9,150 9,150 9,650 10,500 15,000
Barley 6,500 6,800 7,500 7,800 9,800
Chickpeas 16,000 17,300 17,600 21,000 28,000
Lentils 17,000 18,700 18,700 22,500 28,000
Pigeon peas 20,000 23,000 30,000 32,000 38,500
Mung beans 25,200 27,600 31,700 35,000 44,000
Black matpe (black gram) 25,200 25,200 29,000 33,000 43,000
Exchange Rate – Rs. /USD 45.99 47.42 45.58 51.00 53.5
Source: Department of Agriculture and Cooperation, Ministry of Agriculture, GOI