
INDIA CALLING 2009 · Major Port No. of projects Investment Kolkata & Haldia 35 1510 Paradip 28 558...
25
INDIA INDIA CALLING CALLING 2009 2009 ‘ ‘ PORT LOGISTICS AND INFRASTRUCTURE DEVELOPMENT IN INDIA PORT LOGISTICS AND INFRASTRUCTURE DEVELOPMENT IN INDIA ’ ’ By RAHUL ASTHANA CHAIRMAN, MUMBAI PORT TRUST, BRUSSELS, 1st OCTOBER 2009
Transcript of INDIA CALLING 2009 · Major Port No. of projects Investment Kolkata & Haldia 35 1510 Paradip 28 558...

INDIAINDIA CALLINGCALLING 20092009‘‘PORT LOGISTICS AND INFRASTRUCTURE DEVELOPMENT IN INDIAPORT LOGISTICS AND INFRASTRUCTURE DEVELOPMENT IN INDIA’’
By
RAHUL ASTHANACHAIRMAN,
MUMBAI PORT TRUST,
BRUSSELS, 1st OCTOBER 2009

India India –– Giant StridesGiant Strides
• Sustained high GDP growth 9% in 2007-08. 2008-09 - 6.7%; 2009-10 – 8%
• First in growth of FDI flow among countries in the region
• Second in International Trade growth in the region
• 4th in Purchasing Power Parity – next to USA, China and Japan
• Huge domestic market with large population–definite inward growth
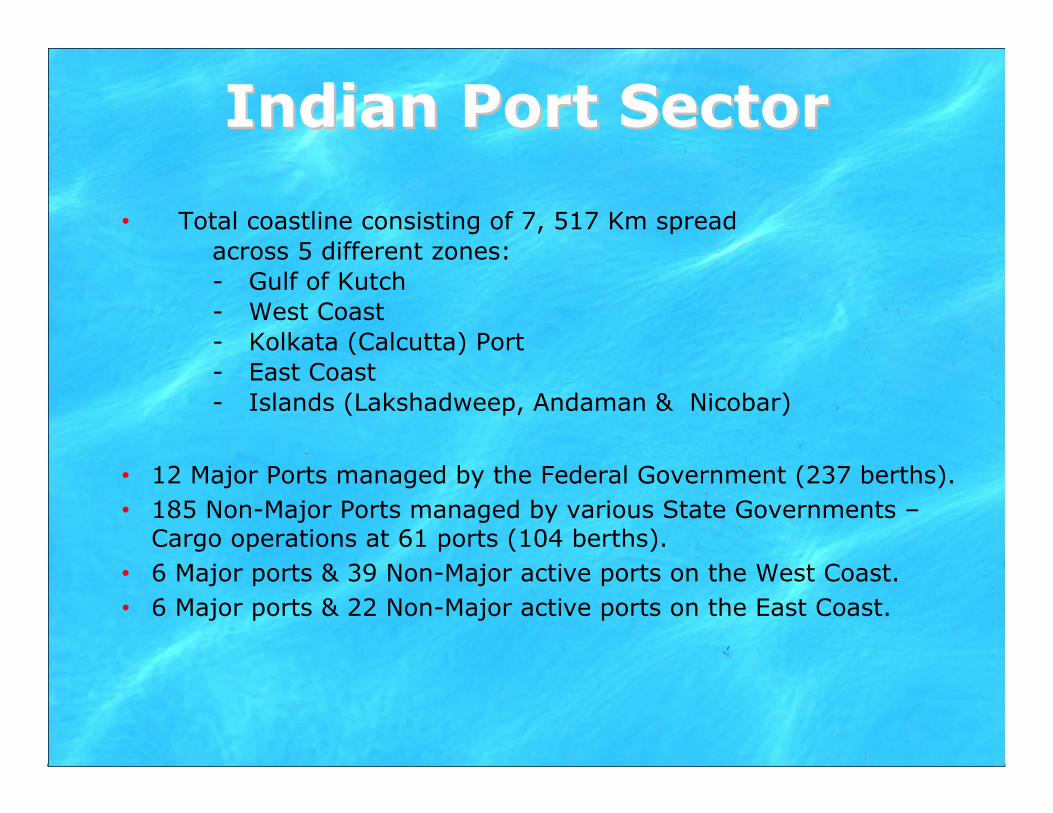
Indian Port SectorIndian Port Sector
• Total coastline consisting of 7, 517 Km spreadacross 5 different zones:- Gulf of Kutch- West Coast- Kolkata (Calcutta) Port- East Coast- Islands (Lakshadweep, Andaman & Nicobar)
• 12 Major Ports managed by the Federal Government (237 berths).• 185 Non-Major Ports managed by various State Governments –
Cargo operations at 61 ports (104 berths).• 6 Major ports & 39 Non-Major active ports on the West Coast.• 6 Major ports & 22 Non-Major active ports on the East Coast.


Contours of PresentationContours of Presentation
• Traffic Projections
• Port Capacity
• National Maritime Development Programme
2006-07- 2013-14
• Investments through Public Private
Participation

• 1950-1990 CAGR was 5.2% pa, mainly at major ports• From 1991, post economic liberalisation,in span of 10yrs, traffic
- Nearly doubled at major ports- Increased seven times at non-major ports
• Private section participation in port sector took off in 2000 • Projected CAGR-10%
Time Period
Pre-Liberalisation
Pre-Private Sector Participation
Post-Private Sector Participation
(in Million Tonnes)
0
200
400
600
800
1000
1200
1400Non Major Ports
Major Ports
Total
1950-511990-91 2000 -01 2005 -06 2011-12 2013-14
Traffic Trends Traffic Trends --Through the Century

Years
Traf
fic (i
n m
illio
n to
nnes
)
Series1 Series2
Series3
0
100
200
300
400
500
600
700
800
Years
Traf
fic (i
n m
illio
n to
nnes
) Non Major PortsMajor PortsTotal
Traffic GrowthTraffic GrowthPresent Decade
(Source : Indian Ports Association)
8728
136
8
2001-02
105
314
419
2002-03
115
345
460
2003-04
130
384
514
2004-05
147
417
564
2005-0618
646
465
0
2006-07
204
519
723
2007-08
202
530
732
2008-09

Commodity ShareCommodity Share 2008-09
OTHER15%
CONTAINER18%
COAL13%
POL33%FERTILIZERS
3%
IRON ORE18%

Traffic GrowthTraffic Growth
Commodity Traffic2007-08
Projected Traffic 2011-12
Projected Traffic 2013-14
POL 263 378 466
Iron ore 127 128 140
Coal 80 139 180
Container(MTEUs)
103(7.51)
170 (14)
241(20)
Other Cargo 150 194 198
TOTAL 723 1009 1225

Contours of PresentationContours of Presentation
• Traffic Projections
•• Port CapacityPort Capacity
• National Maritime Development Programme
2006-07- 2013-14
• Investments through Public Private
Participation

Capacity AppraisalCapacity Appraisal
CommodityPresent capacity2006-07
Projected traffic
2011-12
Projected traffic
2013-14
Capacity addition planned
Capacity in 2014
Major Ports 508 708 834 493 1002
Non-Major Ports
228 300 391 345 573
Total 736 1008 1225 838 1575
• All New Berths to have minimum 14m. Draught
• Current Berths to be upgraded up to 14m. Draught, wherever feasible
• Improved Port Connectivity – Rail and Road
• Improved Efficiency – hi-tech mechanisation and automation
Target : World Class Ports
In million tonnes

Commodity Presentcapacity2006-07
Projected traffic
2011-12
Projected traffic
2013-14
Capacity addition planned
Capacity in 2014
POL 189 378 254 105 294
Iron Ore 56 128 110 66 122
Coal 46 139 141 69 115
Container(million TEU)
85(7.07)
170(14.23)
194(16)
138(11.55)
224(18.62)
Other Cargoes 133 194 135 115 247
Total 509 708 834 493 1002
Capacity Plan Capacity Plan -- Major PortsMajor Ports
• Capacity addition planned at all 12 major ports
• Capacity target :1.3 times the projected traffic
In million tonnes

Capacity Capacity PlanPlan –– Non Major PortsNon Major Ports
• Includes setting up of new ports and captive jetties and upgradationof present landing places
In million tonnes
Name of State/UT Present Capacity Capacity Addition
Andhra Pradesh 18 84
Gujarat 182 56
Maharashtra 11 85
Tamil Nadu 1 29
Karnataka 4 26
Orissa - 13
Goa 12 4
Kerala - 28
West Bengal - 8
Pondicherry - 12
Total 228 345

Contours of PresentationContours of Presentation
• Traffic Projections
• Port Capacity
•• National Maritime Development National Maritime Development
ProgrammeProgramme 20062006--0707-- 20132013--1414
• Investments through Public Private
Participation

NMDP NMDP -- Major Ports Major Ports ––Infrastructure Projects
Major Port No. of projects Investment
Kolkata & Haldia 35 1510
Paradip 28 558
Visakhapatnam 38 610
Ennore 14 1504
Chennai 14 522
Tuticorin 24 1063
Cochin 14 1842
New Mangalore 20 1662
Mormugao 12 188
Mumbai 14 644
JNPT 32 1692
Kandla 26 1182
Total 276 12977
In US $ million

NMDP NMDP –– NonNon--Major Ports Major Ports ––Infrastructure Projects
Capacity(Metric Tonnes) Estimated Cost Private Investment
345 7220 5971
In US $ million
• Proposals include upgradation of existing small ports and development of greenfield port along with realted infrastructure.
Contours of PresentationContours of Presentation
• Traffic Projections
• Port Capacity
• National Maritime Development Programme
2006-07- 2013-14
•• Investments through Public Private Investments through Public Private
ParticipationParticipation

PPP PPP Guidelines
• For the first time – addressed in a holistic manner – investor friendly
• Foreign Direct Investment – 100%• BOT/Joint Venture /Collaboration with Ports• Open competitive bidding• All areas – port development and operation
– except common user infrastructure• License period 30 years• Revenue share model• Availability of Viability Gap Funding

PPPPPPRegulatory Framework
• Independent Tariff Regulatory Authority• Upfront Tariff fixation–normative cost based
approach with annual escalation indexed to inflation
• Tariff act as ceiling rates
• Approved standard concession document• Standing Public Private Partnership
Appraisal Committee for projectappraisal and clearance

TrailblazersTrailblazersMajor Ports
• 16 terminals adding 95 mt capacity –Investment US$ 1082 - Container – 6 terminals at 5 ports – 52 mtInvestors – DP World at JNP, Chennai & Visakhapatnam
Maersk at JNPPSA at Tuticorin
- POL - 5 terminals at 3 ports – 29 mt- Others - 5 terminals including 1 for coal – 15mt
• - CFS - at Kandla
• Awarded 12 Projects - capacity – 106 mt
Investment – US$ 1195 million
- Container – Cochin/Vallarpadam – DP World - US$ 441m
Mumbai – Dragados SPL – US$ 304m
Chennai – SICAL – US$102m
- Iron ore – 2 berths capacity –22mt – US$ 227 m
- Others - 7 berths of capacity – 24 mt – US$ 167 m

TrailblazersTrailblazersNon Major Ports
Port Developer CostUS $mn
Status
Pipavav GMB Maersk -- First PPP Port since 1996
Mundra Adani Ports Ltd -- Commenced operations in 1998
Kakinada International Sea Ports Ltd -- Berths under PPP since 1999
Krishnapatnam
Navayuga Engg 21 Commenced operations in July 2008
Gangavaram DVS-Raju 354 Commenced operations in July 2009
Machalipatnam Maytas - Infra 312 Projects awarded and to commence in near futureDhamra L & T and Tata Steel 512
Gopalpur Noble Group Ltd & Others
375
Kulpi D P World 21

(US$ m)
On the HorizonOn the Horizon
Port Project Capacity Cost
JNP 4th Container Terminal 4.8m TEUs 1400
330m Container Terminal 0. 8m TEUs 125
Chennai Mega Container Terminal 48m tonnes 768
Dry Port & Logistic Park 30 m tonnes 38
New Mangalore
Container Terminal 36 m tonnes 208
Paradip Coal Berth 10m tonnes 100
Kandla Berthing facilities near Tuna 12m tonnes 103
SPM off Veera 9 m tonnes 184
Vizhinjam Transhipment Port 5.3mTEUs 1115
• Many more projects at both major and non major ports

ChoicesChoices
• Dredging – Deepening of channels• Port Development – Terminals, equipment,
navigation aids• Connectivity – rail/road• Hinterland – Industries, SEZs• Outsourcing – All areas of production
and imports with valueadded services

Welcome aboardWelcome aboardNamaskarNamaskar

Major Ports Major Ports –– Business PlansBusiness Plans• Study by Consultants for each Port , guided by
Rotterdam Port Authority• Covers vision to 2025 : identifies areas for development,
diversification and outsourcingTraffic Forecast for 2025Traffic Forecast for 2025
Commodity Projected Traffic
POL 336
Iron Ore 140
Coal 189
Container 680
Other Cargoes 250
Total 1595
In million tonnes


