Indhu Final
73
1 BONAFIDE CERTIFICATE Certified that this project report titled “A Study On Brand preference With Special Ref eren ce to Pioneer Bak es(P ) Ltd, Gobi” is the bonafi de wor k of Mis s.I NDHUMATHI (Re gis tr ati on Number :(3 5109 1026 8) who car rie d out the res ear ch unde r my sup ervisi on. Certified further, that to the best of my knowledge the work reported herein does not form part of any other project report or dissertation on the basis of which a degree or award was conferred on an earlier occasion on this or an y other candidate. Supervisor Head of the Department Submitted to Project and Viva Examination held on ____________ Internal Examiner External Examiner
-
Upload
sangeethas32 -
Category
Documents
-
view
221 -
download
0
Transcript of Indhu Final

8/6/2019 Indhu Final
http://slidepdf.com/reader/full/indhu-final 1/73
1
BONAFIDE CERTIFICATE
Certified that this project report titled “A Study On Brand preference With Special
Reference to Pioneer Bakes(P) Ltd,Gobi”is the bonafide work of Miss.INDHUMATHI
(Registration Number:(3510910268) who carried out the research under my supervision.
Certified further, that to the best of my knowledge the work reported herein does not form part of
any other project report or dissertation on the basis of which a degree or award was conferred on
an earlier occasion on this or any other candidate.
Supervisor Head of the Department
Submitted to Project and Viva Examination held on ____________
Internal Examiner External Examiner
8/6/2019 Indhu Final
http://slidepdf.com/reader/full/indhu-final 2/73
2
DECLARATION
I, INDHUMATHI, a bonafide student of the SRM University, here by declare that the
project titled “A STUDY ON BRAND PREFERENCE WITH SPECIAL
REFERENCE TO PIONEER BAKES (P) LTD,GOBI” submitted in partial
fulfillment to the requirement of summer project of the degree of Master of Business
Administration of the SRM University in the area of Marketing Management is my
original work.
.
Date:
Place: Chennai Signature
8/6/2019 Indhu Final
http://slidepdf.com/reader/full/indhu-final 3/73
3
ACKNOWLEDGEMENT
INDHUMATHI

8/6/2019 Indhu Final
http://slidepdf.com/reader/full/indhu-final 4/73
4
ABSTRACT
The project titled a study on brand preference with special reference to pioneer
bakes(p)ltd[milka] Gobi brand preference is used to Analyzes the awareness among the
customer towards the product. It also helps to know the current marketable position and
satisfactory level of customers brand the product.
The brand is a name term symbol or design to identity the goods or services and to differentiate
them from those of the competitors American marketing association defines a brand as “The use
of a name item symbol or design or some combination of these to identity.
The products of a certain sellers from those of competitors. A brand identifies the products for
buyers. A seller can earn the good will and have the patronages repeated.
This research is mainly deal with knowing purchase behavior of consumers it focuses on product
output which the customer get from the product. this research is also focus on changing
preference of consumers.
This report will be helpful for retailers and company so that they can understand the consumer
preference and can delight the consumer on more better manner
This study aims to investigate the impact of different product characteristics, such as price
quality, taste, quantity, advertising, packing on consumers purchase behaviors.
In this study descriptive research design is adopted Sample size of 200 is used for this study and
simple random sampling techniques is used for this research. In this study statistical tools like
percentage analysis, weighted average and chi-square analysis are adopted to find out the facts
about the brand preference.
This study seeks to characterize bread brand preference and examine factors associate with it
From the findings and suggestions well given to the company to enhance their brand preference
and make their customers more delighted.

8/6/2019 Indhu Final
http://slidepdf.com/reader/full/indhu-final 5/73
5
TABLE OF CONTENTS
CHAPTER TITLE PAGE NOABSTRACT
LIST OF TABLES
LIST OF FIGURES
1. INTRODUCTION
1.1 INTRODUCTION OF THE PROJECT 1
1.2 NEED OF THE STUDY 3
1.3 SCOPE OF THE STUDY 4
1.4 OBJECTIVES OF THE STUDY 5
1.5 RESEARCH METHODOLOGY 6
1.5.1 RESEARCH 6
1.5.2 RESEARCH DESIGN 61.5.3 AREA OF STUDY 6
1.5.4 DESCRIPTIVE RESEARCH DESIGN 6
1.5.5 SOURCES OF DATA 6
1.5.6 POPULACTION 7
1.5.7 SAMPLE SIZE 7
1.5.8 SAMPLING TECHNIQUES 7
1.5.9 TOOLS FOR ANALYSIS 8
1.6 LIMITATIONS 10
1.7 CHAPTERISATION 11
1.8 LITREATURE REVIEW 12
1.8.(i) BRAND AND BRANDING DEFINED 12
1.8.(ii) FASHION BRAND PREFERENCE 13
1.8.(iii) BRAND 13
1.8.(iv)FUNCTIONS OF BRANDS 14
1.8.(v)IMPORTANCE OF BRANDS 14
1.8.1 PROFILE OF THE COMPANY 15
1.8.2PROFILE OF THE PRODUCT 21
2. DATA ANALYSIS AND INTERPRETATION
2.1 PERCENTAGE ANALYSIS 24
2.2CHI-SQUARE TEST 46
2.2 WEIGHTED AVERAGE 523. SUMMARY &CONCLUSIONS
3.1 FINDINGS 54
3.2 SUGESSTIONS&RECOMMENDATIONS 57
3.3 CONCLUSION 58
APPENDIX 59
REFERENCES 62

8/6/2019 Indhu Final
http://slidepdf.com/reader/full/indhu-final 6/73
6
LIST OF TABLES
S.NO TITLE PAGE
NO2.1 AGE WISE CLASSIFICATION OF THE RESPONDENTS AGE OF
THE RESPONDENTS
24
2.2 SEX OF THE RESPONDENTS 25
2.3 QUALIFICATION OF THE RESPONDENTS 26
2.4 LEVEL OF SATISFACTION TOWARDS MILKA BRAND 27
2.5 STRONG DIFFERENTIATION THIS PRODUCT WHEN
COMPARED WITH OTHER PRODUCTS
28
2.6 KIND OF QUANTITY MOSTLY PREFER TO BUY 29
2.7 PACKING OF THE BRAND LOOKS ATTRACTIVE ANDINFORMATIVE
30
2.8 FACTOR MORE INFLUENCES TO PURCHASE THE PRODUCT 31
2.9 PROMPTNESS OF ACTION TAKEN AS PER CUSTOMER
COMPLAINTS
32
2.10 ADVERTISEMENT IN WHICH MEDIA COME ACROSS MOSTLY 33
2.11 OPINION ABOUT QUALITY OF MILKA BREAD 34

8/6/2019 Indhu Final
http://slidepdf.com/reader/full/indhu-final 7/73
7
2.12 CUSTOMERS WAND OF CHANGE IN MILKA BREAD 35
2.13 ADVERTISEMENT IS NECESSARY FOR MILA BREAD 36
2.14 COST OF MILKA BREAD 37
2.15 AVILABILITY OF MILKA BREAD 38
2.16 FACTORS OF ALTERACTION 39
2.17 LOYALTY OF CUSTOMER TO MILKA BREADS 402.18 PREFER TO BUY MILKA BREADS FOR YOUR REQUIREMENT 41
2.19 COMPARING WITH OTHER BRANDS PIONEER MILKA BREAD 42
2.20 PURCHASE PATTERN OF MILKA BREAD 43
2.21 REMBERING MILKAWHAT STRIKES IMMEDIATELY 44
2.22 MEDIA THROUGH WHICH BRAND IS AWARE 45
2.2.1(A) LIKING TOWARDS AGE& LEVEL OF SATISFACTION TOWARDS
MILKA BRAND
OBSERVED FREQUENCY
46
2.2.1(B) LIKING TOWARDS AGE& LEVEL OF
SATISFACTION TOWARDS MILKA BRAND
EXPECTED FREQUENCY
48
2.2.2(A) LIKING TOWARDS AGE &PROMPTNESS OF ACTION
TAKEN AS PER CUSTOMER COMPLAINTS
OBSERVED FREQUENCY
49
2.2.2(B) COMPETITIVE PRODUCT AND INFORMATIVE
PRODUCT WITH AVAILABLE SHOPS
EXPECTED FREQUENCY
50
2.3.1 COMPETITIVE PRODUCT AND INFORMATIVE PRODUCT WITH
AVAILABLE SHOPS.
52

8/6/2019 Indhu Final
http://slidepdf.com/reader/full/indhu-final 8/73
8
LIST OF FIGURES
S.NO TITLE PAGE
NO
2.1 AGE WISE CLASSIFICATION OF THE RESPONDENTS AGE OF THE
RESPONDENTS
24
2.2 SEX OF THE RESPONDENTS 25
2.3 QUALIFICATION OF THE RESPONDENTS 26
2.4 LEVEL OF SATISFACTION TOWARDS MILKA BRAND 27
2.5 STRONG DIFFERENTIATION THIS PRODUCT WHEN COMPARED
WITH OTHER PRODUCTS
28
2.6 KIND OF QUANTITY MOSTLY PREFER TO BUY 29
2.7 PACKING OF THE BRAND LOOKS ATTRACTIVE AND
INFORMATIVE
30
2.8 FACTOR MORE INFLUENCES TO PURCHASE THE PRODUCT 31
2.9 PROMPTNESS OF ACTION TAKEN AS PER CUSTOMER
COMPLAINTS
32
2.10 ADVERTISEMENT IN WHICH MEDIA COME ACROSS MOSTLY 33
2.11 OPINION ABOUT QUALITY OF MILKA BREAD 34
2.12 CUSTOMERS WAND OF CHANGE IN MILKA BREAD 35
2.13 ADVERTISEMENT IS NECESSARY FOR MILA BREAD 36
2.14 COST OF MILKA BREAD 37
2.15 AVILABILITY OF MILKA BREAD 38
2.16 FACTORS OF ALTERACTION 39

8/6/2019 Indhu Final
http://slidepdf.com/reader/full/indhu-final 9/73
9
2.17 LOYALTY OF CUSTOMER TO MILKA BREADS 40
2.18 PREFER TO BUY MILKA BREADS FOR YOUR
REQUIREMENT
41
2.19 COMPARING WITH OTHER BRANDS PIONEER MILKA BREAD 42
2.20 PURCHASE PATTERN OF MILKA BREAD 43
2.21 WE SAY MILKA WHAT STRIKES ON YOUR MIND IMMEDIATELY 44
2.22 MEDIA THROUGH WHICH THY KNOW ABOUT THE
BRAND
45

8/6/2019 Indhu Final
http://slidepdf.com/reader/full/indhu-final 10/73
10
CHAPTER-I
1.1 INTRODUCTION TO THE STUDY
1. MARKETING INTRODUCTION
Marketing deals with identifying and meeting human and social needs one of the shortest
definitions of marketing is meet needs profitably when Bay recognized that people when unable
to locate some of the items the desired most and created an importance of marketing online
auction.
Financial success after depends on marketing ability finance operations accounting and
other business functions will not really mattes if there is not sufficient demand for products andservices, so the company can make a profit there must be a top line for there to be a bottom line
many companies have now created a chief marketing
Philip Kotler 2006
2. MARKETING DEFINITION
A social definition shows the role marketing plays in society one marketer said that
marketing’s role is the delivers a higher standard of living marketing.
3. MARKETING
Marketing is a societal process by which individual and grayes obtain what they need and
wan through creating offering and freely exchange products and services of value with others.
4. BRAND
The brand is a name term symbol or design to identity the goods or services and to
differentiate them from those of the competitors American marketing association defines a brand
as “The use of a name item symbol or design or some combination of these to identity.

8/6/2019 Indhu Final
http://slidepdf.com/reader/full/indhu-final 11/73
11
The products of a certain sellers from those of competitors. A brand identifies the products for
buyers. A seller can earn the good will and have the patronages repeated.
5. BRAND AWARENESS
The measure of the percentage of the target market that is aware of a brand name. This is
one of the elements of brand equality which is a measure of customer 10 yalist and brand
preference naturally people cannot buy. Products they don’t know about familiarity is also a
powerful purchase influence with the brand are positive buyers are more comfortable with
known products they with unknown products.
6. IMPORTANCE OF BRAND AWARENESS
Help the potential buyer know about a brand
Help the customer to be familiar about the product because familiarity is a
powerful purchase influences.
8/6/2019 Indhu Final
http://slidepdf.com/reader/full/indhu-final 12/73
12
1.2 NEED OF THE STUDY
The study throws light an awareness of the public regarding contamination of Milka
bread, the necessity to consume and was opportunities available for marketing Milka bread.
This company finding the brand preference and awareness level of the consumer
through different media advertisement undertaken by Pioneer Bakes (P) Ltd.
The customer survey reveals the strong which further can be expanded and short falls
which can be improved upon.
This study is sincere attempt to determine the need of the consumer to make effort to
know their preference, to satisfy them in very impeditive market.

8/6/2019 Indhu Final
http://slidepdf.com/reader/full/indhu-final 13/73
13
1.3 SCOPE OF THE STUDY
The study aim is to find out consumer preference towards the brand of Pioneer Milka
bread.
This has been done by preparing a questionnaire, which questions the respondents on
their awareness, satisfaction levels on various factors provided by Pioneer Milka
breads.
The study would help to know the preferences of customers and would help the
improving the quality of Pioneer Milka breads.

8/6/2019 Indhu Final
http://slidepdf.com/reader/full/indhu-final 14/73
14
1.4 OBJECTIVES OF THE STUDY
PRIMARY OBJECTIVES
To study the brand preference of pioneer bakes (P)ltd Gobichettipalayam.
SECONDARY OBJECTIVES
To Analyzes of the awareness among the customer towards the pioneer Milka breads.
To identify the perception of customers towards Milka breads
To find out the current marketable position of Milka breads
To study the satisfactory level of customers towards the pioneer Milka bread.
To suggest and provide remedies for improving the brand preferences

8/6/2019 Indhu Final
http://slidepdf.com/reader/full/indhu-final 15/73
15
1.5 RESEARCH METHODOLOGY
Research methodology is a way for systematically solving the research problems. It may be understood as a science of studying how research is done scientifically.
1.5.1 RESEARCH
Research is a scientific and systematic search for pertinent information on a specific
topic.
1.5.2 RESEARCH DESIGN
A research design is the arrangement of conditions for collection and analysis of data in a
manner to that aims to combine relevance to the research purpose with economy in procedure.
1.5.3 AREA OF STUDY
This study was undertaken in Milka Bread, Vellalapalayam.
1.5.4 DESCRIPTIVE RESEARCH DESIGN
Major purpose of research is descriptive of the state of affairs as it’s exists at present. The
main characteristic of this method is that the research has no control over the variable and he can
only report what has happened or whit is happening.
1.5.5 SOURCES OF DATA
Data is available from two sources namely,
Primary data
Secondary data
8/6/2019 Indhu Final
http://slidepdf.com/reader/full/indhu-final 16/73
16
1. PRIMARY DATA
Primary data are those which are collected freshly and for the first time. Primary data was
collected through,
Personal interview
Questionnaire
2. SECONDARY DATA
Secondary data are those which have been collected already by someone. In this study
secondary data are collected from,
Reports
Documents
Magazine
Text books
1.5.6 POPULATION
All items under consideration in any field of enquiry constitute a population. It is also
called universe. The taken population for this study is finite (N=200).
1.5.7. SAMPLE SIZE
The researcher has taken 200 samples for the study.
1.5.8 SAMPLING TECHNIQUES
The sampling technique used here to select the respondents is cluster sampling.
8/6/2019 Indhu Final
http://slidepdf.com/reader/full/indhu-final 17/73
17
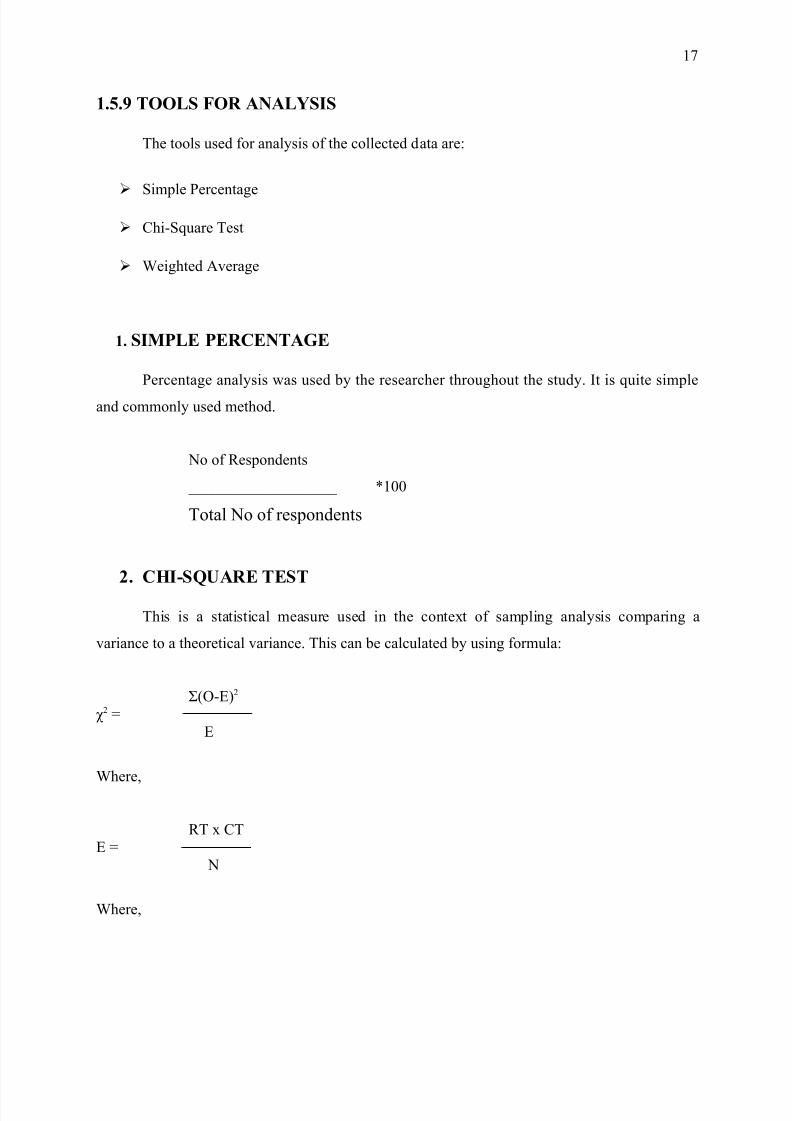
1.5.9 TOOLS FOR ANALYSIS
The tools used for analysis of the collected data are:
Simple Percentage
Chi-Square Test
Weighted Average
1. SIMPLE PERCENTAGE
Percentage analysis was used by the researcher throughout the study. It is quite simple
and commonly used method.
No of Respondents
___________________ *100
Total No of respondents
2. CHI-SQUARE TEST
This is a statistical measure used in the context of sampling analysis comparing a
variance to a theoretical variance. This can be calculated by using formula:
Σ(O-E)2
χ 2 =E
Where,
RT x CTE =
N
Where,

8/6/2019 Indhu Final
http://slidepdf.com/reader/full/indhu-final 18/73
18
O = Observed Frequency
E = Expected Frequency
CT = Column Total
N = Total number of observation
RT = Row Total
Level of significance at 5% and degree of freedom is to be calculated by the formula:
(R-1) x (C-1)
Where,
R = Number of Rows
C = Number of Column
If the calculated value is less than table value, the null hypothesis is accepted or else
rejected.
3. WEIGHTED AVERAGE METHODIn weighted average each value of the variable is multiplied by its weights and the
products so obtained are summed up. This total is divided by the total of weights and the
resulting figure is the weighted arithmetic average.
X1W1 + X2W2 + X3W3 + ……….. + XnWn
Weighted Average = -------------------------------------------------------------
W1 + W2 + W3 + …………. + Wn
Where X1, X2, X3, ……. ,Xn are the values of the variable and
W1, W2, W3, …… , Wn are their respective weights.

8/6/2019 Indhu Final
http://slidepdf.com/reader/full/indhu-final 19/73
19
1.6 LIMITATIONS OF THE STUDY
The taste, buying behavior and market potentials differ from one place to another place.
The study is considering the area of Gobi, around Vellalapalayam.
The sample selected in one place would not be representative one for the company.
The respondents are hesitating to response.
All the factors are not take into consideration, because the study duration is very short.

8/6/2019 Indhu Final
http://slidepdf.com/reader/full/indhu-final 20/73
20
1.7 CHAPTERISATION
Chapter-1
The first chapter deals with the topic introduction, need of the study, scope, objective, research
methodology, limitation, review of literature, industry profile, company profile and service
profile.
Chapter-2
The second chapter includes the data analysis and interpretation, using statistical tools like chi-
square, weighted average method one sample run test and percentage analysis method.
Chapter-3
The third chapter includes findings, suggestion and conclusions.

8/6/2019 Indhu Final
http://slidepdf.com/reader/full/indhu-final 21/73
21
1.8 REVIEW OF LITERATURE
Measuring, the determinants of brand preference in a dairy product market.
1.8.(i) BRAND AND BRANDING DEFINED
The American Marketing Association (1994) defines a brand as a “name, term, sign,
symbol or design, or a combination of them intended to encourage prospective customers to
differentiate a producer’s product (s) from those of competitiors”. On the emotional side, the
function of a brand is to evoke a set of associations and furthermore symbolize the consumer’s
person through brand imagery.
However, this and other definitions of a brand fail to capture the essence of what
branding involves or achieves (Marketing in a Global Economy Proceedings, 2000). In order to
be successful, images and symbols must relate to and indeed exploit the needs, values and
lifestyles of consumers in such a way that the meanings involved give added values, and
differentiate the brand from other brands (Broadbent and Cooper).
Ambler and Styles (1996) describe two different views of defining brand. The first is the
product plus view, when the brand is seen as an addition to the product, and in this view a brand
is also called an identifier.
The second is the holistic view that communicates the focus on the brand itself that is
considered to be much more than just the product.
“A successful brand is an identifiable product, service, person or place, augmented in
such a way that the buyer or user perceives relevant, unique added values which match their
needs most closely. Furthermore, its success results from being able to sustain those added
values in the face of competition.

8/6/2019 Indhu Final
http://slidepdf.com/reader/full/indhu-final 22/73
22
1.8.(ii) FASHION BRAND PREFERENCE AMONG YOUNG CONSUMERS
Although there has been some research into young consumers for instance their approach
to product categorization, their decision-making strategies, and their role in family decision
making, considerable work remains to be done to understand how young consumers develop
brand loyalty, brand preference and reliance.
This paper reports the initial findings from an exploratory study of over 200 young
consumers (aged 7-10) which examined perceptions of branded fashion clothing and the impact
of social influences on branded fashion products. The findings indicate that product / brand
imagery is clearly establishes among young consumers, particularly for branded fashion
sportswear and the results suggest that research design must take account of both age and gender
differences when choosing methods for eliciting data from young consumers.
- Bruce M.K.H.M., Hill A.J.
- International Journal of Retail Distribution Management
1.8.(iii) BRAND
A brand is a name, symbol, or design to identify the goods or Services and to differentiate
them from those of the competitors.
FEATURES OF A GOOD BRAND:
Brand should suggest something about the product-purpose, quality.
It should be easy to advertise and identify
It should be of a permanent nature

8/6/2019 Indhu Final
http://slidepdf.com/reader/full/indhu-final 23/73
23
It should be clear and attractive
It should be distinctive
It should create good image
It should not be offensive
It must be original
1.8.(iv) FUNCTIONS OF A BRAND
Brand facilitates distinctiveness from the rival products in the market.
Branded products possess individual identification
Branded goods create a satisfactory or standard quality in the minds of the consumers
Brands help or facilitate consumers shopping.
1.8.(v) IMPORTANCE OF BRANDS
Companies which invent new brands able generally to defined them from balance
copying in a variety of ways, though not normally from broad imitation. If a brand is a good one
then consumers will purchase it and it becomes a valuable asset. But its asset value derives from
more than just its ability to attract Sales.
The very fact that consumers perceive a brand as embracing a set of values which they
can specify means that will reject alternatives which are presented to them that perhaps may not
posses all these values.
(a)BRAND PREFERENCE
The topic of brand preference has drawn substantial attention in recent years, as a field of
study and it is fair to say that much has been learned.
(b)BRAND AWARENESS

8/6/2019 Indhu Final
http://slidepdf.com/reader/full/indhu-final 24/73
24
First, consumers must be aware that there are different brands in the product categories in
which your brand operates. Next, they must be aware of your brand. Ideally, your brand should
be the first one that comes to their benefits. Consumers should be able to identify which products
and services your brand offers. They should also be able to identify which benefits are associated
with the brand. Finally, they should have some idea of where your brand is sold.
(c)ACCESSIBILITY
Your brand must be available where consumers shop, it’s much easier for consumers to
insist upon your brand if it is widely available. Slight brand preference goes a long way toward
insistence when the brand is widely available. The importance of convenience cannot be
underestimated in today’s world.
(d)VALUE
Does your brand deliver a good value for the price? Do consumers believe it is worth the
price? Regardless of whether it is expensive or inexpensive, high end or low end, it must deliver
at least a good value.

8/6/2019 Indhu Final
http://slidepdf.com/reader/full/indhu-final 25/73
25
1.8.1 PROFILE OF THE COMPANY
The pioneer bake house (P) Ltd., was started 10 th December 1987 for manufacturing
bread called “Milka”. The company shareholders are Mr.A.Arumugam, Mr.V.M.Joesph,
Mr.G.D.Sekar Mr.Balaram Mudaliyar, Mr.P.K.Krishnan and Mr.Jaikrishnan. The company is
situated at moolapalayam, near Erode. Mr.JayaKrishnan is chairman of the company. The over
all functioning of the organization is controlled by Mr.V.M.Joesph is the Managing Director of
the company.
In ideally, there were only 106 employees in the organization three type of bread varieties
were produced i.e., 400gms sweet bread, 200gms sweet bread and 50gms fun-bun. The sales turn
over of 1989-90 was 25.8 lakhs. The capacity of production was 4000 packets per day.
In 1990-91 they introduced a new type of bread called fruity bread. The sales turn over of
that year increased to 40 lakhs. Because they spend more for advertisement.
In 1992 a new plant was stated at Gobichettipalayam in Erode District. The purpose of
new plant is to produce more bread due to increase in demand. In this organization there are 155
employees in this unit the same variety of bread are produced. The capacity of production was
10000 packets per day.
In 1993 they introduced another bread variety called sandwich bread. During this year
they introduced the bread in Pondicherry Union. The sales turn over of 1992-93 was 14.5 lakhs
of this sales value in Pondicherry was 5 lakhs. During this year spend 4 lakhs for advertisement.

8/6/2019 Indhu Final
http://slidepdf.com/reader/full/indhu-final 26/73
26
In 1995 they started another plant at Gobichettipalayam in Erode District. The capacity of
production was 7500 packets per day. During the year they introduced the bread in Karnataka
also and captured the market. The sales turn over of 1994-95 was 1.43 crores. They spend 14
lakhs for advertisement. The capacity of production was increased to 20000 packets per day.
The beginning of 1996 they introduced two types of bread called fun-bun, the bun is
packed in 600 gms and sweet bread is also packaged in 600 gms. 320 employee are working in
this unit. The sales turn over of 1995-96 was 2.27 crores. They spend 27.3 lakhs for the
advertisement.
In 1996 they started manufacturing cake called “MILKA WONDER CAKE”.
The sales turnover of 1997-98 was 3.37 crores. They spend 37.3 lakhs for the
advertisement. The capacity of production was 40,000 packed per day.
Company has go the prestigious “RASTRIYA GAURAV AWARD 98”, now the
company is producing cake with six different flavours. Following are the various flavours.
Venial Orange
Fruit
Pineapple
Chocolate
Orange Chocolate
Distribution is carried out through their own vehicles. Main advertising media for Milka
and Milka wonder cake, is Television company is graining good will be sponsoring some eventsand social service programmes.
In 1998 they started manufacturing biscuits called “MILKA –B, MILKA WONDAY,
MILKA MERIE, MILKA WONDER-2”
8/6/2019 Indhu Final
http://slidepdf.com/reader/full/indhu-final 27/73
27
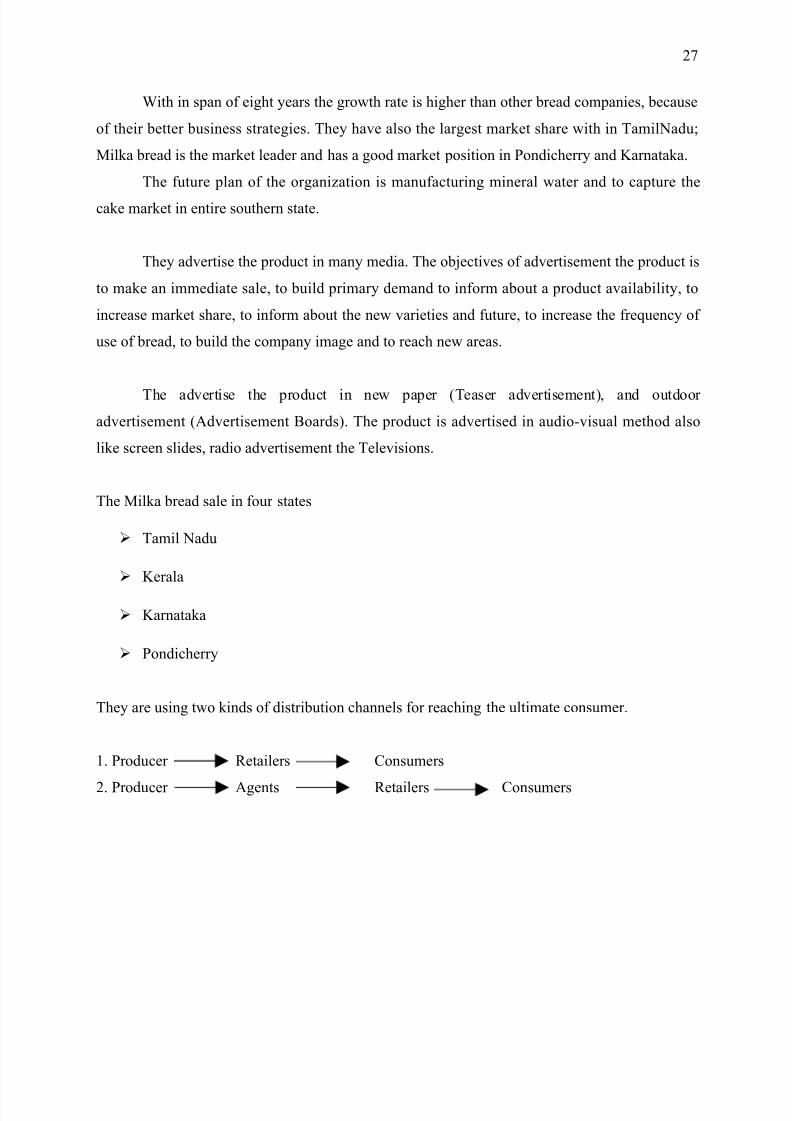
With in span of eight years the growth rate is higher than other bread companies, because
of their better business strategies. They have also the largest market share with in TamilNadu;
Milka bread is the market leader and has a good market position in Pondicherry and Karnataka.
The future plan of the organization is manufacturing mineral water and to capture the
cake market in entire southern state.
They advertise the product in many media. The objectives of advertisement the product is
to make an immediate sale, to build primary demand to inform about a product availability, to
increase market share, to inform about the new varieties and future, to increase the frequency of
use of bread, to build the company image and to reach new areas.
The advertise the product in new paper (Teaser advertisement), and outdoor
advertisement (Advertisement Boards). The product is advertised in audio-visual method also
like screen slides, radio advertisement the Televisions.
The Milka bread sale in four states
Tamil Nadu
Kerala
Karnataka
Pondicherry
They are using two kinds of distribution channels for reaching the ultimate consumer.
1. Producer Retailers Consumers
2. Producer Agents Retailers Consumers

8/6/2019 Indhu Final
http://slidepdf.com/reader/full/indhu-final 28/73

8/6/2019 Indhu Final
http://slidepdf.com/reader/full/indhu-final 29/73
29
1.8.1(a) THE ORGANISATION CHART
MANAGING DIRECTOR
GENERAL MANAGER
PRODUCTION
MANAGER
FINANCE
MANAGER
MARKETING
MANAGER
PURCHASE
MANAGER
QUALITY
MANAGER
DISTRIBUTION
MANAGER
CONTROLLER
SUPERVISOR WORKERS REPRESENTATIVES ACCOUNTANTS

8/6/2019 Indhu Final
http://slidepdf.com/reader/full/indhu-final 30/73
30
1.8.2 PROFILE OF THE PRODUCT
Bread is a food product made of flour or meal that is moistened kneaded, and some times
fermented. A major food since prehistoric times it has been made in various forms using a
variety of ingredients and methods throughout the world. The first bread was made in Neolithic
times. Nearly 12,000 years ago, probably of coarsely crushed grain mixed with water. With the
resulting dough probably laid on heated stones and bricked by covering with hot ashes.
Historians believe that the Egyptians learned to make yeast bread about 2600 BC. The
ancient Greeks learned bread making from Egyptians and taught the method to the Romans. By
the A.D.100s the Romans had taught the technique to people in many parts of Europe. In the
middle ages, most European cites had bakeries,
In those days, bread was divided into three types.
Yeast bread
Quick bread
Flat bread
Yeast bread is raised (puffed up) by yeast. Quick bread requires less preparation, time
before packing than yeast bread. It is raised by use of backing powder or some other leaven,
substance that raires dough. FLAT breads contain little or no leaven. It takes about as long to
prepare before packing as quick bread.

8/6/2019 Indhu Final
http://slidepdf.com/reader/full/indhu-final 31/73
31
Yeast bread makes up about 99% of the commercial bread packed in these countries. More
than half the yeast bread consists of leaves of Pan bread made with wheat flour pan bread which
is packed in a container also. Includes such specialty breads as raisin bread and whole wheat
bread. Hearth bread which includes French bread and most rye bread, is packed on a flat pan or
placed directly on the hearth an oven other types of yeast- leavened backed goods includes
hamburger and frank further rolls and brown and serve rolls.
Most quick bread is backed at home, such backed goods include corn bread and muffins.
Flat bread is a major food many part of the world. In those days, bread was made by
conventional bread making method. Conventional bread making mixes the ingredients by one of
two chief methods, the sponge-and-dough method or the straight doughty method. In the sponge-
and-dough method the ingredients are companied two stages. The first stage mixes all the yeast
and about two-third of the flour and water or milk.
This mixture is called a sponge. Backers let the sponge ferment at about 85 oF (29oC) for
up to 11 hours. Then they add the rest of the ingredients and the mixture ferments again for a
short time. In the straight dough method, all the ingredients are combined at one fermented for
about 3 hours at 85oF (29oC).
After either of this fermenting processes, the dough is divided into pieces and shaped. It
is then fermented again for short time in a process called proofing and baked in an oven at about
450oF (232oC).
For hundred of years, most people ate whole wheat bread or other kinds of whole-grain
bread. While wheat flour was extremely expensive because milling if required hours of hand
labours. During the late 1800s millers developed machinery that milled white flour in
expensively by 1900s white bread was common food.
Bread entered into India in 18th century by the way of European culture. During the 1920s
many bakeries become mechanized.

8/6/2019 Indhu Final
http://slidepdf.com/reader/full/indhu-final 32/73
32
In the 1930s the public officials reports a large number of cases of beri beri and pellagra.
These diseases caused by a lack of B-Vitamins. In 1941 many U.S. bakeries agreed to begin
enriching white bread with B-Vitamins and iron to fight the diseases.
Almost all the nations bakeries have sold enriched white bread since the mid 1950s and
beri beri and pellagra are now rare in the world. Now a days are many types of breads available
in the market. White wheat bread, whole-wheat bread, sweet bread, milk bread, sandwich bread,
fruity bread, fun-bun, double bun and rusk. From the sandwich bread they can prepare bread
Chena, bread chilly.
Now the bread made by continuous bread making processes. It is used by only the largest
bakeries. It cannot be used in homes. Continuous bread making uses highly specilised equipment
to mix ingredients and prepare the dough for baking. In the most common method of continuous
bread baking all the ingredients except the flour are first combined to form a mixture called
broth. After fermenting in a tank, the broth is pumped to a mixer and the flour is added. In the
mixer, the ingredients are combined under pressure to form dough. The dough is then divided
shaped, and sent to an oven for baking. This process produces bread of uniform shape, texture
and quality. After bread has been baked by congenital or continuous bread making. It is removed
from the oven to cool. In commercial bakeries, the leaves are placed in cooling machines where
the temperature of the bread is reduced to about 100oF (38oC). it is sliced and wrapped in paper
or plastic film.

8/6/2019 Indhu Final
http://slidepdf.com/reader/full/indhu-final 33/73
33
CHAPTER-II
2.1 ANALYSIS AND INTERPRETATION
Table No: 2.1
AGE WISE CLASSIFICATION OF THE RESPONDENTS AGE OF THE
RESPONDENTS
CHART: 2.1
AGE NUMBER OF RESPONDENTS PERCENTAGE%
18 to 25 76 39
25 to 30 77 39
30 to 35 20 9
above 36 27 13
Total 200 100

8/6/2019 Indhu Final
http://slidepdf.com/reader/full/indhu-final 34/73
34
INFERENCE:
From the above table, it is observed that 39%of respondents are under the age group of
25-30 years, about 39% of the respondents are between 18-25 years, about 9% of the
respondents are between 30-35 years, about 13% of the respondents are between above 36 years.
Table No: 2.2
SEX OF THE RESPONDENTS
SEX NUMBER OF RESPONDENTS PERCENTAGE%
Male 150 75
Female 50 25
Total 200 100
CHART: 2.2

8/6/2019 Indhu Final
http://slidepdf.com/reader/full/indhu-final 35/73
35
INFERENCE:
The majority of 75%of the respondents are male, and 25% of the respondents are female
Table No: 2.3
QUALIFICATION OF THE RESPONDENTS
QUALIFICATION NUMBER OF RESPONDENTS PERCENTAGE%
>10-12 58 29
Diploma / ITI 42 21
UG 66 33
PG 34 17

8/6/2019 Indhu Final
http://slidepdf.com/reader/full/indhu-final 36/73
36
Total 200 100
CHART: 2.3
INFERENCE:
The above table shows that, about 33% of respondents are UG degree holder about29%
of the respondents are having educational qualification of 10-12standard. 21% of the respondents
are DIPLOMA/ITI holders, about 29% of the respondents are post graduates.
Table No: 2.4
LEVEL OF SATISFACTION TOWARDS MILKA BRAND
PARTICULARS NUMBER OF RESPONDENTS PERCENTAGE%
Highly Satisfied 45 23
Satisfied 113 56
Neutral 27 14
Dissatisfied 7 3
High Dissatisfied 8 4
Total 200 100

8/6/2019 Indhu Final
http://slidepdf.com/reader/full/indhu-final 37/73
37
CHART: 2.4
INFERENCE:
From the above table, it is observed that 56% of the respondents are satisfied towards
milka brand,23%of the respondents are highly satisfied,14% of the respondents remain neutral
4% of the respondents are highly dissatisfied towards milka.
Table No: 2.5
STRONG DIFFERENTIATION THIS PRODUCT WHEN COMPARED
WITH OTHER PRODUCTS
PARTICULARSNUMBER OF
RESPONDENTSPERCENTAGE%
Strongly Agree 25 13
Agree 125 62
Neutral 33 16

8/6/2019 Indhu Final
http://slidepdf.com/reader/full/indhu-final 38/73
38
Disagree 9 5
Strongly Disagree 8 4
Total 200 100
CHART: 2.5
INFERENCE:
From the above table, it is observed that 62%of the respondents agreed that, milka
product has strong differentiation when compared with other products.16% of respondents are
neutral with the above statement.
Table No: 2.6
KIND OF QUANTITY MOSTLY PREFER TO BUY
PARTICULA
RSNUMBER OF RESPONDENTS PERCENTAGE%
250 69 35
500 131 65

8/6/2019 Indhu Final
http://slidepdf.com/reader/full/indhu-final 39/73
39
Total 200 100
CHART: 2.6
INFERENCE:
From the above table, it is observed that, 35% of the respondents said that, they mostly
prefer to buy 250grams quantity of brand.65% said that, they mostly prefer to buy 500grams
milka bread.
Table No: 2.7
PACKING OF THE BRAND LOOKS ATTRACTIVE AND INFORMATIVE
PARTICULARS NUMBER OF RESPONDENTS PERCENTAGE%
Strongly Agree 32 16
Agree 76 38
Neutral 56 28

8/6/2019 Indhu Final
http://slidepdf.com/reader/full/indhu-final 40/73
40
Disagree 22 11
Strongly Disagree 14 7
Total 200 100
CHART: 2.7
INFERENCE:
From the above table, it is observed that 38% of the respondents are agree with packing
of the brand looks attractive and informative,28%of the respondents are strongly agree, 16% of
the respondents are neutral, 11%of the respondents are disagree and 7%of the respondents are
strongly disagree with the packing of the brand looks attractive and informative.
Table No: 2.8
FACTOR MORE INFLUENCES TO PURCHASE THE PRODUCT
PARTICULARS NUMBER OF RESPONDENTS PERCENTAGE%
Price 59 30
Advertisement 67 33

8/6/2019 Indhu Final
http://slidepdf.com/reader/full/indhu-final 41/73
41
Brand image 18 9
Packing 56 28
Total 200 100
CHART: 2.8
INFERENCE:
From the above table, it is observed that, 33% of the respondents said that, the
advertisement is the more influencing factor to purchase the product, 30% of the respondents
said that, price is more influencing factor to purchase the product 9% said that brand image.
Table No: 2.9
PROMPTNESS OF ACTION TAKEN AS PER CUSTOMER COMPLAINTS
PARTICULARS NUMBER OF RESPONDENTS PERCENTAGE%
Highly Satisfied 30 15
Satisfied 83 42

8/6/2019 Indhu Final
http://slidepdf.com/reader/full/indhu-final 42/73
42
Neutral 29 14
Dissatisfied 40 20
High Dissatisfied 18 9
Total 200 100
CHART: 2.9
INFERENCE:
From the above table, it is observed that 42%of the respondents are satisfied with the
promptness of action taken as per customer complaints,15%of the respondents are highly
satisfied,14%of the respondents remain neutural,20% of the respondents are dissatisfied and
9%of the respondents are highly dissatisfied with the promptness of action taken as per customer
complaints.
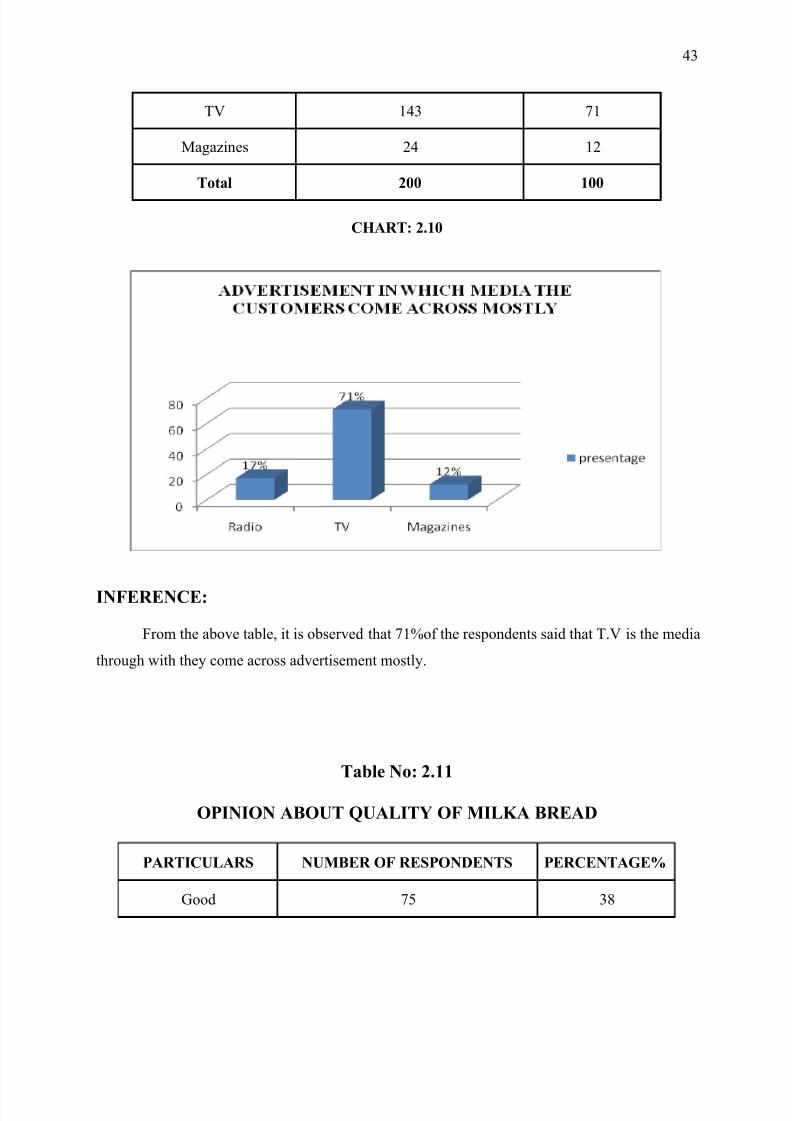
Table No: 2.10
ADVERTISEMENT IN WHICH MEDIA THE CUSTOMERS COME
ACROSS MOSTLY
PARTICULARS NUMBER OF RESPONDENTS PERCENTAGE%
Radio 33 17
8/6/2019 Indhu Final
http://slidepdf.com/reader/full/indhu-final 43/73
43
TV 143 71
Magazines 24 12
Total 200 100
CHART: 2.10
INFERENCE:
From the above table, it is observed that 71%of the respondents said that T.V is the media
through with they come across advertisement mostly.
Table No: 2.11
OPINION ABOUT QUALITY OF MILKA BREAD
PARTICULARS NUMBER OF RESPONDENTS PERCENTAGE%
Good 75 38

8/6/2019 Indhu Final
http://slidepdf.com/reader/full/indhu-final 44/73
44
Fair 101 50
Bad 23 12
Total 200 100
CHART: 2.11
INFERENCE:
From the above table, it is observed that 50% of the respondents are fair a bout the
quality of milka bread,38%of the respondents felt good,12%of the respondents felt bad about the
quality of milka bread.
Table No: 2.12
CUSTOMERS WAND OF CHANGE IN MILKA BREAD
PARTICULARS NUMBER OF RESPONDENTS PERCENTAGE%
Packing 37 19

8/6/2019 Indhu Final
http://slidepdf.com/reader/full/indhu-final 45/73
45
Price 96 48
Quantity 42 21
Quality 25 12
Total 200 100
CHART: 2.12
INFERENCE:
From the above table, it is observed that 48%of the respondents said that, price is the
factor that they want a change.21% of the respondents want a change in quantity.13% response
wand a change in quality.
Table No: 2.13
ADVERTISEMENT IS NECESSARY FOR MILKA BREAD
PARTICULARSNUMBER OF
RESPONDENTSPERCENTAGE%
Yes 87 44.

8/6/2019 Indhu Final
http://slidepdf.com/reader/full/indhu-final 46/73
46
No 113 56
Total 200 100
CHART: 2.13
INFERENCE:
From the above table, it is observed that 56% of the respondents agreed that,
advertisement is necessary for milka bread, 44% of the respondents do not agree that
advertisement is necessary for milka bread.
Table No: 2.14
COST OF MILKA BREAD
PARTICULARS NUMBER OF RESPONDENTS PERCENTAGE%

8/6/2019 Indhu Final
http://slidepdf.com/reader/full/indhu-final 47/73
47
Reasonable 40 20
Affordable 71 36
High 59 29
Very High 30 15
Total 200 100
CHART: 2.14
INFERENCE:
From the above table, it is observed that 36% of the respondents said that, the cost of
milka bread is affordable. milka bread, 29%of the respondents said high,20%of the respondents
said that the cost of milka brand is reasonab1es5% of the respondents said that the cost of milka
bread is very high.
Table No: 2.15
AVILABILITY OF MILKA BREAD
PARTICULARS NUMBER OF RESPONDENTS PERCENTAGE%

8/6/2019 Indhu Final
http://slidepdf.com/reader/full/indhu-final 48/73
48
Strongly Agree 49 24
Agree 98 49
Neutral 27 14
Disagree 19 9
Strongly Disagree 7 4
Total 200 100
CHART: 2.15
INFERENCE:
From the above table, it is observed that 49% of the respondents agreed that, the milka bread is
available in convenient shop,25%of the respondents are strongly agreed 14% of the respondents
are neutral, 9%of the respondents are disagreed and 4%of the respondents are strongly disagreed
that the milka bread is available in convenient shop.
Table No: 2.16
FACTORS OF ALTERACTION
PARTICULARS NUMBER OF RESPONDENTS PERCENTAGE%

8/6/2019 Indhu Final
http://slidepdf.com/reader/full/indhu-final 49/73
49
Softness 47 24
Taste 87 43
Smell 40 20
Attractive 26 13
Total 200 100
CHART: 2.16
INFERENCE:
From the above table, it is observed that 43% of the respondents said that, taste is the
factor that attracted them mostly 24% said that softness is the factor that attracted them. .
Table No: 2.17
LOYALTY OF CUSTOMER TO MILKA BREADS

8/6/2019 Indhu Final
http://slidepdf.com/reader/full/indhu-final 50/73
50
PARTICULARS NUMBER OF RESPONDENTS PERCENTAGE%
Yes 73 37
No 127 64
Total 200 100
CHART: 2.17
INFERENCE:
From the above table, it is observed that 37% of respondents said that, they are loyal
customer to milka breads, 64%of respondents said that, they are not a loyal customer to milka
breads.
Table No: 2.18
PREFER TO BUY MILKA BREADS FOR REQUIREMENT

8/6/2019 Indhu Final
http://slidepdf.com/reader/full/indhu-final 51/73
51
PARTICULARS NUMBER OF RESPONDENTS PERCENTAGE%
Retailer 36 18
Manufacture 90 45
Dealer 34 17
Stores 40 20
Total 200 100
CHART: 2.18
INFERENCE:
From the above table, it is observed that 45% of the respondents with said that, they prefer
to buy milka bread, from manufacture 20% prefer to try it from stores. For their requirements.
Table No: 2.19
COMPARING WITH OTHER BRANDS PIONEER MILKA BREAD

8/6/2019 Indhu Final
http://slidepdf.com/reader/full/indhu-final 52/73
52
PARTICULARS NUMBER OF RESPONDENTS PERCENTAGE%
Very Good 31 16
Good 109 54
Average 41 20
Poor 13 7
Very Poor 6 3
Total 200 100
CHART: 2.19
INFERENCE:
From the above table, it is observed that 54% of the respondents said that by comparing
with other brands milka bread is good 20%of the respondents rated average, 15% of therespondents rated very good, 7%of the respondents rated poor ,3% of the respondents are very
poor by comparing with other brands.
Table No: 2.20
PURCHASE PATTERN OF MILKA BREAD

8/6/2019 Indhu Final
http://slidepdf.com/reader/full/indhu-final 53/73
53
PARTICULARS NUMBER OF RESPONDENTS PERCENTAGE%
Daily 19 10
Monthly 82 41
Weekly Once 38 19
None of the above 61 30
Total 200 100
CHART: 2.20
INFERENCE:
From the above table, it is observed that 41% of the respondents,30%of the respondents
are none of the above, 19% of the respondents said that, they purchase milka bread weekly once.
Table No: 2.21
REMBERING MILKA WHAT STRIKES IMMEDIATELY

8/6/2019 Indhu Final
http://slidepdf.com/reader/full/indhu-final 54/73
54
PARTICULARS NUMBER OF RESPONDENTS PERCENTAGE%
Quickly Product 65 32
Low Price 72 36
Attractive Packing 23 12
Quickly Set 40 20
Total 200 100
CHART: 2.21
INFERENCE:
From the above table said that, by saying milka, quality product is comes into their
mind.36% felt that, by saying milk,a low price product is comes into their mind.
Table No: 2.22

8/6/2019 Indhu Final
http://slidepdf.com/reader/full/indhu-final 55/73
55
MEDIA THROUGH WHICH BREAD IS AWARE
PARTICULARS NUMBER OF RESPONDENTS PERCENTAGE%
Advertisement 43 22
Friends 93 46
Relatives 22 11
Co-Workers 42 21
Total 200 100
CHART: 2.22
INFERENCE:
From the above table, it is observed that 46% of the respondents said that, they know
about the brand through this friends 21% said that, they know about the brand through their
relatives.
2.2 CHI-SQUARE

8/6/2019 Indhu Final
http://slidepdf.com/reader/full/indhu-final 56/73
56
2.2 1 LIKING TOWARDS AGE& LEVEL OF SATISFACTION
TOWARDS MILKA BRAND:
Table No:2.2.1(A)
OBSERVED FREQUENCY
Age
Highly
Satisfied
Satisfie
d Neutral Dissatisfied
Highly
Dissatisfied Total
18-25 22 43 9 2 0 76
25-30 17 41 11 2 6 77
30-35 3 11 5 0 1 20
Above-36 3 18 2 3 1 27
Total 45 113 27 7 8 200
Hypothesis:Null Hypothesis (Ho):
There is no significant relationship between employees age and level of satisfaction
towards milka brand.
Alternative Hypothesis (H1):
There is significant relationship between employees age and level of satisfaction towardsmilka brand.
(O-E) 2
χ 2 = Σ ---------------
E
Where,
O - Observed frequencies.
E - Expected frequencies.
LIKING TOWARDS AGE& LEVEL OF SATISFACTION TOWARDS
MILKA BRAND:

8/6/2019 Indhu Final
http://slidepdf.com/reader/full/indhu-final 57/73
57
Table No:2.2.1(B)
EXPECTED FREQUENCY:
.
Observed
Frequency (O)
Expected
Frequency (E)
(O - E) 2 (O - E) 2 /E
22 17.1 24.01 1.4
43 42.94 0.0036 0.0001
80 10.26 1.58 0.15
19 23.02 9.75 3.195
41 43.5 6.25 0.14
11 10.39 0.37 0.03
8 5.77 8.99 2.93
14 15.8 2.34 0.501
5 2.7 5.29 1.95
22 22.82 17.51 2.796 5.66 6.926 5.245
TOTAL 18.338

8/6/2019 Indhu Final
http://slidepdf.com/reader/full/indhu-final 58/73
58
Degree of freedom :( c-1) (r-1) = (5-1) (4-1) =12
Level of significance=5%
Tabulated value X2=21.026
21.026 > 18.338
Calculated value X2 < Tabulated value X2
Tabulated value is greater than the calculated value.
H0 => Accepted null hypothesis
INFERENCE:
Since the tabulated value is greater than the calculated value we accepted null hypothesis. There
is no significant as relationship between employees age and level of satisfaction towards milka
bread.

8/6/2019 Indhu Final
http://slidepdf.com/reader/full/indhu-final 59/73
59
2.2.2(A) LIKING TOWARDS AGE &PROMPTNESS OF ACTION TAKEN
AS PER CUSTOMER COMPLAINTS:
Table No:2.2.2(A)
OBSERVED FREQUENCY
Age
Highly
Satisfied
Satisfie
d Neutral Dissatisfied
Highly
Dissatisfied Total
18-25 10 35 12 13 6 76
25-30 16 25 11 18 7 77
30-35 0 12 2 6 0 20
Above-36 4 11 4 3 5 27
Total 30 83 29 40 18 200
Hypothesis:
Null Hypothesis (Ho):
There is no significant relationship between employee age and level of satisfaction as per
customer complaints.
Alternative Hypothesis (H1):
There is significant relationship between employee age and level of satisfaction as per
customer complaints.
8/6/2019 Indhu Final
http://slidepdf.com/reader/full/indhu-final 60/73
60
(O-E) 2
χ 2 = Σ ---------------
EWhere,
O - Observed frequencies.
E - Expected frequencies.
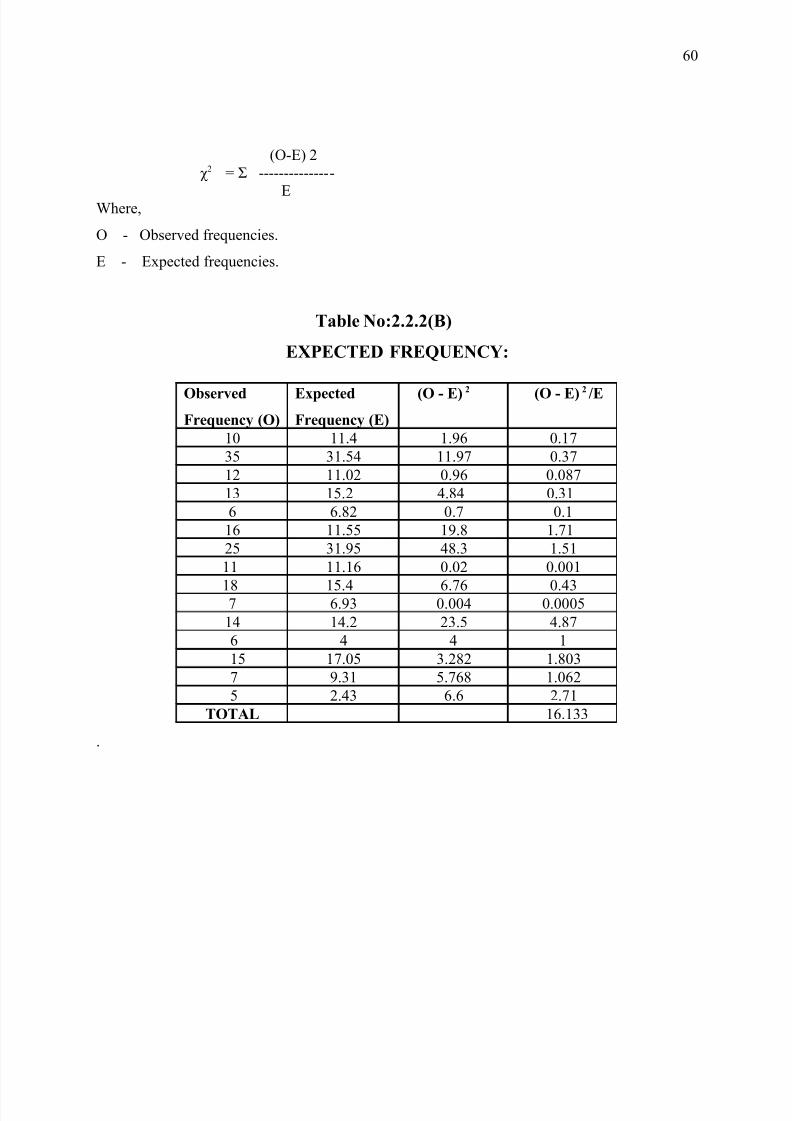
Table No:2.2.2(B)
EXPECTED FREQUENCY:
.
Observed
Frequency (O)
Expected
Frequency (E)
(O - E) 2 (O - E) 2 /E
10 11.4 1.96 0.17
35 31.54 11.97 0.37
12 11.02 0.96 0.087
13 15.2 4.84 0.31
6 6.82 0.7 0.1
16 11.55 19.8 1.71
25 31.95 48.3 1.51
11 11.16 0.02 0.001
18 15.4 6.76 0.437 6.93 0.004 0.0005
14 14.2 23.5 4.87
6 4 4 1
15 17.05 3.282 1.803
7 9.31 5.768 1.062
5 2.43 6.6 2.71
TOTAL 16.133

8/6/2019 Indhu Final
http://slidepdf.com/reader/full/indhu-final 61/73
61
\
Degree of freedom :( c-1) (r-1) = (5-1) (4-1) =12
Level of significance=5%
Tabulated value X2=21.026
21.026 > 16.133
Calculated value X2 < Tabulated value X2
Tabulated value is greater than the calculated value.

8/6/2019 Indhu Final
http://slidepdf.com/reader/full/indhu-final 62/73
62
H0 => Accepted null hypothesis
INFERENCE:
Since the tabulated value is greater than the calculated value we accepted null hypothesis. There
is no significant as relationship between employee age and level of satisfaction as per customer
compliments
2.3 WEIGHTED AVERAGE METHOD
2.3.1 COMPETITIVE PRODUCT AND INFORMATIVE PRODUCT WITH
AVAILABLE SHOPS.
TABLE NO: 2.3.1
S.No
Working condition
Factors
Strongly
Agree Agree Neutral Disagree
Strongly
Disagree Total
1
Brand looks
Attractive 32 76 56 22 14 200
2 Product comparison 25 125 33 9 8 200
3 Availability of milka 49 98 27 19 7 200

8/6/2019 Indhu Final
http://slidepdf.com/reader/full/indhu-final 63/73
63
brand
Strongly Agree = 5
Agree = 4
Neutral = 3
Disagree = 2
Strongly Disagree = 1
FORMULA:
XW = W1 Xi / Wi
CALCULATION
1. Brand looks Attractive
{[32*5] + [76*4] + [56*3] + [22*2] + [14*1]} = 680
680/200 = 3.4
2. Product Comparison
{[25*5] + [125*4] + [33*3] + [9*2] + [8*1]} = 750
750/200 = 3.75
3. Availability of milka brand
{[49*5] + [98*4] + [27*3] + [19*2] + [7*1]} = 763
763/200 = 3.815
INTERPRETATION:
From the above weighted averaged table it has been inferred that the majority of the
respondents have given first preference to Availability of milka brand. The second preference is
given to Product Comparison. The third preference is given to brand looks Attractive.

8/6/2019 Indhu Final
http://slidepdf.com/reader/full/indhu-final 64/73
64
CHAPTER-III
3.1 FINDINGS:
It is observed that 39%of respondents are under the age group of 25-30 years,
about 39% of the respondents are between 18-25 years, about 9% of the
respondents are between 30-35 years, about 13% of the respondents are between
above 36 years.
8/6/2019 Indhu Final
http://slidepdf.com/reader/full/indhu-final 65/73
65
It is identified that the majority of 75%of the respondents are male, and 25% of
the respondents are female
It is found that, about 33% of respondents are UG degree holder about29% of the
respondents are having educational qualification of 10-12standard. 21% of the
respondents are DIPLOMA/ITI holders, about 29% of the respondents are post
graduates.
It is observed that 56% of the respondents are satisfied towards milka
brand,23%of the respondents are highly satisfied,14% of the respondents remain
neutral 4% of the respondents are highly dissatisfied towards milka.
It is inferred that 62%of the respondents agreed that, milka product has strong
differentiation when compared with other products.16% of respondents are
neutral with the above statement.
It is observed that, 35% of the respondents said that, they mostly prefer to buy
250grams quantity of brand.65% said that, they mostly prefer to buy 500grams
milka bread
It is identified that 38% of the respondents are agree with packing of the brand
looks attractive and informative,28%of the respondents are strongly agree, 16% of
the respondents are neutral, 11%of the respondents are disagree and 7%of the
respondents are strongly disagree with the packing of the brand looks attractive
and informative.
It is found that, 33% of the respondents said that, the advertisement is the more
influencing factor to purchase the product, 30% of the respondents said that, price
is more influencing factor to purchase the product 9% said that brand image.
It is observed that 42%of the respondents are satisfied with the promptness of action taken as per customer complaints,15%of the respondents are highly
satisfied,14%of the respondents remain neutural,20% of the respondents are
dissatisfied and 9%of the respondents are highly dissatisfied with the promptness
of action taken as per customer complaints.

8/6/2019 Indhu Final
http://slidepdf.com/reader/full/indhu-final 66/73
66
It is inferred that 71%of the respondents said that T.V is the media through with
they come across advertisement mostly.
It is found that 50% of the respondents are fair a bout the quality of milka
bread,38%of the respondents felt good,12%of the respondents felt bad about the
quality of milka bread.
It is observed that 48%of the respondents said that, price is the factor that they
want a change.21% of the respondents want a change in quantity.13% response
wand a change in quality.
It is inferred that 56% of the respondents agreed that, advertisement is necessary
for milka bread, 44% of the respondents do not agree that advertisement is
necessary for milka bread.
It is identified that 36% of the respondents said that, the cost of milka bread is
affordable. milka bread, 29%of the respondents said high,20%of the respondents
said that the cost of milka brand is reasonab1es5% of the respondents said that
the cost of milka bread is very high.
It is observed that 49% of the respondents agreed that, the milka bread is available
in convenient shop,25%of the respondents are strongly agreed 14% of the
respondents are neutral, 9%of the respondents are disagreed and 4%of the
respondents are strongly disagreed that the milka bread is available in convenient
shop.
It is found that 43% of the respondents said that, taste is the factor that attracted
them mostly 24% said that softness is the factor that attracted them. .
It is inferred that 37% of respondents said that, they are loyal customer to milka
breads, 64%of respondents said that, they are not a loyal customer to milka
breads.
It is identified that 45% of the respondents with said that, they prefer to buymilka bread, from manufacture 20% prefer to try it from stores. For their
requirements.
It is observed that 54% of the respondents said that by comparing with other
brands milka bread is good 20%of the respondents rated average, 15% of the

8/6/2019 Indhu Final
http://slidepdf.com/reader/full/indhu-final 67/73
67
respondents rated very good, 7%of the respondents rated poor ,3% of the
respondents are very poor by comparing with other brands.
It is observed that 41% of the respondents,30%of the respondents are none of the
above, 19% of the respondents said that, they purchase milka bread weekly once.
It is observed that 46% of the respondents said that, they know about the brand
through this friends 21% said that, they know about the brand through their
relative.
3.2 SUGGESTIONS
SUGGESSION FROM FINDING:
It is found that 48% of the respondents said that, price is the factor that they want to change
• Since majority of consumers wants a change in price of product, a competitive pricing
strategy may be followed.

8/6/2019 Indhu Final
http://slidepdf.com/reader/full/indhu-final 68/73
68
It is observed that 21% of the respondents want a change in quantity,31% responds needs
Changing quality
• Small quantity of a bread packs may be offered to consumer and to attract children
GENERAL SUGGESSION:
In this comparative marked, brand preference and customer delight once very important
factor to maintain great market share so it is necessary to maintain through satisfying customers
through good quality product
The company should do a deal demand survey at regular interval to know about unique
needs and requirements of customer.
The company should make free arrangement for its customers and retailers to make any
feed back or suggestion as and when they fell
.
The company should focus to bring more varieties flavors and quantity packs of milka
bread
3.3 CONCLUSION
All consumer decision making involves the element of choice. An organized cognitive structure
Consisting of product perception and brand preference can facilities the choice process.
With the vast array of different brands available in most consumer decision making settings,

8/6/2019 Indhu Final
http://slidepdf.com/reader/full/indhu-final 69/73
69
The consumers may eliminate some brands and focus on others according to the presence or
absences of the most valued attributes. Discrimination among brands within a product class is
based on perceived differences among valued attributes.
This research brings out the facts that, on which most valued attributes associated with milka
bread, the consumers from brand preference, that will lead to attain and substation brand loyalty
and helps to generate more revenue, grater market share and to beat off the competition.
APPENDIX
A STUDY ON BRAND PREFERENCE WITH SPECIAL REFERENCE TOPIONEER BAKE HOUSE P(ltd,),GOBICHETTI PALAYAM
Personal Data:
Name :
Age : a. 18-25 b. 25-30 c. 30-35 d. above 36

8/6/2019 Indhu Final
http://slidepdf.com/reader/full/indhu-final 70/73
70
Sex : Male / Female
Education : a. >10-12 b. Diploma / ITI c. UG d. PG
Topic Related Questions:
1. What is your level of satisfaction towards Milka brand?
a. Highly satisfied b. Satisfied c. Neutral
d. Dissatisfied e. Highly Dissatisfied
2. There is a strong differentiation for this product when compared with other product?
a. Strongly Agree b. Agree c. Neutral
d. Disagree e. Strongly Disagree
3. What kind of quantity do you mostly prefer to buy?
a.250 b.500
4. The packing of the brand looks attractive and informative?
a. Strongly Agree b. Agree c. Neutral
d. Disagree e. Strongly Disagree
5 In your opinion which factor more influences you to purchase the product?
a. Price b. Advertisement c. Brand image
d. Packing
6. The level of satisfaction regarding the promptness of action taken as per customer complaints?
a. Highly satisfied b. Satisfied c. Neutral
d. Dissatisfied e. Highly Dissatisfied
7. Advertisement in which media you come across mostly?
a. Radio b. TV c. Magazines
8. What is your opinion about quality of Milka bread?
a. Good b. Fair c. Bad
9. Which change do you want Milka bread to go with?

8/6/2019 Indhu Final
http://slidepdf.com/reader/full/indhu-final 71/73
71
a. Packing b. Price c. Quantity
d. Quality
10. Do you think advertisement is necessary for Milka bread?
a. Yes b. No
11. The cost of Milka bread is ……………..
a. Reasonable b. Affordable c. High
d. Very High
12. Milka bread is available in shop located in convenient shops?
a. Strongly Agree b. Agree c. Neutral
d. Disagree e. Strongly Disagree
13. The kind of bread sense attracts you most?
a. Softness b. Taste c. Smell
d. Attractive
14. Are you a brand loyal customer to Milka breads?
a. Yes b. No
15. Where do you prefer to buy Milka breads for your requirement?
a. Retailer b. Manufacture c. Dealer
d. Stores
16. Comparing with other brands pioneer Milka bread is?
a. Very Good b. Good c. Average
d. Poor e. Very Poor
17. How after do you purchase Milka bread?

8/6/2019 Indhu Final
http://slidepdf.com/reader/full/indhu-final 72/73
72
a. Daily b. Monthly c. Weekly Once
d. None of the above
18. When we say Milka what strikes on your mind immediately?
a. Quickly product b. Low price c. Attractive packing
d. Quickly set
19. How do you know about the brand?
a. Advertisement b. Friends c. Relatives
d. Co-Workers
20. Rank the following factors for purchasing Milka bread?
a) Price
b) Quality
c) Brand image
d) Advertisement
21. Give your valuable suggestion?
----------------------------------------------------------------------------------------------------------------
BIBLIOGRAPHY
BOOK REFERENCE:
1) KOTLER PHILIP., Marketing Management , 8th Edition, Prentice – Hall India.-,New Delhi
2006
8/6/2019 Indhu Final
http://slidepdf.com/reader/full/indhu-final 73/73
73
2) KOTHARI C.R, Research Methodology and Techniques, 2nd Edition, Wishwa Prakasham
Publication -Delhi, 2004
3) I. LEVIN RICHARD & S. RUBIN DAVID, Statistics for Management, 7th Edition, Prentice – Hall India.,-Delhi 2006
4) ARORA P.N, & AERAS, Statistics for Management, s .chand & company, 1td,third revised
edition,2008- New delhi
INTERNET SOURCES:
REFERENCE SITES:
1.www.answer.com
2. www.Wikipidia.com
COMPANY WEBSITES:
www.milka.com
SEARCH ENGINES:
www.google.com
www.yahoo.com