Indexing chromatic and achromatic patterns for …pszqiu/webpages/Papers/ColorPattern...Indexing...
12
Pattern Recognition 35 (2002) 1675–1686 www.elsevier.com/locate/patcog Indexing chromatic and achromatic patterns for content-based colour image retrieval G. Qiu ∗ School of Computer Science, The University of Nottingham, Jubilee Campus, Nottingham NG8 1BB, UK Received 5 July 2001 Abstract In this paper, we present a method to represent achromatic and chromatic image signals independently for content-based image indexing and retrieval for image database applications. Starting from an opponent colour represen- tation, human colour vision theories and modern digital signal processing technologies are applied to develop a compact and computationally ecient visual appearance model for coloured image patterns. We use the model to compute the statistics of achromatic and chromatic spatial patterns of colour images for indexing and content-based retrieval. Two types of colour images databases, one colour texture database and another photography colour image database are used to evaluate the performance of the developed method in content-based image indexing and retrieval. Experimental results are presented to show that the new method is superior or competitive to state-of-the-art content-based image indexing and retrieval techniques. ? 2002 Pattern Recognition Society. Published by Elsevier Science Ltd. All rights reserved. Keywords: Colour vision; Colour imaging; Chromatic patterns; Achromatic patterns; Content-based image indexing and retrieval; Image database; vector quantization 1. Introduction Colour plays a very important role in current state-of-the-art content-based image retrieval from im- age databases. Since its rst publication, Swain’s colour histogram indexing technique [1] has played a very inuential role in the research of content-based im- age indexing and retrieval. Since colour histogram is a global measure and contains no information about the spatial distribution of the colours, the success of the colour histogram method is quite limited. Recognising the importance of spatial information, researchers have proposed various methods to incorporate such informa- tion in the indexing and retrieval for image databases. Although it is not possible to be exhaustive, representa- tive approaches to incorporating the spatial information into content-based image indexing and retrieval include ∗ Corresponding author. Fax: +44-115-951-4254. E-mail address: [email protected] (G. Qiu). classical texture descriptors [2], image segmentation (blobworld) [3], joint histogram of colours and edges [4], and colour correlogram [5]. Recent work has also proposed the use of binary space partitioning tree as an ecient representation for capturing the colours and their spatial distribution information [6]. In this paper, we present an alternative approach to construct eective and ecient image features for content-based image indexing and retrieval. We have developed a method to capture statistically representa- tive chromatic and achromatic spatial image patterns and use the distributions of these patterns within an image to characterise the image’s visual content. In developing our new method, we have used some well-known and relatively new colour vision theories, and importantly, we have also based our development on modern digital signal processing technologies. A well-known colour vision theory is the opponent colour theory [7], which suggests that there are three visual pathways in the human colour vision system. One 0031-3203/02/$22.00 ? 2002 Pattern Recognition Society. Published by Elsevier Science Ltd. All rights reserved. PII:S0031-3203(01)00162-5
Transcript of Indexing chromatic and achromatic patterns for …pszqiu/webpages/Papers/ColorPattern...Indexing...
Pattern Recognition 35 (2002) 1675–1686www.elsevier.com/locate/patcog
Indexing chromatic and achromatic patterns for content-basedcolour image retrieval
G. Qiu∗
School of Computer Science, The University of Nottingham, Jubilee Campus, Nottingham NG8 1BB, UK
Received 5 July 2001
Abstract
In this paper, we present a method to represent achromatic and chromatic image signals independently forcontent-based image indexing and retrieval for image database applications. Starting from an opponent colour represen-tation, human colour vision theories and modern digital signal processing technologies are applied to develop a compactand computationally e-cient visual appearance model for coloured image patterns. We use the model to compute thestatistics of achromatic and chromatic spatial patterns of colour images for indexing and content-based retrieval. Twotypes of colour images databases, one colour texture database and another photography colour image database are used toevaluate the performance of the developed method in content-based image indexing and retrieval. Experimental resultsare presented to show that the new method is superior or competitive to state-of-the-art content-based image indexingand retrieval techniques. ? 2002 Pattern Recognition Society. Published by Elsevier Science Ltd. All rights reserved.
Keywords: Colour vision; Colour imaging; Chromatic patterns; Achromatic patterns; Content-based image indexing and retrieval;Image database; vector quantization
1. Introduction
Colour plays a very important role in currentstate-of-the-art content-based image retrieval from im-age databases. Since its 7rst publication, Swain’s colourhistogram indexing technique [1] has played a veryin;uential role in the research of content-based im-age indexing and retrieval. Since colour histogram is aglobal measure and contains no information about thespatial distribution of the colours, the success of thecolour histogram method is quite limited. Recognisingthe importance of spatial information, researchers haveproposed various methods to incorporate such informa-tion in the indexing and retrieval for image databases.Although it is not possible to be exhaustive, representa-tive approaches to incorporating the spatial informationinto content-based image indexing and retrieval include
∗Corresponding author. Fax: +44-115-951-4254.E-mail address: [email protected] (G. Qiu).
classical texture descriptors [2], image segmentation(blobworld) [3], joint histogram of colours and edges[4], and colour correlogram [5]. Recent work has alsoproposed the use of binary space partitioning tree asan e-cient representation for capturing the colours andtheir spatial distribution information [6].In this paper, we present an alternative approach
to construct eDective and e-cient image features forcontent-based image indexing and retrieval. We havedeveloped a method to capture statistically representa-tive chromatic and achromatic spatial image patterns anduse the distributions of these patterns within an imageto characterise the image’s visual content. In developingour new method, we have used some well-known andrelatively new colour vision theories, and importantly,we have also based our development on modern digitalsignal processing technologies.A well-known colour vision theory is the opponent
colour theory [7], which suggests that there are threevisual pathways in the human colour vision system. One
0031-3203/02/$22.00 ? 2002 Pattern Recognition Society. Published by Elsevier Science Ltd. All rights reserved.PII: S0031-3203(01)00162-5

1676 G. Qiu / Pattern Recognition 35 (2002) 1675–1686
pathway is sensitive mainly to light–dark variations; thispathway has the best spatial resolution. The other twopathways are sensitive to red–green and blue–yellowvariation (the opponent channels). The blue–yellow path-way has the worst spatial resolution. In opponent-colourrepresentation, the spatial sharpness of a colour imagedepends mainly on the sharpness of the light–dark com-ponent of the images and very little on the structure ofthe opponent-colour image components. There is evi-dence to suggest that diDerent visual pathways processcolour and spatial pattern in the human visual system. Thepattern-colour-separable model of human colour vision[8] is a relatively new colour vision theory derived frompsychovisual experiments. This model suggests that thevalue of one neural image is the product of three terms.One term de7nes the pathway’s sensitivity to the stimu-lus colour direction. A second term de7nes the pathway’ssensitivity to the spatial patterns of the stimulus and thethird term de7nes the pathway’s sensitivity to the stimu-lus strength.Colour vision theories could provide some guidance
in the development of colour image processing algo-rithms.1 According to the opponent colour vision model,chromatic and achromatic signals should be treateddiDerently, achromatic signal should be given higherbandwidth and chromatic signal can be given lowerbandwidth. In fact, this theory has long been successfullyused in the broadcasting of colour television signals [9].Based on the colour and pattern separable model [8], wecan have separate channels to process spatial and spectralinformation. Based on above reasoning, we have devel-oped a digital signal processing method to capture thestatistics of colour images for content-based indexing andretrieval. The method uses an opponent colour represen-tation, and derives an e-cient representation and codingscheme to characterise the chromatic and achromaticspatial patterns of small neighbourhood of pixels. We usethe statistics of these chromatic and achromatic spatialpatterns as the images’ indices for eDective content-based image indexing and retrieval for image databaseapplications.The organisation of the paper is as follows. In Sec-
tion 2, we present an e-cient method for capturing thestatistics of chromatic and achromatic spatial patterns ofcolour images. Section 3 presents the use of the methodin content-based image indexing and retrieval. Section 4
1 The author fully understands that our knowledge about ourown visual system is still very limited, and theories concerningthe visual system are widely and intensively debated in thecommunity. It is not the intention of the author to go into thedebate about the correctness of these theories. We shall simplyuse these theories and aim to draw useful guidance from themfor building practical computational models for colour imageprocessing.
presents extensive experimental results and Section 5concludes the paper.
2. Modelling coloured image patterns
A coloured image pattern is de7ned as the spatial andspectral characteristics of a (small) block of pixels in acolour image. We aim to develop e-cient and eDectiverepresentation (coding) schemes to describe colouredimage patterns. To fully exploit the colour vision proper-ties of human visual system, we use an opponent colourspace to represent colour images. Although many vari-ations of colour space exist, we have chosen the YCbCr
space [10] (similar colour space can also be used). Therelation between this space and the better-known RGBcolour space is as follows: YCb
Cr
=
0:299 0:587 0:114−0:169 −0:331 0:5000:500 −0:419 −0:081
RGB
: (1)
To make the computation manageable, we want towork on relatively small-size coloured image patterns. 2
For a coloured image pattern, we want to develop repre-sentation schemes which, (1) can faithfully capture thevisual appearance of the pattern, (2) are computation-ally e-cient and (3) are compact. We have developedthe coloured pattern appearance model (CPAM) [12]which has two channels capturing the characteristics ofthe chromatic and achromatic spatial patterns. With ref-erence to the schematic of CPAM in Fig. 1, the visualappearance of a small image block is modelled by threecomponents:3 the stimulus strength (S), the spatial pat-tern (P) and the colour pattern (C). For a small imagearea, the stimulus strength S is approximated by the localmean of the Y component. The pixels in Y normalisedby S form the spatial pattern. Since Cb and Cr havelower bandwidth, they are sub-sampled by a factor of 2in both dimensions. The sub-sampled pixels of Cb andCr are normalised by S, to form the colour pattern (C)
2 We will only work on a single spatial resolution in thispaper. There are theories to suggest that human visual systemrepresents visual signals in coarse and 7ne multi-resolutionaldecomposition [11]. We will extend the model to multi-resolution patterns in the future.
3 Please note that the CPAM model is in;uenced by thepattern-colour separable model (PCSM) of human colour vi-sion [8], which states that there are three (pattern, colour andstrength) visual pathways within the human colour visual sys-tem. CPAM also has three channels resemble those of PCSM,however, it should be clear that CPAM is not a truthful inter-pretation of PCSM, rather, it is a pragmatic signal processingmodel.

G. Qiu / Pattern Recognition 35 (2002) 1675–1686 1677
Fig. 1. Coloured Pattern Appearance Model (CPAM). The vi-sual appearance of a small image block is modelled by threecomponents: the stimulus strength (S), the achromatic spatialpattern (P) and the chromatic spatial pattern (C).
component of the appearance model. Normalising thepattern and colour channels by the strength has the eDectof removing (to a certain extent) the eDects of lightingconditions, making the visual appearance model some-what “colour constant” [13]. Colour constancy is anotherimportant property of human colour vision system [7].We shall demonstrate some possible bene7ts of this nor-malisation in the experimental results.The P channel of CPAM captures the achromatic spa-
tial pattern of the input coloured image pattern, and the Cchannel captures the chromatic spatial pattern. From nowon, we shall call P and C the achromatic spatial pattern(ASP) and chromatic spatial pattern (CSP), respectively.In constructing the ASP and CSP pattern represen-
tations, we have taken into account the argument thatthe appearance of a coloured image pattern is patternand colour separable [8]. We interpret this as that wecan model the spatial patterns in diDerent chromatic sig-nals independently, hence the chromatic and achromaticpatterns are modelled separately. By using an opponentcolour representation, we also have taken into accountthe fact that opponent chromatic signals have lower band-width, thus can be sub-sampled to form a lower dimen-sional vector (pattern). By separating achromatic andchromatic signals, we can work on two low-dimensionalvectors rather than one very high dimensional vector.From a computational point of view, low dimensionalityis advantageous because higher dimensional signals willsuDer from the “curse of dimensionality” phenomenon.Therefore, from both colour vision theories viewpoint
and digital signal processing viewpoint, it is justi7able torepresent the chromatic and achromatic spatial patternsin such a way. In order to use the representation schemein content-based image indexing and retrieval, it is neces-sary to collect statistics of the distributions of these pat-terns (ASP and CSP) within the image. However, whatshapes and forms of ASPs and CSPs will appear in the im-ages are not known. It is therefore necessary to use someforms of statistical techniques to estimate the most likely
shapes and forms of ASPs and CSPs in natural colourimages, i.e., we need a compact representation schemefor these patterns. In modern digital signal processing,vector quantization (VQ) [14] is a well-developed statis-tical technique which can estimate statistically most rep-resentative feature vectors in the feature space. We cantherefore adopt VQ to estimate the models of ASPs andCSPs.
2.1. Vector quantization
VQ [14] is a mature method of lossy signalcompression=coding in which statistical techniques areused to optimise distortion=rate trade-oDs. A vectorquantizer is described by an encoder Q, which maps thek-dimensional input vector X to an index i∈ I speci-fying which one of a small collection of reproductionvectors (codewords) in a codebook C= {Ci; i∈ I} isused for reconstruction, and there is also a decoder, Q−1,which maps the indices into the reproduction vectors,i.e., X ′=Q−1(Q(X )). The key to the successful use ofVQ technology is to obtain a well designed codebook.There are many methods developed for designing the
VQ codebook. The K-means types algorithms, such asthe LGB algorithm [14], and neural network based al-gorithms, such as the Kohonen feature map [15] arepopular tools. In this work, we used a speci7c neuralnetwork-training algorithm, the frequency sensitive com-petitive learning (FSCL) algorithm [16] to design ourcodebook. According to our own experience, we 7ndFSCL is insensitive to the initial choice of codewords,and the codewords designed by FSCL are more e-cientlyutilised than those designed by methods such as the LGBalgorithm. The FSCL method can be brie;y described asfollows:
2.1.1. FSCL VQ design algorithm
1. Initialise the codewords, Ci(0); i=1; 2; : : : ; I , to ran-dom numbers and set the counters associated witheach codeword to 1, i.e., ni(0)=1,
2. Present the training sample, X (t), where t is thesequence index, and calculate the distance betweenX (t) and the codewords, Di(t)=D(X (t); Ci(t)),and modify the distance according to D′
i (t)=ni(t)Di(t)
3. Find j, such that D′j(t)6D′
i (t) for all i, update thecodeword and counter
Cj(t + 1)=Cj(t) + a[X (t)− Cj(t)]
nj(t + 1)= nj(t) + 1;
where 0¡a¡ 1 is the training rate.4. Repeat by going to 2.

1678 G. Qiu / Pattern Recognition 35 (2002) 1675–1686
Fig. 2. The codebook image. (a) This is a 256× 256 2-dimensional array of 4× 4 pixel block patterns (the image is 1024× 1024pixels); each 4×4 pattern is constructed by one of the 256 ASP codewords and one of the 256 CSP codewords; the CSP codewordshave been up-sampled by nearest-neighbour interpolation [9] to scale back to the original block size (4×4). For displaying purpose,all values of the codewords have been scaled by a constant factor of 128. (b) This is an enlarged portion of the image (a), as canbeen seen these 4× 4 patterns exhibits various colours and spatial patterns.
2.2. VQ coding of ASP
Let Y = {y(i; j); i=0; 1; 2; m; j=0; 1; 2; n} be them×n Y image block. The stimulus strength of the blockis calculated as
S =1
m× n
m∑i=0
n∑j=0
y(i; j): (2)
Then the ASP pattern vector, ASP= {asp(i; j); i=0;1; 2; m; j=0; 1; 2; n} of the block, is formed as
asp(i; j)=y(i; j)
S: (3)
An N -dimensional vector quantizer (N =m× n); Qp,with a codebook CP = {CP(i); i∈ I} of size I , whereCP(i) is the ith N -dimensional codeword, is then de-signed for ASP using many training samples. In thiswork, two hundred and thirty-7ve 512× 512 pixels truecolour images, which form more than 15 million sampleshave been used to design CP .
2.3. VQ coding of CSP
The CSP vector is formed by sub-sampling thetwo chromatic channels, Cb and Cr to form a sin-gle vector, which is also normalised by S. In thecase where a m × n block size is used, the CSPvector is a 2M -dimensional vector (M =m × n=4).Let Cb = {cb(i; j); i=0; 1; 2; m; j=0; 1; 2; n} andCr = {cr(i; j); i=0; 1; 2; m; j=0; 1; 2; n} be the twocorresponding chromatic blocks of the Cb and Cr chan-nels. Then the sub-sampled Cb signal, SCb = {scb(k; l);
k =0; 1; 2; m=2; l=0; 1; 2; n=2} is obtained as follows:
scb(k; l)=14S
1∑i=0
1∑j=0
cb(2k + i; 2l+ j): (4)
Similarly, the sub-sampled Cr signal, SCr = {scr(k; l);k =0; 1; 2; m=2; l=0; 1; 2; n=2} is obtained as follows:
scr(k; l)=14S
1∑i=0
1∑j=0
cr(2k + i; 2l+ j): (5)
The CSP vector, CSP= {csp(k); k =0; 1; : : : ; 2M} isformed by concatenating SCb and SCr . A 2M -dimensionalvector quantizer,Qc, with a codebookCc = {Cc(j); j∈ J}of size J is then designed. Again over 15 million sampleshave been used to design Cc.
2.4. Designing ASP and CSP codebooks
The VQ codebooks should capture statistically rep-resentative feature vectors from the input space. It istherefore necessary to have as many training samplesas possible to design the codebooks. In this work, wehave used 235 true colour (24 bits=pixel) images fromthe MIT Media Labs VisTex image database4 to ob-tain the training samples. The size of these images is512× 512 pixels. Although it is possible to choose var-ious block sizes, we have chosen the size of the patternto be 4×4 pixels for computational convenience. There-fore, the ASP vectors are 16-dimensional and the CSPvectors are 8-dimensional. We used the FSCL algorithm
4 http:==vismod.www.media.mit.edu=vismod=imagery=VisionTexture =vistex.html

G. Qiu / Pattern Recognition 35 (2002) 1675–1686 1679
described above to train our codebooks and more than15 million training samples were obtained from these235 images. The training was stopped after each of the15 million samples had been presented for training 20times. We have trained a 256-codeword quantizer for theASP vectors and a 256-codeword quantizer for the CSPvectors, respectively. Using a Pentium III PC, the totaltime taken to train the codebooks was about 9 h. In Fig.2, we have plotted these codewords as an image. As canbeen seen, a combination of these two sets of codewordscan represent a very diverse set of image patterns.
3. Indexing coloured image patterns for content-basedimage retrieval
The visual appearance of a coloured image patterncan be completely characterised by the 3 channels of theCPAM model. However, because the strength, S, de-pends directly on the intensity of the illuminant [17], andcan therefore be an unreliable variable in object recog-nition. Statistics (histograms) of local features, mea-sured by local operators such as Gaussian derivatives orGabor 7lters, can be used to characterise the globalappearance of objects for recognition purposes [18]. Byindexing the ASP and CSP patterns with the codebooksdeveloped in the last section, we can construct imageindices for content-based image indexing and retrieval.In the original colour histogram method, each pixel isquantized to one of a set of pre-determined colours. Thiscan be viewed as a special case of indexing colouredpattern, whereby the size of the pattern is 1 × 1 pixel.For each image, we de7ne an ASP histogram and a CSPhistogram.5 Let ASPH and CSPH be the achromaticspatial pattern histogram and chromatic spatial patternhistogram, respectively, they are de7ned as
ASPH(i)=Pr(QP(ASP)= i);
for i=1; 2; : : : ; I; where I is size of Qp; (6)
CSPH(j)=Pr(Qc(CSP)= j);
for j=1; 2; : : : ; J; where J is size of Qc: (7)
Therefore, these histograms’ dimensionality are thesize (numbers of codewords) of the VQ codebooks,they capture the probability of ASPs and CSPs be-ing quantized to a particular codeword. In collectingthese statistics from an image, we can use either over-lapping or non-overlapping patterns (blocks). Eitherway, the computational burden is light (they are mostlycomputed oQine and needs to be done only once)
5 A joint ASP and CSP histogram can also be constructed, butthis will increase the histogram’s dimensionality dramatically.
and the histograms’ dimensionalities remain the same.We found that histograms collected using overlappingblocks and non-overlapping blocks have similar per-formance in content-based image retrieval. Since usingnon-overlapping blocks has a slight computational ad-vantage, we have used non-overlapping block throughoutthis work for collecting the histograms.To compare the similarity of two images, we can cal-
culate the distance between their ASPHs and CSPHs. Wehave found the L1 relative distance measure in Ref. [5]worked well. Let ASPHm and CSPHm be the achromaticspatial pattern histogram and chromatic spatial patternhistogram of image m, and ASPHn and CSPHn be theachromatic spatial pattern histogram and chromatic spa-tial pattern histogram of image n. The similarity of thetwo images, m and n can be measured as
d(m; n) = $a
∑∀i
|ASPHm(i)− ASPHn(i)|1 + ASPHm(i) + ASPHn(i)
+ $c
∑∀j
|CSPHm(j)− CSPHn(j)|1 + CSPHm(j) + CSPHn(j)
; (8)
where $a and $c are the weighting factors giving the chro-matic and achromatic spatial patterns diDerent weight-ings. A smaller value of d(m; n) indicates image m andn are more similar.In constructing image databases, we can compute the
ASPHs and CSPHs for each image and store them as theimage’s metadata (image index). Content-based imageretrieval can be done by comparing the query image’sindex with indices of the images in the database accordingto Eq. (8), and returning a set of images that are mostsimilar to the query.
4. Experimental results
We have performed extensive experiments to eval-uate the performance of indexing the chromatic andachromatic spatial patterns in content-based image in-dexing and retrieval. As a comparison, we have alsoimplemented one of the state-of-the-art image indexingtechniques, the colour correlogram method [5]. In allthe results presented, the colour correlogram was im-plemented exactly as those described in Ref. [5], andthe colour quantizer (64 colours) was trained using thesame set of 235 true colour images used to train the ASPand CSP quantizers. Again, FSCL algorithm was usedand each pixel was presented for training 20 times. Thesize of both ASP and CSP’s codebooks are 256. There-fore, the colour (auto-) correlogram is 256-dimensional(64 colour × 4 distances {1; 3; 5; 7} [5]), and the ASPHand CSPH are both 256-dimensional. Therefore, the stor-age and computational requirement of the current method

1680 G. Qiu / Pattern Recognition 35 (2002) 1675–1686
is 2 times that of colour correlogram’s. However, withthe rapid advancement in hardware technology, storing512 numbers alongside each image is trivia, and com-putation is still simple enough. It is much simpler thanthe joint histogram of [14] and the blobworld method ofCarson et al. [3]. Although our method requires signi7-cant amount of computation to design the codebooks, thiscan be done oD-line and needs only to be done once. Interms of constructing the histograms, only table look-upis involved, so the computation required is almost trivia.And because we are using non-overlapping blocks, weneed only to calculate the histograms for (M × N )=16blocks for an M ×N image. An added advantage of ourcurrent strategy is that we can utilise the ASP and CSPquantizers to compress images, thus enable indexing andretrieval of image in the compressed domain withouthaving to pre-compute the indexing meta-data. Prelimi-nary results along this line will be presented in Ref. [12].We will see in the following, with a slightly increase incomplexity, our method performs better than the colourcorrelogram method in one set of image database and atleast as well in another set of image database.
4.1. Colour texture database
In the 7rst set of experiments, we used a texturedatabase consisting of 120 diDerence texture classes, asubset of which is show in Fig. 3 as thumbnails. Eachof the 300 × 200 pixels true colour (24 bits) images 6
was divided into six 100 × 100 pixels non-overlappingsub-images, thus creating a database of 720 texture im-ages. In the experiment, each of the 720 images in thedatabase was used in turn as the query image. For eachquery image q, the distances between q and images inthe database, pi; d(q; pi) where i=1; 2; : : : ; 720; pi �= qwere calculated and sorted in increasing order and theclosest set of images are then retrieved. In the ideal case,the top 5 retrievals should be from the same large imageas the query image. The performance is measured interms of the retrieval rate (RR) de7ned as follows: Let qbe the query image from texture class Tk , i.e., q∈Tk andpj; j=1; 2; 3; 4; 5, be the 7rst 5 retrievals, the retrievalrate for query image q is
RR(q)=15
5∑j=1
S(pj) where
{S(pj)=1; if pj ∈Tk ;
S(pj)=0; if pj �∈ Tk :
(9)
A larger retrieval rate indicates better performance,and in the ideal case RR should equal to 100%. Table 1
6 There are 120 images in this collection and each imagewas judged by human observers as having a single class oftexture. This set of textures diDers signi7cantly from the MITVisTex database both in terms of colours and surface textures.
Fig. 3. Thumbnails images of a subset of the colour texturesin the colour texture database.
Table 1The number of queries and their retrieval rates for diDerentcontent-based image indexing and retrieval methods performedon a texture database consisting of 720 images and 120 diDerenttexture classes. Each image was used in turn as the queryimage; therefore 720 queries were performed. This table shouldbe interpreted as follows: for the colour correlogram method,482 queries achieved a retrieval rate of 100% and 130 queriesachieved a retrieval rate of 80% etc.
Methods Retrieval rates
5/5 4/5 3/5 2/5 1/5
Colour correlogram 482 130 68 33 7New ($a =1, $c =0) 394 166 78 54 28New ($a =0, $c =1) 538 106 52 16 6New ($a =1, $c =1) 626 58 24 8 4
shows the number of queries and their corresponding re-trieval rates for diDerent methods. The entries in the tableare the number of queries. For the colour correlogrammethod of Huang et al. [5], 482 queries (out of 720)achieved a retrieval rate of 100%, 130 queries achieveda retrieval rate of 80% and so on. Using the achromaticspatial pattern indexing alone, 394 queries achieved a re-trieval rate of 100%. Using the chromatic spatial patternindexing alone, 538 queries achieved a retrieval rate of100% and 106 queries achieved a retrieval rate of 80%. Itis seen that chromatic spatial pattern indexing alone hasoutperformed colour correlogram in this context. Com-bining the chromatic and achromatic spatial pattern in-dexing, there are 626 queries which achieved a retrievalrate of 100%, which is signi7cantly better than the colour

G. Qiu / Pattern Recognition 35 (2002) 1675–1686 1681
Fig. 4. Texture image database retrieval results of diDerent methods. The image on the top-left hand corner is the query image,subsequent ones, from left to right, top to bottom, are retrieved images ordered according to their similarities to the query image.(a) Result of colour correlogram method. (b) Result of the new method with $a =0, $c =1. (c) Result of the new method with$a =1, $c =0. (d) Result of the new method with $a =1, $c =1.
correlogram technique. We have also experimented us-ing a 4096-bin colour histogram indexing [1] as well, theperformance was very poor, and less than half the queriesachieved a retrieval rate of 100%. An example of the re-trieval results for colour correlogram of Huang et al. [5]and the new method are shown in Fig. 4, where the top48 returns of a particular query are displayed.As we brie;y mentioned in Section 2, ASP and CSP
are scaled by the average intensity of the pattern. Thishas the eDect of removing (to a certain extent) the in-;uence of the lighting conditions on the performanceof the indexing methods. Fig. 5 is one of the texturesin the database. As can be seen, the lighting is unevenacross the image. On the right-hand side of the image,the colour appears bright golden because light was re-;ected by the coins, whilst in the middle of the im-age, the coins appears darker and have diDerent colourappearance from those on the right. In such a situation,recognition methods based on colour but without some
sort of colour constancy measures will very likely fail.Fig. 6 shows the results of a query using one of thesub-images shown in Fig. 5 by the colour correlogramand the new method ($a =1; $c =1). It is seen thatwhile the new method retrieved all other 7ve sub-imagesfrom the same image in the top 7ve ranks, the colourcorrelogram has failed to do so. Observing the re-sults of all other 7ve queries by other 7ve sub-imagesof the same image, the new method achieved a re-trieval rate of 100% for all queries, whilst the colourcorrelogram has failed. This may suggest that the newmethod is somewhat “colour constant”, i.e., the his-tograms of ASP and CSPmay be invariant to illuminationconditions. Of course, colour constancy is an importantand challenging problem in colour imaging, more workis needed to make any general claim about the colourconstancy properties of the new technique. Our futurework will include evaluating the technique in this aspectand develop it to be invariant to illumination conditions.

1682 G. Qiu / Pattern Recognition 35 (2002) 1675–1686
Fig. 5. One of the texture images in the database. The lighting is unevenly distributed across the image.
Fig. 6. Retrieval results of a query using one of the sub-images from the image showed in Fig. 5. (a) Result of colour correlogrammethod. (b) Result of the new method with $a =1, $c =1. Since the lighting is unevenly distributed across the image, the sub-imagesare in eDect under diDerent illuminant, therefore even though the whole image contains the same coloured objects (same type ofcoin), the colours of the coins are diDerent at diDerent locations because colours are illuminant dependant. Since the coins havespecularly re;ective surface, it makes the colour appearance of the scene even more complicated. It is seen the retrieval rate forcolour correlogram is low whilst the retrieval rate of the new method is 100%.
4.2. Photography image database
To further evaluate the performance of our newmethod, we have tested it on two photography imagedatabases. Both are a sub-set of commercially availableCorel Photo collection. The 7rst database consists of4000 images and the second database consists of 20,000images. We have hand picked 96 pairs of similar imagesfrom various sources and divided them into set A andset B. For each image in set A, there is a corresponding
similar target image in set B, or vice versa. Fig. 7 showsa sub-set of these pairs of images. As can be seen, thecorresponding images are similar, but diDer in variousways. We used one set as query images, and embeddedthe other set into the database. The goal is to retrievethe corresponding target image from the database. Asin the previous experiment, we have also implementedthe colour correlogram method as a comparison. Foreach of the image in the database and in the query set,a colour correlogram, an achromatic and a chromatic

G. Qiu / Pattern Recognition 35 (2002) 1675–1686 1683
Fig. 7. A subset of 96 pairs of query images. These pairs are divided into set A and Set B, for each image in set A, there is acorresponding similar target image in set B, or vice versa.
Table 2Two diDerent methods’ image retrieval performance on a pho-tography image database consists of 4000 images. 96 querieswere performed. The table shows the number of queries andtheir target images rank range. This table should be interpretedas follows: for the colour correlogram method, 76 queries foundtheir corresponding targets in the 7rst rank, 84 queries foundtheir corresponding images within the 7rst 10 returned images,etc.
Methods Ranks
1 610 630 6100 ¿100
Colour correlogram 76 84 89 89 7New ($a =1, $c =1) 72 86 89 90 6
spatial pattern histograms were constructed. The dis-tances between the query image and all images in thedatabases were calculated according to Eq. (8). For eachquery, the images in the database were ranked accordingto their distances to the query image, and a small distancehas a higher rank. In the ideal case, the correspondingtarget image should be ranked in the No 1 position.Table 2 shows the results of using set A as query and
set B as target in a 4000 (4096 if the embedded target im-ages were counted) image database. The entries in the ta-ble are the number of queries and the rank position rangeof their corresponding target images. It is seen for thecolour correlogram method, 76 queries found their cor-responding targets in the 7rst rank (most similar), whilstthe new method had 72 queries found their targets inthe 7rst rank. Both methods had 89 queries which foundtheir corresponding targets within the 7rst 30 retrievedimages. On the other hand, the colour correlogram hadthe lowest rank in 1612 position, i.e., for this particular
Table 3Two diDerent methods’ image retrieval performance on a pho-tography image database consists of 20,000 images. Again 96queries were performed. The table shows the number of queriesand their target images rank range. This table should be in-terpreted as follows: for the colour correlogram method, 72queries found their corresponding targets in the 7rst rank, 81queries found their corresponding images within the 7rst 10returned images, etc.
Methods Ranks
1 610 630 6100 ¿100
Colour correlogram 72 81 85 87 9New ($a =1, $c =1) 65 79 84 88 8
query, you would have to look through the 7rst 1611 re-turned images to 7nd the target image, whilst the newmethod had the lowest rank of 282. However, in prac-tice, about 10 images can be displayed on the screen atany one time and the user of the query will normally notgo through more than 3 screens. We therefore, considera method which does not 7nd the target image withinthe 7rst 30 returned images as failure. From Table 2, wecan see that the success rate of colour correlogram was89=96, i.e., 92.7%, whilst the success rate of the newmethod was also 89=96, i.e., 92.7%. The average rank forall the successful queries (i.e., those returned their tar-gets with a rank 630) for the new method was 2.0 andfor the colour correlogram was 2.6. Overall, we see thenew method is comparable to colour correlogram.To investigate whether the method will scale to larger
image databases, we repeated the experiments on alarger image database consists of 20,000 images. Table 3shows the results. As can be seen, these results scale

1684 G. Qiu / Pattern Recognition 35 (2002) 1675–1686
Fig. 8. Some example query images and their target images’position when retrieved from a database of 20,000 images.
Fig. 9. Retrieval results from the 20,000 image database. The image on the top-left hand corner is the query image, subsequentones, from left to right, top to bottom, are retrieved image ordered according to their similarities to the query image. (a) Resultof colour correlogram method. (b) Result of the new method with $a =1, $c =1. It is seen that the new method returned imageswhich have more visual relevance.
quite well. Again, on average, the new method performedbetter than the colour correlogram method. In this case,the colour correlogram had the lowest rank in 7299 po-sition, i.e., for this particular query, you would have tolook through the 7rst 7298 returned images to 7nd thetarget image, whilst the new method had the lowest rankof 5684. Again, consider a query returned its target at arank higher than 30 as failure, the success rate of the newmethod was 84=96, i.e., 87.5%, and the success rate ofthe colour correlogram method was 85=96, i.e., 88.5%.The average rank for all the successful queries (i.e. thosereturned their targets with a rank 6 30) for the newmethod was 1.9 and for the colour correlogram was 2.5.Again we see the new method is comparable to colourcorrelogram. Fig. 8 shows some examples of the queryimages and their corresponding target images’ positionsretrieved by both methods from this large database.Visual assessment of the retrieved results showed
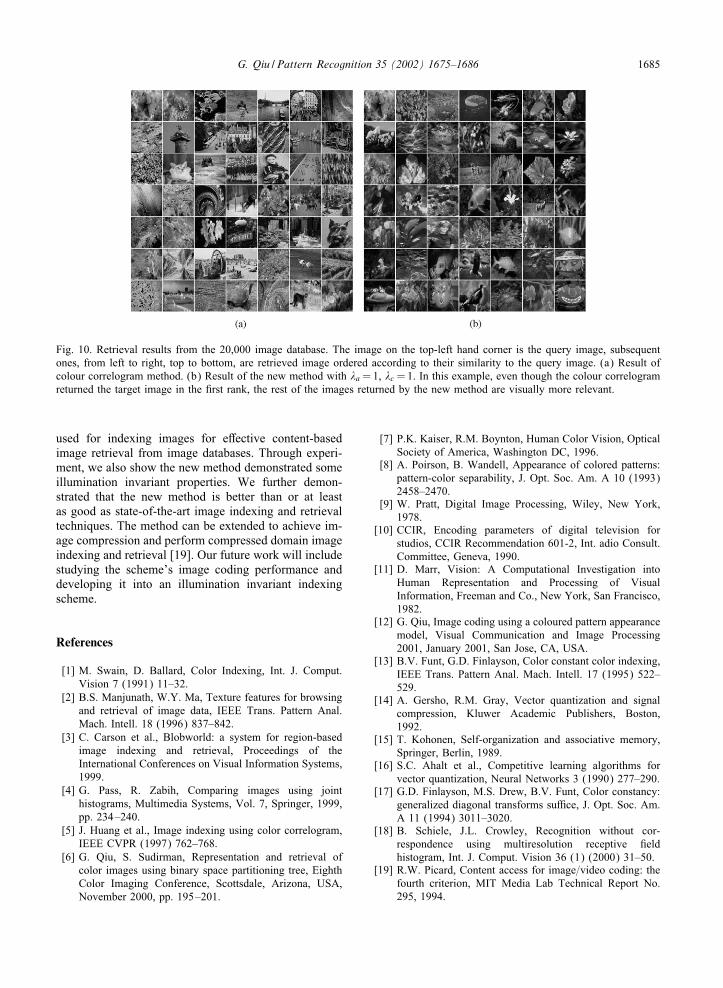
that the new methods returned more meaningful images.Figs. 9 and 10 show some examples. In Fig. 10 forexample, even though the colour correlogram methodretrieved the target in the 7rst rank position, browsingthese 7rst 48 retrieved images indicates that the newmethod returned visually more relevant images.
5. Conclusions
In this paper, we have developed a method to repre-sent and indexing the achromatic and chromatic signalsindependently. We justify the scheme from both humancolour vision theories’ viewpoint and modern digitalsignal processing viewpoint. Through extensive ex-periments, we demonstrated that the scheme could be
G. Qiu / Pattern Recognition 35 (2002) 1675–1686 1685
Fig. 10. Retrieval results from the 20,000 image database. The image on the top-left hand corner is the query image, subsequentones, from left to right, top to bottom, are retrieved image ordered according to their similarity to the query image. (a) Result ofcolour correlogram method. (b) Result of the new method with $a =1, $c =1. In this example, even though the colour correlogramreturned the target image in the 7rst rank, the rest of the images returned by the new method are visually more relevant.
used for indexing images for eDective content-basedimage retrieval from image databases. Through experi-ment, we also show the new method demonstrated someillumination invariant properties. We further demon-strated that the new method is better than or at leastas good as state-of-the-art image indexing and retrievaltechniques. The method can be extended to achieve im-age compression and perform compressed domain imageindexing and retrieval [19]. Our future work will includestudying the scheme’s image coding performance anddeveloping it into an illumination invariant indexingscheme.
References
[1] M. Swain, D. Ballard, Color Indexing, Int. J. Comput.Vision 7 (1991) 11–32.
[2] B.S. Manjunath, W.Y. Ma, Texture features for browsingand retrieval of image data, IEEE Trans. Pattern Anal.Mach. Intell. 18 (1996) 837–842.
[3] C. Carson et al., Blobworld: a system for region-basedimage indexing and retrieval, Proceedings of theInternational Conferences on Visual Information Systems,1999.
[4] G. Pass, R. Zabih, Comparing images using jointhistograms, Multimedia Systems, Vol. 7, Springer, 1999,pp. 234–240.
[5] J. Huang et al., Image indexing using color correlogram,IEEE CVPR (1997) 762–768.
[6] G. Qiu, S. Sudirman, Representation and retrieval ofcolor images using binary space partitioning tree, EighthColor Imaging Conference, Scottsdale, Arizona, USA,November 2000, pp. 195–201.
[7] P.K. Kaiser, R.M. Boynton, Human Color Vision, OpticalSociety of America, Washington DC, 1996.
[8] A. Poirson, B. Wandell, Appearance of colored patterns:pattern-color separability, J. Opt. Soc. Am. A 10 (1993)2458–2470.
[9] W. Pratt, Digital Image Processing, Wiley, New York,1978.
[10] CCIR, Encoding parameters of digital television forstudios, CCIR Recommendation 601-2, Int. adio Consult.Committee, Geneva, 1990.
[11] D. Marr, Vision: A Computational Investigation intoHuman Representation and Processing of VisualInformation, Freeman and Co., New York, San Francisco,1982.
[12] G. Qiu, Image coding using a coloured pattern appearancemodel, Visual Communication and Image Processing2001, January 2001, San Jose, CA, USA.
[13] B.V. Funt, G.D. Finlayson, Color constant color indexing,IEEE Trans. Pattern Anal. Mach. Intell. 17 (1995) 522–529.
[14] A. Gersho, R.M. Gray, Vector quantization and signalcompression, Kluwer Academic Publishers, Boston,1992.
[15] T. Kohonen, Self-organization and associative memory,Springer, Berlin, 1989.
[16] S.C. Ahalt et al., Competitive learning algorithms forvector quantization, Neural Networks 3 (1990) 277–290.
[17] G.D. Finlayson, M.S. Drew, B.V. Funt, Color constancy:generalized diagonal transforms su-ce, J. Opt. Soc. Am.A 11 (1994) 3011–3020.
[18] B. Schiele, J.L. Crowley, Recognition without cor-respondence using multiresolution receptive 7eldhistogram, Int. J. Comput. Vision 36 (1) (2000) 31–50.
[19] R.W. Picard, Content access for image=video coding: thefourth criterion, MIT Media Lab Technical Report No.295, 1994.

1686 G. Qiu / Pattern Recognition 35 (2002) 1675–1686
About the Author—G. QIU is a Lecturer of Computer Science at the School of Computer Science and IT, University of Nottingham,UK. Before joining Nottingham in October 2000, he was a Lecturer at the School of Computing, University of Leeds, UK; and theSchool of Computing and Mathematics, University of Derby, UK. He received his Ph.D. in neural networks and image processingin 1993 from the University of Central Lancashire, Preston, UK, and his B.Sc. in Electronic Measurement and Instrumentationin 1984 from the University of Electronic Science and Technology of China. From 1987 to 1990 academic years, he was also apostgraduate student at the Department of Electronic Engineering, Beijing Institute of Technology, studied and researched DigitalSignal Processing. In the summers of 1999 and 2000, he worked at British Telecommunications Laboratories as a Short-termResearch Fellow. His research covers many aspects of visual information processing including colour imaging, image databases,colour image coding for indexing and retrieval and web-based informatics. He has published some 50 papers in these areas includingrecent papers in IEEE Transactions on IP and CASVT. His research is funded by European Union and Industry. He has been aconsultant to UK and multinational companies.