Independent Public Service Pensions Commission: Interim Report
176
Independent Public Service Pensions Commission: Interim Report 7 October 2010 Independent Public Service Pensions Commission
Transcript of Independent Public Service Pensions Commission: Interim Report
8/8/2019 Independent Public Service Pensions Commission: Interim Report
http://slidepdf.com/reader/full/independent-public-service-pensions-commission-interim-report 1/176
Independent Public ServicePensions Commission:Interim Report
7 October 2010
IndependentPublic Service
Pensions Commission

8/8/2019 Independent Public Service Pensions Commission: Interim Report
http://slidepdf.com/reader/full/independent-public-service-pensions-commission-interim-report 2/176
8/8/2019 Independent Public Service Pensions Commission: Interim Report
http://slidepdf.com/reader/full/independent-public-service-pensions-commission-interim-report 3/176
IndependentPublic Service
Pensions Commission
Independent Public ServicePensions Commission:Interim Report
October 2010

8/8/2019 Independent Public Service Pensions Commission: Interim Report
http://slidepdf.com/reader/full/independent-public-service-pensions-commission-interim-report 4/176
Ofcial versions o this document are printed on 100%recycled paper. When you have fnished with it pleaserecycle it again.
I using an electronic version o the document, please consider theenvironment and only print the pages which you need and recyclethem when you have fnished.
© Crown copyright 2010
You may re-use this inormation (not including logos) ree o charge in any ormat or medium, under the terms o the OpenGovernment Licence. To view this licence, visit http://www.nationalarchives.gov.uk/doc/open-government-licence/or writeto the Inormation Policy Team, The National Archives, Kew,London TW9 4DU, or e-mail: [email protected] .
ISBN 978-1-84532-777-4PU1011
8/8/2019 Independent Public Service Pensions Commission: Interim Report
http://slidepdf.com/reader/full/independent-public-service-pensions-commission-interim-report 5/176
Indeendent Public Service Pensions Commission: Interim Reort - 7 October 2010
Contents
Foreword by Lord Hutton of Furness ........................................................................ 3
Executive Summary .................................................................................................. 7
Te Landscape .......................................................................................... 17
Chap : e pensions landscape .................................................................... 19
Chap : Recent reforms to public service pensions ......................................... 39
Te Principles ...........................................................................................49
Chap : e framework of principles ............................................................. 51
Chap : Aordable and sustainable ............................................................... 55
Chap : Adequate and fair ............................................................................. 85
Chap 6: Supporting productivity ..................................................................101
Chap : Transparent and simple ...................................................................113Reform .................................................................................................... 117
Chap 8: Short-term options for reform ..........................................................119
Chap 9: Long-term structural reform........................................................... 125
Annexes .................................................................................................. 131
Ax a: e Commission’s terms of reference ................................................. 133
Ax : Comparison of the dierent public service pension schemes ............... 135
Ax : Projection of future benet expenditure on public service pensions .... 139
Ax : Summary of evidence .........................................................................149 Ax : Panel of Experts ..................................................................................153
Ax f: List of charts and tables .......................................................................155
Ax g: Glossary ..............................................................................................159
Ax h: Abbreviations .....................................................................................167
Ax : Bibliography ....................................................................................... 169

8/8/2019 Independent Public Service Pensions Commission: Interim Report
http://slidepdf.com/reader/full/independent-public-service-pensions-commission-interim-report 6/176
Indeendent Public Service Pensions Commission: Interim Reort - 7 October 2010
8/8/2019 Independent Public Service Pensions Commission: Interim Report
http://slidepdf.com/reader/full/independent-public-service-pensions-commission-interim-report 7/176
3
Indeendent Public Service Pensions Commission: Interim Reort - 7 October 2010
Foreword by Lord Hutton of Furness
As we have all come to appreciate in recent years – whether we work in the private orpublic sectors – providing good quality pensions is becoming a much more challenging task given the increasing length of time that most people can now look forward to spending inretirement. is is particularly true of dened benet pensions, where a pension is ultimately determined by the level of a person’s earnings, rather than the level of their pensioncontributions. Dened benet pensions make up most of the pensions on oer to public
service employees and they raise substantial issues of aordability as well as risk sharing. As my interim report makes clear, there have been important attempts made to addressthe underlying drivers that have seen costs of providing public service pensions increasesharply in recent years. I welcome these reforms as they have helped to strike a better balancebetween employees and taxpayers in the distribution of pension costs. But as my reportalso makes clear we must satisfy ourselves that we have fully and openly addressed all of theunderlying pressures that are still pushing up the cost of providing public service pensions.To do this properly we need to expose all the real costs of providing the current range of public service pensions as well as understand the real benets they represent to employees.
e public sector performs functions that are vital to the security of our country, the success
of our economy and the health of our society. ere is therefore a compelling public policy objective in being able to recruit and retain the best possible people for these crucially important jobs. As many people have rightly pointed out in their evidence to me, we shouldregard public service pensions as part of an eectively designed overall remuneration systemthat will allow us to achieve this end. In doing so we need to keep rmly in mind the needfor fairness and eciency in the use of scarce public resources. And whilst it is right thattaxpayers nance a proportion of public service pensions, as they are also the recipients of the services that are provided by employees, they are also entitled to expect that their hardearned money is spent wisely and to the best possible eect right across the public sector.
First and foremost, pensions are provided in order to ensure an adequate income whensomeone stops working which can help them sustain a reasonable standard of living withoutbecoming a burden on the welfare state. If we lose sight of this when we consider the casefor reform and end up pushing more people into a reliance on state benets in retirement,
we may well nd that overall costs are likely to rise, whatever changes might be made to thedesign of public service pensions. Simple, sloganistic approaches are not the answer. Any reforms must try and avoid this obvious pitfall.
My interim report therefore attempts to establish a proper baseline from which we cananswer the fundamental question – are public service pensions on a fair and sustainablefooting that provides the best possible value for money to the taxpayer as well as adequate
retirement incomes for public service employees? It is my clear view that the gures in thisreport make it plain that the status quo is not tenable. I believe we need to adopt a moreprudent approach to meeting the cost of public service pensions in order to strike a fairerbalance not just between current taxpayers and public service employees but also between

8/8/2019 Independent Public Service Pensions Commission: Interim Report
http://slidepdf.com/reader/full/independent-public-service-pensions-commission-interim-report 8/176
4
Indeendent Public Service Pensions Commission: Interim Reort - 7 October 2010
current and future generations. In the short term, however, I consider there is also a strongcase for looking at some increase in pension contributions for public service employees, tobetter meet the real costs of providing these pensions, the value of which has risen in recentyears with most of these extra costs falling to taxpayers. Ministers should, however, proceedcarefully and ensure adequate protection and proper safeguards to protect accrued rights,avoid undue hardship and minimise the risk of any rise in the number of employees who optout of scheme membership. In particular, I would not recommend introducing contributionrates for the armed forces at this time. is issue should be dealt with in a way that isconsistent with any long-term reforms.
In undertaking this review, I have been struck both by the enormous complexity of thesubject matter, as well as by the degree of misunderstandings and confusions that surroundany debate about it. My report tries to dispel some of these myths. It is mistaken to talk about ‘gold-plated’ pensions as being the norm across the public sector. In the most part,the pensions that are paid out to public service employees when they retire are fairly modestby any standard, although in part these reect part-career or part-time working. For somepeople these modest pensions now look over generous because of the changes that havetaken place in the private sector over the last 30 years or so, where pensions have becomegenerally much less valuable than they used to be. Fewer people in the private sector are alsocontributing to a pension. I hope these negative trends can be reversed and I fully supporteorts to do so.
is downward drift in pension provision in the private sector does not however providesucient support or justication in my view for the argument that pensions in the publicsector must therefore automatically follow the same course. I regard this as a counsel of despair. In making clear I believe there is a case for further reform I have therefore rejected arace to the bottom as the only answer, and hope that reformed public service pensions can beseen as once again providing a benchmark for the private sector to aim towards.
My nal report will therefore look at a wider range of radical solutions that might representa better balance between the need for fairness between taxpayers and scheme members –allowing for increasing longevity – and the need to ensure adequate retirement incomes forthose who have devoted some or all of their careers in the service of the wider community.It is for this reason and to ensure that public service pension schemes represent the bestpossible value for money to the taxpayer, that I have set out a set of general principles thatshould guide and govern the appraisal of all of the options for longer-term reform. Each of these options will be assessed against these general principles. I consider that the public sectorshould continue to set a good standard as an employer and this includes a good standard of pension provision that seeks to avoid widespread opt-out of public service employees fromthese pension schemes. Promoting a responsible approach that encourages employees in thepublic sector to save for their retirement should be uppermost in our minds.
My interim report has also tried to tell the full story of who benets most from the currentsystem. Final salary schemes, which are the norm across much of the public sector, primarily reward high earners who progress rapidly through the salary scales. I am concerned that this

8/8/2019 Independent Public Service Pensions Commission: Interim Report
http://slidepdf.com/reader/full/independent-public-service-pensions-commission-interim-report 9/176
5
Indeendent Public Service Pensions Commission: Interim Reort - 7 October 2010
may no longer provide a robust and fair mechanism for the majority of the public service workforce. I will return to this issue in my nal report.
Pensions are long-term commitments and any reform I propose must protect the rights thatpublic service workers have already accrued. e recommendations in my nal report willensure these rights are protected and I am taking advice on how this might best be dened.However I am clear that protecting accrued rights does not extend as far as protectingcurrent terms for future pension accrual.
Finally, I have looked at the issue of how we currently deal with the pensions of those
employees who move from the public sector when services are taken over by new providers.It would be unwise to allow the current arrangements to apply an unintended brake on thedevelopment of a more mixed economy of providers in the public sector. ere is, at present,a danger of this happening. is issue will be dealt with in my nal report and will form partof my appraisal of long-term reform options.
My nal report will be completed next year. I am extremely grateful to all those who havesubmitted evidence to my Commission to date and to the panel of experts who are advisingme in this work. I intend to conduct the widest possible consultation over the next few monthsas I now begin to examine options for long-term structural reform. I hope to build the widestpossible measure of consensus about the way forward. I realise this will not be easy. But it is my
belief that in nalising my recommendations, it will be possible to design a set of solutions thatmeet and address the principles I have set out in this interim report.
Lord Hutton of Furness

8/8/2019 Independent Public Service Pensions Commission: Interim Report
http://slidepdf.com/reader/full/independent-public-service-pensions-commission-interim-report 10/176
Indeendent Public Service Pensions Commission: Interim Reort - 7 October 2010
8/8/2019 Independent Public Service Pensions Commission: Interim Report
http://slidepdf.com/reader/full/independent-public-service-pensions-commission-interim-report 11/176
7
Indeendent Public Service Pensions Commission: Interim Reort - 7 October 2010
Executive Summary
The importance of public service pensions
Ex. Public service pensions provide retirement incomes for millions of people in the UK.
In total there are 12 million active, deferred or pensioner members and dependants of publicservice pension schemes. at is around one in ve people in the UK. Each year schemes pay out billions of pounds to their pensioners – in 2008-09 payments were £32bn, about two-thirds of the cost of the basic State Pension.
Ex. Many of the current public service pension design features, including accrual rates,pension ages and the link to nal salary, date back nearly 200 years, despite the enormousupheavals in demography and in the nature of work in our economy. In 1841, someone whoreached the age of 60 might expect to live a further 14 years on average, but most peopledid not live to this age. By the early 1970s, when the schemes were substantially reformed,the life expectancy of a 60 year old had increased to about 18 years and this has now risen to
around 28 years. In addition, many more people can now expect to reach 60.
Ex. In the past the public service pension schemes have provided a lead for employers inthe private sector, but more recently there has been signicant divergence. e pensionslandscape in the private sector has been varied, but over the rst two thirds of the lastcentury the number of people in private sector pension schemes grew, almost all of whichfollowed the dened benet structure of the public sector. Over the last third of the century and the start of this century, the picture has been very dierent.
Ex. e general trend from the 1950s has been one of increasing public service provision –particularly once allowance is made for the inclusion of many nationalised industry schememembers within the public sector gures for the 1950s to the 1980s. is is set against a fallin provision in the private sector, especially in dened benet provision, which is not fully oset by the increase in dened contribution provision.
Ex. e trend is increasing, with a sharp fall in dened benet provision in the privatesector since the late 1990s. Whilst the provision of dened contribution schemes hasincreased signicantly, there are still a growing number of employees with no provision. Infact, around 85 per cent of public sector employees have some form of employer sponsoredpension provision compared to around 35 per cent in the private sector.

8/8/2019 Independent Public Service Pensions Commission: Interim Report
http://slidepdf.com/reader/full/independent-public-service-pensions-commission-interim-report 12/176
Indeendent Public Service Pensions Commission: Interim Reort - 7 October 2010
Chart Ex.1: Private sector employees by type of pension provision
Source: Annual Survey of Hours and Earnings, 2009
Ex.6 is divergence between the public and private sectors is of concern, particularly in thecontext of mobility between the public and private sectors. However, it does not necessarily follow that public service pension schemes should be modelled in future on what has beenhappening in the private sector in recent years, especially given the decline in private pensionprovision and the concern that saving levels in the private sector are not currently optimal.It is important to take into account other issues as we consider future options, including theneed to ensure public service pensions provide adequate retirement incomes for retirees.
Ex. e key question regarding public service pensions is whether they t the needs of amodern exible workforce, whilst being aordable, sustainable, adequate and fair to bothtaxpayers and employees.
The need for reform
Ex.8 e need to modernise public service pensions has been recognised for some time,in particular the need to deal with increasing costs: between 1999-2000 and 2009-10 theamount of benets paid from the ve largest public service pension schemes increasedby 32 per cent.1 is increase in costs was mainly driven by an increase in the numberof pensioners, a result of the expansion of the public service workforce over the last fourdecades, longer life expectancy and the extension of pension rights for early leavers and
women.
1 Based on estimates by the GAD undertaken for the IPSPC. IPSPC analysis of schemes Resource Accounts.
0%
10%
20%
30%
40%
50%
60%
70%
80%
90%
100%
1997 1998 1999 2000 2001 2002 2003 2004 2005 2006 2007 2008 2009
P e r c e n t
Year
DB scheme DC scheme
Unknown No provision
Public sector pension provision
8/8/2019 Independent Public Service Pensions Commission: Interim Report
http://slidepdf.com/reader/full/independent-public-service-pensions-commission-interim-report 13/176
Indeendent Public Service Pensions Commission: Interim Reort - 7 October 2010
Ex.9 e previous Government recognised these issues and in 1997 started a series of signicant reforms. ese included:
• limited increases in pension age or groups such as the uniormed services, mostly ornew entrants. In the civil service, NHS and teachers schemes existing members wereallowed to keep a pension age o 60 i they wished, but new entrants have a pensionage o 65 and pension ages lower than 65 will be phased out by 2020 in the LocalGovernment Pension Scheme;
• sharing o risk arising rom demographic change in the orm o ‘cap and share’ rules.
This spreads the cost o any uture unexpected increases in contributions moreequitably between employer and employees than previously, up to a cap ater whichany uture increases would be borne by the members. Cap and share at presentapplies to the our biggest schemes – NHS, teachers, local government and civilservice, although it has not yet aected employee contributions in any scheme andthe Local Government Pensions Scheme does not yet have a cap set; and
• changed accrual rates or many o the reormed schemes, particularly or new entrants, but all except the civil service are still based on fnal salary. The change to acareer average structure in the civil service scheme was not primarily undertaken as acost saving measure, but as a response to the changing nature o the workorce.
Ex. More recently the current Government changed the measure of annual pricemovements, so that from April 2011 onwards pensions uprating will move from the RetailPrice Index (RPI) to the Consumer Price Index (CPI).
Ex. is change in the indexation measure may have reduced the value of benets toscheme members by around 15 per cent on average. When this change is combined withother reforms to date across the major schemes the value to current members of reformedschemes with CPI indexation is, on average, around 25 per cent less than the pre-reformschemes with RPI indexation.
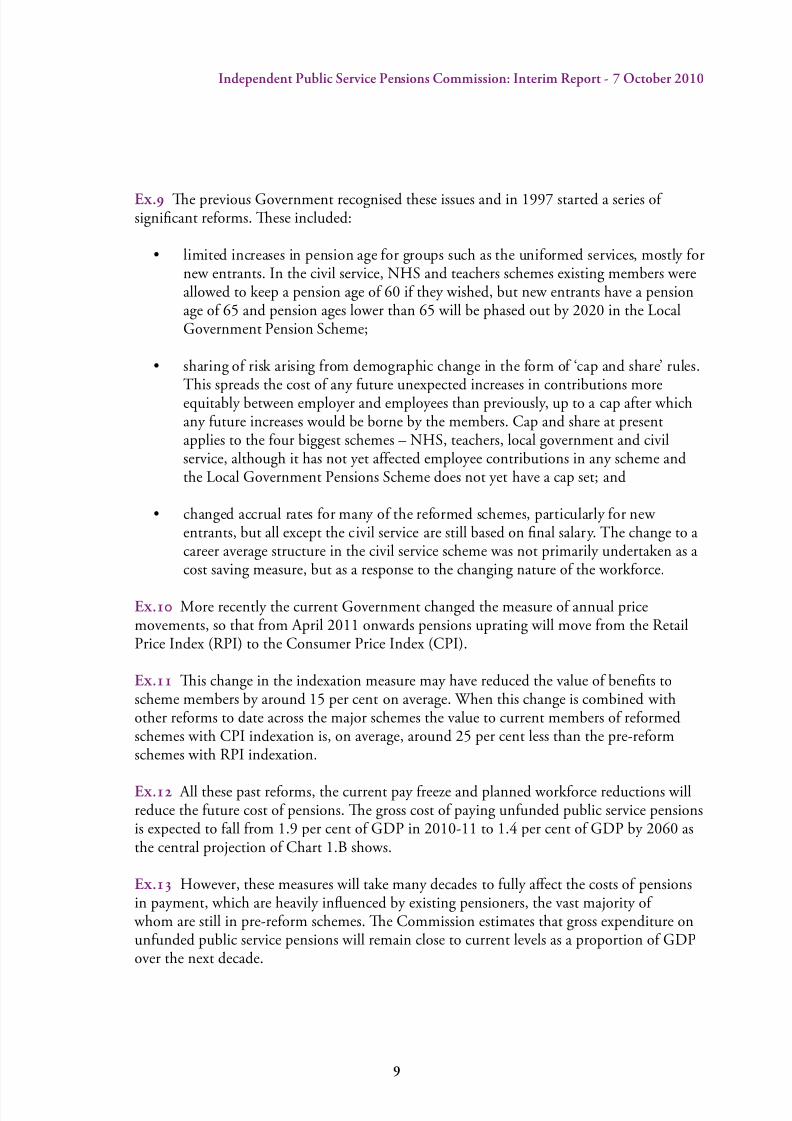
Ex. All these past reforms, the current pay freeze and planned workforce reductions willreduce the future cost of pensions. e gross cost of paying unfunded public service pensionsis expected to fall from 1.9 per cent of GDP in 2010-11 to 1.4 per cent of GDP by 2060 asthe central projection of Chart 1.B shows.
Ex. However, these measures will take many decades to fully aect the costs of pensionsin payment, which are heavily inuenced by existing pensioners, the vast majority of
whom are still in pre-reform schemes. e Commission estimates that gross expenditure onunfunded public service pensions will remain close to current levels as a proportion of GDPover the next decade.
8/8/2019 Independent Public Service Pensions Commission: Interim Report
http://slidepdf.com/reader/full/independent-public-service-pensions-commission-interim-report 14/176
10
Indeendent Public Service Pensions Commission: Interim Reort - 7 October 2010
Chart Ex.2: Projected pension payments as a percentage of GDP –sensitivity analysis
Source: GAD analysis for the IPSPC
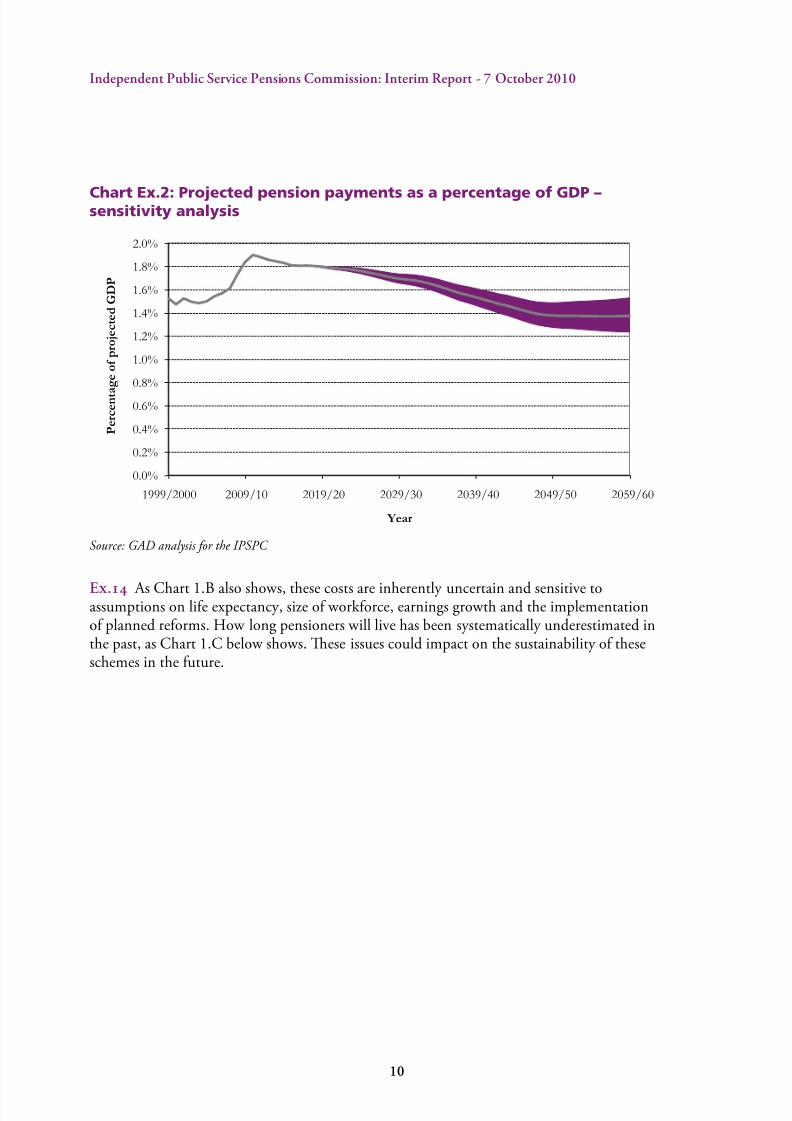
Ex. As Chart 1.B also shows, these costs are inherently uncertain and sensitive toassumptions on life expectancy, size of workforce, earnings growth and the implementationof planned reforms. How long pensioners will live has been systematically underestimated inthe past, as Chart 1.C below shows. ese issues could impact on the sustainability of theseschemes in the future.
0.0%
0.2%
0.4%
0.6%
0.8%
1.0%
1.2%
1.4%
1.6%
1.8%
2.0%
1999/2000 2009/10 2019/20 2029/30 2039/40 2049/50 2059/60
P e r c e n t a
g e o f p r o j e c t e d G D P
Year
8/8/2019 Independent Public Service Pensions Commission: Interim Report
http://slidepdf.com/reader/full/independent-public-service-pensions-commission-interim-report 15/176
11
Indeendent Public Service Pensions Commission: Interim Reort - 7 October 2010
Chart Ex.3: Actual and projected period life expectancy at birth for UKmales
Source IPSPC analysis drawing on C Shaw 2007 and ONS 2008 population projections.
Ex. e expected proportion of adult life spent in retirement has increased as people livelonger. A male pensioner in the NHS scheme who retired at 60 today is expected to spend41 per cent of their adult life in retirement compared to 28 per cent if they retired in 1955.is means the value of a public service pension in 2003-04 is expected to be around a thirdhigher than it would have been if assumptions about life expectancy were the same as thosein 1955.
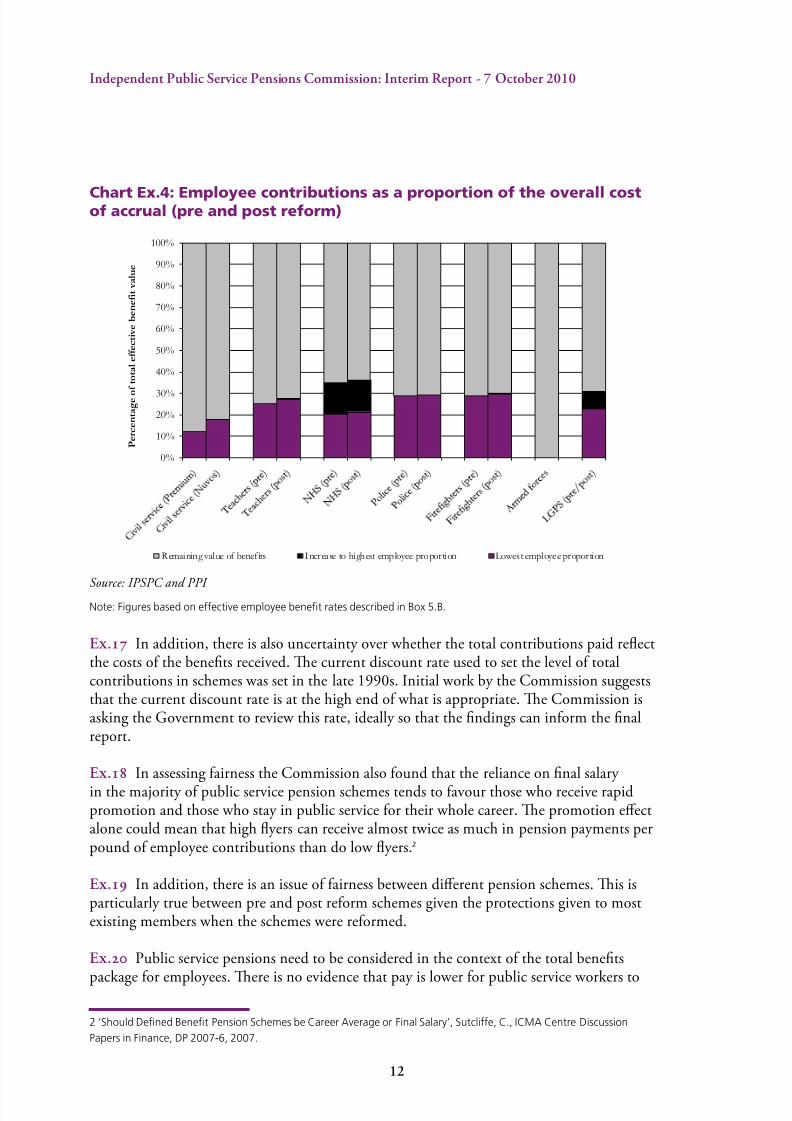
Ex.6 e increase in longevity also means that these pensions are now likely to be paidout for longer, increasing the overall costs. ese extra costs, despite recent reforms, havenot been equally split between employer and employees. Although the way costs are dividedvaries from scheme to scheme, the signicant majority is met by the employer and by extension the taxpayer, as the Chart 1.D shows. is is not unique to public service pensionschemes, but when many of the public service pension schemes were introduced employersand employees paid similar levels of contributions to the scheme – now employers pay around twice what employees contribute in most of the schemes and sometimes more.
66
68
70
72
74
76
78
80
82
84
1966 1976 1986 1996 2006 2016 2026
L i f e e x p
e c t a n c y a t b i r t h
Year
Actual
2008 based
2004 based
2002 based
1998 based
1992 based
1991 based
1989 based
1985 based
1977 based
1971 based
( y e a r s )
8/8/2019 Independent Public Service Pensions Commission: Interim Report
http://slidepdf.com/reader/full/independent-public-service-pensions-commission-interim-report 16/176
12
Indeendent Public Service Pensions Commission: Interim Reort - 7 October 2010
Chart Ex.4: Employee contributions as a proportion of the overall costof accrual (pre and post reform)
Source: IPSPC and PPI Note: Figures based on effective employee benet rates described in Box 5.B.
Ex. In addition, there is also uncertainty over whether the total contributions paid reectthe costs of the benets received. e current discount rate used to set the level of totalcontributions in schemes was set in the late 1990s. Initial work by the Commission suggeststhat the current discount rate is at the high end of what is appropriate. e Commission isasking the Government to review this rate, ideally so that the ndings can inform the nalreport.
Ex.8 In assessing fairness the Commission also found that the reliance on nal salary in the majority of public service pension schemes tends to favour those who receive rapidpromotion and those who stay in public service for their whole career. e promotion eectalone could mean that high yers can receive almost twice as much in pension payments perpound of employee contributions than do low yers.2
Ex.9 In addition, there is an issue of fairness between dierent pension schemes. is isparticularly true between pre and post reform schemes given the protections given to mostexisting members when the schemes were reformed.
Ex. Public service pensions need to be considered in the context of the total benets
package for employees. ere is no evidence that pay is lower for public service workers to
2 ‘Should Dened Benet Pension Schemes be Career Average or Final Salary’, Sutcliffe, C., ICMA Centre Discussion
Papers in Finance, DP 2007-6, 2007.
0%
10%
20%
30%
40%
50%
60%
70%
80%
90%
100%
P e r c e n t a g e o
f t o t a l e f f e c t i v e
b e n e f i t v a l u e
Remaining value of benefits Increase to highest employee proportion Lowest employee proportion
8/8/2019 Independent Public Service Pensions Commission: Interim Report
http://slidepdf.com/reader/full/independent-public-service-pensions-commission-interim-report 17/176
13
Indeendent Public Service Pensions Commission: Interim Reort - 7 October 2010
reect higher levels of pension provision. Consequently current pension schemes do notappear to oer best value for money.
Ex. Evidence to the Commission has also made it clear that current pension structures,combined with the requirement to provide comparable pensions (‘Fair Deal’), are a barrierto non-public service providers, potentially reducing the eciencies and innovation in publicservice delivery that could be achieved.
Ex. It has been suggested that extending access to public service pension schemes for nonpublic service employees could be a solution to this problem. But it is not clear that this
provides a solution either for the Government, which has to accept additional liabilities andlong-term risk, or for some external organisations, which, depending on the scheme they are entering, may be required to pay a premium or indemnity for entry, take part in decitrecovery plans, or pay large exit charges.
Ex. When examining transparency it was clear that the debate around public servicepensions has been hampered by a lack of consensus on what are the key facts and gures anda lack of transparency of the relevant data. is report seeks to provide as comprehensive apicture as possible in order to supply the basis for well-informed debate. In the nal reportthe Commission will consider ways in which transparency and scrutiny can be improved.
Ex. e Commission has also come to the conclusion that it remains reasonable tocontinue to operate arrangements without actual funds as the basic nancing model, giventhe risks, lack of obvious economic benet and transition costs of moving to a fully fundedmodel. Equally, there is no reason to de-fund existing funded schemes.
The principles of public service pension provision
Ex. is is therefore an appropriate time to take overall stock of the situation and beginto address the underlying issues of scheme design and management of costs into the future.e Commission has identied a set of principles against which long-term options forreform should be judged. ese are:
• affordability and sustainability – what level o pension cost is aordable is a politicaldecision or the Government within the context o a range o priorities. But it is notan issue that can just be looked at in the short-term. In assessing aordability andsustainability we have identifed a range o relevant cost measures to consider andthe need or an agreed discount rate. Part o any assessment o cost must include theconsequences o any reorm on increased take-up o benefts such as pension credit.Critical to sustainability is the sensitivity o uture costs to risks, such as changes tolongevity and how these risks are managed as well as shared;

8/8/2019 Independent Public Service Pensions Commission: Interim Report
http://slidepdf.com/reader/full/independent-public-service-pensions-commission-interim-report 18/176
14
Indeendent Public Service Pensions Commission: Interim Reort - 7 October 2010
• adequacy and fairness – public service pensions should provide an adequate level o retirement income or public service workers with a reasonable degree o certainty. Toassess reorms against this principle we need an agreed measure o what is adequateand what should be measured against the benchmark. We provide some ideas in thisinterim report. Adequacy is a measure o airness, but we are also looking at airnessin the distribution o contributions and benefts between members o the samepension scheme; airness between dierent schemes; airness between generations o taxpayers; and airness between the taxpayer and the public service employee;
• supporting productivity – to support productivity, public service pension scheme
design should be consistent with an efcient labour market or employees. Thisshould allow the taxpayer to be confdent that public services are being deliveredon a value or money basis. In general, scheme design should avoid barriers to themovement o employees between sectors. This needs to be viewed in the context o the whole remuneration package and whether the schemes support the recruitmentand retention o the right people in the right jobs in a cost-eective way and dealexibly with specifc job issues. In particular, they should not be an unintendedbarrier to the outsourcing and mutualisation o public services that could drivegreater productivity and efciency in public services; and
• transparency and simplicity – public service pensions should be widely understood,
both by the scheme members with regard to their own specifc entitlements andpossible uture benefts; and by taxpayers who have a role in unding the schemes.The key design eatures and the costs to employers and employees need to be set outclearly and transparently. Assessment o reorm needs to consider potential trade-os together with implementation and transitional issues, including the means orprotecting accrued rights and possibilities or more cost-eective administration. It isalso important that public service pension schemes, like schemes in the private sector,have a clear legal ramework and have eective and accountable governance structures.
Options for change
Short-term options
Ex.6 e issues around fairness, sustainability, promoting productivity and the need fortransparency and simplicity mean there is a need to consider long-term structural reformof public service pensions. However, that reform will take time. Increased longevity,the imbalance between employer and employee contributions and the fact that totalcontributions may be too low if the discount rate is too high suggests there is a case to makeshort-term changes, pending long-term reform.
Ex. e Commission considered a range of options that may provide short-term savings,specically:

8/8/2019 Independent Public Service Pensions Commission: Interim Report
http://slidepdf.com/reader/full/independent-public-service-pensions-commission-interim-report 19/176
15
Indeendent Public Service Pensions Commission: Interim Reort - 7 October 2010
• changing the benefts structure;
• contracting public service pension schemes into the State Second Pension; and
• increasing contribution rates.
Ex.8 Of these, the most eective way to make short-term savings is to increase membercontributions and there is also a clear rationale for doing so.
Ex.9 It is a matter for the Government to decide the manner and level of any increases
in contributions necessary. However, the Commission feels that any increases should bemanaged so as to protect the low paid and, if possible, increases in contributions should bestaged and need to be considered with a view to preventing a signicant increase in opt outrates. e Commission does not recommend introducing contribution rates for the armedforces at this time.
Long-term options
Ex. e current public service pensions structure was not designed for modern workingpatterns and has been unable to respond exibly to changes in this area and to demographic
change over the past few decades. is has led to:
• rising benefts due to increasing longevity;
• unequal treatment o members within the same proession;
• unair sharing o costs between the employee, the employer and taxpayers; and
• not realising the potential or plurality in the ways public services are provided.
Ex. Long-term structural reform is needed, as these issues cannot be dealt withthrough traditional nal salary dened benet schemes. But neither can they be dealt withappropriately through a funded, individual account, dened contribution model for allemployees, which would place a major nancing burden on taxpayers, ignore the ability of Government as a large employer to manage certain types of risk and increase uncertainty of post-retirement income for scheme members, which is dicult in particular for the low paidto manage.
Ex. In the Commission’s nal report a range of alternative structures will be considered.is will include a career average alternative to the current nal salary dened benetschemes. Drawing upon international experiences, alternatives such as Sweden’s use of
notional dened contribution schemes and the Netherlands’ collective dened contributionschemes will be examined, as will risk sharing models, such as hybrid schemes that combineelements of dened benet and dened contribution models. e Commission will alsoconsider elements of scheme design, such as, ensuring normal pension ages are in line

8/8/2019 Independent Public Service Pensions Commission: Interim Report
http://slidepdf.com/reader/full/independent-public-service-pensions-commission-interim-report 20/176
1
Indeendent Public Service Pensions Commission: Interim Reort - 7 October 2010
with the latest developments in longevity. is will enable the Commission to make arecommendation on a range of options to the Government, which can establish a moreappropriate framework for public service pensions going forward.

8/8/2019 Independent Public Service Pensions Commission: Interim Report
http://slidepdf.com/reader/full/independent-public-service-pensions-commission-interim-report 21/176
17
Indeendent Public Service Pensions Commission: Interim Reort - 7 October 2010
The Landscape
IndependentPublic Service
Pensions Commission

8/8/2019 Independent Public Service Pensions Commission: Interim Report
http://slidepdf.com/reader/full/independent-public-service-pensions-commission-interim-report 22/176
1
Indeendent Public Service Pensions Commission: Interim Reort - 7 October 2010
8/8/2019 Independent Public Service Pensions Commission: Interim Report
http://slidepdf.com/reader/full/independent-public-service-pensions-commission-interim-report 23/176
1
Indeendent Public Service Pensions Commission: Interim Reort - 7 October 2010
1 The pensions landscape
Box 1.A: Summary
• Many features of public service pension schemes are a historical legacy, including accrual
rates, pension ages and nal salary structures.
• Most public service pension schemes are unfunded, dened benet (DB) nal salary
schemes. Normal pension ages are usually 60 or 65, but some are lower, particularly foruniformed services such as the police. There is signicant variation in the percentages of
pay that employees contribute to their schemes.
• While public service pension schemes once led the way in terms of scheme features, they
have not kept pace with changes such as improvements in longevity. They have also not
been developed in a fully coherent way, with a multiplicity of complex provisions and
overlapping coverage of various categories of public servants and employers.
• Around one in ve UK citizens has some entitlement to a public service pension. The total
amounts paid out are large: £32 billion in 2008-09, about two thirds of the cost of the
basic State Pension.
• There is considerable variation between payments to public service pensioners. The average
(mean) amount of pension paid is around £7,800 per year (falling to £6,500 when the
payment of pensions to dependants is included) and about half of pensioner members
receive less than £5,600 per year. 90 per cent of pensioner members receive less than
£17,000 per year.
• State pensions have undergone signicant reform in recent years. Changes to the basic
State Pension and the State Second Pension will increase the numbers who receive State
pensions and the amounts paid to lower earners. There are also planned increases in the
State Pension Age to deal with increasing longevity. A review of whether the timetable for
these increases should be advanced was announced at Budget 2010 in June.
• Meanwhile in the last few decades pension provision in the private sector has increasingly
diverged from the public service model, in response to pressures around longevity, changes
in the business environment and investment risk. This has led to a sharp decrease in the
provision of DB schemes and an increase in the number of employees without any provision
at all. Governments, past and present, have therefore attempted to address the inadequate
level of pensions coverage in the private sector.a The move towards automatic enrolment of
employees into occupational pension schemes is an important step forward in tackling this
problem.
a The new Government’s ‘programme for government’ says that We will simplify the rules and regulations relating
to pensions to help reinvigorate occupational pensions, encouraging companies to offer high quality pensions to allemployees, and we will work with business and the industry to support auto enrolment (page 26).

8/8/2019 Independent Public Service Pensions Commission: Interim Report
http://slidepdf.com/reader/full/independent-public-service-pensions-commission-interim-report 24/176
20
Indeendent Public Service Pensions Commission: Interim Reort - 7 October 2010
Public service pensions history
. Public service pensions are more widely available, have longer histories and have beensubject to less structural change than their counterparts in the private sector. e principalfeatures of public service pensions have remained largely unchanged since their introductioneven though the original reasoning may no longer fully apply.
. Some features, such as pension ages of 60, nal salary structures and accrual rates, goback to civil service terms of the 19th and early 20th centuries, or even earlier – the civilservice scheme being the original public service scheme.1 e earlier pension ages enjoyed by
most members of the police, reghters and armed forces schemes also date back to the 19thand early 20th centuries.
. At that time life expectancy was much lower than today. In 1841, someone who reachedthe age of 60 might expect to live a further 14 years on average, but most people did notlive to this age. By the early 1970s, when the schemes were substantially reformed, the lifeexpectancy of a 60 year old had increased to about 18 years and this has now risen to around28 years. In addition, many more people can now expect to reach 60. Life expectancies formembers of public service pension schemes are typically assumed to be higher than thesenational average gures (see Chart 4.D).
. is increase in longevity represents an increase of about a third in the cost of providinga pension since the mid 1950s.2 For public service employees, most of the cost of thisincrease has so far been met by employers and therefore taxpayers.
. e link between pension and nal salary is also long-standing, with its roots in the17th century. Although the formulae used have changed over time, they have always beenbased on earnings in the last few years before retirement.
.6 e accrual rate of 1/60th of nal salary for each year’s service dates from the civilservice scheme in 1859 and the accrual rate of 1/80th of nal salary, plus 3/80ths for aseparate lump sum, was introduced for the civil service in 1909.
. e employee contribution rates – the percentage of salary that employees pay as anexplicit contribution towards pension costs – have changed somewhat in recent years, butthe general levels still reect the historic legacy. For example, the civil service scheme only had standard contributions for members from 1972, initially only to pay for dependants’benets. It retains rates of 1.5 per cent or 3.5 per cent. Employee rates of 5 per cent or6 per cent for teachers, local government and the NHS date back to the rst half of the 20thcentury. e average rates today are around 6.5 per cent.
.8 ere has not been a standard formula for determining the proportion of cost to be
covered through employee contributions. However, some of the initial contribution rates,
1 An explanation of the key terms used in this report can be found in the glossary at Annex G.
2 Chapter 4, paragraph 4.42

8/8/2019 Independent Public Service Pensions Commission: Interim Report
http://slidepdf.com/reader/full/independent-public-service-pensions-commission-interim-report 25/176
21
Indeendent Public Service Pensions Commission: Interim Reort - 7 October 2010
such as for teachers and local government, were designed so that employees would meet half of the costs.3 At other times, such as when police and reghters employee contributions
were revised in the 1980s, the intention was that employee contributions should cover onethird of the cost.4
.9 Historically public service pensions have led the way in design features. For example,they gave men and women the same pension ages long before other schemes and pioneeredination protection (in 1920), pensions for leavers before retirement age and transfers of rights between schemes.
. However, it is fair to say that the development of public service pension schemes hasnot been a planned and fully coherent process, and there is a plethora of complex provisions.Dierent schemes, designs and contributions apply to people employed in similar publicservice jobs, sometimes for the same employer. For instance, school teachers in England and
Wales are usually members of the Teachers’ Pension Scheme, while teaching assistants areusually members of the Local Government Pension Scheme (LGPS).
The public service pensions landscape
. Public service pension schemes range in size from the LGPS, which in total have
well over 4.5 million members, to arrangements set up for one or two individuals. Totalpayments to public service pensioners and their dependants were almost £32 billion in2008-09; lump sums account for a fth of these payments. is compares to £50 billion paidthrough the basic State Pension5 so the importance of public service pensions to retirementincomes is evident.
. In total, about 12 million people are members of a public service pension scheme, orreceive pensions as dependants of deceased members.6 So about one in ve UK citizens hassome entitlement to a public service pension. ere are around three hundred public servicepension schemes, but more than 95 per cent are members of the six largest categories of scheme – local government, NHS, teachers, civil service, armed forces and police.
. Most of the schemes have common features. Almost all provide DB pensions.7 Employer contributions are substantial in all schemes. All are based on nal salaries except
3 Under the Local Government and Other Ofcers’ Superannuation Act 1922 and the Teachers (Superannuation) Act
1925. The Local Government Superannuation Act 1937 and the Teachers (Superannuation) Act 1956 provided for
employers to make supplementary contributions if the standard employer and employee contributions were insufcient to
meet costs identied at valuations.
4 That change and the corresponding change in employer contributions from half to two thirds, seems to reect the
increasing regularity and value of post-award pensions indexation during the second half of the 20th century and the
point that the arrangements for providing that indexation in the unfunded schemes at rst left such costs only with the
Exchequer.
5 Department for Work and Pensions Resource Accounts 2008-09.
6 Pension schemes’ Resource Accounts, 2008-09.
7 The main exception is the civil service ‘Partnership’ dened contribution option for those who joined since 2002.
8/8/2019 Independent Public Service Pensions Commission: Interim Report
http://slidepdf.com/reader/full/independent-public-service-pensions-commission-interim-report 26/176
22
Indeendent Public Service Pensions Commission: Interim Reort - 7 October 2010
the latest (‘Nuvos’) sections of the civil service schemes, which are based on career averagesalary and the general and dental practitioner sections of the NHS schemes (which are basedon career average earnings or prots). Annex B summarises the key features of the mainpublic service pension schemes.
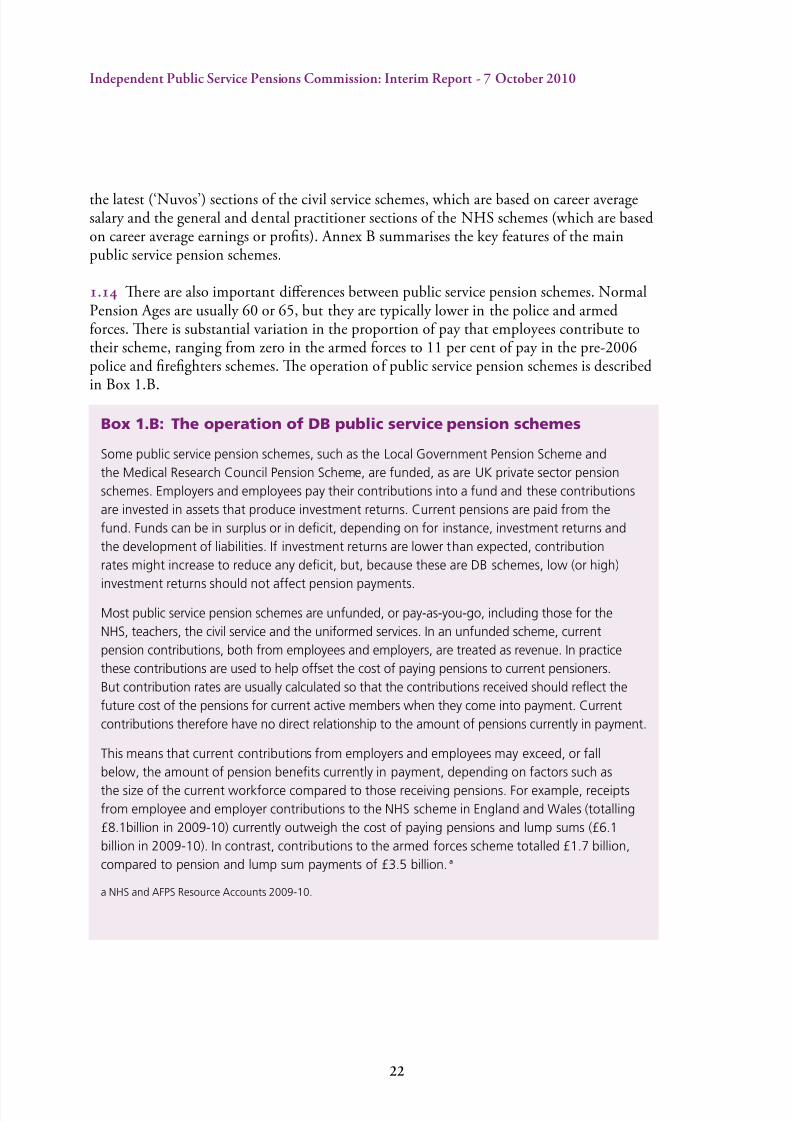
. ere are also important dierences between public service pension schemes. NormalPension Ages are usually 60 or 65, but they are typically lower in the police and armedforces. ere is substantial variation in the proportion of pay that employees contribute totheir scheme, ranging from zero in the armed forces to 11 per cent of pay in the pre-2006police and reghters schemes. e operation of public service pension schemes is described
in Box 1.B.
Box 1.B: The operation of DB public service pension schemes
Some public service pension schemes, such as the Local Government Pension Scheme and
the Medical Research Council Pension Scheme, are funded, as are UK private sector pension
schemes. Employers and employees pay their contributions into a fund and these contributions
are invested in assets that produce investment returns. Current pensions are paid from the
fund. Funds can be in surplus or in decit, depending on for instance, investment returns and
the development of liabilities. If investment returns are lower than expected, contribution
rates might increase to reduce any decit, but, because these are DB schemes, low (or high)
investment returns should not affect pension payments.
Most public service pension schemes are unfunded, or pay-as-you-go, including those for the
NHS, teachers, the civil service and the uniformed services. In an unfunded scheme, current
pension contributions, both from employees and employers, are treated as revenue. In practice
these contributions are used to help offset the cost of paying pensions to current pensioners.
But contribution rates are usually calculated so that the contributions received should reect the
future cost of the pensions for current active members when they come into payment. Current
contributions therefore have no direct relationship to the amount of pensions currently in payment.
This means that current contributions from employers and employees may exceed, or fall
below, the amount of pension benets currently in payment, depending on factors such as
the size of the current workforce compared to those receiving pensions. For example, receipts
from employee and employer contributions to the NHS scheme in England and Wales (totalling
£8.1billion in 2009-10) currently outweigh the cost of paying pensions and lump sums (£6.1
billion in 2009-10). In contrast, contributions to the armed forces scheme totalled £1.7 billion,
compared to pension and lump sum payments of £3.5 billion.a
a NHS and AFPS Resource Accounts 2009-10.

8/8/2019 Independent Public Service Pensions Commission: Interim Report
http://slidepdf.com/reader/full/independent-public-service-pensions-commission-interim-report 27/176
23
Indeendent Public Service Pensions Commission: Interim Reort - 7 October 2010
Box 1.B (continued): The operation of DB public service pensionschemes
The diagram below shows the ow of money in the four largest unfunded schemes in 2009-10.
Contributions from employers (£13.1 billion) and employees (£4.6 billion) in respect of current
employees have been used to cover much of the cash costs of pension payments (£20.8 billion).
The gap of £3.1 billion is treated as if it was met by balancing payments from the Exchequer,
ultimately from general government taxation.a The funding of pension schemes is discussed
further in Chapter 4.
Diagram: Payments and contributions in pay-as-you-go pension
schemes
HM TreasuryPublic Sector Funding Balancing figure
Public service pensioners
Public service employers Pension schemes
Public service employees
Employer contributions
Pay
£13.1bn
£4.6bn
£3.1bn
£20.8bnPaymentsEmployee
contributions
Source: Te cost of public service pensions, National Audit Oce. Figures from Resource Accounts 2009-10.
Note: The payments gure includes lump sum payments as well as pensions. For National Accounts purposes (which
are separate from the Treasury’s public spending treatment), the ONS treats employer pension contributions as part
of pay and thus outside the public sector boundary.
a In practice the amounts needed to meet the gap are provided scheme-by-scheme, through departments’ requests
to Parliament for resources.
Scheme membership
. As set out in the Commission’s terms of reference,8 the review covers public servicepension schemes, including those for civil servants, the armed forces, NHS employees,teachers, local government employees, the police, reghters, the judiciary and the researchcouncils. ere are also several smaller schemes that are not specically part of the review but
which will be required to act on its recommendations. e review does not cover pensionschemes in the wider public sector, such as those for the BBC, the Bank of England andthe Royal Mail. ese schemes are administered by trustees, rather than being authorised
by statute and the organisation concerned sets the scheme’s rules. Nor does the review cover the pension fund for Members of Parliament, although the Government has stated
8 See Annex A.
8/8/2019 Independent Public Service Pensions Commission: Interim Report
http://slidepdf.com/reader/full/independent-public-service-pensions-commission-interim-report 28/176
24
Indeendent Public Service Pensions Commission: Interim Reort - 7 October 2010
that it believes that decisions about the parliamentary scheme should be informed by theCommission’s nal recommendations.9
.6 e review looks at public service pension schemes across the UK. e devolvedadministrations have slightly dierent arrangements for administering public service pensions.For instance, Scottish Ministers have the power to make secondary legislation aecting how the ve Scottish public service pension schemes operate (including, for example, the benetsthe schemes provide and contributions made by scheme members). In practice the schemeshave tended to mirror each other closely and they face similar structural issues.
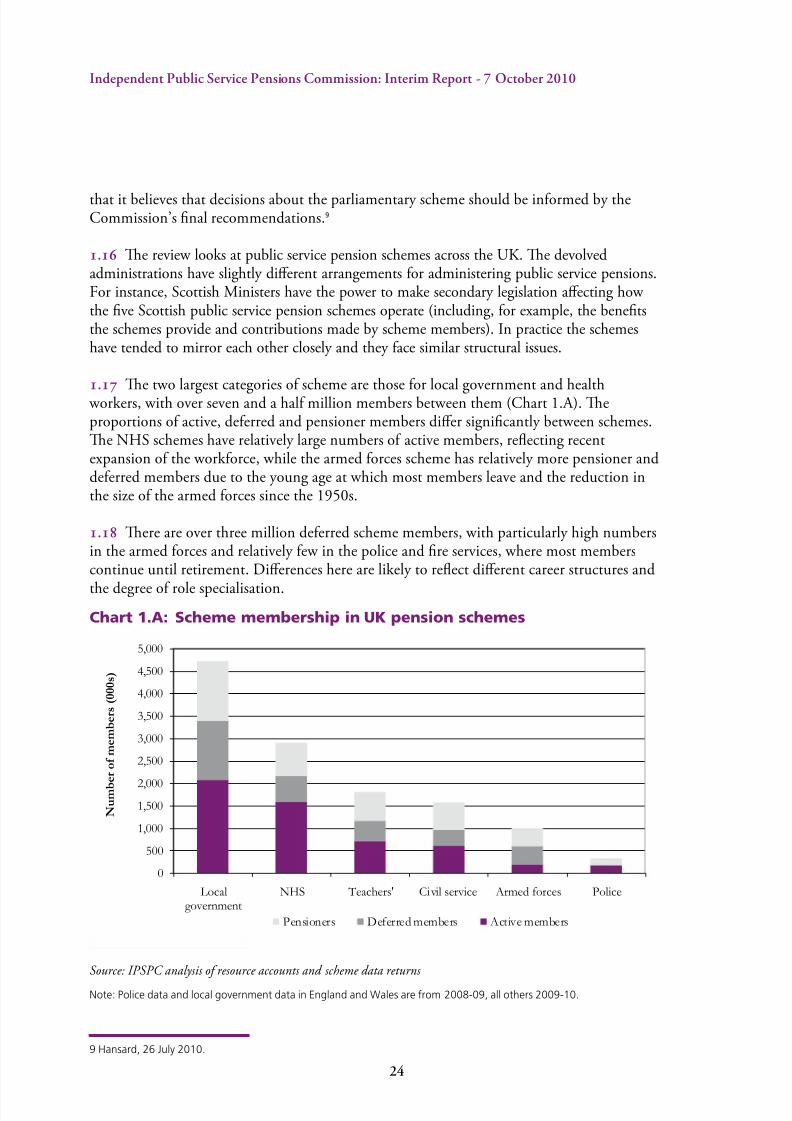
. e two largest categories of scheme are those for local government and health workers, with over seven and a half million members between them (Chart 1.A). eproportions of active, deferred and pensioner members dier signicantly between schemes.e NHS schemes have relatively large numbers of active members, reecting recentexpansion of the workforce, while the armed forces scheme has relatively more pensioner anddeferred members due to the young age at which most members leave and the reduction inthe size of the armed forces since the 1950s.
.8 ere are over three million deferred scheme members, with particularly high numbersin the armed forces and relatively few in the police and re services, where most memberscontinue until retirement. Dierences here are likely to reect dierent career structures and
the degree of role specialisation.
Chart 1.A: Scheme membership in UK pension schemes
Source: IPSPC analysis of resource accounts and scheme data returns
Note: Police data and local government data in England and Wales are from 2008-09, all others 2009-10.
9 Hansard, 26 July 2010.
0
500
1,000
1,500
2,000
2,500
3,000
3,500
4,000
4,500
5,000
Localgovernment
NHS Teachers' Civil service Armed forces Police
N u m b
e r o f m e m b e r s ( 0 0 0 s )
Pensioners Deferred members Active members
8/8/2019 Independent Public Service Pensions Commission: Interim Report
http://slidepdf.com/reader/full/independent-public-service-pensions-commission-interim-report 29/176
25
Indeendent Public Service Pensions Commission: Interim Reort - 7 October 2010
Age
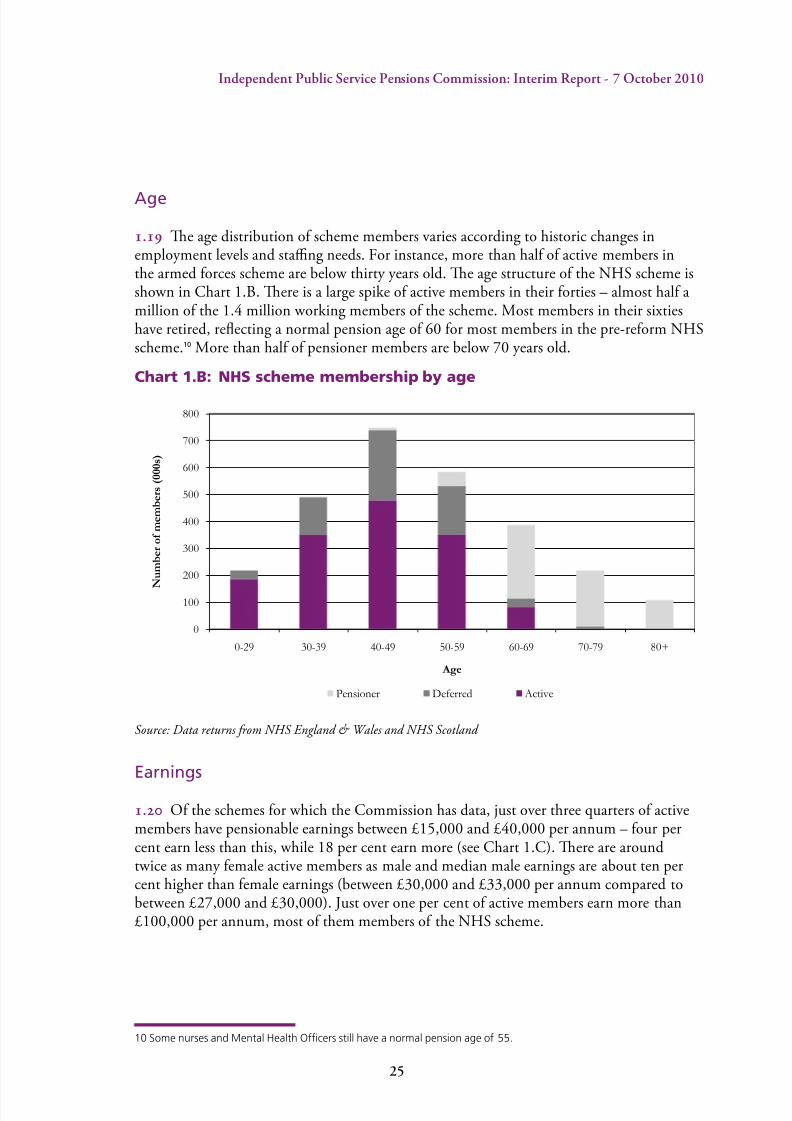
.9 e age distribution of scheme members varies according to historic changes inemployment levels and stang needs. For instance, more than half of active members inthe armed forces scheme are below thirty years old. e age structure of the NHS scheme isshown in Chart 1.B. ere is a large spike of active members in their forties – almost half amillion of the 1.4 million working members of the scheme. Most members in their sixtieshave retired, reecting a normal pension age of 60 for most members in the pre-reform NHSscheme.10 More than half of pensioner members are below 70 years old.
Chart 1.B: NHS scheme membership by age
Source: Data returns from NHS England & Wales and NHS Scotland
Earnings
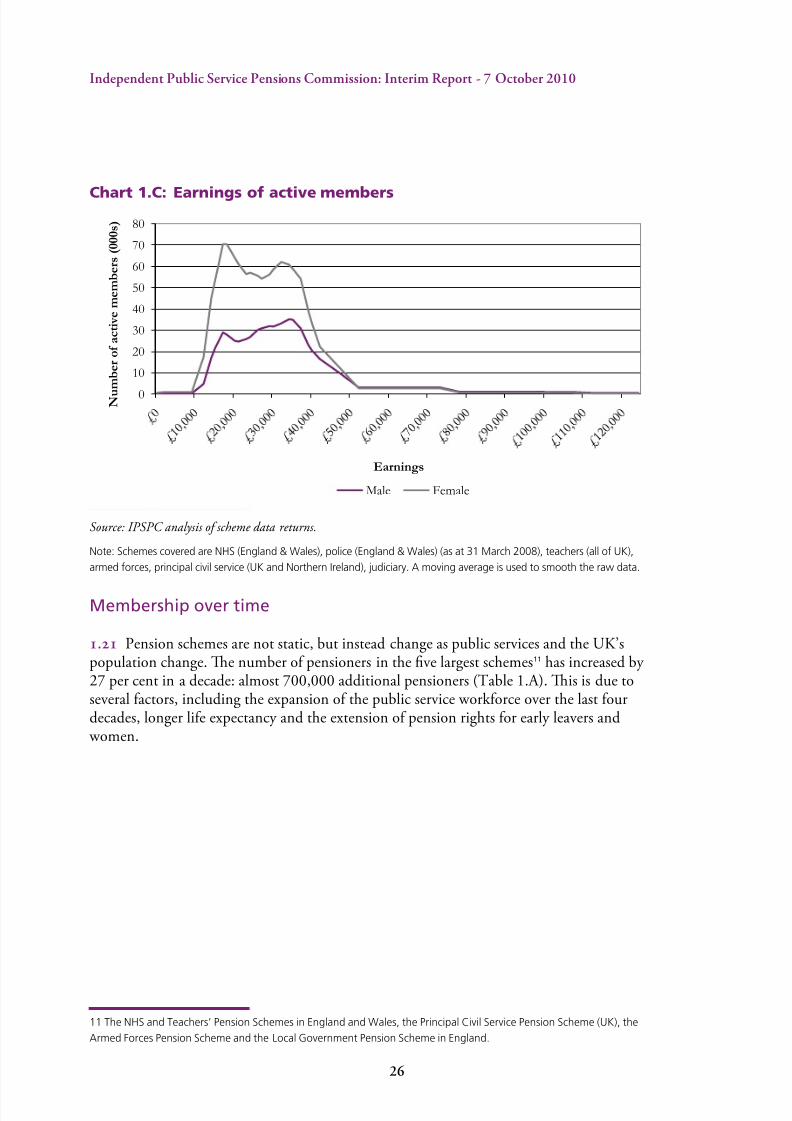
. Of the schemes for which the Commission has data, just over three quarters of activemembers have pensionable earnings between £15,000 and £40,000 per annum – four percent earn less than this, while 18 per cent earn more (see Chart 1.C). ere are aroundtwice as many female active members as male and median male earnings are about ten percent higher than female earnings (between £30,000 and £33,000 per annum compared tobetween £27,000 and £30,000). Just over one per cent of active members earn more than£100,000 per annum, most of them members of the NHS scheme.
10 Some nurses and Mental Health Ofcers still have a normal pension age of 55.
0
100
200
300
400
500
600
700
800
0-29 30-39 40-49 50-59 60-69 70-79 80+
N u m b e r o f m e m b e r s ( 0 0 0 s )
Age
Pensioner Deferred Active
8/8/2019 Independent Public Service Pensions Commission: Interim Report
http://slidepdf.com/reader/full/independent-public-service-pensions-commission-interim-report 30/176
2
Indeendent Public Service Pensions Commission: Interim Reort - 7 October 2010
Chart 1.C: Earnings of active members
Source: IPSPC analysis of scheme data returns.
Note: Schemes covered are NHS (England & Wales), police (England & Wales) (as at 31 March 2008), teachers (all of UK),
armed forces, principal civil service (UK and Northern Ireland), judiciary. A moving average is used to smooth the raw data.
Membership over time
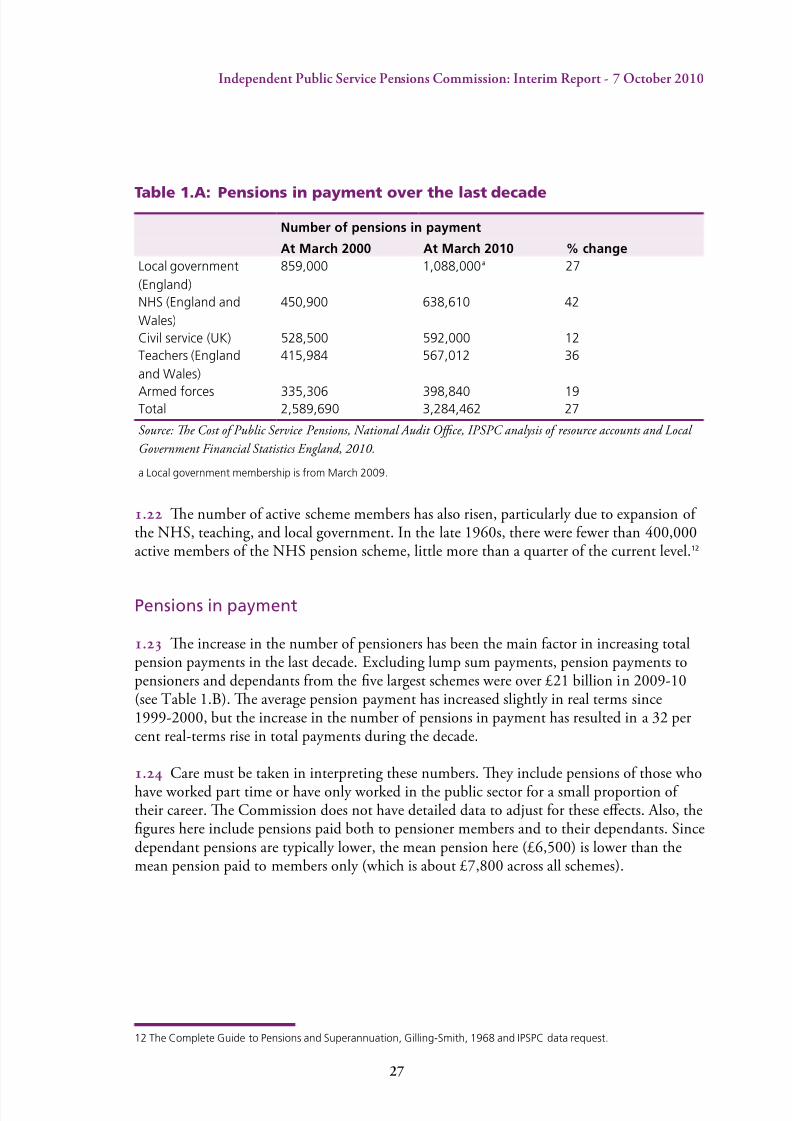
. Pension schemes are not static, but instead change as public services and the UK’spopulation change. e number of pensioners in the ve largest schemes11 has increased by 27 per cent in a decade: almost 700,000 additional pensioners (Table 1.A). is is due toseveral factors, including the expansion of the public service workforce over the last fourdecades, longer life expectancy and the extension of pension rights for early leavers and
women.
11 The NHS and Teachers’ Pension Schemes in England and Wales, the Principal Civil Service Pension Scheme (UK), the
Armed Forces Pension Scheme and the Local Government Pension Scheme in England.
0
10
20
30
40
50
60
70
80
N u
m b e r o f a c t i v e m e m b e r s ( 0 0 0 s )
Earnings
Male Female
8/8/2019 Independent Public Service Pensions Commission: Interim Report
http://slidepdf.com/reader/full/independent-public-service-pensions-commission-interim-report 31/176
27
Indeendent Public Service Pensions Commission: Interim Reort - 7 October 2010
Table 1.A: Pensions in payment over the last decade
Number of pensions in payment
At March 2000 At March 2010 % change
Local government
(England)
859,000 1,088,000a 27
NHS (England and
Wales)
450,900 638,610 42
Civil service (UK) 528,500 592,000 12
Teachers (England
and Wales)
415,984 567,012 36
Armed forces 335,306 398,840 19Total 2,589,690 3,284,462 27
Source: Te Cost of Public Service Pensions, National Audit Oce, IPSPC analysis of resource accounts and Local
Government Financial Statistics England, 2010.
a Local government membership is from March 2009.
. e number of active scheme members has also risen, particularly due to expansion of the NHS, teaching, and local government. In the late 1960s, there were fewer than 400,000active members of the NHS pension scheme, little more than a quarter of the current level.12
Pensions in payment
. e increase in the number of pensioners has been the main factor in increasing totalpension payments in the last decade. Excluding lump sum payments, pension payments topensioners and dependants from the ve largest schemes were over £21 billion in 2009-10(see Table 1.B). e average pension payment has increased slightly in real terms since1999-2000, but the increase in the number of pensions in payment has resulted in a 32 percent real-terms rise in total payments during the decade.
. Care must be taken in interpreting these numbers. ey include pensions of those whohave worked part time or have only worked in the public sector for a small proportion of their career. e Commission does not have detailed data to adjust for these eects. Also, thegures here include pensions paid both to pensioner members and to their dependants. Sincedependant pensions are typically lower, the mean pension here (£6,500) is lower than themean pension paid to members only (which is about £7,800 across all schemes).
12 The Complete Guide to Pensions and Superannuation, Gilling-Smith, 1968 and IPSPC data request.

8/8/2019 Independent Public Service Pensions Commission: Interim Report
http://slidepdf.com/reader/full/independent-public-service-pensions-commission-interim-report 32/176
2
Indeendent Public Service Pensions Commission: Interim Reort - 7 October 2010
Table 1.B: The evolution of pension payments from the ve largestschemes
Total Pensions Paid Average (Mean) Pension
1999-2000(adjustedto 2009-10 prices)(£bn)
2009-10(£bn)
% change 1999-2000(adjustedto 2009-10prices) (£)
2009-10 (£) % change
Local
government
(England)
3.53 4.41 25 4,115 4,052 -2
NHS
(England
and Wales)
3.13 4.62 47 6,951 7,234 4
Civil service
(UK)
2.97 3.67 23 5,626 6,199 10
Teachers
(England
and Wales)
4.07 5.56 37 9,781 9,806 0
Armed
forces
2.40 3.08 28 7,160 7,722 8
Total 16.11 21.34 32 6,222 6,497 4Source: Te Cost of Public Service Pensions, National Audit Oce, IPSPC analysis of resource accounts, Local
Government Financial Statistics England, 2010.
Note: Average pensions are calculated by dividing total pensions paid in the year by the number of pensions in payment
at the end of the year. This typically overstates average pensions by about one per cent. Local government gures are for
2008-09, indexed by RPI ination to 2009-10.
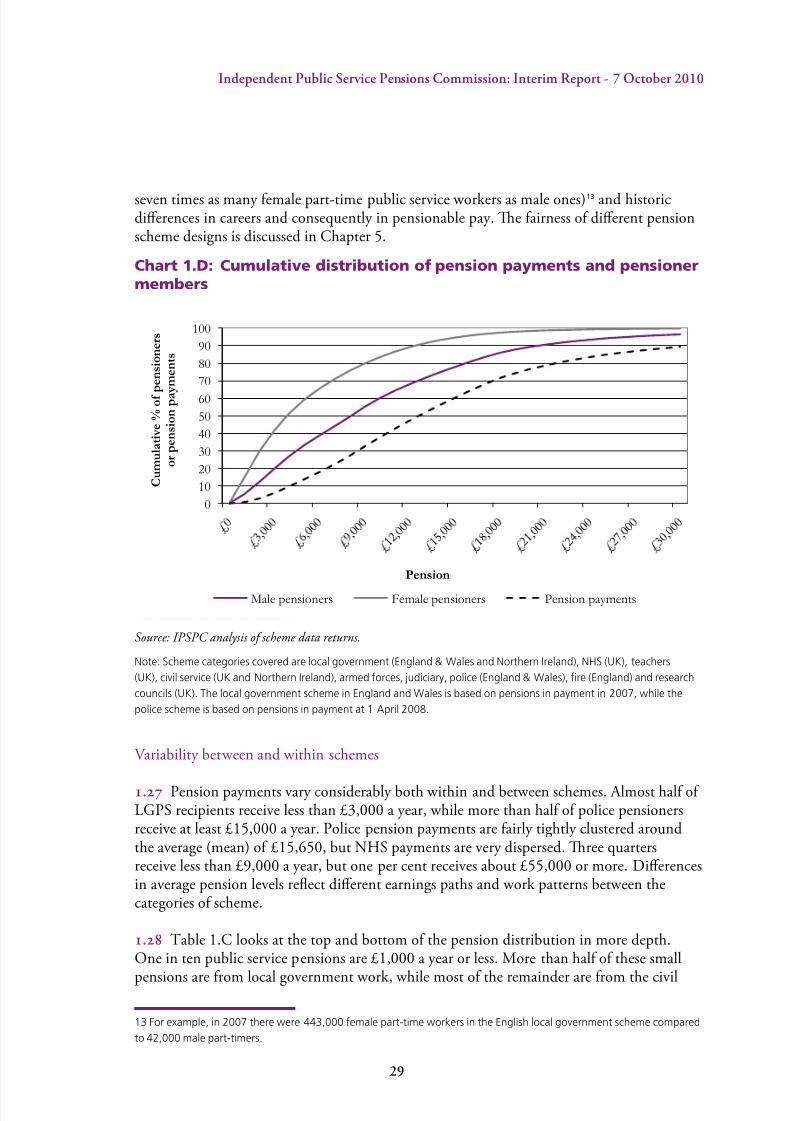
. Chart 1.D shows the percentage of pensions paid to pensioner members that are below a particular level, as well as the proportion of total payments to pensioners that are at thatlevel or lower. For example this chart shows that that about 65 per cent of female pensionersand 40 per cent of male pensioners, receive pensions below £6,000 per annum. ough theseconstitute more than half of pensioners, the pensions make up about 16 per cent of totalpayments. About 1 in 10 male pensioners and 1 in 50 female pensioners, receive pensions of more than £20,000 per annum. Pensions of this size or larger constitute about 25 per cent of the total amount of pension payments paid out, though they are received by only about veper cent of pensioners.
.6 Male public service pensioners typically receive more than female pensioners – themedian male pensioner receives just over £8,000 per annum, while the median femalepensioner receives just under £4,000 per annum. is gap can be explained in part by
a combination of more fragmented female careers (particularly connected to caringresponsibilities), dierential rates of part-time employment (there are currently more than
8/8/2019 Independent Public Service Pensions Commission: Interim Report
http://slidepdf.com/reader/full/independent-public-service-pensions-commission-interim-report 33/176
2
Indeendent Public Service Pensions Commission: Interim Reort - 7 October 2010
seven times as many female part-time public service workers as male ones)13 and historicdierences in careers and consequently in pensionable pay. e fairness of dierent pensionscheme designs is discussed in Chapter 5.
Chart 1.D: Cumulative distribution of pension payments and pensionermembers
Source: IPSPC analysis of scheme data returns.
Note: Scheme categories covered are local government (England & Wales and Northern Ireland), NHS (UK), teachers
(UK), civil service (UK and Northern Ireland), armed forces, judiciary, police (England & Wales), re (England) and research
councils (UK). The local government scheme in England and Wales is based on pensions in payment in 2007, while the
police scheme is based on pensions in payment at 1 April 2008.
Variability between and within schemes
. Pension payments vary considerably both within and between schemes. Almost half of LGPS recipients receive less than £3,000 a year, while more than half of police pensionersreceive at least £15,000 a year. Police pension payments are fairly tightly clustered aroundthe average (mean) of £15,650, but NHS payments are very dispersed. ree quartersreceive less than £9,000 a year, but one per cent receives about £55,000 or more. Dierencesin average pension levels reect dierent earnings paths and work patterns between thecategories of scheme.
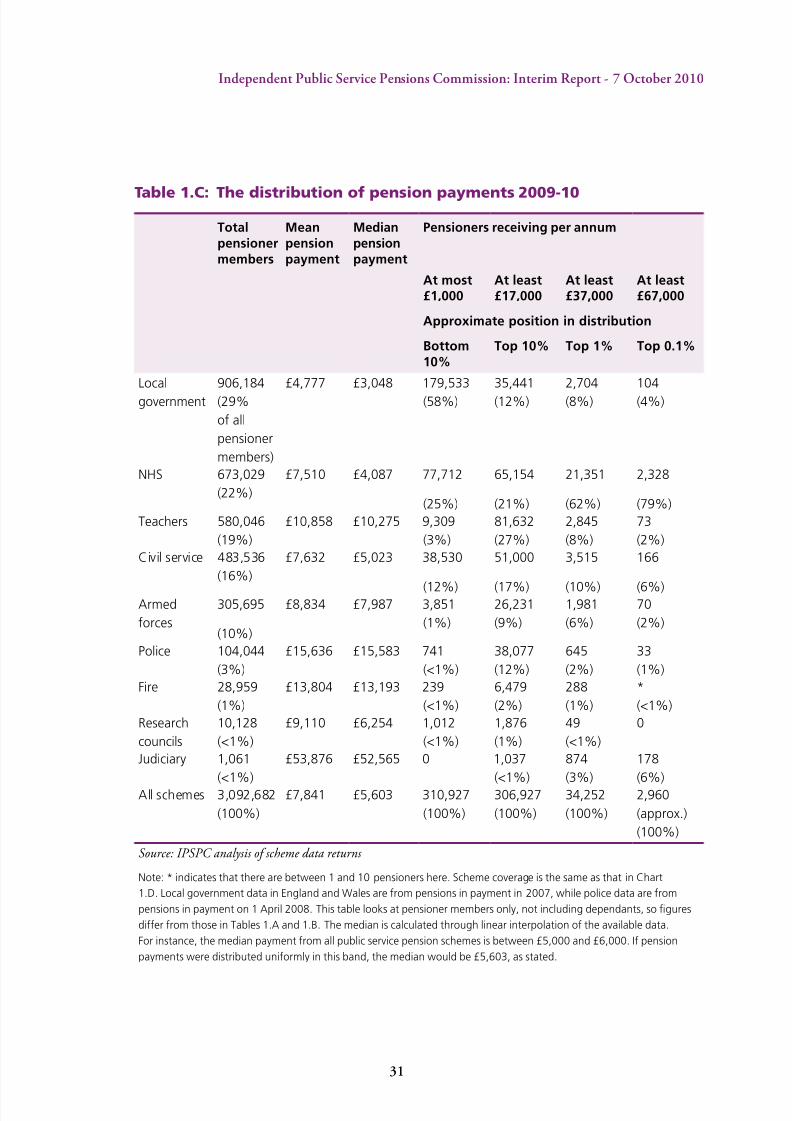
.8 Table 1.C looks at the top and bottom of the pension distribution in more depth.One in ten public service pensions are £1,000 a year or less. More than half of these small
pensions are from local government work, while most of the remainder are from the civil
13 For example, in 2007 there were 443,000 female part-time workers in the English local government scheme compared
to 42,000 male part-timers.
0
10
20
30
40
50
60
70
80
90
100
C u m u l a t i v e %
o f p e n s i o n e r s
o r p e n s i o n p a y m e n t s
Pension
Male pensioners Female pensioners Pension payments

8/8/2019 Independent Public Service Pensions Commission: Interim Report
http://slidepdf.com/reader/full/independent-public-service-pensions-commission-interim-report 34/176
30
Indeendent Public Service Pensions Commission: Interim Reort - 7 October 2010
service and NHS schemes. Pensions at this level will typically be the result of both shortservice and relatively low pay, perhaps because of part-time work.
.9 e top ten per cent of pensioners receive at least £17,000 per annum. ese are fairly evenly distributed between schemes, though the police and re services are over-represented(more than a third of police pensioners are in this top ten per cent) and local government isunder-represented (four per cent of local government pensions are at this level).
. e top one per cent, receiving at least £37,000 per annum, is dominated by the NHS, which represents almost two thirds of the pensions paid at this level or above – mostly long-
serving doctors. e NHS continues to be strongly represented in the top 0.1 per cent and top0.01 per cent of the distribution. About one in six judicial pensioners receives over £67,000 perannum, placing them in the top 0.1 per cent of the distribution of public service pensions.
8/8/2019 Independent Public Service Pensions Commission: Interim Report
http://slidepdf.com/reader/full/independent-public-service-pensions-commission-interim-report 35/176
31
Indeendent Public Service Pensions Commission: Interim Reort - 7 October 2010
Table 1.C: The distribution of pension payments 2009-10
Totalpensionermembers
Meanpensionpayment
Medianpensionpayment
Pensioners receiving per annum
At most£1,000
At least£17,000
At least£37,000
At least£67,000
Approximate position in distribution
Bottom10%
Top 10% Top 1% Top 0.1%
Local
government
906,184
(29%
of all
pensioner
members)
£4,777 £3,048 179,533
(58%)
35,441
(12%)
2,704
(8%)
104
(4%)
NHS 673,029
(22%)
£7,510 £4,087 77,712
(25%)
65,154
(21%)
21,351
(62%)
2,328
(79%)
Teachers 580,046
(19%)
£10,858 £10,275 9,309
(3%)
81,632
(27%)
2,845
(8%)
73
(2%)
Civil service 483,536
(16%)
£7,632 £5,023 38,530
(12%)
51,000
(17%)
3,515
(10%)
166
(6%)Armed
forces
305,695
(10%)
£8,834 £7,987 3,851
(1%)
26,231
(9%)
1,981
(6%)
70
(2%)
Police 104,044
(3%)
£15,636 £15,583 741
(<1%)
38,077
(12%)
645
(2%)
33
(1%)
Fire 28,959
(1%)
£13,804 £13,193 239
(<1%)
6,479
(2%)
288
(1%)
*
(<1%)
Research
councils
10,128
(<1%)
£9,110 £6,254 1,012
(<1%)
1,876
(1%)
49
(<1%)
0
Judiciary 1,061
(<1%)
£53,876 £52,565 0 1,037
(<1%)
874
(3%)
178
(6%)
All schemes 3,092,682
(100%)
£7,841 £5,603 310,927
(100%)
306,927
(100%)
34,252
(100%)
2,960
(approx.)
(100%)
Source: IPSPC analysis of scheme data returns
Note: * indicates that there are between 1 and 10 pensioners here. Scheme coverage is the same as that in Chart
1.D. Local government data in England and Wales are from pensions in payment in 2007, while police data are from
pensions in payment on 1 April 2008. This table looks at pensioner members only, not including dependants, so gures
differ from those in Tables 1.A and 1.B. The median is calculated through linear interpolation of the available data.
For instance, the median payment from all public service pension schemes is between £5,000 and £6,000. If pension
payments were distributed uniformly in this band, the median would be £5,603, as stated.
8/8/2019 Independent Public Service Pensions Commission: Interim Report
http://slidepdf.com/reader/full/independent-public-service-pensions-commission-interim-report 36/176
32
Indeendent Public Service Pensions Commission: Interim Reort - 7 October 2010
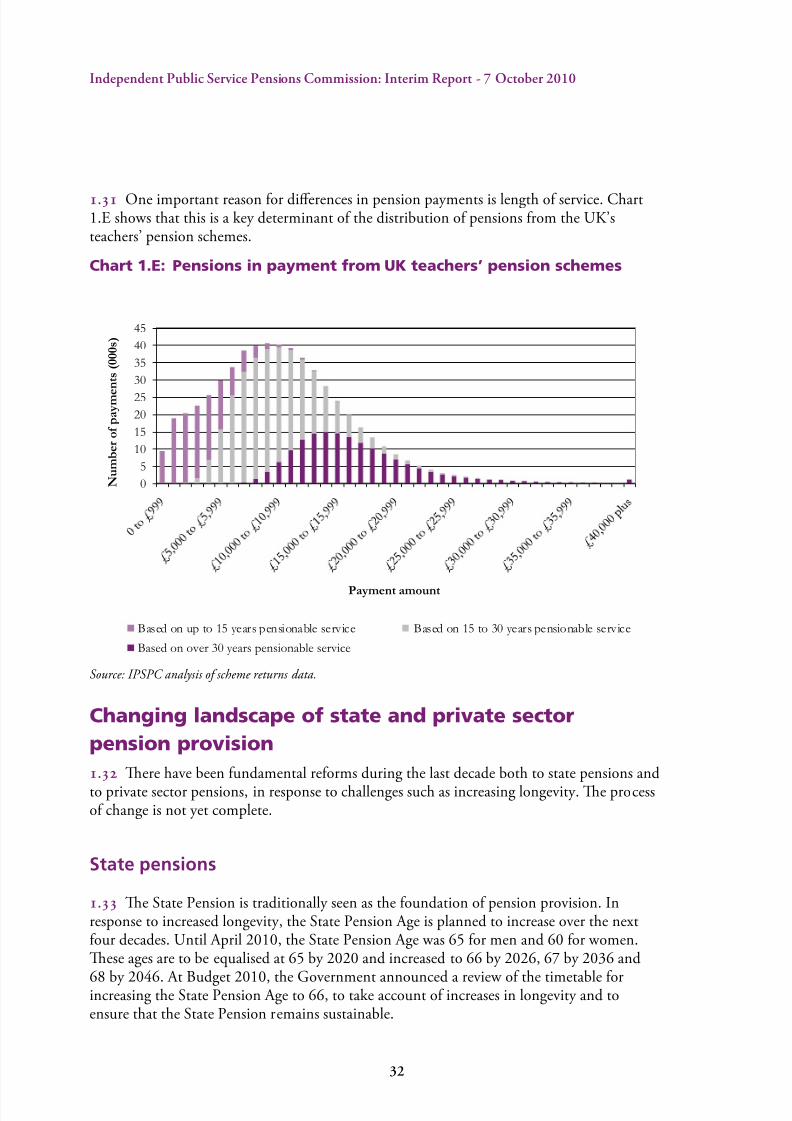
. One important reason for dierences in pension payments is length of service. Chart1.E shows that this is a key determinant of the distribution of pensions from the UK’steachers’ pension schemes.
Chart 1.E: Pensions in payment from UK teachers’ pension schemes
Source: IPSPC analysis of scheme returns data.
Changing landscape of state and private sector
pension provision
. ere have been fundamental reforms during the last decade both to state pensions andto private sector pensions, in response to challenges such as increasing longevity. e processof change is not yet complete.
State pensions
. e State Pension is traditionally seen as the foundation of pension provision. Inresponse to increased longevity, the State Pension Age is planned to increase over the nextfour decades. Until April 2010, the State Pension Age was 65 for men and 60 for women.ese ages are to be equalised at 65 by 2020 and increased to 66 by 2026, 67 by 2036 and
68 by 2046. At Budget 2010, the Government announced a review of the timetable forincreasing the State Pension Age to 66, to take account of increases in longevity and toensure that the State Pension remains sustainable.
0
5
10
15
20
25
30
35
40
45
N u m b e r o f p a y m e
n t s ( 0 0 0 s )
Payment amount
Based on up to 15 years pensionable service Based on 15 to 30 years pensionable service
Based on over 30 years pensionable service
8/8/2019 Independent Public Service Pensions Commission: Interim Report
http://slidepdf.com/reader/full/independent-public-service-pensions-commission-interim-report 37/176
33
Indeendent Public Service Pensions Commission: Interim Reort - 7 October 2010
. e basic State Pension and State Second Pension were reformed by the previousGovernment to increase the numbers eligible. e State Second Pension is set to become a at-rate top-up to the basic State Pension by around 2030. ese changes will signicantly increasethe numbers of people who receive state pensions and the amounts paid to lower earners.
. e uprating of state pensions to take account of ination was changed at Budget 2010in June. In future, the basic State Pension is to be uprated every April by whichever is thehighest of: the growth rate of average earnings; the annual increase in the Consumer PriceIndex (CPI); or 2.5 per cent. As an interim measure, the uprating in April 2011 is to be atleast the equivalent of the annual change in the Retail Price Index (RPI). However, the State
Second Pension will in future be uprated by CPI, not RPI.
14
Pensions outside the public sector
.6 Currently there are about 29 million people working in the UK, with 25 million inemployment and the remaining 4 million in self-employed jobs.15 Of the 19 million privatesector employees, about 2.6 million were active members of non-public service DB schemesin 2009. A further million were active members of occupational Dened Contribution (DC)schemes,16 with another 3 million covered by employer-sponsored group personal pensionsor stakeholder pensions, known as ‘contract-based’ DC schemes.17 is implies a large gap in
coverage, which has increased over time – Chart 1.F shows that close to two thirds of privatesector employees lack current employer-sponsored pension provision.
14 Current legislation requires public service pensions to be uprated at the same annual rate as the State Second Pension.
15 Labour Market Statistics, ONS, September 2010.
16 Occupational Pension Scheme Survey 2008, Table 2.6.
17 HMRC, Personal and Stakeholder Pensions 2008-09, Tables 7.4 and 7.5.
8/8/2019 Independent Public Service Pensions Commission: Interim Report
http://slidepdf.com/reader/full/independent-public-service-pensions-commission-interim-report 38/176
34
Indeendent Public Service Pensions Commission: Interim Reort - 7 October 2010
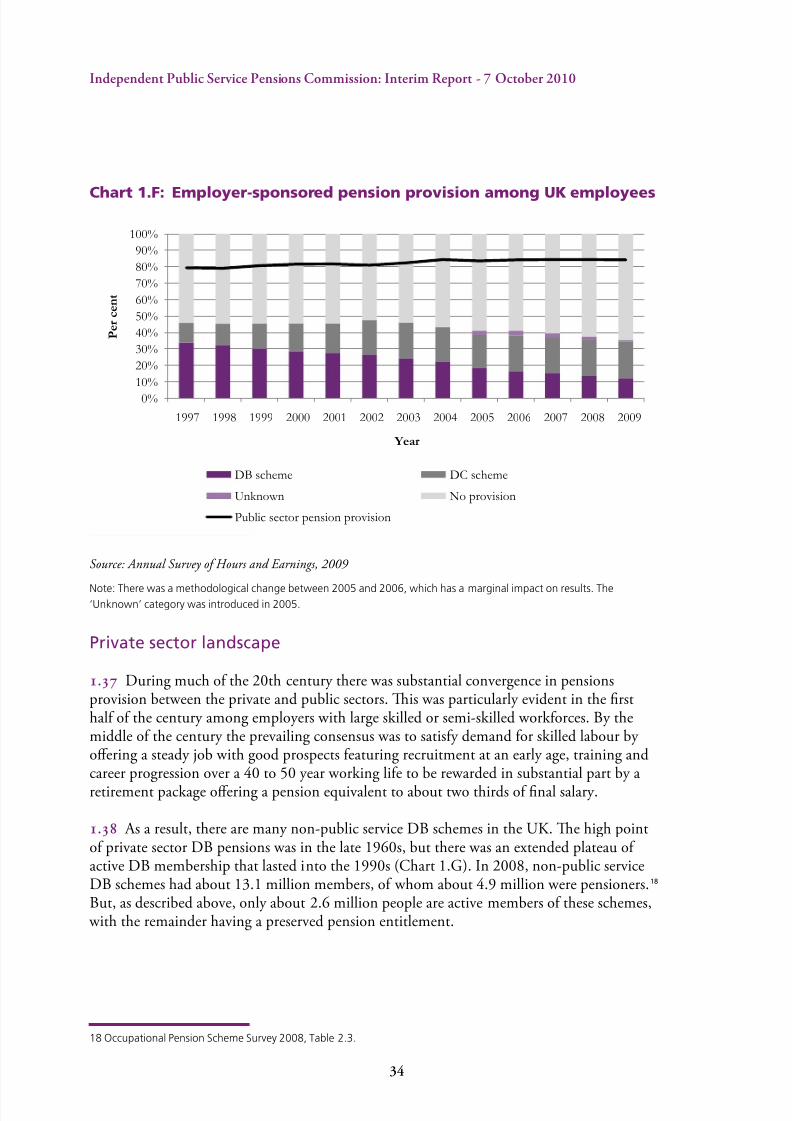
Chart 1.F: Employer-sponsored pension provision among UK employees
Source: Annual Survey of Hours and Earnings, 2009
Note: There was a methodological change between 2005 and 2006, which has a marginal impact on results. The‘Unknown’ category was introduced in 2005.
Private sector landscape
. During much of the 20th century there was substantial convergence in pensionsprovision between the private and public sectors. is was particularly evident in the rsthalf of the century among employers with large skilled or semi-skilled workforces. By themiddle of the century the prevailing consensus was to satisfy demand for skilled labour by oering a steady job with good prospects featuring recruitment at an early age, training andcareer progression over a 40 to 50 year working life to be rewarded in substantial part by aretirement package oering a pension equivalent to about two thirds of nal salary.
.8 As a result, there are many non-public service DB schemes in the UK. e high pointof private sector DB pensions was in the late 1960s, but there was an extended plateau of active DB membership that lasted into the 1990s (Chart 1.G). In 2008, non-public serviceDB schemes had about 13.1 million members, of whom about 4.9 million were pensioners.18 But, as described above, only about 2.6 million people are active members of these schemes,
with the remainder having a preserved pension entitlement.
18 Occupational Pension Scheme Survey 2008, Table 2.3.
0%
10%
20%
30%
40%
50%
60%
70%
80%
90%
100%
1997 1998 1999 2000 2001 2002 2003 2004 2005 2006 2007 2008 2009
P e r c e n t
Year
DB scheme DC scheme
Unknown No provision
Public sector pension provision
8/8/2019 Independent Public Service Pensions Commission: Interim Report
http://slidepdf.com/reader/full/independent-public-service-pensions-commission-interim-report 39/176
35
Indeendent Public Service Pensions Commission: Interim Reort - 7 October 2010
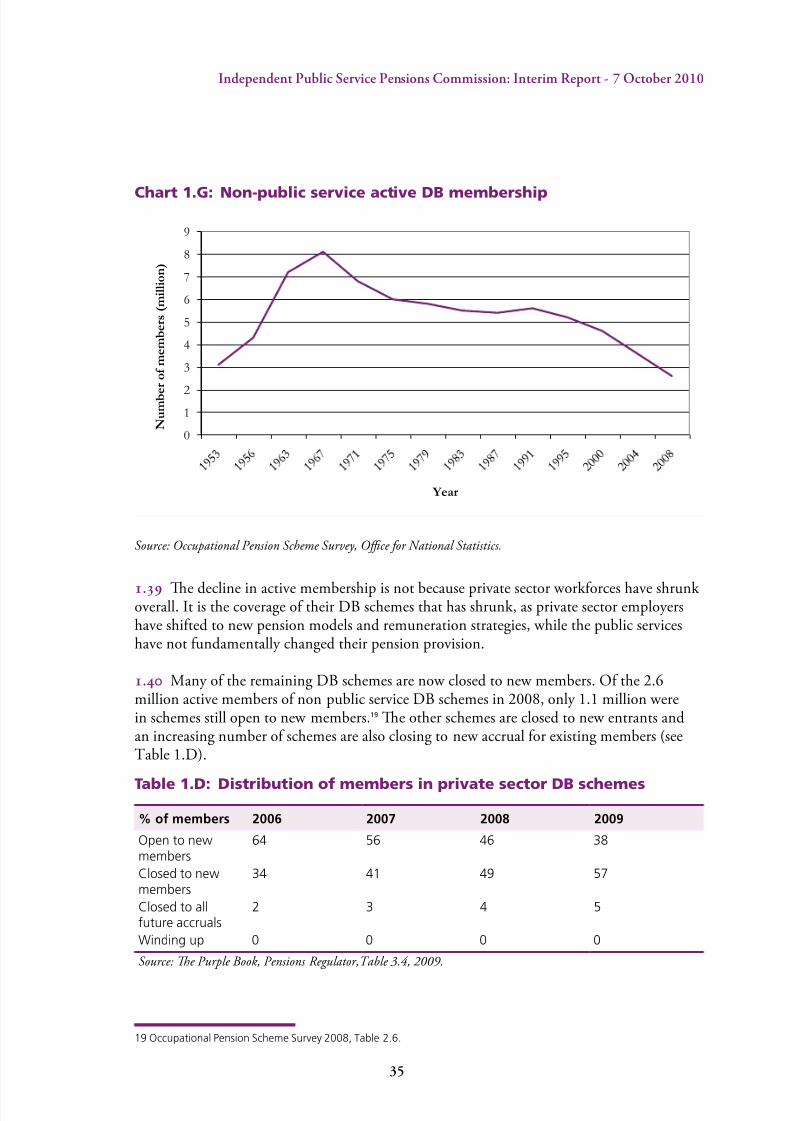
Chart 1.G: Non-public service active DB membership
Source: Occupational Pension Scheme Survey, Oce for National Statistics.
.9 e decline in active membership is not because private sector workforces have shrunk overall. It is the coverage of their DB schemes that has shrunk, as private sector employershave shifted to new pension models and remuneration strategies, while the public serviceshave not fundamentally changed their pension provision.
. Many of the remaining DB schemes are now closed to new members. Of the 2.6million active members of non public service DB schemes in 2008, only 1.1 million werein schemes still open to new members.19 e other schemes are closed to new entrants andan increasing number of schemes are also closing to new accrual for existing members (seeTable 1.D).
Table 1.D: Distribution of members in private sector DB schemes
% of members 2006 2007 2008 2009
Open to newmembers
64 56 46 38
Closed to newmembers
34 41 49 57
Closed to allfuture accruals
2 3 4 5
Winding up 0 0 0 0
Source: Te Purple Book, Pensions Regulator,able 3.4, 2009.
19 Occupational Pension Scheme Survey 2008, Table 2.6.
0
1
2
3
4
5
6
7
8
9
N u m b e
r o f m e m b e r s ( m i l l i o n )
Year

8/8/2019 Independent Public Service Pensions Commission: Interim Report
http://slidepdf.com/reader/full/independent-public-service-pensions-commission-interim-report 40/176
3
Indeendent Public Service Pensions Commission: Interim Reort - 7 October 2010
. e contrast between private and public sectors is even more marked than Table 1.Dsuggests. e gures for non-public service DB schemes include schemes in the wider publicsector, such as those for the BBC, Bank of England, Royal Mail and London Underground.
Also, the truly private sector DB schemes include schemes carried over when bodies wereprivatised and new DB schemes provided to workforces transferred to the private sector asa condition of the transfer. Finally, there are some private sector schemes that operate inenvironments indistinguishable in many ways from the public services and subject to similarinuences, such as the Universities Superannuation Scheme.
. Private sector DC arrangements have developed dierently, growing steadily as a
proportion of total provision. But DC schemes in the public sector are rare, apart from somevoluntary pension top up arrangements and the ‘Partnership’ scheme oered since 2002 tonew or re-employed civil servants.
The move to DC schemes in the private sector
. ere are several reasons for the migration of many private sector pension schemesfrom DB to DC. ey vary in importance between companies and over time, but twodierent broad risk categories have been central in many cases.
Investment risks
. In DC systems, the employee carries the investment risk. If investments do notperform well, the member will receive a lower pension. In funded DB schemes thesponsoring employer might be required to make extra contributions to compensate forunexpectedly low investment returns. e corollary of course is that the employer canalso benet from unanticipated funding surpluses in DB schemes, for instance by takingcontribution holidays. But many companies, especially smaller ones, have felt unable to bearthe level of risk involved.
. e impact of investment risks has been magnied by the move to FRS17 and IAS19accounting standards over the last decade. e requirement to value pension scheme assetsand liabilities at market prices, combined with market volatility, means that the balancesheets of companies with DB pension schemes can vary signicantly from year to year,
without the position of the company’s core business having changed.
Demographic risks
.6 In DC schemes, the costs of rising longevity are born by employees when they come
to buy their annuities; if longevity increases, annuities will become more expensive. In DBschemes, this risk ultimately lies with employers. Past underestimates of longevity havetended to increase employers’ costs of providing DB pensions beyond anticipated levels, justas public service pension costs have increased for similar reasons (see Chapter 4).
8/8/2019 Independent Public Service Pensions Commission: Interim Report
http://slidepdf.com/reader/full/independent-public-service-pensions-commission-interim-report 41/176
37
Indeendent Public Service Pensions Commission: Interim Reort - 7 October 2010
Future prospects
. ere has been a substantial migration away from DB schemes and in particular nalsalary schemes, in the private sector in the last two decades. But this should not be seen asthe last word. Private sector pensions, like those in the public services, are still evolving. Itis likely that most schemes will be DC based, with little or no risk sharing. But several largecompanies are committed to keeping their DB schemes open, often on a career-average basis.Others oer elements of risk sharing for employees through other mechanisms, such as cashbalance schemes.
Automatic enrolment
.8 As shown in Chart 1.F, almost two thirds of private sector employees lack employer-sponsored pension provision. Concerns about the level of saving for retirement led theprevious Government to establish a Pensions Commission chaired by Lord Turner. Itsreports were published in October 2004 and November 2005.
.9 In response to these reports, the Government published a White Paper in 2006, which proposed that employees should be automatically enrolled into pension schemes with minimum levels of employer and employee contributions. ese new schemes are
likely to be almost exclusively DC, with the National Employment Savings Trust (NEST)expected to provide low-cost DC pensions targeted at smaller employers and the low paid.Implementation of automatic enrolment is planned to start from 2012, although thetimetable and other details are currently being reviewed.
. e Department for Work and Pensions estimates that between ve and nine millionemployees will begin to participate in employer-sponsored pension schemes as a result of thereforms. Some of the extra enrolment is expected to arise because some people who currently choose not to join an existing pension scheme will opt in. But between 2 and 5 million peopleare expected to begin to participate due to the provision of new pension opportunities.20
20 www.dwp.gov.uk/docs/factsheet-impact-reforms-sept09.pdf

8/8/2019 Independent Public Service Pensions Commission: Interim Report
http://slidepdf.com/reader/full/independent-public-service-pensions-commission-interim-report 42/176
3
Indeendent Public Service Pensions Commission: Interim Reort - 7 October 2010

8/8/2019 Independent Public Service Pensions Commission: Interim Report
http://slidepdf.com/reader/full/independent-public-service-pensions-commission-interim-report 43/176
3
Indeendent Public Service Pensions Commission: Interim Reort - 7 October 2010
Box 2.A: Summary
• The previous Government recognised that public service pensions were in need of reform
and began a welcome and necessary modernisation programme when it took ofce in
1997. In particular, reformed schemes with higher pension ages were introduced for
new entrants in most schemes and the introduction of cap and share pension valuations
acknowledged that risk needed to be shared more equitably between taxpayers, employers
and employees. The present Government has changed future index linking of pensions
increases from RPI to CPI.
• However, these reforms have not fully addressed the underlying issues of sustainability and
fairness. Although some existing members of some schemes have had increases in their
pension ages, to reect increasing longevity, most have not. Cap and share cannot take
account of the increases in cost of pensions over recent decades because people have been
living longer. Also, untested, complex cap and share arrangements cannot of themselves,
address the underlying issue of structural reforms, nor signicantly reduce current costs
to taxpayers.
Recent reforms
. e previous Government recognised the need for major reform and began amodernisation programme for public service pensions when it took oce in 1997. erst wave of reforms was generally focused on modernising outdated benet designs. emain changes for the largest seven categories of scheme (NHS, teachers, civil service, localgovernment, armed forces, police and reghters) are summarised in Table 2.A.
. e uniformed services were among the rst to have their pensions reformed. Changes were mainly for new entrants1 and included a limited increase in pension ages; a reductionin accrual rates; improved management of ill health retirement and the introduction of unmarried partners’ pensions. For the police and re ghters schemes, these changes wereimplemented together with a reduction in member contributions (for new entrants).
. It has not yet been resolved how to limit employer costs for the uniformed services andseveral other public service pension schemes by methods such as cap and share (described
1 Existing members of the armed forces police and reghters schemes were given an option to transfer to the new terms
and a limited number did. For example, to gain entitlement to unmarried partners pensions.
2 Recent reforms to publicservice pensions
8/8/2019 Independent Public Service Pensions Commission: Interim Report
http://slidepdf.com/reader/full/independent-public-service-pensions-commission-interim-report 44/176
40
Indeendent Public Service Pensions Commission: Interim Reort - 7 October 2010
in Box 2.C), that have been introduced for the biggest schemes. Other schemes, such as the Judicial Pension Scheme, have not been signicantly modernised at all.
. e civil service, NHS and teachers schemes across the UK have been modernised tosome extent. e Public Services Forum (PSF) Agreement of October 2005 between theprevious Government and trades unions allowed existing members to keep a pension ageof 60 if they wished, while the pension age for new entrants was set at 65.2 Other measuresincluded a major transfer of risk from employer to employees through a cap and sharemechanism and an increase in employee contribution for the teachers and NHS schemes.For the NHS, tiering of employee contributions by earnings level was introduced.
. e Local Government Pension Schemes were reformed on similar lines, with theaddition that pension ages lower than 65 are being phased out by 2020, so compulsory changes to pension ages were not limited to new entrants.3 e LGPS also introduced tieringof employee contributions by earnings level.
.6 Many of these reformed schemes changed their accrual rates, in most cases just for new entrants, but all except the civil service are still based on nal salary.4 e civil service schemeinstead moved to a career average structure for new entrants. e career average was deemedmore appropriate than nal salary for an increasingly diverse civil service – one that wishedto encourage movement to and from the private sector and to deliver pension outcomes that
are more equitable between those individuals whose pay does rise considerably during theircivil service careers and those whose pay does not.5
. e second wave of reforms including the introduction and implementation of cap andshare was in large part aimed at osetting future cost increases. e most signicant reformsin the rst and second waves are summarised in Table 2.A.
2 Some NHS members will have opted voluntarily to move to the new terms with pension age of 65 as part of the NHS
Pensions Choice exercise.
3 This also applied when a higher deferred pension age of 65 was introduced for the armed forces and was applied to
existing and new members as part of a package that also increased payments for death in service.
4 The NHS scheme provides nal salary pensions for most members but general and dental practitioners have career
average arrangements.
5 The accrual rate for the civil service career average arrangements, known as “Nuvos”, is 2.3 per cent of annual
pensionable pay. This accrual rate compares favourably with many other career average schemes, but the benet accrued
each year before the pension award is now to be uprated by CPI, not RPI or earnings. As Chart 5.G in Chapter 5 indicates,
Nuvos is now on average less valuable than the new arrangements for other public service groups.

8/8/2019 Independent Public Service Pensions Commission: Interim Report
http://slidepdf.com/reader/full/independent-public-service-pensions-commission-interim-report 45/176
41
Indeendent Public Service Pensions Commission: Interim Reort - 7 October 2010
T a b l e 2 . A : S u m m a r y o f p u b l i c s e r
v i c e p e n s i o n s c h e m e r e f o
r m s 2 0 0 5 - 0 8
N H S a
T e a c h e r s
C i v i l s e r v i c e b
L G
P S ( r e f o r m e d
f o r a l l m e m b e r s )
A r m e d f o r c e s
P o l i c e
F i r e
N o r m a l P e n s i o n
A g e ( N P A )
6 0 à 6
5
6 0 à 6 5
6 0 à 6
5
R e
m a i n s 6 5 ; R u l e
o f
8 5 a b o l i s h e d
f o r n e w s e r v i c e
w i t h t r a n s i t i o n a l
p r o t e c t i o n
N o c h a n g e f r o m
5 5
5 0 w i t h 2 5 y
s e r v i c e ( b e l o w 5 0
w i t h 3 0 y ) ; 5 5 ( 5 7
o r 6 0 f o r h i g h e r
r a n k s ) à 5
5
5 5 ( f r o m 5 0 a f t e r
2 5 y s e r v i c e ) à 6
0
N P A f o r e a
r l y
l e a v e r s
S a m e a s N P A
S a m e a s
N P A
S a m e a s N P A
S a m e a s N P A
6 0 à 6
5 ( a l l
m e m b e r s )
6 0 à 6
5
6 0 à 6
5
B a s i c d e s i g
n
R e m a i n s n a l
s a l a r y
R e m a i n s
n a l
s a l a r y
F i n a l s a l a r y à
C a r e e r a v e r a g e
R e
m a i n s n a l
s a l a r y
R e m a i n s n a l
s a l a r y
R e m a i n s n a l
s a l a r y
R e m a i n s n
a l
s a l a r y
A c c r u a l r a t e
8 0 t h s à 6
0 t h s
8 0 t h s à
6 0 t h s
6 0 t h s à 2 . 3 %
8 0
t h s à 6
0 t h s
6 9 t h s ( 9 1 t h s a f t e
r
2 2 y c à 7
0 t h s
6 0 t h s ( 3 0 t h s a f t e r
2 0 y à 7
0 t h s
6 0 t h s ( 3 0 t h
s a f t e r
2 0 y à 7
0 t h s
A d d i t i o n a l
l u m p
s u m ?
3 x p e n s i o n à
c o m m u t a t i o n
3 x p e n s i o n à
c o m m u t
a t i o n
C o m m u t a t i o n o n l y 3 x
p e n s i o n à
c o m m u t a t i o n
N o c h a n g e f r o m
3 x p e n s i o n
C o m m u t a t i o n
4 x p e n s i o n
C o m m u t a t i o n o n l y
L a t e r e t i r e m e n t
e n h a n c e m e n t ?
N o à Y e s
N o à Y e s
N o à Y e s
N o
à Y e s
N o
N o
N o
D r a w - d o w
n o p t i o n Y e s
Y e s ( a l l m
e m b e r s )
Y e s ( a l l m e m b e r s )
Y e
s
N o
N o
N o
R a t e o f e m
p l o y e e
c o n t r i b u t i o
n s d
6 % (
5 % ) à
5 - 8 . 5 % (
f o r a l l
m e m b e r s )
6 % à 6
. 4 % (
f o r
a l l m e m b e r s )
N o c h a n g e f r o m
3 . 5 %
6 %
( 5 % ) à
5 . 5 % - 7 . 5 %
R e m a i n s
n o n - c o n t r i b u t o r y
1 1 % à 9 . 5 %
1 1 % à 8 . 5
%
C o s t s h a r i n
g ?
Y e s
Y e s
Y e s
Y e
s
N o
N o
N o
E l i g i b i l i t y f o r
s u r v i v o r ’ s p
e n s i o n
N o w i n c l u d e s n o n - l e g a l p
a r t n e r s a n d p a y a b l e f o r l i f e
( b u t o n l y f o r n e w j o i n e r s
i n t h e p o l i c e a n d r e s c h e m e s
S u r v i v o r ’ s p e n s i o n
o n d e a t h i n
r e t i r e m e n t
R e m a i n s a
1 6 0 t h s p e n s i o n
R e m a i n s
a 1 6 0 t h s
p e n s i o n
1 6 0 t h s à 3
/ 8 t h s
o f m e m b e r ’ s
p e n s i o n
R e
m a i n s a 1 6 0 t h s
p e
n s i o n
5 0 % à 6
2 . 5 % o
f
m e m b e r ’ s p e n s i o
n
R e m a i n s a 5 0 %
m e m b e r ’ s p e n s i o n
R e m a i n s a 5 0 %
m e m b e r ’ s p
e n s i o n
I l l - h e a l t h b
e n e t
1 - t i e r à 2 - t i e r
1 - t i e r à 2 - t i e r
R e m a i n s 2 - t i e r
1 - t i e r à 3 - t i e r
( p r o p o s e d )
1 - t i e r à 2 - t i e r
1 - t i e r à 2 - t i e r
R e m a i n s 2 - t i e r
T i m e s c a l e
1 A p r 2 0 0 8
1 J a n 2 0
0 7
3 0 J u l 2 0 0 7
1 A p r i l 2 0 0 8
6 A p r i l 2 0 0 5
6 A p r i l 2 0 0 6
6 A p r i l 2 0 0
6
S o u r c e : P P I .
8/8/2019 Independent Public Service Pensions Commission: Interim Report
http://slidepdf.com/reader/full/independent-public-service-pensions-commission-interim-report 46/176
42
Indeendent Public Service Pensions Commission: Interim Reort - 7 October 2010
Notes for Table 2.A
a The scheme for salaried staff is illustrated. Self-employed members, such as GPs and Dentists, have a career-average
scheme that is not shown.
b The Premium section of the civil service scheme is illustrated here, since the Classic section has been closed to new
members since 2002.
c For other ranks. Ofcers have higher accrual rates.
d If a range is shown then employee contributions depend on pay. Figures in brackets denote special provisions for certain
categories of workers.
Further notes:
Normal pension age in the rst row is NPA for active members.
The LGPS employee rates shown are for E & W and Northern Ireland; rates in Scotland are different.
AFPS early pensions or their equivalent are still available from around age 40.
The old AFPS scheme uses “representative pay” for those below one star rank – Brigadier or equivalent. That is only
roughly equivalent to nal salary, as it is based on the average pay for a member of that rank with a particular number of
years of service.
Pensions for life regardless of remarriage etc do not apply to dependants’ pensions under the civil service “Classic”
arrangements or the old armed forces arrangements as well as to the old police and reghters schemes.
The savings assumed from reforms
.8 e overall cost savings from these reforms, compared with the costs that might otherwisehave arisen, vary considerably between schemes. Over the next 30 years, expected savingsunder the reforms of the uniformed service schemes range from under a tenth of overall costfor the armed forces to about a fth for police and a third for reghters.6 However, thesavings will build up gradually, in line with the gradual increase in the proportion of membersaccruing benets under the new pension terms. Consequently, because of protections forexisting members’ past and future service, overall costs for these schemes are predicted toremain at over a third of pensionable pay for much of the next decade.7
.9 Across the four largest categories of scheme (local government, civil service, NHS andteachers) cost savings from the reforms, compared with what costs might have been, may be equivalent to ve per cent or more of overall scheme cost by the 2040s.8 is estimateexcludes any allowance for the possible eects at future pension scheme valuations of new arrangements for risk transfer (cap and share).
. However, as with the uniformed services, because of protections given to existingmembers in respect of future service, it will be some time before the full impact of the reforms
6 About 2 per cent of pay for armed forces, 7 per cent of pay for police and 12 per cent of pay for reghters, measured
in terms of the scheme standard contribution rate, based on IPSPC analysis of information published in answer to PQs etc.
7 Based on PPI and IPSPC analysis of GAD valuation reports.
8 Based on estimates provided for schemes by GAD, and measured in terms of the standard scheme contribution rate
giving 1.2 per cent of pay for civil service and NHS and 1.3 per cent of pay for teachers and LGPS. The savings are based
on comparisons with what the employer contribution costs might have been if the reforms had not been implemented,
not allowing for cap and share.

8/8/2019 Independent Public Service Pensions Commission: Interim Report
http://slidepdf.com/reader/full/independent-public-service-pensions-commission-interim-report 47/176
43
Indeendent Public Service Pensions Commission: Interim Reort - 7 October 2010
appears in employer contribution rates. Also, some of those savings may be oset by futureincreases in employer costs rather than being reductions from the current levels of cost. 9
. e 2009 Pre-Budget Report (PBR) and the long-term public nance report (LTPFR)included an allowance for further savings to those discussed above, if further longevity pressures
were as then anticipated and if the ‘second wave’ cap and share reforms were rigorously implemented. It was assumed that two-thirds of the savings through cap and share would bemet by benet reductions, with the other third leading to contribution increases. e PBR assumed a saving of about £1billion a year on account of increases in employee contributionsresulting from cap and share from April 2012. e 2009 LTPFR indicated possible savings
through reductions in benets of £2 billion or more a year in the very long-term across theNHS, teachers and civil service pension schemes in a ‘central scenario’.10
CPI indexation
. e cost savings gures discussed above do not allow for the change to indexationby movements in the CPI rather than the RPI, for upratings from April 2011, that wasannounced at the Budget 2010 in June. at change is expected to produce upratings thatmay be on average about three-quarters of a percentage point lower than the equivalent RPIgure for that year.11
Box 2.B: Indexation
• The uprating of public service pensions is linked by an Act of Parliament to the uprating of
the State Second Pension. Since 1988, the State Second Pension has been increased by the
annual movement in the September RPI.a At Budget 2010 in June the Government said that
the CPI represented a better measure of ination for most pensions and benets, including
State Second Pension and public service pensions; and would be used in future.
. e Budget 2010 projected that the change to CPI uprating would save £1.8 billion ayear across the unfunded schemes by 2015-16, continuing to rise for many decades.
9 For example, in the NHS, where it was expected that employer contribution rates would otherwise increase by about 2
per cent of pay over the next 15-20 years on account of better careers and pay progression.
10 The outcomes were highly dependent on the longevity assumptions used in the different scenarios.
11 The difference in the underlying methodology for compiling the CPI, which allows for substitution of goods and
services by others of a comparable type as they become relatively more expensive, would produce a difference of about
half a percentage point a year. The current exclusion of most housing costs from the CPI would account for the other
quarter of a percentage point a year. The difference between CPI and RPI because of the exclusion of housing costs is
however forecast at present to be greater than a quarter of a percentage point for some of the next few years, so the
overall effect across those years exceeds three-quarters of a percentage point a year.
a The September RPI was also used for the 1987 uprating but that was not based on the movement in a full year.
Between 1979 and 1987 the arrangements for uprating State Second Pensions were based on movements in the
actual or forecast RPI for months other than September. Before the introduction of the State Earnings-Related Pension
Scheme in 1979 public service pension upratings were separately linked to movements in the RPI.
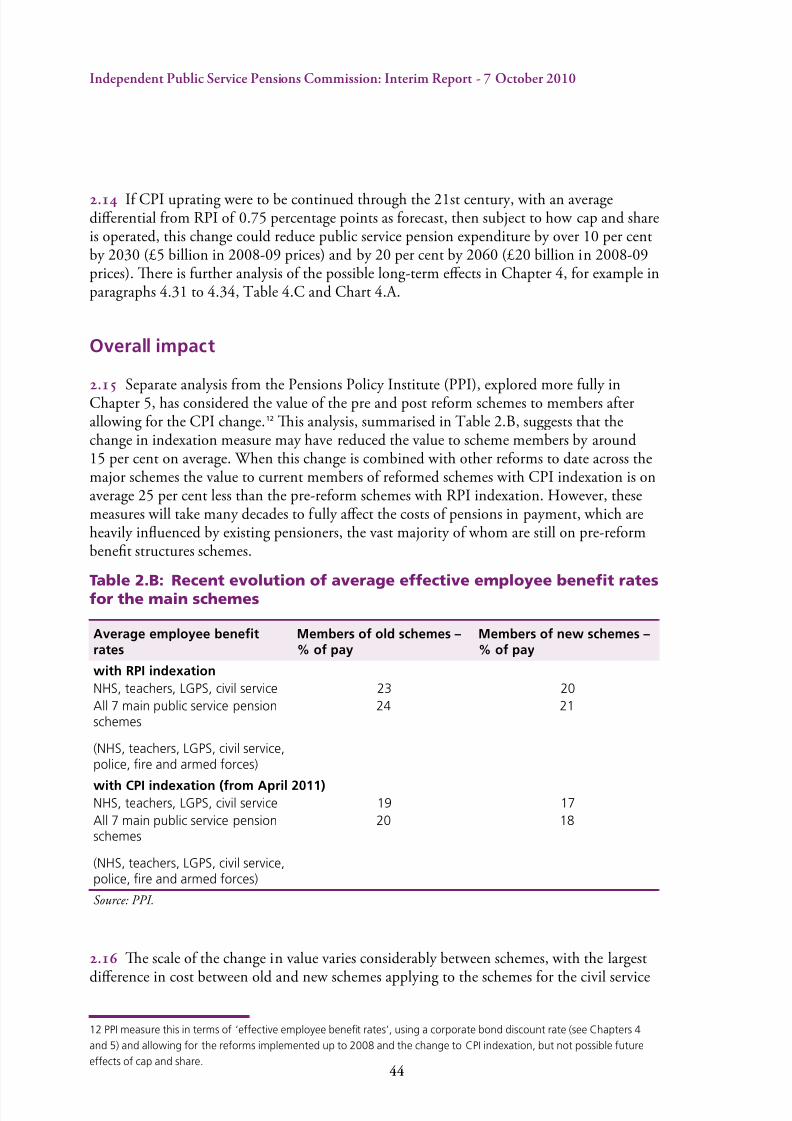
8/8/2019 Independent Public Service Pensions Commission: Interim Report
http://slidepdf.com/reader/full/independent-public-service-pensions-commission-interim-report 48/176
44
Indeendent Public Service Pensions Commission: Interim Reort - 7 October 2010
. If CPI uprating were to be continued through the 21st century, with an averagedierential from RPI of 0.75 percentage points as forecast, then subject to how cap and shareis operated, this change could reduce public service pension expenditure by over 10 per centby 2030 (£5 billion in 2008-09 prices) and by 20 per cent by 2060 (£20 billion in 2008-09prices). ere is further analysis of the possible long-term eects in Chapter 4, for example inparagraphs 4.31 to 4.34, Table 4.C and Chart 4.A.
Overall impact
. Separate analysis from the Pensions Policy Institute (PPI), explored more fully inChapter 5, has considered the value of the pre and post reform schemes to members afterallowing for the CPI change.12 is analysis, summarised in Table 2.B, suggests that thechange in indexation measure may have reduced the value to scheme members by around15 per cent on average. When this change is combined with other reforms to date across themajor schemes the value to current members of reformed schemes with CPI indexation is onaverage 25 per cent less than the pre-reform schemes with RPI indexation. However, thesemeasures will take many decades to fully aect the costs of pensions in payment, which areheavily inuenced by existing pensioners, the vast majority of whom are still on pre-reformbenet structures schemes.
Table 2.B: Recent evolution of average effective employee benet ratesfor the main schemes
Average employee benetrates
Members of old schemes –% of pay
Members of new schemes –% of pay
with RPI indexation
NHS, teachers, LGPS, civil service 23 20
All 7 main public service pensionschemes
(NHS, teachers, LGPS, civil service,police, re and armed forces)
24 21
with CPI indexation (from April 2011)NHS, teachers, LGPS, civil service 19 17
All 7 main public service pensionschemes
(NHS, teachers, LGPS, civil service,police, re and armed forces)
20 18
Source: PPI.
.6 e scale of the change in value varies considerably between schemes, with the largest
dierence in cost between old and new schemes applying to the schemes for the civil service
12 PPI measure this in terms of ‘effective employee benet rates’, using a corporate bond discount rate (see Chapters 4
and 5) and allowing for the reforms implemented up to 2008 and the change to CPI indexation, but not possible future
effects of cap and share.
8/8/2019 Independent Public Service Pensions Commission: Interim Report
http://slidepdf.com/reader/full/independent-public-service-pensions-commission-interim-report 49/176
45
Indeendent Public Service Pensions Commission: Interim Reort - 7 October 2010
and the uniformed services and the smallest to the LGPS (in part because the LGPS appliedchanges in pension ages to many existing members). e dierences between schemes areconsidered further in Chapter 5, for example in Chart 5.G.
Building on cap and share
. At present cap and share applies to the ‘big four’ categories of scheme – NHS, teachers,civil service and local government.13 It seems that an underlying policy intention was to keepthe levels of employer cost no higher than those reached around 2004 and 2005. e caps
for teachers, NHS and civil service employer contributions appear to have been set with thatin mind.
Box 2.C: Cap and share
Cap and share are arrangements for sharing and limiting costs introduced following the Public
Services Forum Agreement of October 2005. Under cap and share, increases or reductions in
cost pressures identied at a pension scheme actuarial valuation are shared between employees
and employers, up to the value of a cap. Above that cap the increases or reductions are borne
by employees, either by changing employee contributions or the cost of employee benets
(by measures such as changing pension ages), or by doing both. Below that cap, increases or
reductions are shared between employers and employees.
.8 e caps were to be taken into account in the next round of scheme actuarialvaluations. Every three or four years such valuations will assess the current nancial positionof each scheme and highlight any cost pressures to be met by extra employer and employeecontributions or reductions in benets. e current cost caps and employer contributionrates are shown in Table 2.C.
13 It also applies to the Parliamentary Pension Scheme, which has undertaken a cap and share valuation.
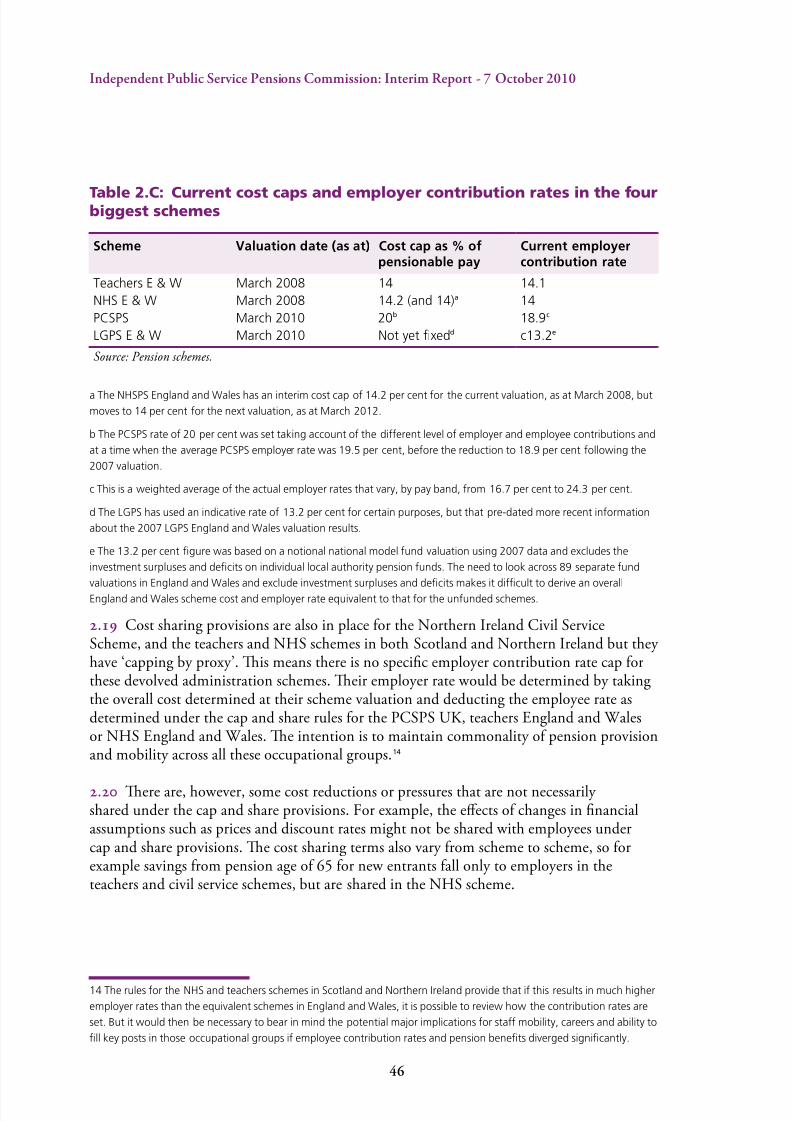
8/8/2019 Independent Public Service Pensions Commission: Interim Report
http://slidepdf.com/reader/full/independent-public-service-pensions-commission-interim-report 50/176
4
Indeendent Public Service Pensions Commission: Interim Reort - 7 October 2010
Table 2.C: Current cost caps and employer contribution rates in the fourbiggest schemes
Scheme Valuation date (as at) Cost cap as % ofpensionable pay
Current employercontribution rate
Teachers E & W March 2008 14 14.1
NHS E & W March 2008 14.2 (and 14)a 14
PCSPS March 2010 20b 18.9c
LGPS E & W March 2010 Not yet xedd c13.2e
Source: Pension schemes.
a The NHSPS England and Wales has an interim cost cap of 14.2 per cent for the current valuation, as at March 2008, butmoves to 14 per cent for the next valuation, as at March 2012.
b The PCSPS rate of 20 per cent was set taking account of the different level of employer and employee contributions and
at a time when the average PCSPS employer rate was 19.5 per cent, before the reduction to 18.9 per cent following the
2007 valuation.
c This is a weighted average of the actual employer rates that vary, by pay band, from 16.7 per cent to 24.3 per cent.
d The LGPS has used an indicative rate of 13.2 per cent for certain purposes, but that pre-dated more recent information
about the 2007 LGPS England and Wales valuation results.
e The 13.2 per cent gure was based on a notional national model fund valuation using 2007 data and excludes the
investment surpluses and decits on individual local authority pension funds. The need to look across 89 separate fund
valuations in England and Wales and exclude investment surpluses and decits makes it difcult to derive an overall
England and Wales scheme cost and employer rate equivalent to that for the unfunded schemes.
.9 Cost sharing provisions are also in place for the Northern Ireland Civil ServiceScheme, and the teachers and NHS schemes in both Scotland and Northern Ireland but they have ‘capping by proxy’. is means there is no specic employer contribution rate cap forthese devolved administration schemes. eir employer rate would be determined by takingthe overall cost determined at their scheme valuation and deducting the employee rate asdetermined under the cap and share rules for the PCSPS UK, teachers England and Walesor NHS England and Wales. e intention is to maintain commonality of pension provisionand mobility across all these occupational groups.14
. ere are, however, some cost reductions or pressures that are not necessarily shared under the cap and share provisions. For example, the eects of changes in nancialassumptions such as prices and discount rates might not be shared with employees undercap and share provisions. e cost sharing terms also vary from scheme to scheme, so forexample savings from pension age of 65 for new entrants fall only to employers in theteachers and civil service schemes, but are shared in the NHS scheme.
14 The rules for the NHS and teachers schemes in Scotland and Northern Ireland provide that if this results in much higher
employer rates than the equivalent schemes in England and Wales, it is possible to review how the contribution rates are
set. But it would then be necessary to bear in mind the potential major implications for staff mobility, careers and ability to
ll key posts in those occupational groups if employee contribution rates and pension benets diverged signicantly.

8/8/2019 Independent Public Service Pensions Commission: Interim Report
http://slidepdf.com/reader/full/independent-public-service-pensions-commission-interim-report 51/176
47
Indeendent Public Service Pensions Commission: Interim Reort - 7 October 2010
. As Table 2.C shows, at the moment the employer contribution rate for the teachersEngland and Wales scheme is above its cap, for the NHS England and Wales scheme it is
just below and the civil service is approaching its cap.
. At present the LGPS does not yet have a cap in England and Wales or specicprovisions for capping in Scotland or Northern Ireland.15 It is uncertain whether theemployer rates resulting from LGPS cap and share valuations would be above or below thesort of cap that might be set.
. e cap and share provisions for the LGPS will be particularly complicated because
of the devolved structure of the scheme, with 89 separate funds in England and Wales; andbecause the eects of funding are to be excluded from the sharing arrangements. e LGPScap would be based on a notional (model) fund valuation that excluded investment surplusesand decits and the cap and share valuation used to determine employee contribution ratesacross the scheme would also be a notional fund valuation.
The limitations of cap and share
. Many schemes are not yet covered by cap and share arrangements and even wherethey are, cap and share is an untried system. Some basic principles have been agreed, but the
arrangements are still in the developmental stage. Processes are still being worked out even where provision for cap and share has been made in scheme rules.
. Cap and share has other limitations:
• cap and share reduces scheme costs only i scheme valuations reveal uture additionalcost pressures compared with a recent baseline (which is usually the precedingvaluation). Thereore, although cap and share can reduce scheme costs below whatthey might have been, it would not at present deal with the very considerableincreases in the costs o providing pensions, worth several percent o pay a year, thathave resulted rom increases in longevity in recent decades;
• in order to pick up past increases in longevity within cap and share it would benecessary either to set a baseline reecting costs three or our decades ago, whenlongevity began to rise much more markedly, or to reduce the employer contributionrate caps to levels well below the employer rates that have been paid in recent years;
• operating cap and share on a scheme-by-scheme basis seems unlikely to producecoherent outcomes across government. Those outcomes would include whatmembers o dierent schemes pay or a comparable beneft, what beneft designs areoered and how risk to taxpayers, employers and members is managed; and
15 LGPS Scotland has been undertaking discussions but provisions have not been nalised for their fund valuations in
2011. The LGPS in Northern Ireland is awaiting developments in England and Wales; and Scotland.

8/8/2019 Independent Public Service Pensions Commission: Interim Report
http://slidepdf.com/reader/full/independent-public-service-pensions-commission-interim-report 52/176
4
Indeendent Public Service Pensions Commission: Interim Reort - 7 October 2010
• under current cap and share valuation processes, changes in costs16 are attributed tomembers and employers, including those in the private sector. Under the currentmethodology or calculating scheme costs at cap and share valuations, overall costs tobe shared at the next valuations may be much lower than previously expected. Capand share may thereore not o itsel produce the anticipated results, including thereductions in overall pressures on public spending and fnance that are summarisedin paragraph 2.12.
.6 All this means that cap and share on its own will not deliver the type of wide-rangingstructural reforms that are needed or signicant reductions in current costs for taxpayers.
It would instead be necessary to apply a more coherent overall policy framework whendetermining future pension provision and how levels of employer cost and risk are assessed,managed and taken into account in overall remuneration.
16 This would include where costs and savings had arisen from changes in the costs of paying existing pensioners.

8/8/2019 Independent Public Service Pensions Commission: Interim Report
http://slidepdf.com/reader/full/independent-public-service-pensions-commission-interim-report 53/176
4
Indeendent Public Service Pensions Commission: Interim Reort - 7 October 2010
The Principles
IndependentPublic Service
Pensions Commission

8/8/2019 Independent Public Service Pensions Commission: Interim Report
http://slidepdf.com/reader/full/independent-public-service-pensions-commission-interim-report 54/176
50
Indeendent Public Service Pensions Commission: Interim Reort - 7 October 2010

8/8/2019 Independent Public Service Pensions Commission: Interim Report
http://slidepdf.com/reader/full/independent-public-service-pensions-commission-interim-report 55/176
51
Indeendent Public Service Pensions Commission: Interim Reort - 7 October 2010
3 The framework of principles
Box 3.A: Summary
This section of the report is structured around the framework of principles that the Commission
has developed. Public service pensions should be:
• affordable and sustainable;
• adequate and fair;
• support productivity; and
• transparent and simple.
The principles have been chosen to provide a balanced and comprehensive framework with
which to consider the case for reform and against which to assess the options for long-term
structural change.
The principles will tend to pull in different directions. This will help make the trade-offs clear sothat a sensible overall judgement can be reached.
. is section of the report is structured around the Commission’s four main principlesfor public service pensions. e principles have been chosen to provide a balanced andcomprehensive framework with which to consider the case for reform, as we do in thisinterim report and against which to assess the options for long-term structural reform, whichthe Commission will do in the nal report. is set of principles echo a number of the areasfor consideration that were identied in our terms of reference and also reect the full rangeof issues covered in the evidence the Commission received. ey have been chosen becausethe Commission considers them to be the most important factors that should govern theoverall design of public service pensions: aordable and sustainable; adequate and fair;support productivity; and transparent and simple.
Affordable and sustainable
. Spending on public service pensions must be aordable and must remain aordableover time to be sustainable. What level of pension cost is aordable is a political decisionfor the Government within the context of a range of priorities. But it is not an issue that
can just be looked at in the short-term as the eects of decisions taken on pensions tend tobuild up and then persist over a long period. In assessing aordability and sustainability theCommission has identied a range of relevant cost measures to consider and the need for anagreed discount rate. Part of any assessment of cost must include the consequences of any

8/8/2019 Independent Public Service Pensions Commission: Interim Report
http://slidepdf.com/reader/full/independent-public-service-pensions-commission-interim-report 56/176
52
Indeendent Public Service Pensions Commission: Interim Reort - 7 October 2010
reform on increased take-up of benets such as pension credit. Critical to sustainability isthe sensitivity of future costs to risks, such as changes to longevity and how these risks aremanaged and shared. Options for change must deliver an aordable and sustainable system
with the robustness and exibility to withstand the uncertainties of the future.
Adequate and fair
. Public service pensions should provide an adequate level of retirement income forpublic service workers with a reasonable degree of certainty. To assess reforms against this
principle the Commission needs an agreed measure of what is adequate and what should bemeasured against the benchmark. e Commission provides some ideas in this interim report. Adequacy is a measure of fairness, but the Commission is also looking at fairness in thedistribution of contributions and benets between members of the same pension scheme – by income, by career path, by time of entry; fairness between dierent schemes; fairness betweengenerations of taxpayers; and fairness between the taxpayer and the public service employee.
Support productivity
. To support productivity, public service pension scheme design should be consistent
with an ecient labour market for employees so that the taxpayer can be condent thatpublic services are being delivered on a value for money basis. In general, scheme designshould avoid barriers to the movement of employees between sectors. is needs to beviewed in the context of the whole remuneration package and whether the schemes supportthe recruitment and retention of the right people in the right jobs in a cost-eective way and be able to deal exibly with specic job issues. In particular, they should not be anunintended barrier to the outsourcing and mutualisation of public services that could drivegreater productivity and eciency in public services.
Transparent and simple
. Public service pensions should be widely understood, both by the scheme members withregard to their own specic entitlements and possible future benets and by taxpayers whohave a role in funding the schemes. e key design features and the costs to employers andemployees need to be set out clearly and transparently. It follows that public service pensiondesign should be relatively easy to understand and proposals set out with the aim of obtaining
wide agreement. Assessment of reform needs to consider potential trade-os together withimplementation and transitional issues including the means for protecting accrued rights andpossibilities for more cost-eective administration. It is also important that public servicepension schemes, like schemes in the private sector, have a clear legal framework and a
governance structure that provides clarity on the roles of the interested parties.

8/8/2019 Independent Public Service Pensions Commission: Interim Report
http://slidepdf.com/reader/full/independent-public-service-pensions-commission-interim-report 57/176
53
Indeendent Public Service Pensions Commission: Interim Reort - 7 October 2010
How the principles will be used
.6 ese principles will form the basis for assessing the long-term options for reform. eevidence in this interim report has been framed around the principles and reference has beenmade to their relevance to the Commission’s nal report.
. It is not intended to weight the principles, or the evidence associated with them andconsequently the Commission’s nal report will necessarily be subjective. It is highly likely that some of the principles will be in conict as varying options for reform are examinedmore closely. For example a scheme that delivers an adequate level of retirement income and
is calibrated to meet objectives on fairness may as a result be dicult to understand, contrary to the principle of transparency and simplicity. erefore, all options for change will have tobe assessed against each of the principles and a balance struck. e intention is for the trade-os to be clear so that a sensible judgement can be reached.

8/8/2019 Independent Public Service Pensions Commission: Interim Report
http://slidepdf.com/reader/full/independent-public-service-pensions-commission-interim-report 58/176
54
Indeendent Public Service Pensions Commission: Interim Reort - 7 October 2010

8/8/2019 Independent Public Service Pensions Commission: Interim Report
http://slidepdf.com/reader/full/independent-public-service-pensions-commission-interim-report 59/176
55
Indeendent Public Service Pensions Commission: Interim Reort - 7 October 2010
4 Affordable and sustainable
Box 4.A: Summary
• The long-term and uncertain nature of public service pensions makes assessing ‘cost’
very difcult, whether this involves deciding what measure to use or how that should be
calculated. Government, employers and commentators use many different measures.
• Considering the projected future benet expenditure as a percentage of GDP can be a
useful tool in assessing affordability over the longer-term. Based on the latest gures
produced by the Government Actuary’s Department, which take account of latest
developments including the move to CPI indexation, public service pension benet
expenditure from unfunded schemes is expected to reach 1.9 per cent of GDP in 2010-
11 and remain close to this level for the next decade before decreasing to 1.4 per cent of
GDP by 2060. These projections are dependent on the assumptions made, especially in the
longer-term.
• Improvements in longevity mean that pensioners are in receipt of pension payments forlonger making these schemes signicantly more costly than was expected when they were
set up. Further improvements in longevity are expected but the rate of improvement is
uncertain – in the past improvements have been consistently underestimated. Sustainable
pension schemes in the public sector need to have mechanisms to manage such
uncertainties in future costs.
• The discount rate used to set employer and employee contributions is critical in order to
ensure that the costs of the future pension promises are being adequately allowed for in
workforce planning and budgeting and that contributions required can be appropriately
divided between the employer and the employee. The Commission believes there is a case
for reviewing the current discount rate of RPI plus 3.5 per cent, which is clearly at thehigh end of the spectrum and recommends that the Government undertakes a review to
establish the appropriate rate, preferably in time to inform the Commission’s nal report.
• Most public service pension schemes are unfunded. The Commission’s view is that, given
the risks, the lack of obvious economic benet and the large transition costs of moving to a
funded basis, this remains appropriate as the basic nancing model.

8/8/2019 Independent Public Service Pensions Commission: Interim Report
http://slidepdf.com/reader/full/independent-public-service-pensions-commission-interim-report 60/176
5
Indeendent Public Service Pensions Commission: Interim Reort - 7 October 2010
Box 4.A (continued): Summary
• The Local Government Pension Scheme (LGPS) is in a different position as it is funded. Its
costs are in addition to those expressed above as a percentage of GDP. However, the funds
are not operated on the basis of trust law or subject to the same funding and regulatory
requirements that apply to the generality of funded schemes. The LGPS is unlikely to be
fully funded for the foreseeable future, although switching to CPI indexation will improve
its funding levels. The Commission has concluded that the current LGPS should continue
on a funded basis. In any event, holding investment funds does not remove the need to
consider structural reforms to deal with issues around the sustainability and fairness of
benets – issues common to all public service pension schemes.
• In considering reform, the Commission seeks to avoid changes that would make recipients
signicantly more reliant on state help.
. Ensuring that public service pensions are aordable and sustainable is crucial butultimately, the level of spending on public service pensions is a decision for Government.Sustainability relates to how pension payments are expected to change and whether costsare manageable in the long-term, as well as considering the impact of dierent risks in thesystem on the variability of future costs and who faces these risks.
Present and future cost
Methods for measuring the cost of unfunded public service
pensions
. Pensions are complex and uncertain in nature. e ‘cost’ of pension schemes is adicult concept to dene and measure, especially where the schemes are unfunded. Here theCommission considers some of the measures that can be used when considering the cost of public service pension schemes.
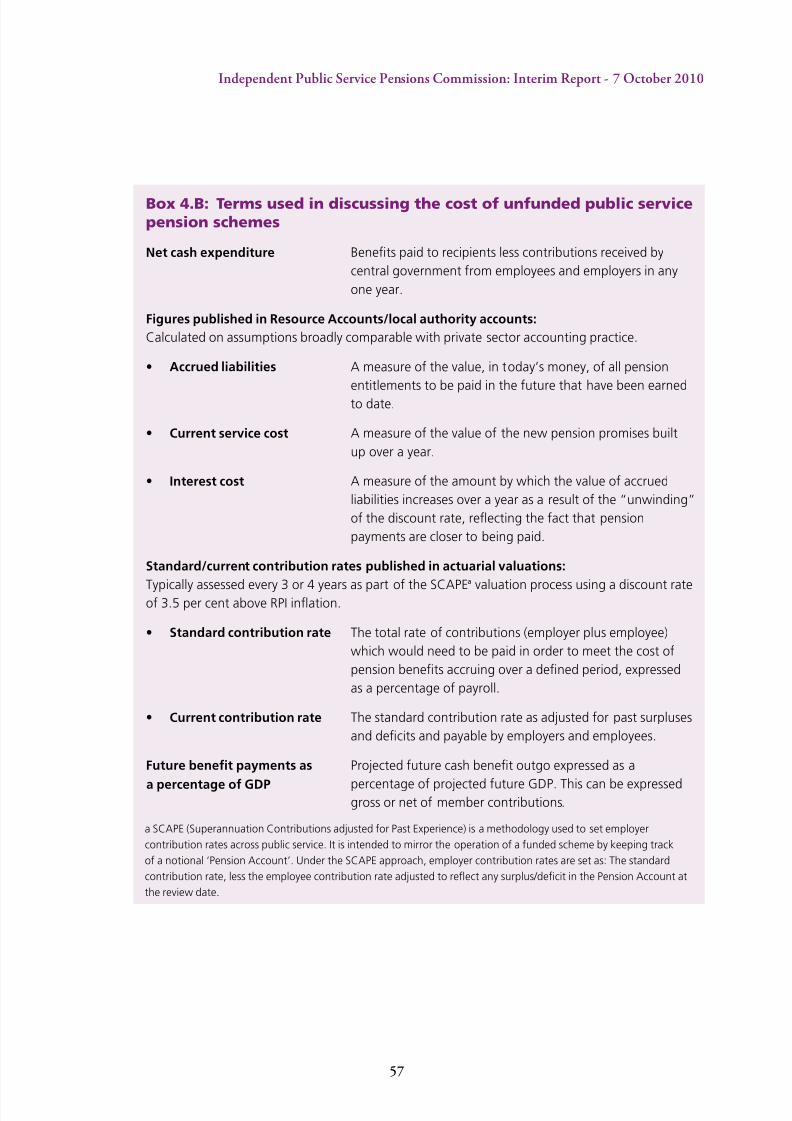
8/8/2019 Independent Public Service Pensions Commission: Interim Report
http://slidepdf.com/reader/full/independent-public-service-pensions-commission-interim-report 61/176
57
Indeendent Public Service Pensions Commission: Interim Reort - 7 October 2010
Box 4.B: Terms used in discussing the cost of unfunded public servicepension schemes
Net cash expenditure Benets paid to recipients less contributions received by
central government from employees and employers in any
one year.
Figures published in Resource Accounts/local authority accounts:
Calculated on assumptions broadly comparable with private sector accounting practice.
• Accrued liabilities A measure of the value, in today’s money, of all pension
entitlements to be paid in the future that have been earned
to date.
• Current service cost A measure of the value of the new pension promises built
up over a year.
• Interest cost A measure of the amount by which the value of accrued
liabilities increases over a year as a result of the “unwinding”
of the discount rate, reecting the fact that pension
payments are closer to being paid.
Standard/current contribution rates published in actuarial valuations:
Typically assessed every 3 or 4 years as part of the SCAPEa
valuation process using a discount rateof 3.5 per cent above RPI ination.
• Standard contribution rate The total rate of contributions (employer plus employee)
which would need to be paid in order to meet the cost of
pension benets accruing over a dened period, expressed
as a percentage of payroll.
• Current contribution rate The standard contribution rate as adjusted for past surpluses
and decits and payable by employers and employees.
Future benet payments as Projected future cash benet outgo expressed as a
percentage of projected future GDP. This can be expressedgross or net of member contributions.
a SCAPE (Superannuation Contributions adjusted for Past Experience) is a methodology used to set employer
contribution rates across public service. It is intended to mirror the operation of a funded scheme by keeping track
of a notional ‘Pension Account’. Under the SCAPE approach, employer contribution rates are set as: The standard
contribution rate, less the employee contribution rate adjusted to reect any surplus/decit in the Pension Account at
the review date.
a percentage of GDP
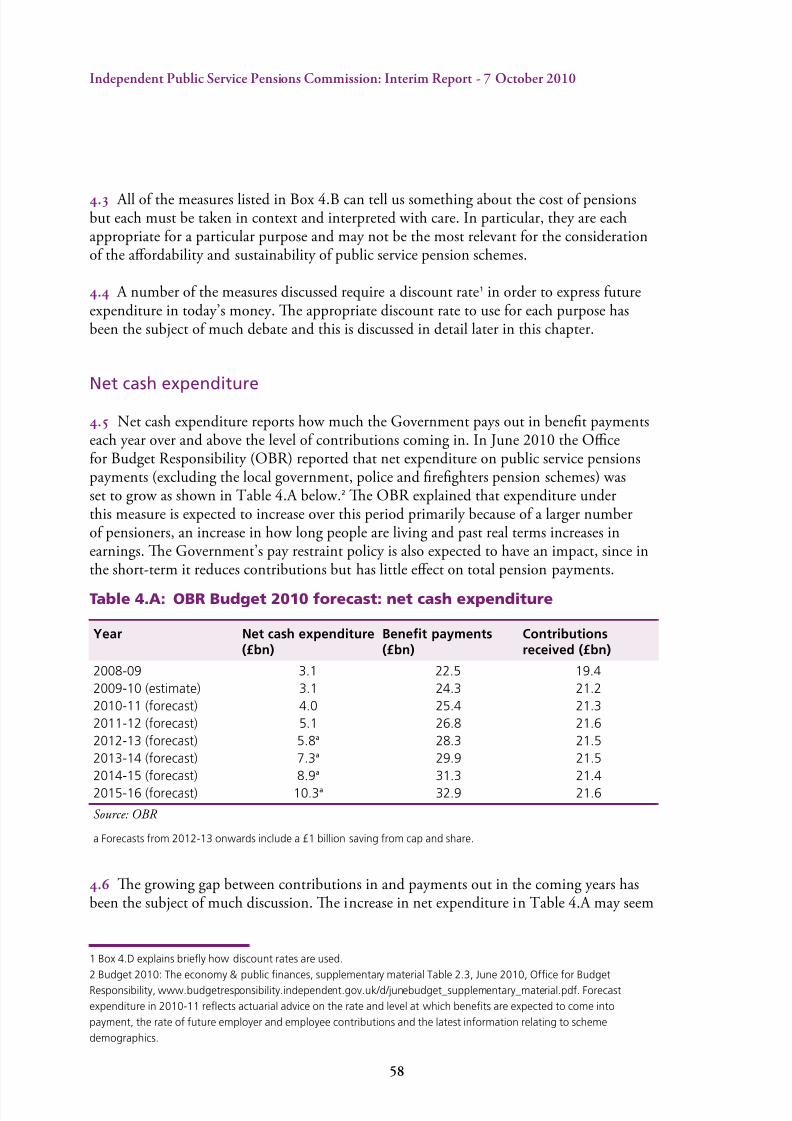
8/8/2019 Independent Public Service Pensions Commission: Interim Report
http://slidepdf.com/reader/full/independent-public-service-pensions-commission-interim-report 62/176
5
Indeendent Public Service Pensions Commission: Interim Reort - 7 October 2010
. All of the measures listed in Box 4.B can tell us something about the cost of pensionsbut each must be taken in context and interpreted with care. In particular, they are eachappropriate for a particular purpose and may not be the most relevant for the considerationof the aordability and sustainability of public service pension schemes.
. A number of the measures discussed require a discount rate1 in order to express futureexpenditure in today’s money. e appropriate discount rate to use for each purpose hasbeen the subject of much debate and this is discussed in detail later in this chapter.
Net cash expenditure. Net cash expenditure reports how much the Government pays out in benet paymentseach year over and above the level of contributions coming in. In June 2010 the Ocefor Budget Responsibility (OBR) reported that net expenditure on public service pensionspayments (excluding the local government, police and reghters pension schemes) wasset to grow as shown in Table 4.A below.2 e OBR explained that expenditure underthis measure is expected to increase over this period primarily because of a larger numberof pensioners, an increase in how long people are living and past real terms increases inearnings. e Government’s pay restraint policy is also expected to have an impact, since inthe short-term it reduces contributions but has little eect on total pension payments.
Table 4.A: OBR Budget 2010 forecast: net cash expenditure
Year Net cash expenditure(£bn)
Benet payments(£bn)
Contributionsreceived (£bn)
2008-09 3.1 22.5 19.4
2009-10 (estimate) 3.1 24.3 21.2
2010-11 (forecast) 4.0 25.4 21.3
2011-12 (forecast) 5.1 26.8 21.6
2012-13 (forecast) 5.8a 28.3 21.5
2013-14 (forecast) 7.3a 29.9 21.5
2014-15 (forecast) 8.9a 31.3 21.4
2015-16 (forecast) 10.3a 32.9 21.6
Source: OBR
a Forecasts from 2012-13 onwards include a £1 billion saving from cap and share.
.6 e growing gap between contributions in and payments out in the coming years hasbeen the subject of much discussion. e increase in net expenditure in Table 4.A may seem
1 Box 4.D explains briey how discount rates are used.
2 Budget 2010: The economy & public nances, supplementary material Table 2.3, June 2010, Ofce for Budget
Responsibility, www.budgetresponsibility.independent.gov.uk/d/junebudget_supplementary_material.pdf. Forecast
expenditure in 2010-11 reects actuarial advice on the rate and level at which benets are expected to come into
payment, the rate of future employer and employee contributions and the latest information relating to scheme
demographics.
8/8/2019 Independent Public Service Pensions Commission: Interim Report
http://slidepdf.com/reader/full/independent-public-service-pensions-commission-interim-report 63/176
5
Indeendent Public Service Pensions Commission: Interim Reort - 7 October 2010
steep but this is the dierence in two much larger numbers and as such is inherently volatile– the increase in benet payments does not see such a steep increase. e growing gap isa consequence of an unfunded system where the balance between active members, whogenerally contribute to schemes and pensioner members, who receive benets, is changingover time as explained in more detail in Box 1.B in Chapter 1. In particular, the growing gapreects the forecast fall in public service workforce numbers, and therefore active members of public service pension schemes paying contributions over the next few years. Active membercontributions are based on the future benets they themselves are expected to receive ratherthan on current pensioner benet levels.
. is measure can in a limited way highlight cash ow issues for government that couldaect other expenditure in the short-term however it does not provide a complete picture of long-term aordability.
Accrued liabilities
.8 e Government Actuary’s Department (GAD) has estimated the accrued liability forall unfunded public service pension schemes at £770 billion, at 31 March 2008. is gurerepresents all pension entitlements that have accrued3 at the date of calculation and which
will fall due for payment over the next seven to eight decades in a single measure. It is not a
sum of money that will ever be needed at one time.
.9 Using liability values can increase transparency and aid comparability. Valuations of liabilities for public service pensions are useful for making comparisons with private sectorschemes. However, the inherently large public service numbers must be taken in context, asone of many long-term Government commitments, alongside future health and educationcosts and the basic State Pension; and one that will be paid over a period of 70 years ormore. Also, as it is based on benets earned to date, largely already xed, liability valuescannot provide information on the aordability of pension benets to be earned in thefuture over which the Government has control.
. Liability values are sensitive to the assumptions used and in particular to the discountrate. e discount rate used for Resource Accounts is based on AA corporate bond yields,broadly in line with the private sector accounting practices. is yield is volatile, uctuating
with movements in the market, making the liability values also very volatile. Calculations by Towers Watson have estimated more recent total accrued liability gures for all unfundedschemes and public service pension schemes (on methodology consistent with the 31 March2008 gure) as follows:
3 As this treats the scheme as an ongoing entity, it allows for future growth in pensionable earnings for those members
who are currently contributing – the ‘active’ members.
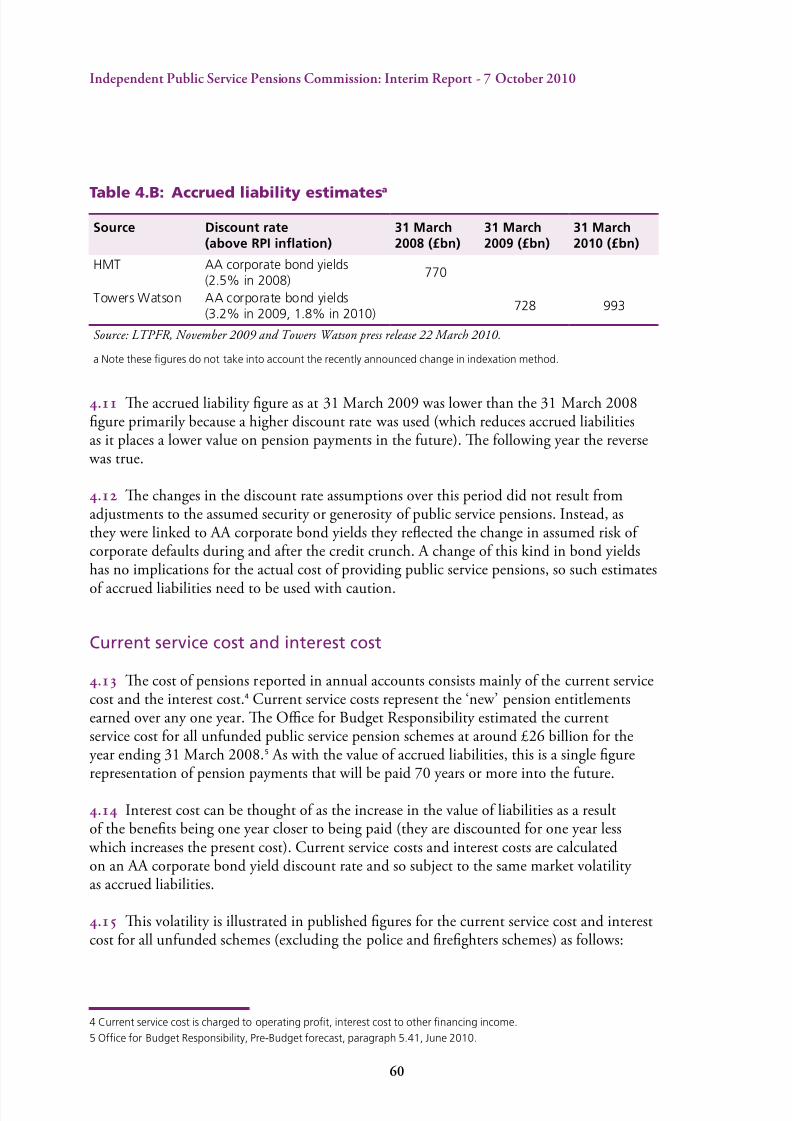
8/8/2019 Independent Public Service Pensions Commission: Interim Report
http://slidepdf.com/reader/full/independent-public-service-pensions-commission-interim-report 64/176
0
Indeendent Public Service Pensions Commission: Interim Reort - 7 October 2010
Table 4.B: Accrued liability estimatesa
Source Discount rate(above RPI ination)
31 March2008 (£bn)
31 March2009 (£bn)
31 March2010 (£bn)
HMT AA corporate bond yields(2.5% in 2008)
770
Towers Watson AA corporate bond yields(3.2% in 2009, 1.8% in 2010)
728 993
Source: LPFR, November 2009 and owers Watson press release 22 March 2010.
a Note these gures do not take into account the recently announced change in indexation method.
. e accrued liability gure as at 31 March 2009 was lower than the 31 March 2008gure primarily because a higher discount rate was used (which reduces accrued liabilitiesas it places a lower value on pension payments in the future). e following year the reverse
was true.
. e changes in the discount rate assumptions over this period did not result fromadjustments to the assumed security or generosity of public service pensions. Instead, asthey were linked to AA corporate bond yields they reected the change in assumed risk of corporate defaults during and after the credit crunch. A change of this kind in bond yieldshas no implications for the actual cost of providing public service pensions, so such estimates
of accrued liabilities need to be used with caution.
Current service cost and interest cost
. e cost of pensions reported in annual accounts consists mainly of the current servicecost and the interest cost.4 Current service costs represent the ‘new’ pension entitlementsearned over any one year. e Oce for Budget Responsibility estimated the currentservice cost for all unfunded public service pension schemes at around £26 billion for theyear ending 31 March 2008.5 As with the value of accrued liabilities, this is a single gurerepresentation of pension payments that will be paid 70 years or more into the future.
. Interest cost can be thought of as the increase in the value of liabilities as a resultof the benets being one year closer to being paid (they are discounted for one year less
which increases the present cost). Current service costs and interest costs are calculatedon an AA corporate bond yield discount rate and so subject to the same market volatility as accrued liabilities.
. is volatility is illustrated in published gures for the current service cost and interestcost for all unfunded schemes (excluding the police and reghters schemes) as follows:
4 Current service cost is charged to operating prot, interest cost to other nancing income.
5 Ofce for Budget Responsibility, Pre-Budget forecast, paragraph 5.41, June 2010.
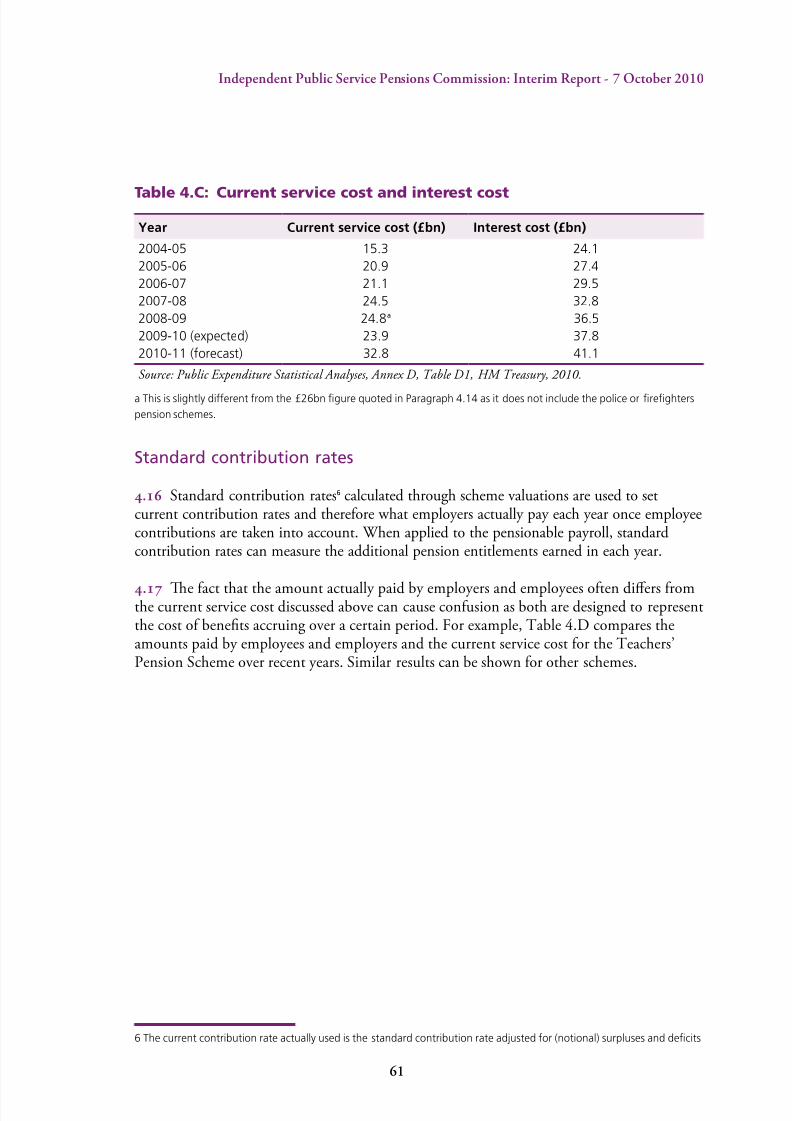
8/8/2019 Independent Public Service Pensions Commission: Interim Report
http://slidepdf.com/reader/full/independent-public-service-pensions-commission-interim-report 65/176
1
Indeendent Public Service Pensions Commission: Interim Reort - 7 October 2010
Table 4.C: Current service cost and interest cost
Year Current service cost (£bn) Interest cost (£bn)
2004-05 15.3 24.1
2005-06 20.9 27.4
2006-07 21.1 29.5
2007-08 24.5 32.8
2008-09 24.8a 36.5
2009-10 (expected) 23.9 37.8
2010-11 (forecast) 32.8 41.1
Source: Public Expenditure Statistical Analyses, Annex D, able D1, HM reasury, 2010.
a This is slightly different from the £26bn gure quoted in Paragraph 4.14 as it does not include the police or reghters
pension schemes.
Standard contribution rates
.6 Standard contribution rates6 calculated through scheme valuations are used to setcurrent contribution rates and therefore what employers actually pay each year once employeecontributions are taken into account. When applied to the pensionable payroll, standardcontribution rates can measure the additional pension entitlements earned in each year.
. e fact that the amount actually paid by employers and employees often diers fromthe current service cost discussed above can cause confusion as both are designed to representthe cost of benets accruing over a certain period. For example, Table 4.D compares theamounts paid by employees and employers and the current service cost for the Teachers’Pension Scheme over recent years. Similar results can be shown for other schemes.
6 The current contribution rate actually used is the standard contribution rate adjusted for (notional) surpluses and decits
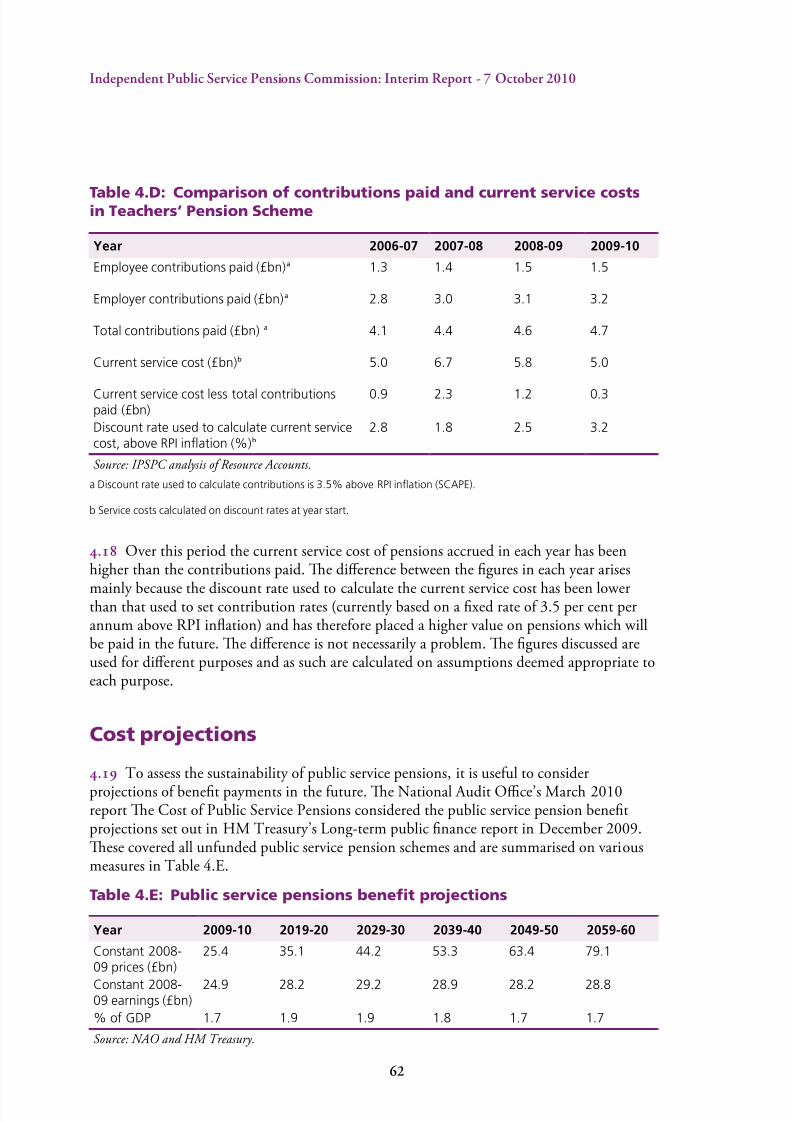
8/8/2019 Independent Public Service Pensions Commission: Interim Report
http://slidepdf.com/reader/full/independent-public-service-pensions-commission-interim-report 66/176
2
Indeendent Public Service Pensions Commission: Interim Reort - 7 October 2010
Table 4.D: Comparison of contributions paid and current service costsin Teachers’ Pension Scheme
Year 2006-07 2007-08 2008-09 2009-10
Employee contributions paid (£bn)a 1.3 1.4 1.5 1.5
Employer contributions paid (£bn)a 2.8 3.0 3.1 3.2
Total contributions paid (£bn) a 4.1 4.4 4.6 4.7
Current service cost (£bn)b 5.0 6.7 5.8 5.0
Current service cost less total contributionspaid (£bn)
0.9 2.3 1.2 0.3
Discount rate used to calculate current servicecost, above RPI ination (%)b
2.8 1.8 2.5 3.2
Source: IPSPC analysis of Resource Accounts.
a Discount rate used to calculate contributions is 3.5% above RPI ination (SCAPE).
b Service costs calculated on discount rates at year start.
.8 Over this period the current service cost of pensions accrued in each year has beenhigher than the contributions paid. e dierence between the gures in each year arises
mainly because the discount rate used to calculate the current service cost has been lowerthan that used to set contribution rates (currently based on a xed rate of 3.5 per cent perannum above RPI ination) and has therefore placed a higher value on pensions which willbe paid in the future. e dierence is not necessarily a problem. e gures discussed areused for dierent purposes and as such are calculated on assumptions deemed appropriate toeach purpose.
Cost projections
.9 To assess the sustainability of public service pensions, it is useful to considerprojections of benet payments in the future. e National Audit Oce’s March 2010report e Cost of Public Service Pensions considered the public service pension benetprojections set out in HM Treasury’s Long-term public nance report in December 2009.ese covered all unfunded public service pension schemes and are summarised on variousmeasures in Table 4.E.
Table 4.E: Public service pensions benet projections
Year 2009-10 2019-20 2029-30 2039-40 2049-50 2059-60
Constant 2008-09 prices (£bn)
25.4 35.1 44.2 53.3 63.4 79.1
Constant 2008-09 earnings (£bn)
24.9 28.2 29.2 28.9 28.2 28.8
% of GDP 1.7 1.9 1.9 1.8 1.7 1.7
Source: NAO and HM reasury.
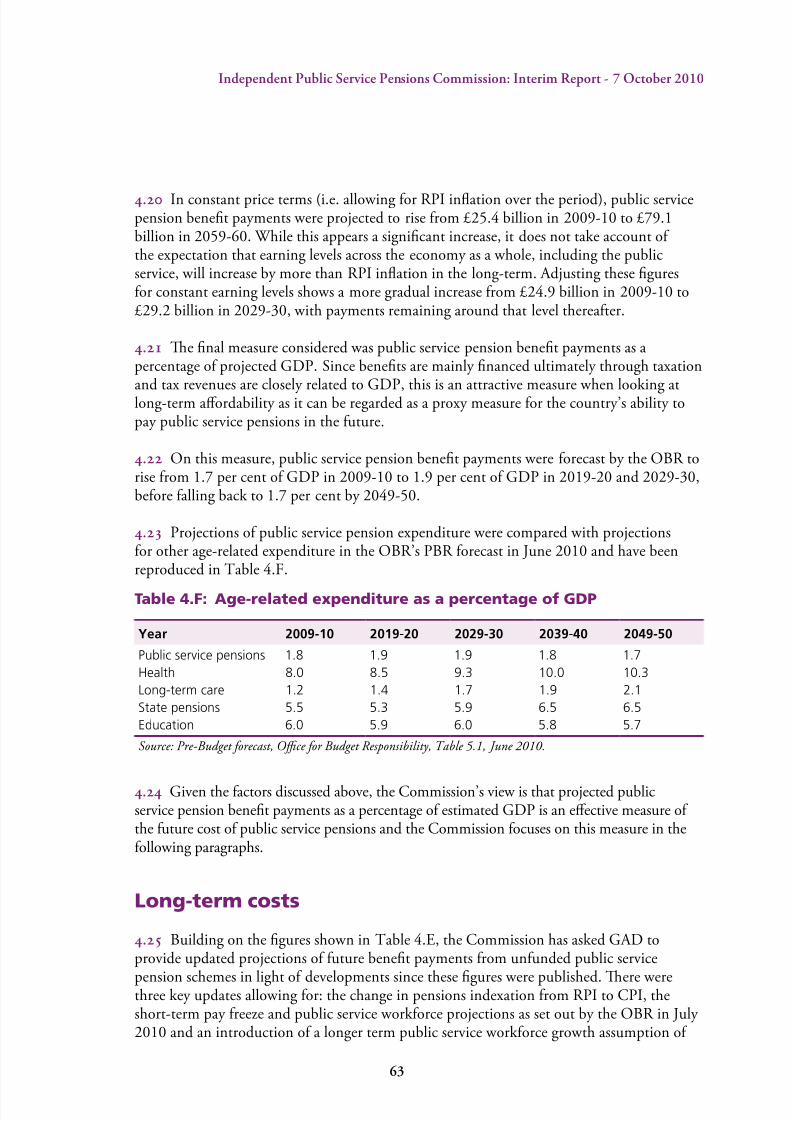
8/8/2019 Independent Public Service Pensions Commission: Interim Report
http://slidepdf.com/reader/full/independent-public-service-pensions-commission-interim-report 67/176
3
Indeendent Public Service Pensions Commission: Interim Reort - 7 October 2010
. In constant price terms (i.e. allowing for RPI ination over the period), public servicepension benet payments were projected to rise from £25.4 billion in 2009-10 to £79.1billion in 2059-60. While this appears a signicant increase, it does not take account of the expectation that earning levels across the economy as a whole, including the publicservice, will increase by more than RPI ination in the long-term. Adjusting these guresfor constant earning levels shows a more gradual increase from £24.9 billion in 2009-10 to£29.2 billion in 2029-30, with payments remaining around that level thereafter.
. e nal measure considered was public service pension benet payments as apercentage of projected GDP. Since benets are mainly nanced ultimately through taxation
and tax revenues are closely related to GDP, this is an attractive measure when looking atlong-term aordability as it can be regarded as a proxy measure for the country’s ability topay public service pensions in the future.
. On this measure, public service pension benet payments were forecast by the OBR torise from 1.7 per cent of GDP in 2009-10 to 1.9 per cent of GDP in 2019-20 and 2029-30,before falling back to 1.7 per cent by 2049-50.
. Projections of public service pension expenditure were compared with projectionsfor other age-related expenditure in the OBR’s PBR forecast in June 2010 and have beenreproduced in Table 4.F.
Table 4.F: Age-related expenditure as a percentage of GDP
Year 2009-10 2019-20 2029-30 2039-40 2049-50
Public service pensions 1.8 1.9 1.9 1.8 1.7
Health 8.0 8.5 9.3 10.0 10.3
Long-term care 1.2 1.4 1.7 1.9 2.1
State pensions 5.5 5.3 5.9 6.5 6.5
Education 6.0 5.9 6.0 5.8 5.7
Source: Pre-Budget forecast, Oce for Budget Responsibility, able 5.1, June 2010.
. Given the factors discussed above, the Commission’s view is that projected publicservice pension benet payments as a percentage of estimated GDP is an eective measure of the future cost of public service pensions and the Commission focuses on this measure in thefollowing paragraphs.
Long-term costs
. Building on the gures shown in Table 4.E, the Commission has asked GAD toprovide updated projections of future benet payments from unfunded public service
pension schemes in light of developments since these gures were published. ere werethree key updates allowing for: the change in pensions indexation from RPI to CPI, theshort-term pay freeze and public service workforce projections as set out by the OBR in July 2010 and an introduction of a longer term public service workforce growth assumption of
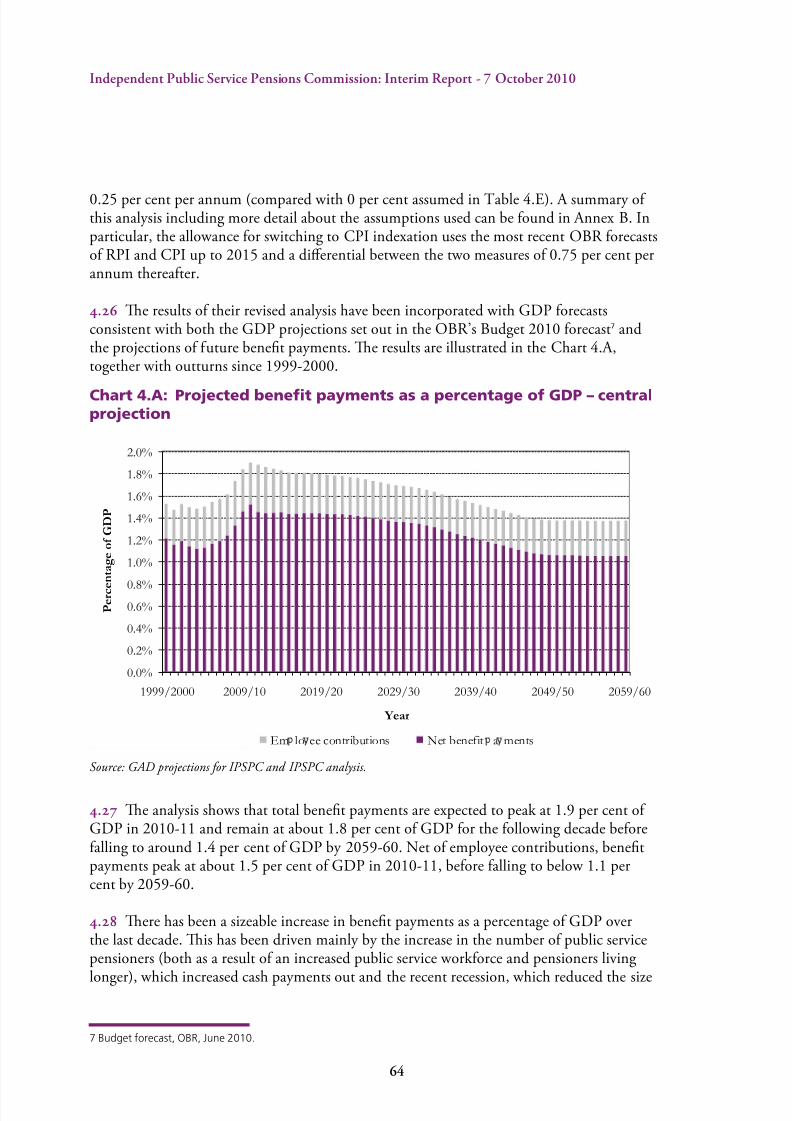
8/8/2019 Independent Public Service Pensions Commission: Interim Report
http://slidepdf.com/reader/full/independent-public-service-pensions-commission-interim-report 68/176
4
Indeendent Public Service Pensions Commission: Interim Reort - 7 October 2010
0.25 per cent per annum (compared with 0 per cent assumed in Table 4.E). A summary of this analysis including more detail about the assumptions used can be found in Annex B. Inparticular, the allowance for switching to CPI indexation uses the most recent OBR forecastsof RPI and CPI up to 2015 and a dierential between the two measures of 0.75 per cent perannum thereafter.
.6 e results of their revised analysis have been incorporated with GDP forecastsconsistent with both the GDP projections set out in the OBR’s Budget 2010 forecast7 andthe projections of future benet payments. e results are illustrated in the Chart 4.A,together with outturns since 1999-2000.
Chart 4.A: Projected benet payments as a percentage of GDP – centralprojection
Source: GAD projections for IPSPC and IPSPC analysis.
. e analysis shows that total benet payments are expected to peak at 1.9 per cent of GDP in 2010-11 and remain at about 1.8 per cent of GDP for the following decade beforefalling to around 1.4 per cent of GDP by 2059-60. Net of employee contributions, benetpayments peak at about 1.5 per cent of GDP in 2010-11, before falling to below 1.1 percent by 2059-60.
.8 ere has been a sizeable increase in benet payments as a percentage of GDP overthe last decade. is has been driven mainly by the increase in the number of public servicepensioners (both as a result of an increased public service workforce and pensioners living
longer), which increased cash payments out and the recent recession, which reduced the size
7 Budget forecast, OBR, June 2010.
0.0%
0.2%
0.4%
0.6%0.8%
1.0%
1.2%
1.4%
1.6%
1.8%
2.0%
1999/2000 2009/10 2019/20 2029/30 2039/40 2049/50 2059/60
P e r c e n t a g e o f G D P
Year
Em lo ee contributions Net benefit a ments
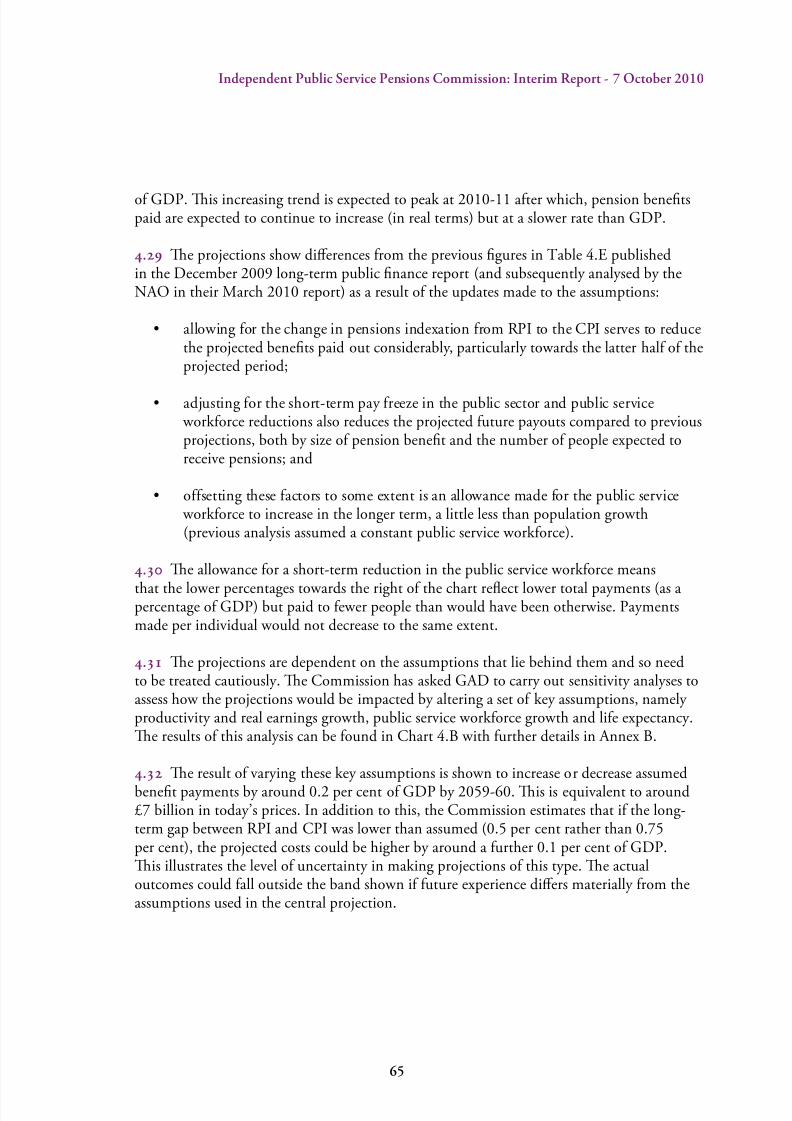
8/8/2019 Independent Public Service Pensions Commission: Interim Report
http://slidepdf.com/reader/full/independent-public-service-pensions-commission-interim-report 69/176
5
Indeendent Public Service Pensions Commission: Interim Reort - 7 October 2010
of GDP. is increasing trend is expected to peak at 2010-11 after which, pension benetspaid are expected to continue to increase (in real terms) but at a slower rate than GDP.
.9 e projections show dierences from the previous gures in Table 4.E publishedin the December 2009 long-term public nance report (and subsequently analysed by theNAO in their March 2010 report) as a result of the updates made to the assumptions:
• allowing or the change in pensions indexation rom RPI to the CPI serves to reducethe projected benefts paid out considerably, particularly towards the latter hal o theprojected period;
• adjusting or the short-term pay reeze in the public sector and public service workorce reductions also reduces the projected uture payouts compared to previousprojections, both by size o pension beneft and the number o people expected toreceive pensions; and
• osetting these actors to some extent is an allowance made or the public service workorce to increase in the longer term, a little less than population growth(previous analysis assumed a constant public service workorce).
. e allowance for a short-term reduction in the public service workforce means
that the lower percentages towards the right of the chart reect lower total payments (as apercentage of GDP) but paid to fewer people than would have been otherwise. Paymentsmade per individual would not decrease to the same extent.
. e projections are dependent on the assumptions that lie behind them and so needto be treated cautiously. e Commission has asked GAD to carry out sensitivity analyses toassess how the projections would be impacted by altering a set of key assumptions, namely productivity and real earnings growth, public service workforce growth and life expectancy.e results of this analysis can be found in Chart 4.B with further details in Annex B.
. e result of varying these key assumptions is shown to increase or decrease assumedbenet payments by around 0.2 per cent of GDP by 2059-60. is is equivalent to around£7 billion in today’s prices. In addition to this, the Commission estimates that if the long-term gap between RPI and CPI was lower than assumed (0.5 per cent rather than 0.75per cent), the projected costs could be higher by around a further 0.1 per cent of GDP.is illustrates the level of uncertainty in making projections of this type. e actualoutcomes could fall outside the band shown if future experience diers materially from theassumptions used in the central projection.
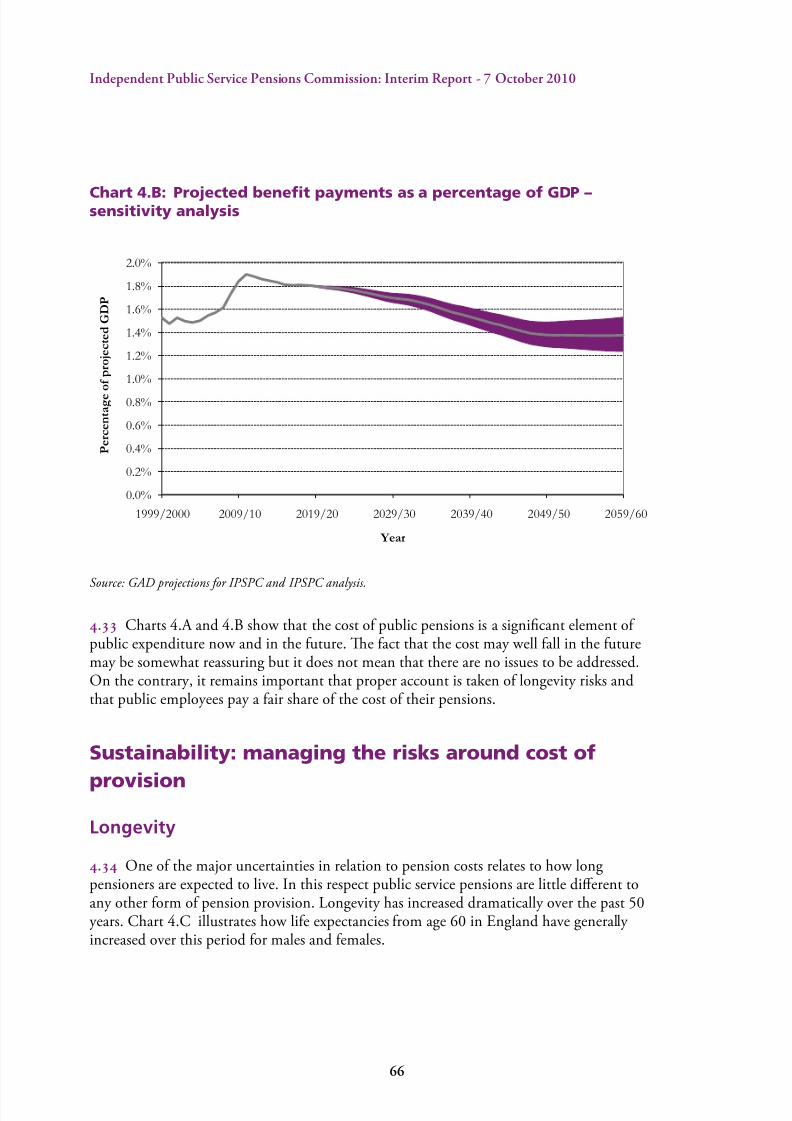
8/8/2019 Independent Public Service Pensions Commission: Interim Report
http://slidepdf.com/reader/full/independent-public-service-pensions-commission-interim-report 70/176
Indeendent Public Service Pensions Commission: Interim Reort - 7 October 2010
Chart 4.B: Projected benet payments as a percentage of GDP –sensitivity analysis
Source: GAD projections for IPSPC and IPSPC analysis.
. Charts 4.A and 4.B show that the cost of public pensions is a signicant element of public expenditure now and in the future. e fact that the cost may well fall in the futuremay be somewhat reassuring but it does not mean that there are no issues to be addressed.On the contrary, it remains important that proper account is taken of longevity risks andthat public employees pay a fair share of the cost of their pensions.
Sustainability: managing the risks around cost of
provision
Longevity
. One of the major uncertainties in relation to pension costs relates to how longpensioners are expected to live. In this respect public service pensions are little dierent toany other form of pension provision. Longevity has increased dramatically over the past 50years. Chart 4.C illustrates how life expectancies from age 60 in England have generally increased over this period for males and females.
0.0%
0.2%
0.4%
0.6%
0.8%
1.0%
1.2%
1.4%
1.6%
1.8%
2.0%
1999/2000 2009/10 2019/20 2029/30 2039/40 2049/50 2059/60
P e r c e n t a g e o f p r o j e c t e d G D P
Year
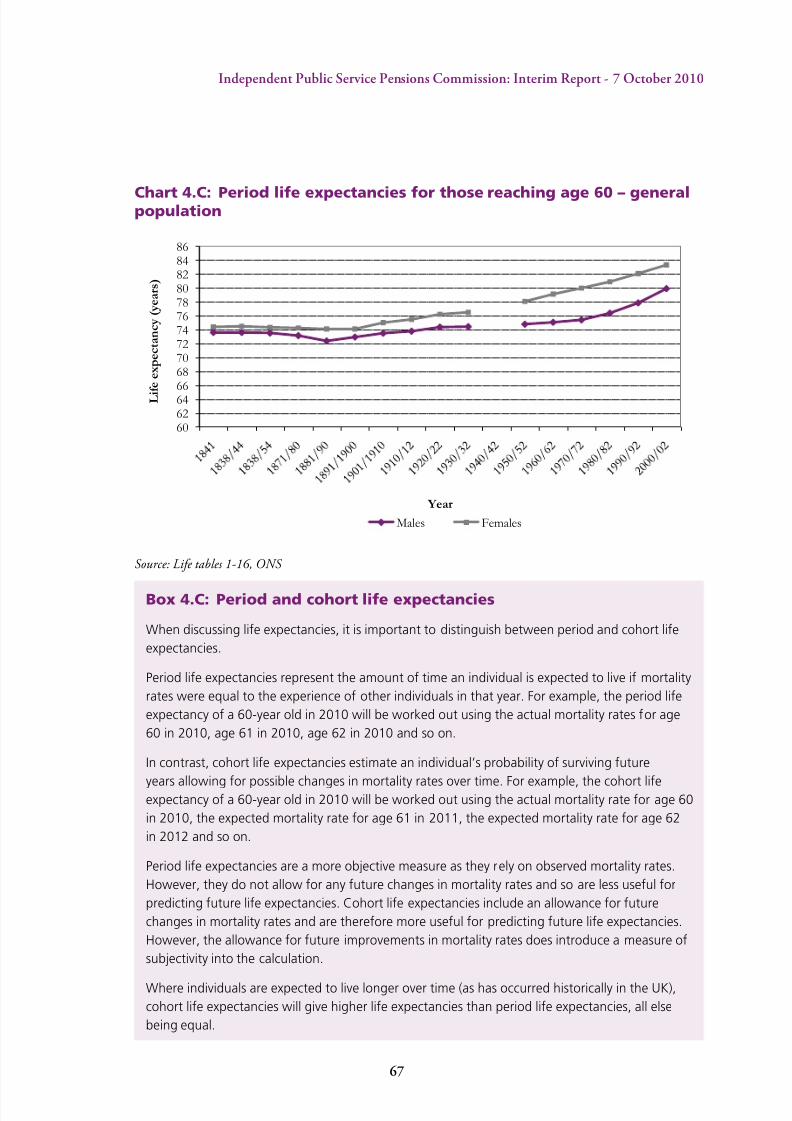
8/8/2019 Independent Public Service Pensions Commission: Interim Report
http://slidepdf.com/reader/full/independent-public-service-pensions-commission-interim-report 71/176
7
Indeendent Public Service Pensions Commission: Interim Reort - 7 October 2010
Chart 4.C: Period life expectancies for those reaching age 60 – generalpopulation
Source: Life tables 1-16, ONS
Box 4.C: Period and cohort life expectancies
When discussing life expectancies, it is important to distinguish between period and cohort life
expectancies.
Period life expectancies represent the amount of time an individual is expected to live if mortality
rates were equal to the experience of other individuals in that year. For example, the period life
expectancy of a 60-year old in 2010 will be worked out using the actual mortality rates for age
60 in 2010, age 61 in 2010, age 62 in 2010 and so on.
In contrast, cohort life expectancies estimate an individual’s probability of surviving future
years allowing for possible changes in mortality rates over time. For example, the cohort lifeexpectancy of a 60-year old in 2010 will be worked out using the actual mortality rate for age 60
in 2010, the expected mortality rate for age 61 in 2011, the expected mortality rate for age 62
in 2012 and so on.
Period life expectancies are a more objective measure as they rely on observed mortality rates.
However, they do not allow for any future changes in mortality rates and so are less useful for
predicting future life expectancies. Cohort life expectancies include an allowance for future
changes in mortality rates and are therefore more useful for predicting future life expectancies.
However, the allowance for future improvements in mortality rates does introduce a measure of
subjectivity into the calculation.
Where individuals are expected to live longer over time (as has occurred historically in the UK),
cohort life expectancies will give higher life expectancies than period life expectancies, all else
being equal.
60
62
64
66
68
70
72
74
76
78
80
82
84
86
L i f e e x p e c t a n c y ( y e a r s )
Year
Males Females
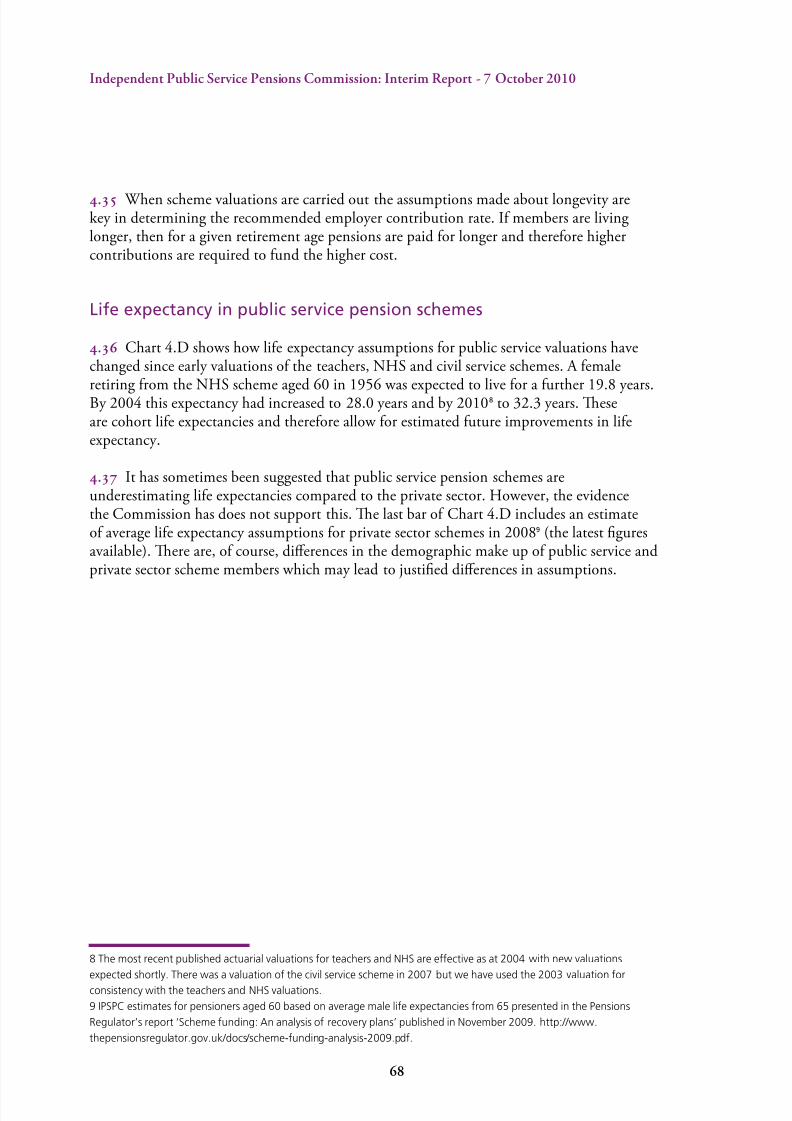
8/8/2019 Independent Public Service Pensions Commission: Interim Report
http://slidepdf.com/reader/full/independent-public-service-pensions-commission-interim-report 72/176
Indeendent Public Service Pensions Commission: Interim Reort - 7 October 2010
. When scheme valuations are carried out the assumptions made about longevity arekey in determining the recommended employer contribution rate. If members are livinglonger, then for a given retirement age pensions are paid for longer and therefore highercontributions are required to fund the higher cost.
Life expectancy in public service pension schemes
.6 Chart 4.D shows how life expectancy assumptions for public service valuations havechanged since early valuations of the teachers, NHS and civil service schemes. A female
retiring from the NHS scheme aged 60 in 1956 was expected to live for a further 19.8 years.By 2004 this expectancy had increased to 28.0 years and by 20108 to 32.3 years. eseare cohort life expectancies and therefore allow for estimated future improvements in lifeexpectancy.
. It has sometimes been suggested that public service pension schemes areunderestimating life expectancies compared to the private sector. However, the evidencethe Commission has does not support this. e last bar of Chart 4.D includes an estimateof average life expectancy assumptions for private sector schemes in 20089 (the latest guresavailable). ere are, of course, dierences in the demographic make up of public service andprivate sector scheme members which may lead to justied dierences in assumptions.
8 The most recent published actuarial valuations for teachers and NHS are effective as at 2004 with new valuations
expected shortly. There was a valuation of the civil service scheme in 2007 but we have used the 2003 valuation for
consistency with the teachers and NHS valuations.
9 IPSPC estimates for pensioners aged 60 based on average male life expectancies from 65 presented in the Pensions
Regulator’s report ‘Scheme funding: An analysis of recovery plans’ published in November 2009. http://www.
thepensionsregulator.gov.uk/docs/scheme-funding-analysis-2009.pdf.
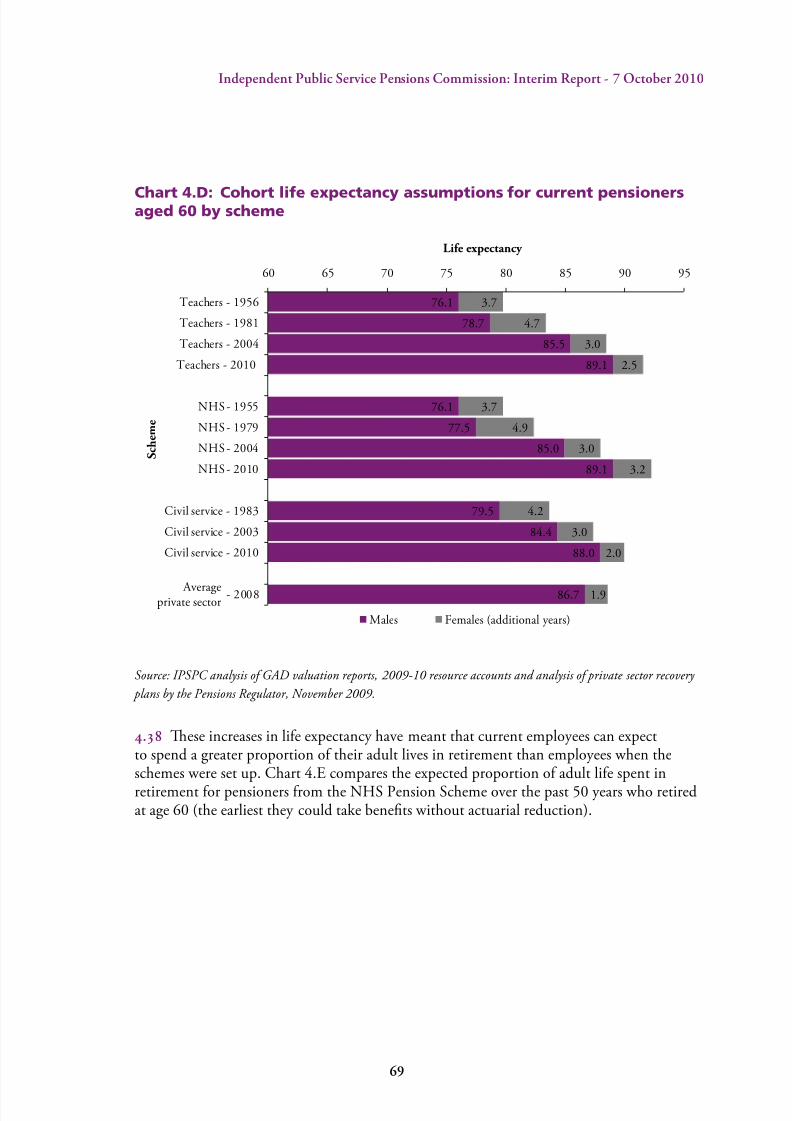
8/8/2019 Independent Public Service Pensions Commission: Interim Report
http://slidepdf.com/reader/full/independent-public-service-pensions-commission-interim-report 73/176
Indeendent Public Service Pensions Commission: Interim Reort - 7 October 2010
Chart 4.D: Cohort life expectancy assumptions for current pensionersaged 60 by scheme
Source: IPSPC analysis of GAD valuation reports, 2009-10 resource accounts and analysis of private sector recovery
plans by the Pensions Regulator, November 2009.
.8 ese increases in life expectancy have meant that current employees can expectto spend a greater proportion of their adult lives in retirement than employees when theschemes were set up. Chart 4.E compares the expected proportion of adult life spent inretirement for pensioners from the NHS Pension Scheme over the past 50 years who retiredat age 60 (the earliest they could take benets without actuarial reduction).
76.1
78.7
85.5
89.1
76.1
77.5
85.0
89.1
79.5
84.4
88.0
86.7
3.7
4.7
3.0
2.5
3.7
4.9
3.0
3.2
4.2
3.0
2.0
1.9
60 65 70 75 80 85 90 95
Teachers - 1956
Teachers - 1981
Teachers - 2004
Teachers - 2010
NHS - 1955
NHS - 1979
NHS - 2004
NHS - 2010
Civil service - 1983
Civil service - 2003
Civil service - 2010
Averageprivate sector
- 2008
Life expectancy
S c h e m e
Males Females (additional years)
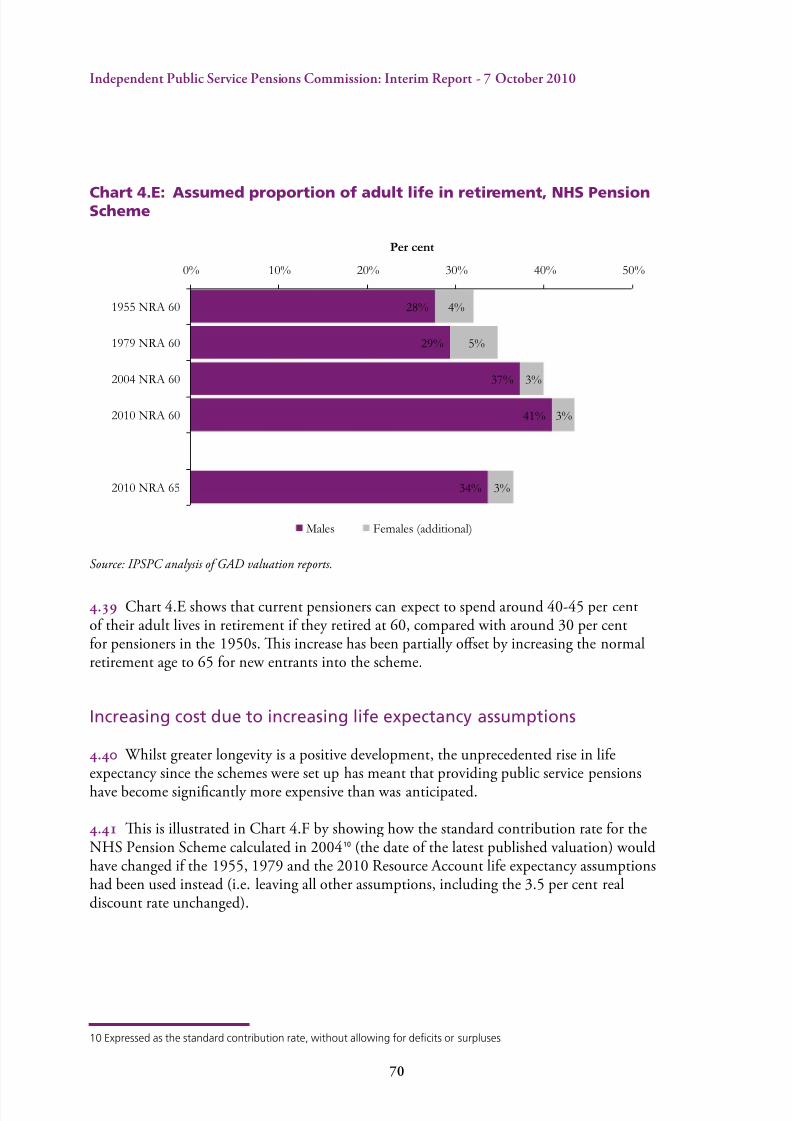
8/8/2019 Independent Public Service Pensions Commission: Interim Report
http://slidepdf.com/reader/full/independent-public-service-pensions-commission-interim-report 74/176
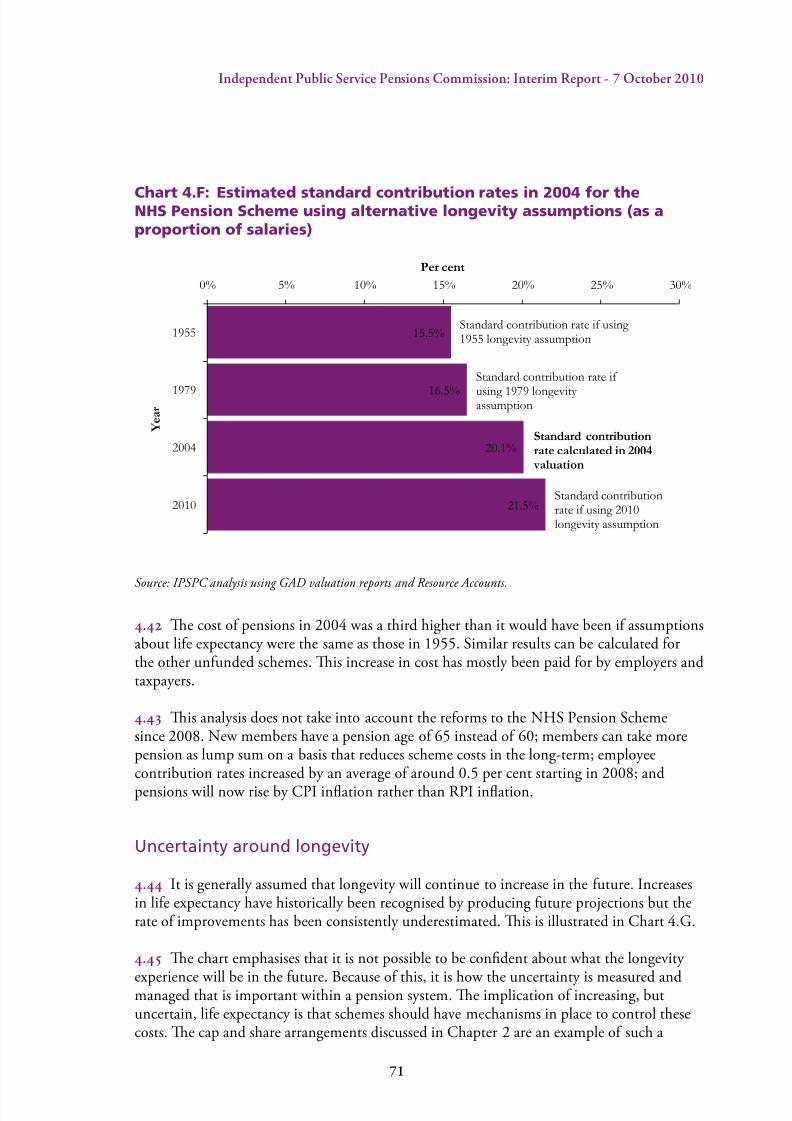
8/8/2019 Independent Public Service Pensions Commission: Interim Report
http://slidepdf.com/reader/full/independent-public-service-pensions-commission-interim-report 75/176
71
Indeendent Public Service Pensions Commission: Interim Reort - 7 October 2010
Chart 4.F: Estimated standard contribution rates in 2004 for theNHS Pension Scheme using alternative longevity assumptions (as aproportion of salaries)
Source: IPSPC analysis using GAD valuation reports and Resource Accounts.
. e cost of pensions in 2004 was a third higher than it would have been if assumptionsabout life expectancy were the same as those in 1955. Similar results can be calculated forthe other unfunded schemes. is increase in cost has mostly been paid for by employers andtaxpayers.
. is analysis does not take into account the reforms to the NHS Pension Schemesince 2008. New members have a pension age of 65 instead of 60; members can take morepension as lump sum on a basis that reduces scheme costs in the long-term; employeecontribution rates increased by an average of around 0.5 per cent starting in 2008; andpensions will now rise by CPI ination rather than RPI ination.
Uncertainty around longevity
. It is generally assumed that longevity will continue to increase in the future. Increasesin life expectancy have historically been recognised by producing future projections but therate of improvements has been consistently underestimated. is is illustrated in Chart 4.G.
. e chart emphasises that it is not possible to be condent about what the longevity
experience will be in the future. Because of this, it is how the uncertainty is measured andmanaged that is important within a pension system. e implication of increasing, butuncertain, life expectancy is that schemes should have mechanisms in place to control thesecosts. e cap and share arrangements discussed in Chapter 2 are an example of such a
15.5%
16.5%
20.1%
21.5%
0% 5% 10% 15% 20% 25% 30%
1955
1979
2004
2010
Per cent
Y e a r
Standard contribution
rate calculated in 2004
valuation
Standard contribution rate if
using 1979 longevity assumption
Standard contributionrate if using 2010longevity assumption
Standard contribution rate if using 1955 longevity assumption
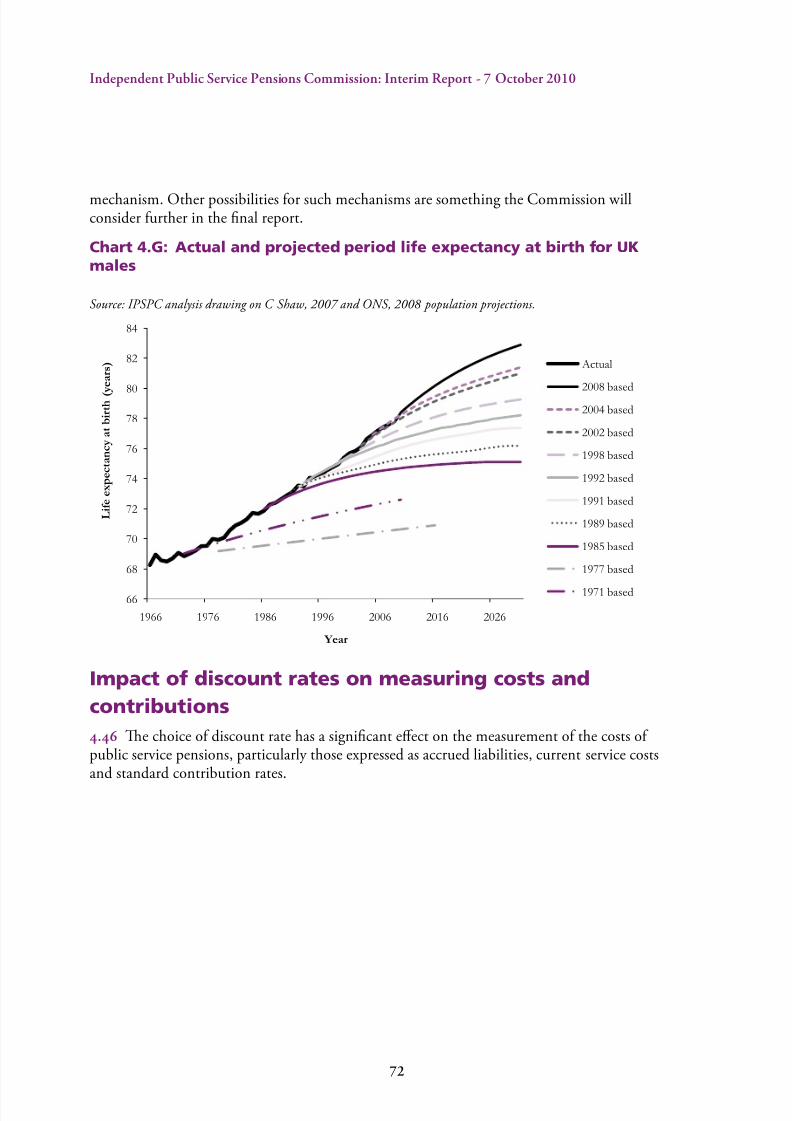
8/8/2019 Independent Public Service Pensions Commission: Interim Report
http://slidepdf.com/reader/full/independent-public-service-pensions-commission-interim-report 76/176
72
Indeendent Public Service Pensions Commission: Interim Reort - 7 October 2010
mechanism. Other possibilities for such mechanisms are something the Commission willconsider further in the nal report.
Chart 4.G: Actual and projected period life expectancy at birth for UKmales
Source: IPSPC analysis drawing on C Shaw, 2007 and ONS, 2008 population projections.
Impact of discount rates on measuring costs and
contributions
.6 e choice of discount rate has a signicant eect on the measurement of the costs of public service pensions, particularly those expressed as accrued liabilities, current service costsand standard contribution rates.
66
68
70
72
74
76
78
80
82
84
1966 1976 1986 1996 2006 2016 2026
L i f e e x p e c t a n c y a t b i r t h
Year
Actual
2008 based
2004 based
2002 based
1998 based
1992 based
1991 based
1989 based
1985 based
1977 based
1971 based
( y e a r s )
8/8/2019 Independent Public Service Pensions Commission: Interim Report
http://slidepdf.com/reader/full/independent-public-service-pensions-commission-interim-report 77/176
73
Indeendent Public Service Pensions Commission: Interim Reort - 7 October 2010
Box 4.D: What is a discount rate?
Pensions are long-term commitments. An employee joining a public service pension scheme at
age 25 will probably receive pension payments between 40 and 70 years in the future.
One method used to understand the cost of pension promises made to date is to calculate the
present value of expected pension payments in the future using an appropriate discount rate.
To explain discount rates in more detail, let us assume that a company promises an individual a
payment of £100 in 10 years’ time. What is the cost of that promise now to the company?
The cost to the company could be considered to be the amount of money needed now in order
to pay £100 to this individual in 10 year’s time.
Let us assume that the company decides that it will invest in government bonds and it expects
that these will give a return of 4 per centa per year. The cost to the company of providing £100
in 10 year’s time is therefore:
£100 ÷ 1.0410 = £67.56
Effectively, the ‘discount rate’ used is 4 per cent, which is equal to the expected return on
government bonds.
Alternatively, the company may decide to invest in equities, where it expects a return of 8 per
centb
per year. The cost of the company of providing £100 in 10 years’ time (using a discountrate of 8 per cent) will then be:
£100 ÷ 1.0810 = £46.32
So it may appear as though the company should invest in equities. This isn’t necessarily the case,
because equities are more risky than government bonds and so if the company invests in equities
there is an increased chance that the £46.32 they invest now may be less than £100 in 10 years
time and they may need to make up the difference.
The concept of a discount rate becomes more difcult with unfunded public service pensions as
there are no assets to back the pension promises.
A nal point to note is that the individual may put an entirely different value on the £100 which
may reect how much they value money now rather than later, how much they think £100 will
buy in 10 years and how certain they think they are to get the £100. The Commission has not
attempted to quantify this in any analysis.
a 4 per cent nominal, so not adjusted for prices.
b 8 per cent nominal, so not adjusted for prices.
8/8/2019 Independent Public Service Pensions Commission: Interim Report
http://slidepdf.com/reader/full/independent-public-service-pensions-commission-interim-report 78/176
74
Indeendent Public Service Pensions Commission: Interim Reort - 7 October 2010
. e appropriate discount rate to use is dependent on what the resulting calculations will be used for. Within public service pensions, the Government uses discount rates fortwo main purposes: nancial reporting (in Resource Accounts, which are annual accountingstatements constructed in a similar manner to those of private sector companies) and settingemployer contribution rates (through actuarial valuations carried out every 3 to 4 years).
.8 Resource Accounting uses a discount rate based on AA corporate bond yields, broadly in line with the private sector. is chapter has noted the volatility in cost calculations thatresult from using AA corporate bond yields as a discount rate and the limitations of theresulting gures, but also that it aids comparability with the private sector. e Commission
has no further comment on this at this time.
.9 However, the Commission considers that getting the discount rate right in settingcontribution rates is key to assessing the cost of benets being provided in each of theschemes, ensuring those costs are properly allowed for in workforce planning and budgetingand enabling those costs to be appropriately divided between employer and employee andfacilitating proper comparisons between remuneration in the public and private sectors
. Actuarial valuations assess the cost of benets being earned in the schemes by calculating the standard contribution rate. ey also assess the overall current contributionrate that should be paid after taking account of any notional surpluses and decits from
under or over estimates of costs at previous valuations and set the scene for determining how the overall rate should be allocated between employer and employee.
The current discount rate
. e rate used for actuarial valuations of unfunded schemes was set at a xed level of 3.5 per cent above RPI ination in the late 1990s and has not changed since. e rate wasdesigned to be a stable, notional rate that is not referenced to a specic set of investments.
When it was set at 3.5 per cent this was in line with the Government’s ‘social timepreference rate’ (see Box 4.E) and a view taken at the time on what the very long-term costof Government borrowing might be.
. Using this discount rate reects the unfunded nature of public service pension schemesby treating the schemes as inter-temporal transfers within the public sector, in line withother public investment projects. is approach has been questioned in two ways: rstly,if the time-preference approach is considered appropriate, whether 3.5 per cent is the rightrate to use for public service pensions; and, secondly, whether a time-preference approach isappropriate at all.
8/8/2019 Independent Public Service Pensions Commission: Interim Report
http://slidepdf.com/reader/full/independent-public-service-pensions-commission-interim-report 79/176
75
Indeendent Public Service Pensions Commission: Interim Reort - 7 October 2010
Box 4.E: Social Time Preference Rate
The Social Time Preference Rate (STPR) is set out in The Green Book, HM Treasury’s guidance for
the appraisal and evaluation of Government policies, programmes and projects. It is dened as
the value society places on current consumption as opposed to future consumption.
The rate, r, is made up of 2 components:
1) The rate at which individuals discount future consumption over present consumption,
assuming no change in per capita consumption is expected
This is represented by δ + L where:
δ: Pure time preference (reecting preference for consumption now rather than later with the
same level of resources available)
L: Catastrophe risk (the likelihood that all returns from projects will be radically and
unpredictably altered)
2) If per capita consumption is expected to grow over time, an element reecting the fact that
future consumption will be plentiful relative to the current position and therefore have lower
marginal utility
This is represented by g * μ where
g: Growth in per capita consumption
m: The elasticity of marginal utility of consumption
The current rate is calculated using d = 0.5 per cent, L = 1.0 per cent, g = 2 per cent and m = 1.
i.e. r = 0.5 per cent + 1.0 per cent + 2.0 per cent * 1 = 3.5 per cent
Source and further information: Te Green Book, HM reasury..
An appropriate social time preference rate for public service
pensions. It may be appropriate to use a social time preference rate on the basis that it representsthe alternative use of funding that is used to pay for public service pensions. It also has thebenet of being stable over time. However, the elements that make up 3.5 per cent may notbe appropriate for public service pensions. For example, if equal consideration is given todierent generations, then one might argue the pure time preference should be set at zero.Similarly, it is debatable if the concept of catastrophe risk can be applied to public servicepensions in the same way as it is used to value public investment projects.
8/8/2019 Independent Public Service Pensions Commission: Interim Report
http://slidepdf.com/reader/full/independent-public-service-pensions-commission-interim-report 80/176
7
Indeendent Public Service Pensions Commission: Interim Reort - 7 October 2010
. As an example, adjustments to the social time preference rate were made in LordStern’s Review 11 on the Economics of climate change to reect the specic nature of thatanalysis.
. In addition, the discount rate could potentially be adjusted to allow for the long-termnature of pension liabilities. e Green Book states that where appraisals are materially dependent on discounting eects, a lower discount rate could be used for the longer term:3.5 per cent is given for the period of 0-30 years, with 3.0 per cent for 31-75 years.
A different approach to the discount rate.6 Alternative suggestions for an appropriate discount rate have been made. eCommission consider three options here:
• an approach consistent with private sector and local government unding;
• a rate based on the yields on government bonds; and
• a rate in line with expected GDP growth.
Private sector and local government funding
. Private sector funding is prescribed by Scheme Funding legislation. e approach tosetting discount rates generally considers the strength of the employer covenant,12 the assetsheld by the scheme to fund the liabilities and the market yield on government bonds. Similarregulations control the funding valuations of Local Government Pension Schemes. Of course, unfunded schemes do not hold assets. However, it could be argued that a consistentapproach would be to consider a private employer of the strongest covenant or a LocalGovernment employer. Using the most recent data published by the Pensions Regulator13 and analysis of the 31 March 2007 English LGPS valuations, the Commission estimates thiscould be in the region of 2.5 to 3.0 per cent above RPI ination.
11 Stern Review on the Economics of Climate Change. Pure time preference was set at 0 per cent, catastrophe risk at 0.1
per cent, growth in per capita world production at 1.3 per cent and elasticity of marginal utility of consumption at 1. The
rate used was therefore 1.4 per cent.
12 The ability and willingness of the employer to support the pension scheme in the long-term.
13 http://www.thepensionsregulator.gov.uk/docs/scheme-funding-analysis-2009.pdf, Table 4.1 and Figure 4.1. These
show that between September 2005 and September 2008 (the latest data available), average discount rates used by all
private sector schemes for Scheme Funding purposes were between 2 per cent and 2.5 per cent above RPI ination, with
a range of around 1.5 per cent. Given that the Scheme Funding legislation allows schemes with a stronger sponsoring
employer to use higher discount rates (as they are more likely to be able to fund any decit that arises if investments do
not perform at this level), it appears reasonable to assume that the average discount rate currently being used by private
sector schemes sponsored by a employer with a strong covenant is likely to be in the region of 2.5 per cent to 3 per cent
above RPI ination.
8/8/2019 Independent Public Service Pensions Commission: Interim Report
http://slidepdf.com/reader/full/independent-public-service-pensions-commission-interim-report 81/176
77
Indeendent Public Service Pensions Commission: Interim Reort - 7 October 2010
Government bond yields
.8 Some evidence received by the Commission argued that as pension contributions arebeing used to nance current government spending, pension liabilities should be discountedat the market rate of Government borrowing, for example the current yield on index-linkedgilts, which has recently been around 0.8 per cent above RPI ination.
.9 ere have been various criticisms of this method, including:
• it is not practical or the Government to set contribution rates using a market rate
which uctuates so much rom day-to-day, since this would produce signifcant andartifcial changes in the size o contributions required;
• current low index-linked gilt yields may reect an undersupply o such bonds in themarket, which drives yields artifcially low as the price o such bonds increases;
• the price (and thereore yield) placed on gilts by the market tells us the value o thesebonds to the private sector. The Government is not a buyer o gilts but a monopoly seller. The Government should expect the price o index-linked gilts to all as morebonds are issued, which will increase the yield and the cost to the Government o uture borrowing; and
• building on the arguments above, i the Government were to issue index-linked giltsto the value o the accrued liability o ununded public service pension schemes, itis likely that the yield on index-linked gilts would rise signifcantly rom its currentlevel.
Expected GDP growth
.6 e argument for a discount rate in line with GDP growth centres on the idea thatpensions from unfunded schemes will be paid for out of future tax revenue by futuretaxpayers and so pensions should be valued by discounting at the rate at which tax revenue isexpected to grow. Over the long term, tax revenues could be expected to rise broadly in line
with GDP and so a reasonable proxy to the growth in tax revenues could be the expectedlong-term future rate of GDP growth. A discount rate based on this approach may bearound 2 to 2.5 per cent above RPI ination, based on recent forecasts.
Impact of changing the discount rate on contribution levels
.6 Contribution rates are very sensitive to the choice of discount rate. Keeping all other
assumptions unchanged, a lower discount rate results in higher contribution rates and viceversa. e Commission estimates that for unfunded schemes as a whole, the eect of reducingthe discount rate by 0.5 per cent per annum could increase the calculated total contributionrequired by an average of about 3 per cent of pay or £3 billion to £4 billion a year.
8/8/2019 Independent Public Service Pensions Commission: Interim Report
http://slidepdf.com/reader/full/independent-public-service-pensions-commission-interim-report 82/176
7
Indeendent Public Service Pensions Commission: Interim Reort - 7 October 2010
.6 Any increase in contributions resulting from this change would need to be fairly distributed between employees and employers (representing the taxpayers’ contribution).
.6 A change in discount rate would also aect the value placed on liabilities relating topast service as well as future service. If a change was made, Government would need toconsider how best to deal with a past decit in a manner that was fair and reasonable.
Discount rates: conclusion
.6 Assessing the cost of any dened benet (DB) pension scheme depends on numerousassumptions and cannot be calculated with any certainty. However, an estimate of thecost of providing for pensions must be calculated in order that the Government and bothpublic service employers and employees are aware of the cost of benets being accrued andcontributions can be set appropriately. e right discount rate is key to this.
.6 e Commission therefore recommend that the Government review the use of thecurrent rate of 3.5 per cent above RPI ination, in the context of actuarial valuations used toset employer contribution rates, preferably concluding in time to inform the Commission’snal report.
.66 is review should also consider whether future discount rates should be expressed interms of CPI ination rather than RPI ination for consistency with how benets will beincreased in payment or consider a nominal rate.
The funding basis for public service pension schemes
.6 Currently most public service pension schemes are unfunded. ere has been criticismof this, for example because of concerns that:
• the accrued pension liability is very large and has been growing signifcantly overtime, even i the actual year-on-year liability totals uctuate up and down;
• uture taxpayers and public fnances might be better protected i monies werespecifcally set aside and invested to meet these uture payments;
• i the Government had invested more signifcantly in the UK through pension undsthis might have increased UK capital stocks and productivity; and
• lack o transparency about the division o the real cost o pensions between employer,employee and the uture taxpayer is unhelpul.
.68 However, the Commission considers that the size of the liabilities should notdetermine the funding structure. e UK government is unlike private sector organisationsin that the State is permanent and has the power to tax to meet long-term liabilities, so
8/8/2019 Independent Public Service Pensions Commission: Interim Report
http://slidepdf.com/reader/full/independent-public-service-pensions-commission-interim-report 83/176
7
Indeendent Public Service Pensions Commission: Interim Reort - 7 October 2010
funding is not required to safeguard its pension promises. Also, the benets represented by the total accrued liability will be paid out gradually over the 21st century.
.69 ere are some scal management issues relating to unfunded schemes thatgovernment needs to handle carefully. For example, if pensioners were to become sucha large proportion of the overall population that taxpayers could not support the level of spending on their pensions. But such demographic challenges and related annuity risksalso impact on funded schemes, for example through the increasing proportion of nationalincome that would need to be allocated through the funds to pensioners and the impact of the build up and run down of those funds on asset prices and consumption.
. It is also doubtful whether increasing government taxation and borrowing to investmonies in pension funds would lead to higher economic growth. Government might haveincreased its contribution to savings within the UK when a pension scheme was in the initial“accumulation” phase, when numbers of members in employment greatly exceeded thenumber of pensioners. But scheme members and taxpayers would be paying for that savingand might have reduced voluntary savings elsewhere. When the government funded scheme
was mature, as many of the public service pension schemes are, it would be a net drawer onsavings not a net saver.
. It is worth bearing in mind that if it were really regarded as good for national
economic growth for the Government to tax and borrow much more in order to invest forthe long-term, rather than leaving monies and investment decisions with businesses andindividuals, such logic could be extended beyond public service pensions to State benetsand services in general.
. Keeping schemes unfunded also has the advantages of avoiding:
• the signifcant investment management costs, which vary by class o asset but can beequivalent or active und management to anything rom 0.2 per cent o the value o the assets being managed each year to 1 per cent or more;
• the signifcant risks involved in investing, whether in the UK or overseas;
• government in one guise or another controlling up to a trillion pounds or more o fnancial assets;14 and
• the risk o placing the unds in the hands o trustees, in a situation in whichtaxpayers would be exposed to the investment risk but those investing would know that, in an emergency, Government might be compelled to underwrite the unds.15
14 The most recent Government estimate of unfunded scheme accrued liabilities was £770 billion as at March 2008, as
set out in the 2009 Long-term public nance report, published by H M Treasury.
15 It is sometimes suggested that special government stocks might be issued that would be held only by public service
pension schemes but that would involve setting a non-market interest rate and add extra administrative costs to existing
arrangements for valuing schemes and charging contributions.
8/8/2019 Independent Public Service Pensions Commission: Interim Report
http://slidepdf.com/reader/full/independent-public-service-pensions-commission-interim-report 84/176
0
Indeendent Public Service Pensions Commission: Interim Reort - 7 October 2010
. Any change to funded from unfunded status would also involve signicant transitioncosts. e contributions in respect of current employees that are used at present to helpnance pensions in payment would have to be diverted to the new pension funds. oseunfunded pensions in payment would then have to be nanced through extra governmentborrowing or taxation. at could cost £20 billion or more a year16 for many years and thecost would only decline very gradually over the 21st century. at extra nancing cost makesit very dicult, particularly at a time of scal consolidation, to move unfunded pensions onto a funded basis.
. Given these issues the Commission believes that it is reasonable, on balance, for
Government to structure their public service pension provision on a mainly unfunded basis.
. However, the Final Report will consider whether there is a case in some areas for apartially funded model, for example to diversify provision and spread risk.
The Local Government Pension Scheme
.6 As discussed in Chapter 1, the Local Government Pension Scheme (LGPS) is ina dierent position to the other very large public service pension schemes in that it is afunded scheme. Employers and employees pay their contributions into a fund and these
contributions are invested in assets that produce investment returns. Current pensions arepaid from the fund.
. However, the LGPS is not subject to the same regulation as funded DB schemes inthe private sector. e LGPS is not trust-based, decisions regarding fund governance andemployer contribution rates are instead made by the administering authority of each LGPSfund. In addition, it is not subject to the same funding and regulatory requirements thatapply to most funded schemes.
Measuring the cost of the LGPS
.8 In common with unfunded public service pension schemes, there are a number of measures that can be used to measure the cost of the LGPS. Due to the availability of data,in particular that contained in the Audit Commission’s July 2010 information paper ‘Localgovernment pensions in England’,17 the Commission focuses its analysis in this section onthe 79 English LGPS funds. e Commission will consider data from all LGPS funds in theUK in reaching conclusions in its nal report.
16 Based on total expected contribution to the central government unfunded schemes in 2010-11 of £21.2 billion
(Table D1 of Public Expenditure Statistical Analysis 2010 by HM Treasury in July 2010). Contributions for police and
reghters are paid in addition.
17 www.audit-commission.gov.uk/localgov/nationalstudies/localgovpensions/Pages/Default_copy.aspx
8/8/2019 Independent Public Service Pensions Commission: Interim Report
http://slidepdf.com/reader/full/independent-public-service-pensions-commission-interim-report 85/176
1
Indeendent Public Service Pensions Commission: Interim Reort - 7 October 2010
.9 In contrast to the unfunded public service pension schemes, cash ow (contributionsreceived less benets paid) is currently positive in the LGPS. In 2008-09, contributions fromemployers and employees for all English LGPS schemes totalled £7.3 billion, with benetspayable of £5.6 billion, a positive cash ow of £1.7 billion.18 As funds mature and pensionersincrease relative to employees, cash ow will likely turn negative, as for the unfunded publicservice pension schemes. e Audit Commission estimates that assuming workforce numbersstay at 2010 levels, cash ow will turn negative in 2025, or in 2016 assuming a 15 per centper cent workforce reduction over the next 5 years.19
.8 Individual employers participating in the LGPS produce accrued liability and current
service cost estimates for inclusion in their accounts each year, broadly in line with privatesector practice. Due to the number of employers participating in the LGPS and the fact thatmany of them do not share the same accounting date, it is dicult to construct an aggregateaccrued liability or current service cost gure across the LGPS. In addition, many of theseemployers are private sector companies participating as admitted bodies in the LGPS and sothese gures would overstate the public service accrued liability or current service cost.
.8 Standard and current contribution rates are set through fund valuations carried outevery 3 years. e latest completed English LGPS valuations were carried out at 31 March2007. Current contribution rates for employers (net of employee contributions) range from14 to 25 per cent of pay,20 with an average of around 18 per cent of pay. On average, these
current contribution rates include 5 per cent of pay to restore funding levels to 100 per centover a period of 10-30 years from 31 March 2007.21
.8 In July 2010, the Audit Commission estimated that the aggregate funding level acrossthe English LGPS funds had fallen to around 72 per cent at 31 March 2010 compared to 84per cent at 31 March 2007.22
.8 is 12 per cent fall was mainly due to poorer than anticipated investment returns.Funds had anticipated investment returns on assets of on average around 6 per cent per yearfrom 31 March 2007 to 31 March 2010, but actual returns over that period were estimatedat 1.4 per cent per year.23
.8 e fall in funding levels would have been greater but for the change in pensionsindexation from RPI to CPI ination, which the Audit Commission estimates increasedfunding levels at 31 March 2010 by 6 per cent.24
18 Ibid, page 19.
19 Ibid, page 19 and Figure B1 in page 9 of Technical appendices. Note these gures refer to the median cash ow of
English LGPS funds in the given years, and the results for individual funds will vary.
20 There is one fund with a high contribution rate, but as a result of a deliberate choice to recover its decit over a shorter
period than other funds.
21 Ibid, pages 3 and Table 5 on page 23.
22 Ibid, page 20.
23 Ibid, page 20.
24 Ibid, page 23
8/8/2019 Independent Public Service Pensions Commission: Interim Report
http://slidepdf.com/reader/full/independent-public-service-pensions-commission-interim-report 86/176
2
Indeendent Public Service Pensions Commission: Interim Reort - 7 October 2010
.8 On average, the Audit Commission expects this fall in funding levels at31 March 2010 would lead to a further 5 per cent increase in employer contributions, if the increased decit were paid over 20 years and employee contribution rates remainedunchanged.25 In practice, this analysis needs to be considered alongside the currentrequirements26 for LGPS funds to have regard to stability when setting employercontribution rates.
Longevity in the LGPS
.86 e LGPS is facing similar underlying pressures as unfunded schemes, such assignicant increases in longevity in recent decades. e Audit Commission noted thatbetween 1993 and 2008 male LGPS pensioners in England lived an extra 3.4 years andfemale pensioners an extra 2.2 years27 which represent a signicant increase in pension costsover the period. Most of this improvement has so far been borne by employers and taxpayersand would not be shared under cap and share, particularly given that the LGPS baselinemight be set in relation to scheme costs in 2010 or later.
Discount rates in the LGPS
.8 In calculating employer contribution rates, LGPS funds take account of the expectedreturn on their investments in setting discount rates, rather than using the unfundedschemes’ discount rate of 3.5 per cent above RPI ination.
.88 At 31 March 2007, discount rates above RPI ination for individual LGPS fundsranged from 2 per cent to 4.35 per cent per annum, with an average of around 3 per cent perannum,28 broadly in line with discount rates adopted for contribution-setting purposes forprivate sector schemes with a strong employer covenant.29
.89 e range of discount rates is also reected in other assumptions, which are all seton an individual fund basis, including life expectancy assumptions and the period over
which any decit arising is repaid. e Audit Commission estimated that standardisingthese assumptions across all funds would have aected funding and employer contributionlevels at 31 March 2007 by up to 15 percentage points in each direction.30 In practice, thereare reasons why some variation in assumptions may be expected between funds to reectdierent investment strategies, member age proles and life expectancy variances across thecountry.
25 Ibid, page 23
26 In LGPS administration regulations.
27 http://www.audit-commission.gov.uk/localgov/nationalstudies/localgovpensions/Pages/Default_copy.asp, page 34 of
Technical appendices
28 Ibid, page 16 of Technical appendices
29 See paragraph 4.56
30 http://www.audit-commission.gov.uk/localgov/nationalstudies/localgovpensions/Pages/Default_copy.asp, page 21
and 22
8/8/2019 Independent Public Service Pensions Commission: Interim Report
http://slidepdf.com/reader/full/independent-public-service-pensions-commission-interim-report 87/176
3
Indeendent Public Service Pensions Commission: Interim Reort - 7 October 2010
.9 Future employee contribution rates will be set under LGPS cap and share provisionsusing a notional (model) fund valuation as discussed in Chapter 2. e model fund willuse a discount rate of 3.5 per cent above RPI ination in line with unfunded public servicepension schemes.
The funding basis for the LGPS
.9 As discussed above, one of the main reasons for falling funding levels within the LGPSin recent years is poorer than anticipated investment returns. One option for dealing with
this risk in the current scheme would be to move away from holding funds to a completely unfunded model. is would remove investment return volatility and release cash in theshort-term, in eect treating the present arrangements as a form of cash reserve that was now to be drawn down in full.
.9 However, this might reduce employers’ and funds’ ability to adjust recovery periodsand other assumptions, in order to limit immediate LGPS valuation pressures on employercontribution rates and Council Tax. Also, if such relaxation of funding requirements wereapplied to private sector admitted bodies such as contractors and charities and other non-prot making organisations, of which there may be several thousand in the LGPS, it wouldbe equivalent to providing a new Government subsidy for the DB pensions of these private
sector employers with the Government having limited control over the risk. It would alsocontrast with the regulatory requirements placed on other private sector employers who wereoering DB schemes to employees.
Conclusion
.9 e Commission therefore believes that the current LGPS should continue on afunded basis.
.9 However, reviewing the LGPS’s funding status will not solve some of the key underlying problems on the benets side. In that respect, the LGPS might be regarded asequivalent in many ways to the unfunded schemes. e LGPS oers a similar set of nalsalary based benets to those unfunded schemes and the membership, whether lower orhigher paid, shares characteristics with memberships of those large unfunded schemes.Indeed, some local authority employers, such as in the education area, operate the LGPSalongside another public service pension scheme such as the teachers scheme. ere are alsooverlaps between the coverage of the LGPS and schemes such as the NHS and civil servicethat cover similar workforces.31
31 There have been numerous examples of members moving between these schemes, on account of machinery of
government changes that have altered the areas covered by the local government pension scheme.

8/8/2019 Independent Public Service Pensions Commission: Interim Report
http://slidepdf.com/reader/full/independent-public-service-pensions-commission-interim-report 88/176
4
Indeendent Public Service Pensions Commission: Interim Reort - 7 October 2010
.9 e LGPS, in line with the unfunded schemes, will therefore need to considerlonger-term structural reform of benets and employee contribution rates to deal with suchchallenges.
Impact on the whole benets and credits landscape
.96 In examining all the issues above there is a need to be aware of the impact of reformoptions on the whole of the benets and tax credits landscape. It is not appropriate tomanage the sustainability of public service pension schemes by moving recipients onto state
benets.
.9 As part of the nal report the Commission will consider the impact of any changesto the ways benets are accrued on outcomes for individuals and whether this is likely toincrease costs to the benets system.
8/8/2019 Independent Public Service Pensions Commission: Interim Report
http://slidepdf.com/reader/full/independent-public-service-pensions-commission-interim-report 89/176
5
Indeendent Public Service Pensions Commission: Interim Reort - 7 October 2010
5 Adequate and fair
Box 5.A: Summary
• Further work needs to be carried out to try and determine what are adequate levels of
income for public service pensioners and what this means for long-term design of these
schemes. Initial analysis suggests that public service pensions, when combined with the
basic State Pension, may for those who work a full career in the public service, currently
be delivering levels of income close to those recommended in Lord Turner’s Pensions
Commission report1 as being ‘adequate’. The Commission is seeking further views on how
best it should approach the measurement of adequacy of public service pensions.
• Over half of pensions in payment are for less than £5,600 per year. But in part this reects
short periods of work and part-time working.
• The average effective benet rate of pensions varies signicantly between schemes. Those
in the uniformed services are the most generous.
• Final salary schemes produce better outcomes for high yers. Tiered contribution rates will
make only a marginal impact on ensuring greater fairness in this respect.
• There will be inter-generational unfairness if costs are being passed to future taxpayers
or employees, or if members of schemes before recent reforms get better deals than
new joiners.
• Employer contributions have increased far more signicantly over the last few decades than
employee contributions in most major schemes.
• Whilst the gap between public service and private sector provision is often highlighted
as an issue, this has been a result of a decline in private sector pension provision. The
Government is trying to address this to some extent, through automatic enrolment andother policies.
. A key outcome for public service pension schemes is that they oer a reasonable levelof income in later life for public service workers. But the schemes must also be as fair aspossible: between dierent members of the same profession; between dierent generations;and between employees and taxpayers in terms of the shares of costs.
1 Pensions: Challenges and Choices The rst report of the Pensions Commission, 2004.
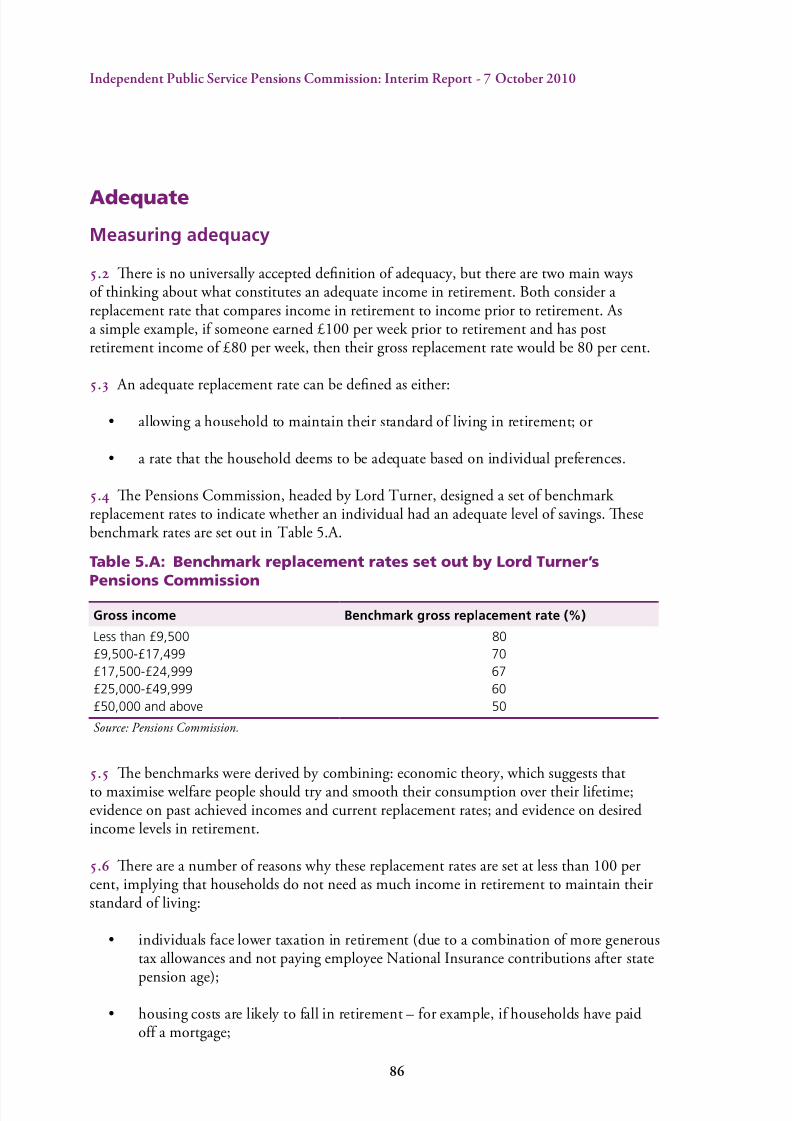
8/8/2019 Independent Public Service Pensions Commission: Interim Report
http://slidepdf.com/reader/full/independent-public-service-pensions-commission-interim-report 90/176
Indeendent Public Service Pensions Commission: Interim Reort - 7 October 2010
Adequate
Measuring adequacy
. ere is no universally accepted denition of adequacy, but there are two main waysof thinking about what constitutes an adequate income in retirement. Both consider areplacement rate that compares income in retirement to income prior to retirement. Asa simple example, if someone earned £100 per week prior to retirement and has postretirement income of £80 per week, then their gross replacement rate would be 80 per cent.
. An adequate replacement rate can be dened as either:
• allowing a household to maintain their standard o living in retirement; or
• a rate that the household deems to be adequate based on individual preerences.
. e Pensions Commission, headed by Lord Turner, designed a set of benchmark replacement rates to indicate whether an individual had an adequate level of savings. esebenchmark rates are set out in Table 5.A.
Table 5.A: Benchmark replacement rates set out by Lord Turner’sPensions Commission
Gross income Benchmark gross replacement rate (%)
Less than £9,500 80
£9,500-£17,499 70
£17,500-£24,999 67
£25,000-£49,999 60
£50,000 and above 50
Source: Pensions Commission.
. e benchmarks were derived by combining: economic theory, which suggests thatto maximise welfare people should try and smooth their consumption over their lifetime;evidence on past achieved incomes and current replacement rates; and evidence on desiredincome levels in retirement.
.6 ere are a number of reasons why these replacement rates are set at less than 100 percent, implying that households do not need as much income in retirement to maintain theirstandard of living:
• individuals ace lower taxation in retirement (due to a combination o more generoustax allowances and not paying employee National Insurance contributions ater state
pension age);
• housing costs are likely to all in retirement – or example, i households have paido a mortgage;
8/8/2019 Independent Public Service Pensions Commission: Interim Report
http://slidepdf.com/reader/full/independent-public-service-pensions-commission-interim-report 91/176
7
Indeendent Public Service Pensions Commission: Interim Reort - 7 October 2010
• expenditure needs will be dierent – or example, individuals will no longer need topay or travel to work; and
• households will no longer need to save part o their income towards a pension oncethey are in retirement.
. e Pensions Commission benchmarks have been reasonably widely accepted. However,alternative approaches to looking at adequacy could be to use poverty thresholds as anadequate level of income, or to look at how income and expenditure needs vary across theretirement period. It may also be prudent to look at household, rather than individual
income and to consider all resources available to a household in retirement (such as housingassets) rather than solely focus on income.
The level of income provided by public service pensions
.8 ere are two ways of assessing the level of income currently provided by publicservice pensions. Firstly, it is possible to look at the distribution of public service pensionsin payment using data from pension schemes, or from survey data. Secondly, it is possibleto look at the scheme rules of public service pension schemes and derive the income thatsomeone might receive from such a scheme based on their individual characteristics. Ideally,
the Commission would have liked to examine the total income of public service pensionersbefore and after retirement and over the course of retirement, but this has not been possible
within the time available.
.9 Chart 5.A below shows the distribution of public service pensions in payment. isshows that many pensions are for very low amounts; over half of pensions in payment arefor less than £5,600 per year. ere are likely to be explanations for why this is the case.Many public service pensioners may have had short or interrupted careers in public service,
worked part-time, or have been on low earnings. Chart 1.E, which looks at payments fromthe Teachers’ Pension Scheme by years of service, shows that the value of the nal pension isheavily dependent upon years of service, but all the factors already mentioned earlier couldlead to a small pension.
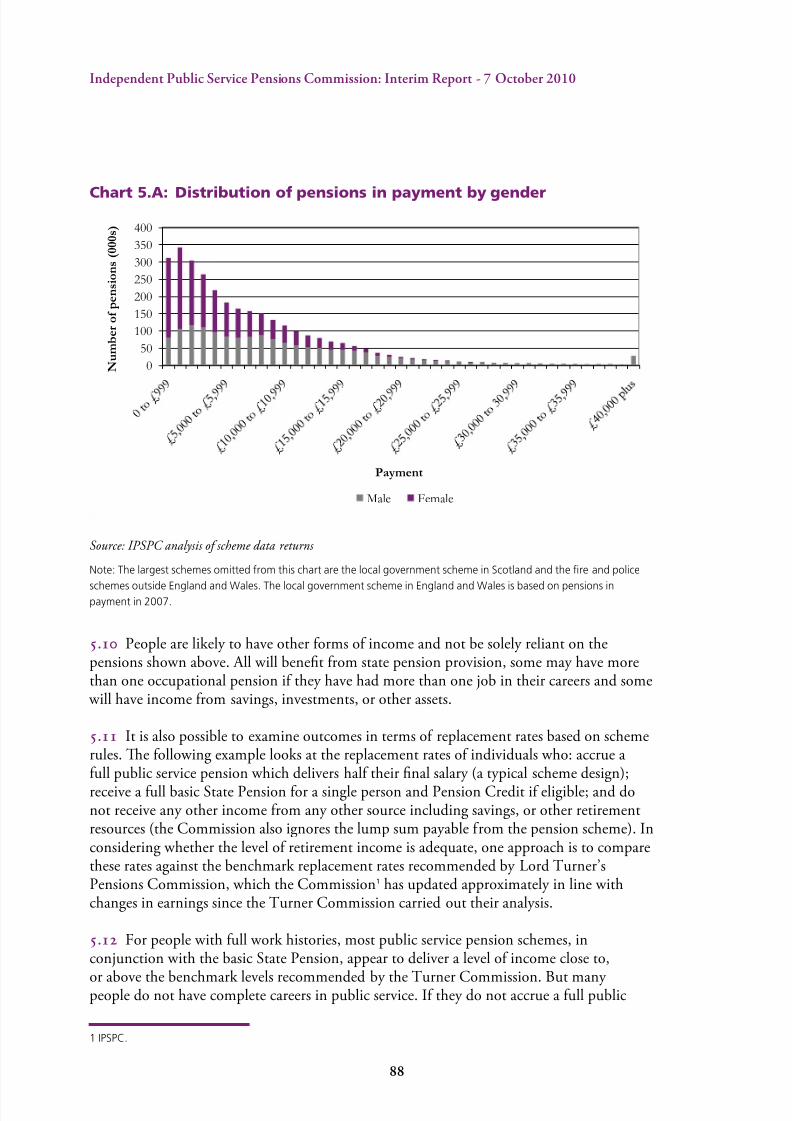
8/8/2019 Independent Public Service Pensions Commission: Interim Report
http://slidepdf.com/reader/full/independent-public-service-pensions-commission-interim-report 92/176
Indeendent Public Service Pensions Commission: Interim Reort - 7 October 2010
Chart 5.A: Distribution of pensions in payment by gender
Source: IPSPC analysis of scheme data returns
Note: The largest schemes omitted from this chart are the local government scheme in Scotland and the re and police
schemes outside England and Wales. The local government scheme in England and Wales is based on pensions inpayment in 2007.
. People are likely to have other forms of income and not be solely reliant on thepensions shown above. All will benet from state pension provision, some may have morethan one occupational pension if they have had more than one job in their careers and some
will have income from savings, investments, or other assets.
. It is also possible to examine outcomes in terms of replacement rates based on schemerules. e following example looks at the replacement rates of individuals who: accrue afull public service pension which delivers half their nal salary (a typical scheme design);receive a full basic State Pension for a single person and Pension Credit if eligible; and donot receive any other income from any other source including savings, or other retirementresources (the Commission also ignores the lump sum payable from the pension scheme). Inconsidering whether the level of retirement income is adequate, one approach is to comparethese rates against the benchmark replacement rates recommended by Lord Turner’sPensions Commission, which the Commission1 has updated approximately in line withchanges in earnings since the Turner Commission carried out their analysis.
. For people with full work histories, most public service pension schemes, inconjunction with the basic State Pension, appear to deliver a level of income close to,
or above the benchmark levels recommended by the Turner Commission. But many people do not have complete careers in public service. If they do not accrue a full public
1 IPSPC.
0
50
100
150
200
250
300
350
400
N u m b e r o f p e n s i o n s ( 0 0 0 s )
Payment
Male Female
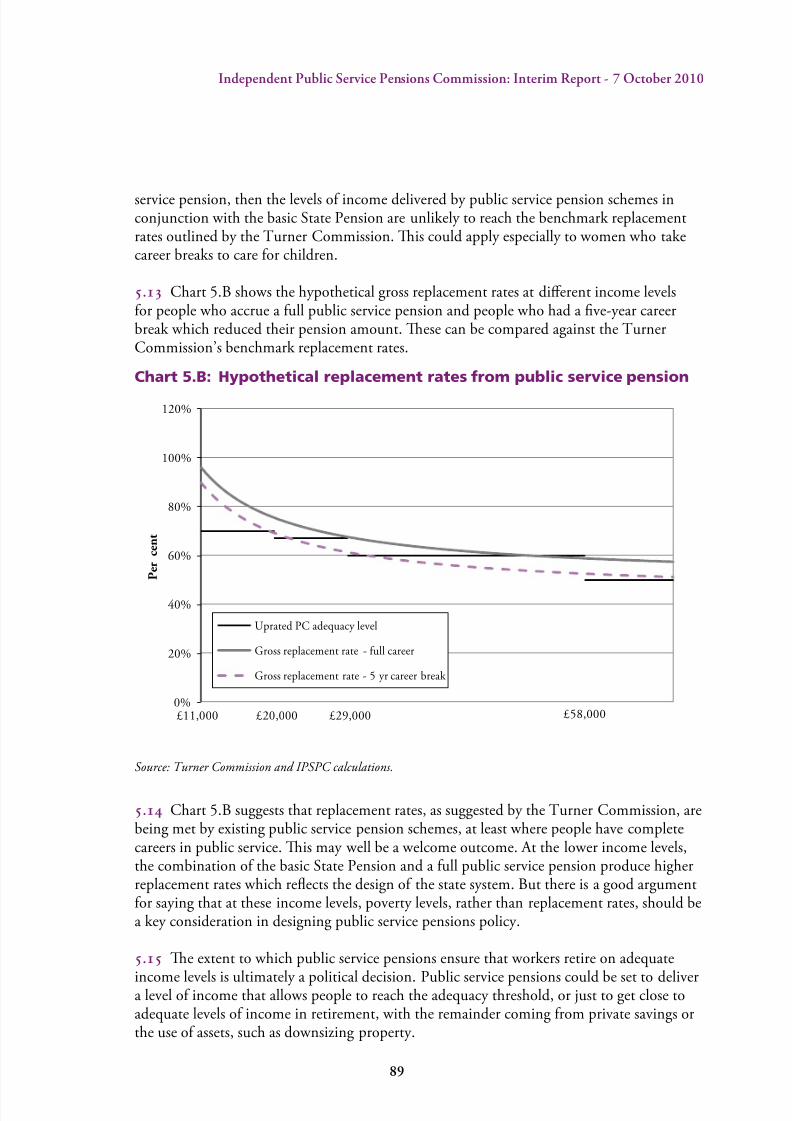
8/8/2019 Independent Public Service Pensions Commission: Interim Report
http://slidepdf.com/reader/full/independent-public-service-pensions-commission-interim-report 93/176
Indeendent Public Service Pensions Commission: Interim Reort - 7 October 2010
service pension, then the levels of income delivered by public service pension schemes inconjunction with the basic State Pension are unlikely to reach the benchmark replacementrates outlined by the Turner Commission. is could apply especially to women who takecareer breaks to care for children.
. Chart 5.B shows the hypothetical gross replacement rates at dierent income levelsfor people who accrue a full public service pension and people who had a ve-year careerbreak which reduced their pension amount. ese can be compared against the TurnerCommission’s benchmark replacement rates.
Chart 5.B: Hypothetical replacement rates from public service pension
Source: urner Commission and IPSPC calculations.
. Chart 5.B suggests that replacement rates, as suggested by the Turner Commission, arebeing met by existing public service pension schemes, at least where people have completecareers in public service. is may well be a welcome outcome. At the lower income levels,the combination of the basic State Pension and a full public service pension produce higherreplacement rates which reects the design of the state system. But there is a good argumentfor saying that at these income levels, poverty levels, rather than replacement rates, should bea key consideration in designing public service pensions policy.
. e extent to which public service pensions ensure that workers retire on adequate
income levels is ultimately a political decision. Public service pensions could be set to delivera level of income that allows people to reach the adequacy threshold, or just to get close toadequate levels of income in retirement, with the remainder coming from private savings orthe use of assets, such as downsizing property.
0%
20%
40%
60%
80%
100%
120%
P e r
c e n t
Uprated PC adequacy level
Gross replacement rate - full career
Gross replacement rate - 5 yr career break
£11,000 £20,000 £29,000 £58,000
8/8/2019 Independent Public Service Pensions Commission: Interim Report
http://slidepdf.com/reader/full/independent-public-service-pensions-commission-interim-report 94/176
0
Indeendent Public Service Pensions Commission: Interim Reort - 7 October 2010
.6 e Commission recognises that additional work and analysis needs to be done in thisarea, including looking at household composition and income over time and is interested inreceiving the widest possible range of views on this issue in advance of the nal report nextyear. Careful thought also needs to be given to how and for which groups, adequate incomelevels in retirement could be delivered where people do not work full careers.
. Another aspect of adequacy is whether there is a sucient degree of certainty in termsof pension outcomes to ensure that members do not nd themselves, when they retire, withtoo low a level of income to provide an adequate replacement income and little or no ability by then to take remedial action to boost income. Part of this is about controlling risks that
are present in pensions saving and ensuring that dierent risks are appropriately and fairly shared between dierent scheme members and taxpayers.
Fair
Fairness between public service pension schemes
.8 Factors such as the age at which benets can be taken, the accrual rate and the levelof employee contributions will all aect the value of the pension scheme to employees. A concise way to compare the generosity of schemes is to look at the average eective employee
benet rate, a concept the Commission explains in Box 5.B.
Box 5.B: Measuring the value of pensions to scheme members
To measure the value of pension benets to scheme members the Pensions Policy Institute have
modelled the ‘effective employee benet rates’ of different schemes for different members.
This concept tries to reect the average value of the benets of the pension to an individual as
a proportion of their salary by taking account of the features of the scheme such as the accrual
rate, the Normal Pension Age and any other benets offered by the scheme.
These rates show the average additional value of the pension to an individual. Since they are
averages, actual rates will vary signicantly across individuals, depending on factors such as age,scheme rules etc. Employee contributions are deducted so that the effective benet rates only
include the part of the benets funded by the employer.
For example, if scheme A has an average effective benet rate of 20 per cent of salary and
scheme B has an average effective benet rate of 10 per cent, then members of scheme A are
receiving benets worth 10 per cent of salary more than those from scheme B.
To derive the numbers below, assumptions have to be made about the discount rate. In this
analysis the PPI use the yield on AA corporate bond yields. A different discount rate would result
in different estimates of the value of benets, but here the Commission are interested in the
differences between the value of the different public service pension schemes and how the value
of public service pension schemes compare to those in the private sector.

8/8/2019 Independent Public Service Pensions Commission: Interim Report
http://slidepdf.com/reader/full/independent-public-service-pensions-commission-interim-report 95/176
1
Indeendent Public Service Pensions Commission: Interim Reort - 7 October 2010
.9 Analysis conducted by the Pensions Policy Institute (PPI) shows that average eectivebenet rates vary substantially between public service pension schemes (Chart 5.C). ereformed NHS, principal civil service and teachers schemes have average eective benetrates of approximately 17 per cent of salary, close to the level of an average private sectordened benet scheme (although as shown in Chapter 1 few of these remain open). earmed forces scheme is worth 32 per cent of salary, the police close to 23 per cent and there service around 20 per cent.2
. Many of these dierences are due to lower retirement ages and faster accrual in theuniformed services. Since the rates are net of employee contributions, the level of employee
contributions is also important and the higher rate for the armed forces scheme in partreects the fact that this scheme is non-contributory.
Chart 5.C: Average effective employee benet rates for reformedpublic service pension schemes new entrants
Source: PPI analysis for IPSPC.
Note: This analysis takes into account the move to CPI indexation of benets.
. ere is also the issue as to fairness between what is oered by schemes. Dierentschemes provide dierent levels of benet sometimes for people doing similar jobs, even forthe same employer. For instance, school teachers in England and Wales are usually membersof the Teachers’ Pension Scheme, while teaching assistants are usually members of the LGPS.
2 Note that this data is for the post-reform public service pension schemes – the PPI estimates for pre-reform schemes are
in Chart 5.F.
0%
5%
10%
15%
20%
25%
30%
35%
NHS/Teachers Civil service Local government Armed forces Police Firefighters
P e r c e n t
High benefits DBscheme
Medium benefits DB
schemes
RPI indexed
CPI indexed
Average DC plus S2P
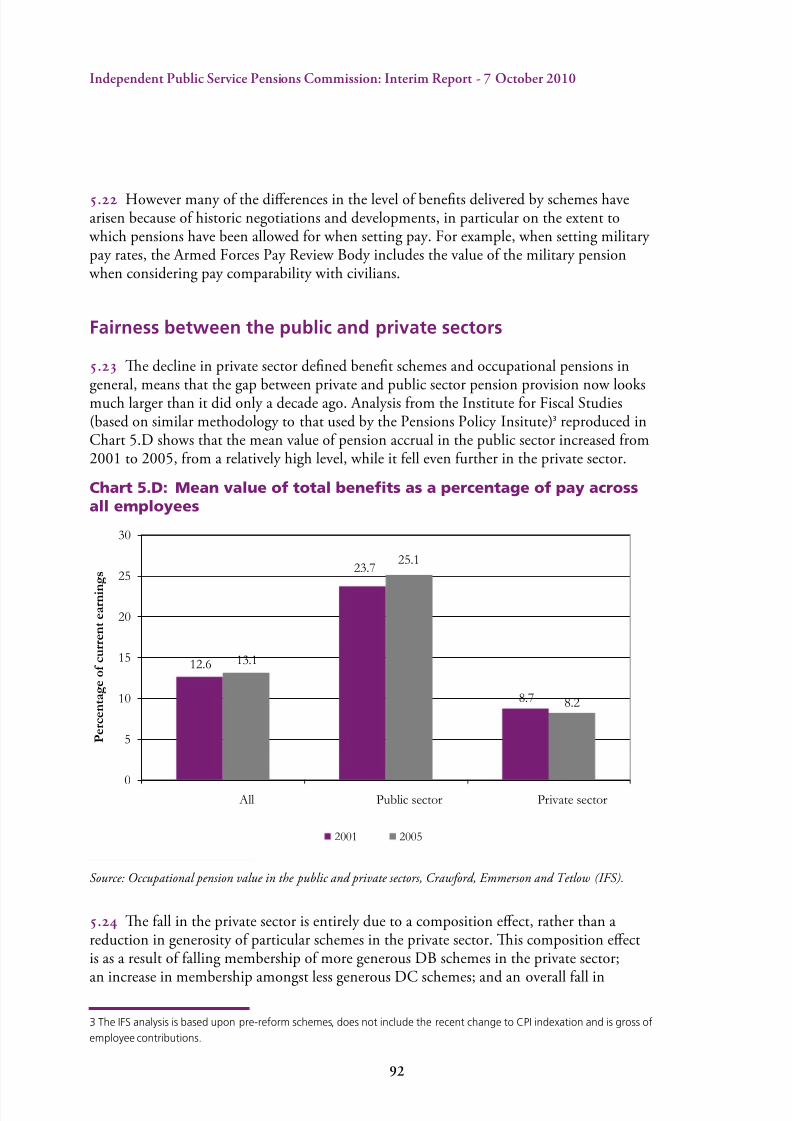
8/8/2019 Independent Public Service Pensions Commission: Interim Report
http://slidepdf.com/reader/full/independent-public-service-pensions-commission-interim-report 96/176
2
Indeendent Public Service Pensions Commission: Interim Reort - 7 October 2010
. However many of the dierences in the level of benets delivered by schemes havearisen because of historic negotiations and developments, in particular on the extent to
which pensions have been allowed for when setting pay. For example, when setting military pay rates, the Armed Forces Pay Review Body includes the value of the military pension
when considering pay comparability with civilians.
Fairness between the public and private sectors
. e decline in private sector dened benet schemes and occupational pensions in
general, means that the gap between private and public sector pension provision now looksmuch larger than it did only a decade ago. Analysis from the Institute for Fiscal Studies(based on similar methodology to that used by the Pensions Policy Insitute)3 reproduced inChart 5.D shows that the mean value of pension accrual in the public sector increased from2001 to 2005, from a relatively high level, while it fell even further in the private sector.
Chart 5.D: Mean value of total benets as a percentage of pay acrossall employees
Source: Occupational pension value in the public and private sectors, Crawford, Emmerson and etlow (IFS).
. e fall in the private sector is entirely due to a composition eect, rather than areduction in generosity of particular schemes in the private sector. is composition eectis as a result of falling membership of more generous DB schemes in the private sector;
an increase in membership amongst less generous DC schemes; and an overall fall in
3 The IFS analysis is based upon pre-reform schemes, does not include the recent change to CPI indexation and is gross of
employee contributions.
12.6
23.7
8.7
13.1
25.1
8.2
0
5
10
15
20
25
30
All Public sector Private sector
P e r c e n t a g e o f c u r r e n t e a r n i n
g s
2001 2005

8/8/2019 Independent Public Service Pensions Commission: Interim Report
http://slidepdf.com/reader/full/independent-public-service-pensions-commission-interim-report 97/176
3
Indeendent Public Service Pensions Commission: Interim Reort - 7 October 2010
membership of pension schemes in the private sector. Around 85 per cent of public sectoremployees have some form of employer sponsored pension provision compared to only 35 per cent in the private sector.4
. However, as Chart 5.C shows, where DB schemes are still open in the private sectorthey provide similar levels of benets to the reformed public service pension schemes. A medium generosity DB scheme in the private sector, which is indexed by CPI, will beslightly less generous than the NHS, teachers and local government schemes and slightly more generous if it is uprated by RPI. However, the main public service pension schemesare at least twice as generous as a typical private sector DC scheme plus any additional State
Pension that someone has accrued.
.6 On contributions to DB schemes, there is no consistent dierence between the publicand private sectors. A higher proportion of employees in the private sector who are membersof DB schemes do not pay contributions to the scheme than in the public sector (14 percent of employees compared to 3 per cent), or pay contributions of less than 5 per cent of pay (34 per cent of employees compared to 21 per cent). However, more employees also pay contributions of over 7 per cent of pay in the private than in the public sector (24 per cent of employees compared to 11 per cent).5
. e real issue, though, is the disparity of provision discussed above: the widening gap
between public and private sector provision in terms of coverage and that where a pensionis provided in the private sector it is more likely to be a DC pension that currently tendto receive lower contributions; and therefore realise lower incomes in retirement than DBprovision.
.8 ere is a fairly wide consensus that there is signicant under-saving for retirementamongst large parts of the UK population. e Commission therefore supports the decisionof the new Government that it will work to support automatic enrolment of employees intopension schemes and encourage companies to oer high-quality pensions to all employees.6
.9 Although the Commission should be concerned about the growing divergence inpension provision across the public and private sectors, the Commission is anxious toensure that public service pensioners achieve an adequate income in later life. However, theCommission needs to acknowledge that the dierence in pension provision between the twosectors can cause particular diculties in delivering greater plurality of public services and inachieving greater labour mobility between the two sectors. is issue is considered further inChapter 6.
4 Annual Survey of Household Earnings, 2009.
5 Ibid.
6 The Coalition: Our programme for government, Cabinet Ofce, 2010.
8/8/2019 Independent Public Service Pensions Commission: Interim Report
http://slidepdf.com/reader/full/independent-public-service-pensions-commission-interim-report 98/176
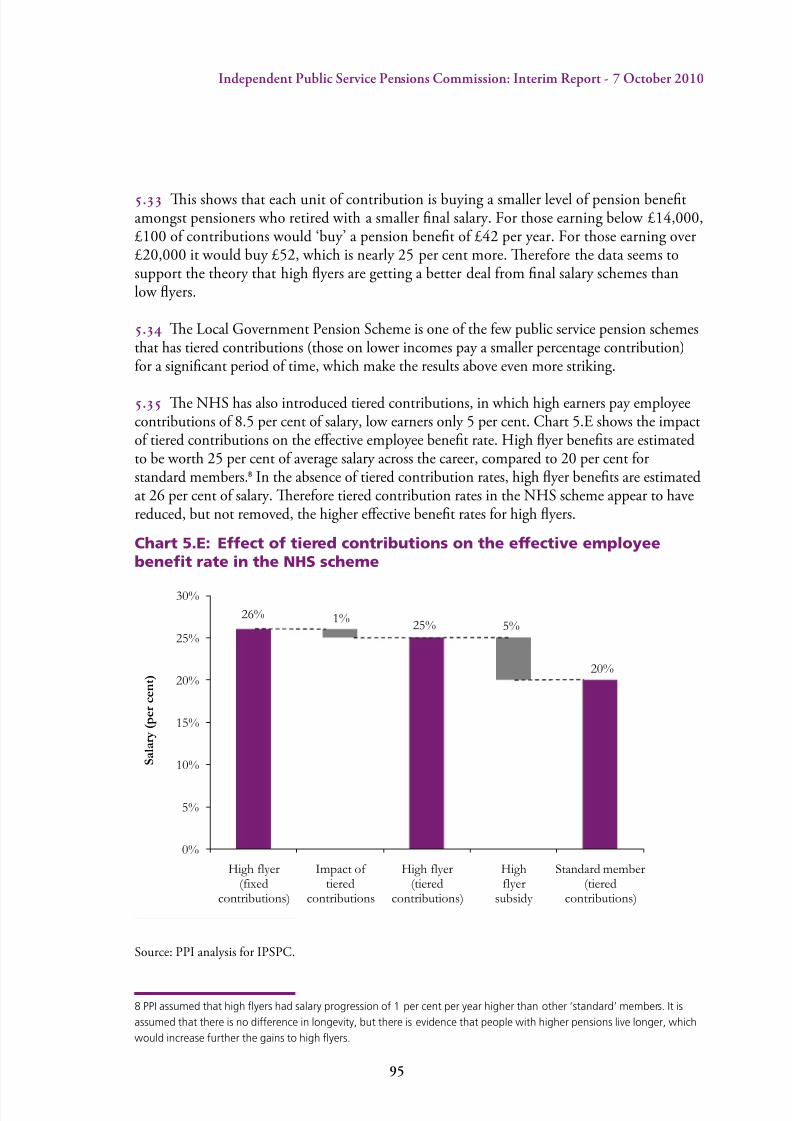
8/8/2019 Independent Public Service Pensions Commission: Interim Report
http://slidepdf.com/reader/full/independent-public-service-pensions-commission-interim-report 99/176
5
Indeendent Public Service Pensions Commission: Interim Reort - 7 October 2010
. is shows that each unit of contribution is buying a smaller level of pension benetamongst pensioners who retired with a smaller nal salary. For those earning below £14,000,£100 of contributions would ‘buy’ a pension benet of £42 per year. For those earning over£20,000 it would buy £52, which is nearly 25 per cent more. erefore the data seems tosupport the theory that high yers are getting a better deal from nal salary schemes thanlow yers.
. e Local Government Pension Scheme is one of the few public service pension schemesthat has tiered contributions (those on lower incomes pay a smaller percentage contribution)for a signicant period of time, which make the results above even more striking.
. e NHS has also introduced tiered contributions, in which high earners pay employeecontributions of 8.5 per cent of salary, low earners only 5 per cent. Chart 5.E shows the impactof tiered contributions on the eective employee benet rate. High yer benets are estimatedto be worth 25 per cent of average salary across the career, compared to 20 per cent forstandard members.8 In the absence of tiered contribution rates, high yer benets are estimatedat 26 per cent of salary. erefore tiered contribution rates in the NHS scheme appear to havereduced, but not removed, the higher eective benet rates for high yers.
Chart 5.E: Effect of tiered contributions on the effective employeebenet rate in the NHS scheme
Source: PPI analysis for IPSPC.
8 PPI assumed that high yers had salary progression of 1 per cent per year higher than other ‘standard’ members. It is
assumed that there is no difference in longevity, but there is evidence that people with higher pensions live longer, which
would increase further the gains to high yers.
0%
5%
10%
15%
20%
25%
30%
High flyer(fixed
contributions)
Impact of tiered
contributions
High flyer(tiered
contributions)
Highflyer
subsidy
Standard member(tiered
contributions)
S a l a r y
( p e r c e n t )
1%5%
20%
25%26%
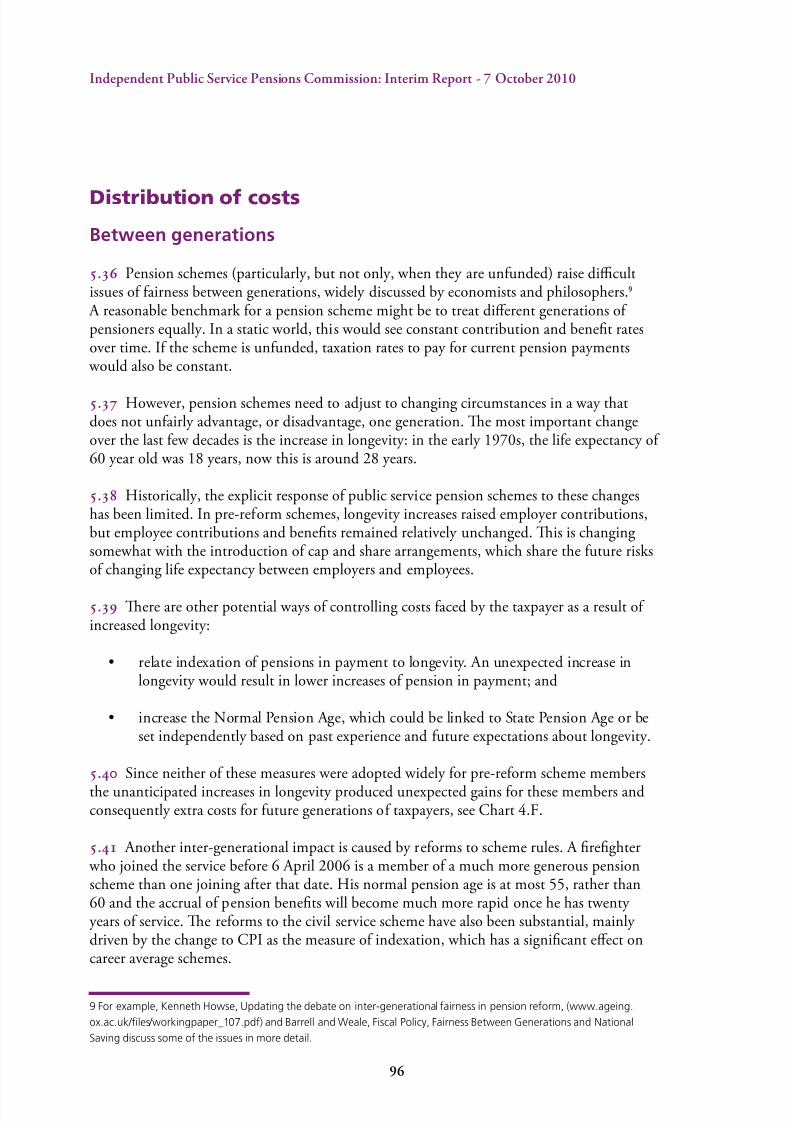
8/8/2019 Independent Public Service Pensions Commission: Interim Report
http://slidepdf.com/reader/full/independent-public-service-pensions-commission-interim-report 100/176
Indeendent Public Service Pensions Commission: Interim Reort - 7 October 2010
Distribution of costs
Between generations
.6 Pension schemes (particularly, but not only, when they are unfunded) raise dicultissues of fairness between generations, widely discussed by economists and philosophers.9
A reasonable benchmark for a pension scheme might be to treat dierent generations of pensioners equally. In a static world, this would see constant contribution and benet ratesover time. If the scheme is unfunded, taxation rates to pay for current pension payments
would also be constant.
. However, pension schemes need to adjust to changing circumstances in a way thatdoes not unfairly advantage, or disadvantage, one generation. e most important changeover the last few decades is the increase in longevity: in the early 1970s, the life expectancy of 60 year old was 18 years, now this is around 28 years.
.8 Historically, the explicit response of public service pension schemes to these changeshas been limited. In pre-reform schemes, longevity increases raised employer contributions,but employee contributions and benets remained relatively unchanged. is is changingsomewhat with the introduction of cap and share arrangements, which share the future risksof changing life expectancy between employers and employees.
.9 ere are other potential ways of controlling costs faced by the taxpayer as a result of increased longevity:
• relate indexation o pensions in payment to longevity. An unexpected increase inlongevity would result in lower increases o pension in payment; and
• increase the Normal Pension Age, which could be linked to State Pension Age or beset independently based on past experience and uture expectations about longevity.
. Since neither of these measures were adopted widely for pre-reform scheme membersthe unanticipated increases in longevity produced unexpected gains for these members andconsequently extra costs for future generations of taxpayers, see Chart 4.F.
. Another inter-generational impact is caused by reforms to scheme rules. A reghter who joined the service before 6 April 2006 is a member of a much more generous pensionscheme than one joining after that date. His normal pension age is at most 55, rather than60 and the accrual of pension benets will become much more rapid once he has twenty years of service. e reforms to the civil service scheme have also been substantial, mainly driven by the change to CPI as the measure of indexation, which has a signicant eect oncareer average schemes.
9 For example, Kenneth Howse, Updating the debate on inter-generational fairness in pension reform, (www.ageing.
ox.ac.uk/les/workingpaper_107.pdf) and Barrell and Weale, Fiscal Policy, Fairness Between Generations and National
Saving discuss some of the issues in more detail.
8/8/2019 Independent Public Service Pensions Commission: Interim Report
http://slidepdf.com/reader/full/independent-public-service-pensions-commission-interim-report 101/176
7
Indeendent Public Service Pensions Commission: Interim Reort - 7 October 2010
. e change in other schemes is in general less dramatic, but still substantial. ePensions Policy Institute estimates that employee benets across the seven main schemeshave fallen from about 20 per cent to 18 per cent of salary, see Chart 5.F. Of course, thisis not just an inter-generational issue. Two workers of the same age who are doing thesame job could nonetheless have signicantly dierent pension rights.10 But in general theCommission would expect older workers to be members of the more generous schemes,younger workers to be in the less generous reformed ones.
Chart 5.F: Average effective benet rates – existing members andnew joiners
Source: PPI analysis for IPSPC
Note: This analysis includes the effect of CPI indexation.
. e impact on younger public service employees should not be overplayed. Comparedto their grandparents, new entrants will enjoy a longer life and the reformed schemes stillcompare favourably to those in the private sector, where membership of dened benetschemes has fallen as these schemes are replaced by much less generous dened contributionschemes.
. Although it may not always be possible to avoid inter-generational unfairness it shouldbe minimised wherever possible. Key elements to this include transparency around costsand ensuring mechanisms are in place to share any change in costs, including for pre-reformscheme members.
10 Of the main schemes, only the local government scheme was reformed for all workers, the others were reformed only
for new entrants.
0% 5% 10% 15% 20% 25% 30% 35%
Average publicservice
Firefighters
Police
Armed forces
Local government
Teachers
Civil service
NHS
Per cent
New joiners Existing members

8/8/2019 Independent Public Service Pensions Commission: Interim Report
http://slidepdf.com/reader/full/independent-public-service-pensions-commission-interim-report 102/176
Indeendent Public Service Pensions Commission: Interim Reort - 7 October 2010
Between the employee and the taxpayer
. Taxpayers nance a proportion of public service pensions, but this is reasonable sincetaxpayers are also the recipients of the services that are provided by employees. However, thebalance has to be right.
.6 e split of costs between the taxpayer and the employee varies across schemes as Chart5.G below shows. e Armed Forces Scheme is non-contributory, the judiciary can makecontributions of just 1.8 to 2.4 per cent for dependants’ benets, whilst some employees inthe reformed NHS scheme contribute over a third of the cost of accrual.11 ese variations
are in part the result of dierent decisions and negotiations over pay and other elements of remuneration over the years.
Chart 5.G: Employee contributions as a proportion of the value of theaccrual – pre and post reform
Source: IPSPC and PPI.
. Although costs are important, the balance of risks between employees and taxpayers alsoneeds to be considered. In unfunded schemes, where there are no assets there is no explicit
11 The analysis here uses AA corporate bond yields as a discount rate. A higher discount rate would increase the
proportion of the cost paid by employees, but the impact is likely to be marginal and would not lead to employees paying
the majority of the cost. The analysis has been carried out assuming CPI pension indexation in line with the Government
proposals.
0%
10%
20%
30%
40%
50%
60%
70%
80%
90%
100%
P e r c e n t a g e o f t o t a l e f f e c t i v
e
b e n e f i t v a l u e
Remaining value of benefi ts Increase to highest employee proportion Lowest employee proportion

8/8/2019 Independent Public Service Pensions Commission: Interim Report
http://slidepdf.com/reader/full/independent-public-service-pensions-commission-interim-report 103/176
Indeendent Public Service Pensions Commission: Interim Reort - 7 October 2010
investment risk. However, there are risks associated with changes in longevity, so that if people live longer than expected the benets will cost more to pay out than planned for.
.8 e Commission outlined in the previous chapter, how increases in longevity haveincreased the costs of pension provisions signicantly. But there have only been marginalincreases in employee pension contribution rates over this period. In 1925 members of theTeachers’ Pension Scheme paid 5 per cent employee contributions, which was matchedby a 5 per cent contribution from the employer. Current members pay 6.4 per cent withthe employer paying over twice as much at 14.1 per cent. In the NHS scheme in 1948employees paid 5 per cent or 6 per cent with employers paying 6 per cent or 8 per cent
depending on the type of worker. In 2008, employees paid between 5 per cent and 8.5 percent based on salary and employers paid 14 per cent.
.9 erefore the majority of the costs are being borne by the taxpayer and the taxpayerhas met most increases in cost. ere may be a case for rebalancing this split of costs inthe future.

8/8/2019 Independent Public Service Pensions Commission: Interim Report
http://slidepdf.com/reader/full/independent-public-service-pensions-commission-interim-report 104/176
100
Indeendent Public Service Pensions Commission: Interim Reort - 7 October 2010

8/8/2019 Independent Public Service Pensions Commission: Interim Report
http://slidepdf.com/reader/full/independent-public-service-pensions-commission-interim-report 105/176
101
Indeendent Public Service Pensions Commission: Interim Reort - 7 October 2010
6 Supporting productivity
Box 6.A: Summary
• In general, labour mobility supports an efcient labour market and enhances productivity.
Pension scheme design should not be an unintended barrier to movement into, or out of,
the public sector.
• Current public service pension structures appear to discourage mobility between public and
private sectors through:
• providing better benets to those who remain within the public sector compared to
those who move and thus defer their pension; and
• providing better benets to those who are promoted late in their career.
• Public service pensions need to be considered in the context of the total benets package
for employees. Overall, it appears that total reward, including pensions, is on average
higher for public service workers than for those in the private sector, after taking accountof different qualications, ages and experience levels. There are exceptions – for instance,
highly-skilled workers in London and the South East might receive lower pay and benets
in public service. But overall public service pensions are not being exploited as efciently
and effectively as they could be in attracting and keeping public service employees.
Consequently current pension schemes do not appear to offer best value for money.
• It is hard to judge the impact of pensions on recruitment, given the low level of detailed
understanding of pensions. But it seems likely that pension scheme members have an
understanding of the comparative worth of their public service pensions. Understanding
will increase as attention focuses on the prospect of reform.
• Pensions can have an impact on the different ways in which public services are provided.Evidence to the Commission has made clear that current pension structures, combined with
the requirement to provide comparable pensions (‘Fair Deal’), are a barrier to non-public
service providers, potentially making it more difcult to achieve efciencies and innovation
in public service delivery. While some commentators have suggested that extending access
to public service pension schemes would resolve this, it does not appear to offer a long-
term, sustainable solution.
• Ultimately, it is for the Government to consider carefully the best way of moving forward with
Fair Deal in a way that delivers its wider objective of encouraging a broader range of public
service providers while remaining consistent with good employment practices. For its part, the
Commission will focus in its nal report on addressing the issue of how long-term structuralreform to public service pensions can support greater labour market mobility and improved
productivity in a way that conforms to the general principles outlined in Chapter 3.

8/8/2019 Independent Public Service Pensions Commission: Interim Report
http://slidepdf.com/reader/full/independent-public-service-pensions-commission-interim-report 106/176
102
Indeendent Public Service Pensions Commission: Interim Reort - 7 October 2010
6. To support productivity, public service pension scheme design should be consistent with an ecient labour market for employees. e taxpayer can then be condent thatpublic services are delivering value for money. In general, scheme design should avoidunintended barriers to the movement of employees between sectors. is needs to be viewedin the context of the whole remuneration package, and whether the schemes support therecruitment and retention of the right people in the right jobs in a cost-eective way. Inparticular, scheme structure should not be an unreasonable barrier to the outsourcing andmutualisation of public services that could drive greater productivity and eciency.
Supports labour mobilityMovement between sectors
6. In general, labour mobility supports an ecient labour market and enhancesproductivity. Pension scheme design should not be an unintended barrier to movementinto, or out of, the public sector. ere may be profession-specic reasons for discouragingmobility in order to aid retention. Where that is the case the trade-os need to be explicit,clear and oer good value for money.
6. ere are three key design features of public service pension schemes that can undermine
mobility:
• vesting periods – how long an employee must stay in a job beore he or she qualifesor a deerred pension beneft;
• treatment o early leavers – the extent to which those who leave public service beoreretirement ace a penalty; and
• fnal salary structure – the beneft o staying on or employees who expect urtherpromotion.
6. In some countries, very long service is required before a public service employeebecomes eligible for pension benets – for instance, Austria, France and Spain require15 years’ service, with early leavers having only limited rights of pension transfer.1 Butthe vesting period in UK public service pension schemes is a maximum of two years, andpension rights can be transferred to other schemes after only three months’ service. So in theUK this is unlikely to have a major impact on labour market exibility.
1 Civil Service Pension Schemes around the World, Robert Palacios and Edward Whitehouse, World Bank SP Discussion
Paper no.0602, May 2006.
8/8/2019 Independent Public Service Pensions Commission: Interim Report
http://slidepdf.com/reader/full/independent-public-service-pensions-commission-interim-report 107/176
103
Indeendent Public Service Pensions Commission: Interim Reort - 7 October 2010
6. e treatment of early leavers could be more signicant. Moving to a job elsewhere inthe public sector can be relatively straightforward, due to the Public Sector Transfer Club.2 But problems can arise for employees who wish to move to the private sector. In most publicservice pension schemes, an employee’s pension is based on his or her nal salary whenleaving public service or retiring. 3 For an early leaver who does not take a pension transfer,the pension rights accrued are then increased in line with ination until the Normal Pension
Age is reached. But had they stayed in public service the link to nal salary means that thosepension rights would be expected to increase in line with earnings. Since earnings tend torise more quickly than prices over the long term, this implies that a stayer would expect toreceive a higher pension for each year of pensionable service than a leaver on the same pay
who takes a preserved pension, even if they have identical earnings proles.
6.6 Some public service pension schemes provide more valuable pension rights to stayersthan to early leavers. For instance, the most recent police and armed forces schemes apply Normal Pension Ages of 55 to those who retire in service, compared to 65 for those wholeave early. Also, some pension designs have been specically framed to produce a majorretention incentive, such as the provision in the pre-2006 police scheme that allows formuch faster pension accrual after 20 years of service.
6. Final salary schemes signicantly increase the pensions of those who are promoted orreceive a pensionable allowance, which can be particularly valuable when the increase comes
towards the end of a career. A pay increase upgrades the pension rights accrued in previousyears, with the result that someone anticipating a promotion or allowance could be reluctantto change jobs. is could be particularly relevant in the public sector, since Chart 6.Csuggests that public sector employees – especially graduates – are more likely to have stableor increasing earnings through their 40s or 50s than are employees in the private sector.Box 6.A discusses the impact of these factors on the mobility of two dierent hypotheticalemployees.
2 The Club consists of about 120 occupational pension schemes, mostly in the public sector, but including for example
private schools and trades unions. Individuals voluntarily transferring between schemes are able to take with them accrued
pension rights and thus are not disadvantaged.
3 The civil service nuvos scheme and the NHS scheme for general and dental practitioners are based on career average
earnings.
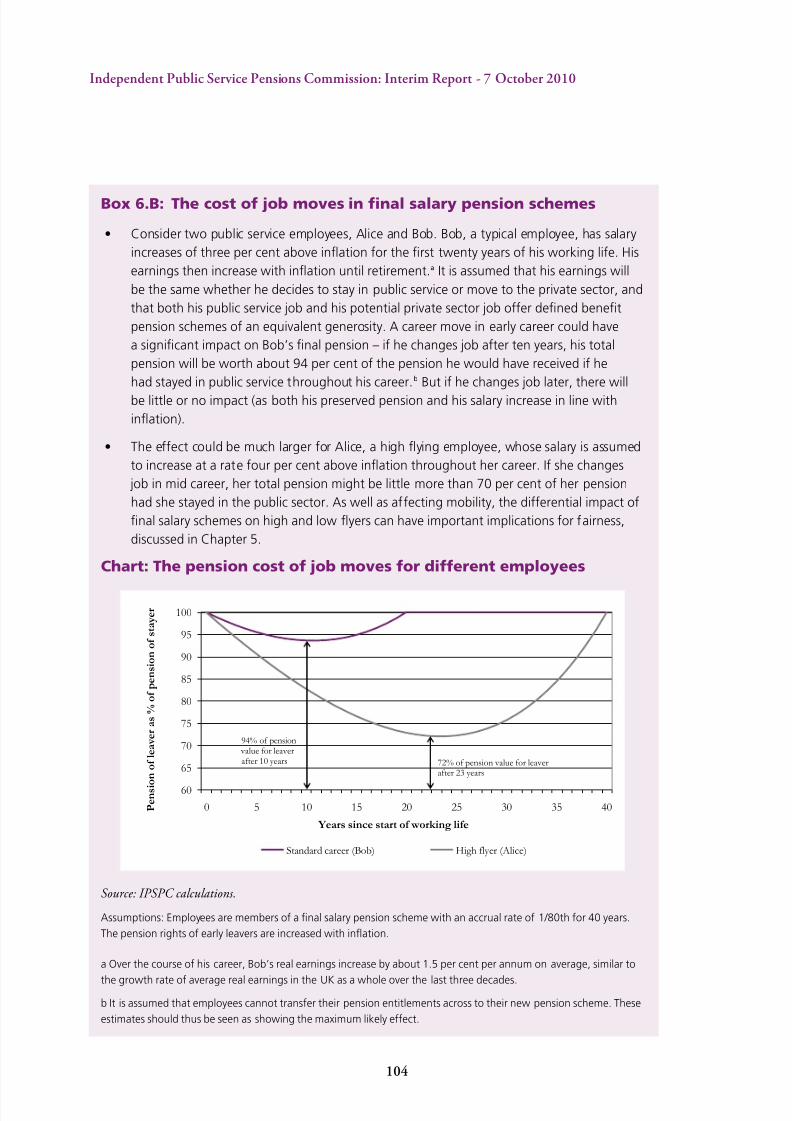
8/8/2019 Independent Public Service Pensions Commission: Interim Report
http://slidepdf.com/reader/full/independent-public-service-pensions-commission-interim-report 108/176
104
Indeendent Public Service Pensions Commission: Interim Reort - 7 October 2010
Box 6.B: The cost of job moves in nal salary pension schemes
• Consider two public service employees, Alice and Bob. Bob, a typical employee, has salary
increases of three per cent above ination for the rst twenty years of his working life. His
earnings then increase with ination until retirement.a It is assumed that his earnings will
be the same whether he decides to stay in public service or move to the private sector, and
that both his public service job and his potential private sector job offer dened benet
pension schemes of an equivalent generosity. A career move in early career could have
a signicant impact on Bob’s nal pension – if he changes job after ten years, his total
pension will be worth about 94 per cent of the pension he would have received if he
had stayed in public service throughout his career.b But if he changes job later, there will
be little or no impact (as both his preserved pension and his salary increase in line with
ination).
• The effect could be much larger for Alice, a high ying employee, whose salary is assumed
to increase at a rate four per cent above ination throughout her career. If she changes
job in mid career, her total pension might be little more than 70 per cent of her pension
had she stayed in the public sector. As well as affecting mobility, the differential impact of
nal salary schemes on high and low yers can have important implications for fairness,
discussed in Chapter 5.
Chart: The pension cost of job moves for different employees
60
65
70
75
80
85
90
95
100
0 5 10 15 20 25 30 35 40 P e n s i o n o f l e a v e r a s % o
f p e n s i o n o f s t a y e r
Years since start of working life
Standard career (Bob) High flyer (Alice)
72% of pension value for leaverafter 23 years
94% of pension value for leaverafter 10 years
Source: IPSPC calculations.
Assumptions: Employees are members of a nal salary pension scheme with an accrual rate of 1/80th for 40 years.
The pension rights of early leavers are increased with ination.
a Over the course of his career, Bob’s real earnings increase by about 1.5 per cent per annum on average, similar to
the growth rate of average real earnings in the UK as a whole over the last three decades.
b It is assumed that employees cannot transfer their pension entitlements across to their new pension scheme. These
estimates should thus be seen as showing the maximum likely effect.
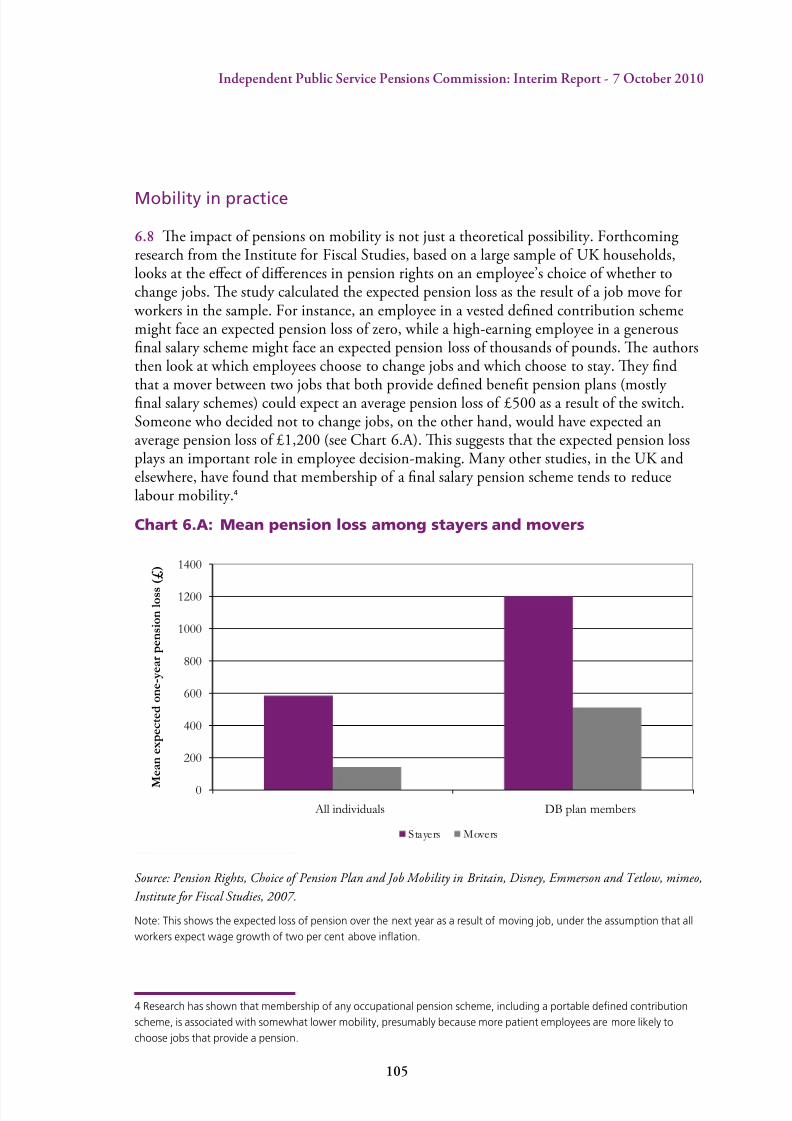
8/8/2019 Independent Public Service Pensions Commission: Interim Report
http://slidepdf.com/reader/full/independent-public-service-pensions-commission-interim-report 109/176
105
Indeendent Public Service Pensions Commission: Interim Reort - 7 October 2010
Mobility in practice
6.8 e impact of pensions on mobility is not just a theoretical possibility. Forthcomingresearch from the Institute for Fiscal Studies, based on a large sample of UK households,looks at the eect of dierences in pension rights on an employee’s choice of whether tochange jobs. e study calculated the expected pension loss as the result of a job move for
workers in the sample. For instance, an employee in a vested dened contribution schememight face an expected pension loss of zero, while a high-earning employee in a generousnal salary scheme might face an expected pension loss of thousands of pounds. e authorsthen look at which employees choose to change jobs and which choose to stay. ey nd
that a mover between two jobs that both provide dened benet pension plans (mostly nal salary schemes) could expect an average pension loss of £500 as a result of the switch.Someone who decided not to change jobs, on the other hand, would have expected anaverage pension loss of £1,200 (see Chart 6.A). is suggests that the expected pension lossplays an important role in employee decision-making. Many other studies, in the UK andelsewhere, have found that membership of a nal salary pension scheme tends to reducelabour mobility.4
Chart 6.A: Mean pension loss among stayers and movers
Source: Pension Rights, Choice of Pension Plan and Job Mobility in Britain, Disney, Emmerson and etlow, mimeo,
Institute for Fiscal Studies, 2007.
Note: This shows the expected loss of pension over the next year as a result of moving job, under the assumption that all
workers expect wage growth of two per cent above ination.
4 Research has shown that membership of any occupational pension scheme, including a portable dened contribution
scheme, is associated with somewhat lower mobility, presumably because more patient employees are more likely to
choose jobs that provide a pension.
0
200
400
600
800
1000
1200
1400
All individuals DB plan members
M
e a n e x p e c t e d o n e - y e a r p e n s i o n l o s s
( £ )
Stayers Movers

8/8/2019 Independent Public Service Pensions Commission: Interim Report
http://slidepdf.com/reader/full/independent-public-service-pensions-commission-interim-report 110/176
10
Indeendent Public Service Pensions Commission: Interim Reort - 7 October 2010
6.9 e nal salary design of most public service pension schemes could thus act as animportant block to labour mobility between the public and private sectors. Of course, thisalso implies that nal salary schemes do help to retain employees. But it is not clear thatthey are doing so in a way that is targeted on the employees that public service employersmost want to keep. Nor is this retention eect related to an employee’s training; it will oftenbe particularly important to retain those employees in whose training the employer hasinvested.
6. ere is no single ideal rate of labour mobility, and there are many inuences onmobility other than pension scheme design. But it is important that pension schemes do
not act as an articial impediment to an employee’s choice of career. Where they do have animpact, the reasons for the design chosen should be made explicit.
The role of pensions in total reward
6. To be productive the public sector needs the right people with the right skills in theright location and at the right price. Remuneration is key to this. Pay is the largest part of the remuneration package, and the Commission will take account of developments resultingfrom Will Hutton’s Review of Fair Pay in the Public Sector. Pension provision, as a sizableportion of the total remuneration package in the public sector, would be a crucial element
too, if people were acting with full information and understanding.
Employee attitudes
6. However, people do not always make rational choices based on knowledge abouttheir pension provision and it is very dicult to quantify the impact of pension provisionon recruitment and retention. Research shows that the majority of people have limitedunderstanding of their pension entitlement, with only ve per cent saying that they had agood knowledge of pensions.5 In addition, interest in pensions tends to be lower amongyounger members, with interest and knowledge increasing as retirement age approaches.
6. is general lack of knowledge does not necessarily equate to a lack of interest (orconcern). While empirical evidence in this area is poor, it seems reasonable to assume thatpensions play some role in recruitment and retention, with employees valuing their pensionschemes and reacting to perceived threats to them, even if they are not aware of the detailsof the schemes. A recent survey of public sector workers found that 21 per cent had chosenemployment in the public sector specically for the pension and 32 per cent said they wouldconsider a move to the private sector if their current benets were reduced.6
5 Attitudes to Pensions: The 2006 survey, Clery, E., McKay, S., Phillips, M., and Robinson, C, Department for Work and
Pensions Research Report No 434, 2007.
6 Public Sector Pensions – A Frontline Perspective, Murray, A and Wright, J., Hymans Robertson, 2009.

8/8/2019 Independent Public Service Pensions Commission: Interim Report
http://slidepdf.com/reader/full/independent-public-service-pensions-commission-interim-report 111/176
107
Indeendent Public Service Pensions Commission: Interim Reort - 7 October 2010
6. In addition, several submissions to the Commission from both employees and employersemphasised the importance of the pension in supporting recruitment and retention withinthe public services. In light of the current economic climate and the high level of mediacommentary on public service pensions, it appears likely that employees who are members of apublic service pension scheme will be aware that their pension package is perceived as generousby wider society and better than those generally available in the private sector.
Using pay and pensions effectively
6. It might be expected that pensions and pay would compensate for each other inan employee’s remuneration. So if two similar employees are doing similar jobs and oneemployee has more valuable pension rights, then the other employee should be paid more.Extending this approach to the public and private sectors, this suggests that private sectoremployees might be expected to receive greater take-home pay, to make up for the fact thatprivate sector pensions are on average less valuable (see Chart 5.D).
6.6 But there is little evidence that this is so. Chart 6.B shows the median relationshipbetween age and earnings for employees with dierent education levels in the public andprivate sectors. e earnings measures used here and later include bonus payments, butexclude pension rights, holidays and other benets (such as private health insurance or a
company car). ere are some important dierences between public and private sector wageproles. For instance, highly-educated men seem to experience more rapid wage growth inthe private sector, before falling back later in life. But private sector pay does not seem to besystematically higher. If anything, public sector pay seems usually to be higher for employees
with low or medium education.
Chart 6.B: Median age-earnings proles for employees in the publicand private sectors
Men Women
Source: ‘What is a Public Sector Pension Worth?,’ Disney, Emmerson and etlow, Economic Journal, 2009.
0
2
4
6
8
10
12
14
16
18
20
21 25 30 35 40 45 50 55 59
M e d i a n h o u r l y e a r n i n g s ( £ )
0
2
4
6
8
10
12
14
16
18
20
21 25 30 35 40 45 50 55 59
M e d i a n h o u r l y e a r n i n g s ( £ )
- - -
- - -
Pub li c s ec to r -h ig h e duca ti on Pri va te s ec to r -h ig h e duca ti on Pub li c -m i d e duca ti on
Private - mid education Public - low education Private - low education

8/8/2019 Independent Public Service Pensions Commission: Interim Report
http://slidepdf.com/reader/full/independent-public-service-pensions-commission-interim-report 112/176
10
Indeendent Public Service Pensions Commission: Interim Reort - 7 October 2010
6. Of course, pay comparisons between the public and private sectors can be dicult. For afull analysis, the Commission must compare like with like, taking account of individual skills,qualications and experience. is is not always possible, but the evidence the Commission hasreceived shows that:
• the pay gap uctuates over time. Public sector workers have tended to do relatively better during recessions, while private sector employees do better in booms;7
• overall, in the long term public sector pay dierentials do not seem to departstrongly rom zero.8 There appears not to be any systematic gap between pay in the
two sectors. The two-year pay reeze or public service workers announced by theGovernment at Budget 2010 in June could have an eect on the pay gap betweenpublic and private sector employees, but it is too early to draw any conclusions; and
• the pay gap varies between sectors and or dierent types o worker. In particular,research by the IFS, the Pensions Policy Institute and the Senior Salaries Review Body suggests that highly-skilled workers in the South East and London tend to earnmore in the private sector. Less skilled workers, and those in other regions, typically do better in the public sector.9 This is consistent with several studies that fnd thatpay is relatively compressed within the public sector.10
6.8 e rough equality overall in pay and bonuses implies that remuneration includingpensions is on average higher in the public sector once pensions are taken into account.
Around 65 per cent of private sector workers lack occupational pensions (compared to around15 per cent in the public sector). In 2008, the IFS estimated that, overall, public sectorpensions add about 12 per cent of salary more to pay than do pensions in the private sector,11
while the Oce for National Statistics recently found that total reward, including pensioncontributions, is about 13 per cent higher in the public sector than in the private sector onaverage.12
6.9 ere could be several reasons for this disparity, which the Commission plans toinvestigate more closely. But it does not appear that the greater benet levels seen inpublic service pensions are driven by a need to make up for any imbalance in pay between
7 Changing public sector wage differentials in the UK, Disney and Gosling, 2008.
8 Changing public sector wage differentials in the UK, p.13, Disney and Gosling, 2008.
9 On regional differences, see Green Budget, p.226, Institute for Fiscal Studies, February 2010. On skill differences, see An
assessment of the Government’s reforms to public sector pensions, p.48, Pensions Policy Institute, 2008. The 2010 report
of the Review Body on Senior Salaries discusses the gap between public and private sector pay at the top of the
pay distribution.
10 What is a Public Sector Pension Worth? by Disney, Emmerson and Tetlow, nds that total lifetime remuneration is
between three and six per cent higher for a male public sector worker with low or medium education, compared to his
private sector counterpart. But remuneration is ve per cent lower for a highly-educated male public sector worker.
11 Green Budget, p.172, Institute for Fiscal Studies, 2008.
12 ‘Total reward: pay and pension contributions in the private and public sectors’, Levy, Mitchell, Guled and Coleman,
Economic and Labour Market Review, September 2010. Note that this work does not take account of differing
qualications or experience levels.
8/8/2019 Independent Public Service Pensions Commission: Interim Report
http://slidepdf.com/reader/full/independent-public-service-pensions-commission-interim-report 113/176
10
Indeendent Public Service Pensions Commission: Interim Reort - 7 October 2010
the public and private sectors. is might suggest that total remuneration policies arenot currently being used as eciently and eectively as they could be to attract and keep
workers.
Plurality of public service provision
6. In the last few decades there has been a drive towards moving services that weretraditionally delivered by public service in-house providers to outside ones as a way toimprove the eciency and quality of services. e Government is examining opportunities
for more private and voluntary sector involvement in service delivery.
13
It is thus likely thatthere will be further transfers of in-house services to new providers.
Fair Deal
6. At present, when employees are transferred to non-public service bodies, theorganisation they move to is required to ensure that there is ‘broadly comparable’ pensionprovision for future service, through the Fair Deal provisions (see Box 6.C).14 isarrangement has maintained the level of pension provision for those compulsorily transferredout of the public sector. However, given current public service pension structures, this can
make it harder for private sector and third sector organisations to provide public servicesbecause providing a ‘broadly comparable’ dened benet pension scheme can be signicantly more expensive and risky for private sector organisations than for public sector employers.
13 Cabinet Ofce Draft Structural Reform Plan, June 2010.
14 Staff transfers in the Public Sector: Statement of Practice, Annex A, Cabinet Ofce, 2000.
8/8/2019 Independent Public Service Pensions Commission: Interim Report
http://slidepdf.com/reader/full/independent-public-service-pensions-commission-interim-report 114/176
110
Indeendent Public Service Pensions Commission: Interim Reort - 7 October 2010
Box 6.C: Fair Deal: the requirement for ‘broadly comparable’pensions
The Fair Deal, introduced in 1999, is a non-statutory code of practice protecting the pension
provisions of public sector workers that have their employment compulsorily transferred out of
the public sector. If there is a compulsory transfer of staff the organisation is required to ensure
that there is ‘broadly comparable’ pension provision for future service and that there are options
for the handling of existing accrued benets. The Fair Deal policy was introduced to generate
greater workforce cooperation for public service reform. It protects public service workers from
being moved to less generous pension schemes.
A scheme is ‘broadly comparable’ if the overall value of the benets in the scheme (as assessedby the Government Actuary’s Department) is greater than or equal to that in the current
scheme. For example, since the average employer contribution rate in the civil service is 18.9 per
cent of salary, a non-public service body that takes on civil service staff might be expected to
make contributions at this level or higher. Furthermore, there must be no identiable group or
individual who will be materially worse off as a result of the transfer.
Given current levels of public service pension provision this code is more generous than the
compulsory transfer of undertakings (TUPE) regulations set out in the 2004 Pensions Act.
Broadly, these regulations require the new employer to provide matching contributions of up to
six per cent of salary in a DB or DC scheme.
6. ere are two central reasons why providing a broadly comparable pension schemecan be dicult for private sector or third sector organisations. First cost, the public serviceand the private sector use dierent bases for calculating accruing pension liabilities andthe contributions required to pay for them. Employer contributions in unfunded publicservice pension schemes are calculated using a real discount rate of 3.5 per cent, which may be too high, resulting in contribution levels that could be too low. Employer contributionsin the private sector are calculated on a ‘prudent’ basis within a framework monitored by the Pensions Regulator. is addresses the risk that pension fund assets under-perform,or that the size of pension liabilities is greater than expected. is typically leads to greatercosts than in the public sector, where contributions are set taking into account the ultimategovernment guarantee. In particular, in the funded Local Government Pension Scheme, theguarantee allows more freedom to achieve long-term investment out-performance.
6. Second risk, by taking on employees with dened benet pension rights, private sectorbodies expose themselves to the investment and demographic risks discussed in Chapter 1.For larger rms, these risks might be considered manageable, although evidence submitted tothe Commission indicates their concerns. But evidence also suggests that smaller rms andcharities in particular feel unable to take on risks that could seriously harm their organisationsif investments do badly or if longevity increases unexpectedly. As a result, they can either
withdraw from the outsourcing process or purchase a pension from a third party. ese
8/8/2019 Independent Public Service Pensions Commission: Interim Report
http://slidepdf.com/reader/full/independent-public-service-pensions-commission-interim-report 115/176
111
Indeendent Public Service Pensions Commission: Interim Reort - 7 October 2010
pensions can involve contribution rates of about 40 per cent of salary,15 more than double theaverage employer contribution in the non-uniformed public service pension schemes.
Extending access to the private and third sectors
6. Some external stakeholders have suggested that extending access to public servicepension schemes to non-public service employees would help to reduce the disadvantagesfaced by private sector and third sector organisations as a result of Fair Deal.
6. Extension of access is already quite common in some public service pension schemes.For instance, the NHS and teachers pension schemes have, for historic reasons, long hadmany private sector employees. In the case of the NHS, this is to cover General Practitioners
working as private sector practices. In the teachers schemes, it is principally to cover teachersin independent schools. e Local Government Pension Scheme has for the last decadeoered admitted body status to facilitate pension arrangements for local authority workforcestransferred to private sector contractors. In 2007 there were around 2,500 admitted bodiesin the scheme, in addition to the 500 principal local authority employers. ese admittedbodies employ about seven per cent of LGPS members.
6.6 However, there are important arguments against widening the current provisions.
Doing so would involve the Government bearing additional risks arising from pensionliabilities accrued in the private sector. But the Government would have little control overthe liabilities being accrued, since it would not set the wages of these employees.
6. Some of these risks can be managed. e Teachers’ Pension Scheme requiresindemnities from third party nancial institutions as a condition of new admission forindependent schools and its rules control pensionable pay increases in the nal years. Butsuch risks cannot be completely removed, and evidence to the Commission suggests many organisations cannot provide such indemnities.
6.8 Moreover, extending access might not provide a viable solution for some privatesector and third sector organisations. Evidence submitted to the Commission stated thatsmaller organisations are struggling with the exit charges levied by some parts of the LocalGovernment Pension Scheme when contracts end. ey can run the risk of becomingtechnically insolvent as they are required to recover any decits under a shorter timescalethan that allowed to public service local government employers.
Future prospects
6.9 ese issues mean that extending access to public service pension schemes is probably
not the solution to the issues that Fair Deal currently creates. It is clear that structural
15 This is based on the cost of the Prudential Platinum Pension, a scheme considered broadly comparable to those for
NHS, local government and civil service employees.

8/8/2019 Independent Public Service Pensions Commission: Interim Report
http://slidepdf.com/reader/full/independent-public-service-pensions-commission-interim-report 116/176
112
Indeendent Public Service Pensions Commission: Interim Reort - 7 October 2010
reform of public service pensions could be part of a solution if reform creates a more levelplaying eld with the private sector. e Commission’s nal report will deal with long-termstructural reforms.
6. Ultimately, it is for the Government to consider carefully the best way of movingforward with Fair Deal in a way that delivers its wider objective of encouraging a broaderrange of public service providers while remaining consistent with good employmentpractices. For its part, the Commission will focus in its nal report on addressing the issueof how long-term structural reform to public service pensions can support greater labourmarket mobility and improved productivity in a way that conforms to the general principles
outlined in Chapter 3.
8/8/2019 Independent Public Service Pensions Commission: Interim Report
http://slidepdf.com/reader/full/independent-public-service-pensions-commission-interim-report 117/176
113
Indeendent Public Service Pensions Commission: Interim Reort - 7 October 2010
7 Transparent and simple
Box 7.A: Summary
• The debate around public service pensions is hampered by a lack of consensus on what
are the key facts and gures and a lack of transparency of the relevant data. This report
seeks to provide as comprehensive a picture as possible in order to supply the basis for
well informed debate. For the nal report the Commission would like to consider ways
in which Government publication of gures can be improved, in content and timing, to
aid transparency and whether there is a case for greater independent scrutiny, including
regular independent reviews of public service pension provision.
• Public service employees need a good understanding of their pension; the choices they
can make and the trade-offs involved; the implications for their income during their
working life and post-retirement. Any reform must avoid the complexity that prevents such
understanding and should be combined with excellent ongoing communication.
• The Commission is interested in investigating further the governance of public servicepension schemes and the legal framework. While responsibilities will differ from those in
private sector schemes, especially for the unfunded schemes, there is a case to consider
whether responsibilities could be clearer thus aiding transparency and sustainability.
• Any public service pension system should seek to maximise value for money in
administration. The Commission will consider whether there are changes that could reduce
current administration costs, assess the impact of reform on future administration costs and
will consider ways to implement change that will ensure value for money.
. Transparency and simplicity are important concepts in the discussion of public servicepension schemes. As has been shown in earlier chapters, there is a lot of confusion overpublic service pensions: their worth and how this is measured. e Commission has tried tobring some clarity to this debate so that any conclusions the Commission draw will be andcan be seen to be, supported by the evidence.
Establishing and publishing the facts
. Current discussions about public service pensions use a wide range of statistics and‘facts’, many of which are contested. is makes it dicult to hold a meaningful debate on
the topic. One of the aims of this report is to build agreement around the facts and guressurrounding the pensions environment and to build a consensus about which of these areimportant, while challenging some of the current myths in circulation.

8/8/2019 Independent Public Service Pensions Commission: Interim Report
http://slidepdf.com/reader/full/independent-public-service-pensions-commission-interim-report 118/176
114
Indeendent Public Service Pensions Commission: Interim Reort - 7 October 2010
. It is also important to ensure that more comprehensive information about pension costsand memberships across public service pension schemes as a whole is published regularly and frequently and is readily accessible to the general public and Parliament, as well as toGovernment. ere has been a considerable increase in the availability of such informationin the last decade, for example, with the publication of pension scheme accounts andgovernment projections of pension costs. However, some of this is not at present publishedto a regular annual timetable, for example, some of the consolidated information aboutaccrued pension liabilities for unfunded pension schemes.
. ere are also issues about the dierent denitions used when presenting gures for
dierent purposes. is will usually reect the wider context in which these pension guresare being set, such as, for example, central government spending, which will exclude mostpension costs relating to schemes run by local authorities. However, it is also important tobring together information about the overall position on schemes run by central and localgovernment and unfunded and funded schemes, in a way that sets out those gures andexplains the dierences in their treatment.
. e information available about individual schemes, or categories of scheme, could alsobe improved. For example, there are not the same annual consolidated overall assessments forthe LGPS schemes as are provided for the biggest unfunded schemes. e overall position inEngland and Wales is obscured by the structure of 89 separate funds that produce their own
accounts and commission their own valuation reports covering the many thousands of LGPSpublic and private sector employers. ere is a lack of published consolidated accounts andreports that might cover the overall position across all funds and list the positions, includingcontribution rates, of individual employers.
.6 It is important to have accurate up-to-date information about overall scheme costsand membership when assessing the current position and implications of possible change.erefore, it also seems important to improve transparency by increasing the quantity andquality of published information about each scheme as a whole – whether unfunded or funded.
. ese issues will be considered further in the recommendations in the Commission’snal report.
Clear understanding of costs and benets
.8 As discussed in Chapter 6 in relation to productivity, current evidence suggests thatmembers do not have a clear understanding of the exact worth of their benets. is doesnot support productivity. is needs to be addressed so that communications and pensionstructures enable members to appreciate the true worth of their pensions as a sizeable partof their remuneration package. Given the accepted lack of knowledge of pensions generally,
including within the public sector, the Commission will be considering in its nal reportthe role and importance of communications with employees regarding the signicance andfuture values of their pensions within their total remuneration package.

8/8/2019 Independent Public Service Pensions Commission: Interim Report
http://slidepdf.com/reader/full/independent-public-service-pensions-commission-interim-report 119/176
115
Indeendent Public Service Pensions Commission: Interim Reort - 7 October 2010
Explaining trade-offs and offering choice
.9 Options recommended in the nal report must not be so complex that scheme memberscannot be expected to understand inherent trade-os. For example, better benets in returnfor higher contributions and working longer, or vice versa.
. Members will need to be able to understand the choices that might be available withinnew scheme structures. For example, at present members can often voluntarily decide tocontribute more to provide additional benets; this might be though extra scheme pension(added pension); extra years of pensionable service (added years) or a separate money
purchase pension (additional voluntary contributions – AVCs). ere might be possibilitiesin future for oering more choices to members around their level of contribution andscheme benets. But the detail of such new arrangements must not be too complex tounderstand or administer.
. It is important that in the Commission’s nal report any long-term structural reformoptions put forward for consideration should be easy to understand by the member andemployer. e costs to the taxpayer of any proposals, together with the costs and benetsassociated with them need to be explained clearly and transparently in a way that interestedparties, the wider public and individual members can understand, including the availability of regular, comprehensive and intelligible information about pension liabilities, payments
and membership.
Clarity over the legal framework and responsibility
. Transparency and simplicity are important features of good governance. Pensionscheme members have a right to know who is responsible for their scheme and themanagement of their benets.
. e governance of public service pension schemes and who is ultimately responsible forthem seems to lack clarity. Whilst schemes are generally made and amended by the Secretary of State appropriate to the scheme in question, the powers conferred and their delegationcan be quite complicated. Sometimes these powers are subject to consultation with, or needthe agreement of, specied bodies. is gives rise to a complicated situation where decisionsmay be taken by many dierent people and of varying seniority in dierent schemes. Whilstin principle the Secretary of State is ultimately responsible for the scheme, it is not clear how much knowledge of the scheme and its administration they should realistically be expectedto have.
. is situation diers markedly from that seen in private sector occupational or personalpensions. For occupational pensions a board of trustees has more direct responsibility for
the scheme, whilst in the personal pensions sector, the pension provider has responsibilitiesaround selling and managing the arrangements they oer.

8/8/2019 Independent Public Service Pensions Commission: Interim Report
http://slidepdf.com/reader/full/independent-public-service-pensions-commission-interim-report 120/176
11
Indeendent Public Service Pensions Commission: Interim Reort - 7 October 2010
. is dierence in approach raises questions over whether current governancearrangements and clarity over the legal framework in public service pension schemes couldand should be improved. For example, if there is a case to introduce greater independentscrutiny and regular independent reviews of public service pensions. e Commission willconsider this issue in its nal report.
.6 Dierences in governance also extend to the arrangements by which members areconsulted about scheme developments. In some cases there are highly formalised structures.Some of these are long established, others have been updated in recent years, for example inresponse to the need to involve member representatives in discussions on pension reforms
and cap and share in particular.
Scheme administration
. e Commission understands that there is wide variation in the administrationcosts across schemes in the public sector, the rationale for which is not always obvious.Furthermore, these costs, at least sometimes, appear to be higher than those of similarschemes in the private sector. e Commission’s nal report will therefore consider pensionscheme administration costs and the scope for rationalisation and cost reduction. is willinclude possible simplication and consolidation of functions across dierent schemes
and units within a scheme. For example, the Commission has received evidence about thenumbers of LGPS funds and how costs vary between them and possible eciencies if thatnumber could be reduced.
.8 Additionally in considering options for reform the Commission will wish totake account of the cost and complexity of implementing reforms and of transitionalarrangements.

8/8/2019 Independent Public Service Pensions Commission: Interim Report
http://slidepdf.com/reader/full/independent-public-service-pensions-commission-interim-report 121/176
117
Indeendent Public Service Pensions Commission: Interim Reort - 7 October 2010
Reform
IndependentPublic Service
Pensions Commission

8/8/2019 Independent Public Service Pensions Commission: Interim Report
http://slidepdf.com/reader/full/independent-public-service-pensions-commission-interim-report 122/176
11
Indeendent Public Service Pensions Commission: Interim Reort - 7 October 2010
8/8/2019 Independent Public Service Pensions Commission: Interim Report
http://slidepdf.com/reader/full/independent-public-service-pensions-commission-interim-report 123/176
11
Indeendent Public Service Pensions Commission: Interim Reort - 7 October 2010
8 Short-term options for reform
Box 8.A: Summary
• The current structure of public service pensions is in need of reform to meet concerns
evidenced in this report, in particular on sustainability, fairness and productivity.
• However, such reform will take time to implement and to take full effect. Increased
longevity, the imbalance between employer and employee contributions and the fact that
total contributions may be too low if the discount rate is too high, suggests there is a case
to make short-term changes, pending more fundamental redesign of schemes.
• There must be proper protection for accrued rights. Therefore changing the benet
structure is not a viable option for making short-term savings.
• There is a rationale for increasing member contributions to ensure a fairer distribution
of costs between taxpayers and members. However, the Commission does not believe it
would be an appropriate short-term measure to introduce member contributions for the
armed forces at this time.
• It is a matter for the Government to decide the manner and level of any increases in
contributions necessary.
• However, they should have regard to protecting the low paid and to the possibility of
signicant increases in the number of employees opting out of schemes and should
consider staging increases in contributions where appropriate, to minimise this risk.
Considering the case for short-term savings
8. e terms of reference invite the Commission to consider the case for deliveringsavings on public service pensions within the spending review period. Pensions are long-term commitments and the most important outcome of the Commission’s work will beestablishing a roadmap for ensuring that public service pensions are well designed for thelong-term.
8. However, in the current scal climate, if the evidence shows there is a need for change,there is a case for taking action that would result in savings within the spending review period. But this action must be consistent with long-term reforms intended to make public
service pensions aordable, sustainable, fair and transparent in the future.
8. As set out in Chapter 4, improvements in longevity have aected all types of pensionsprovision and have increased the cost of paying public service pensions. ese increases in

8/8/2019 Independent Public Service Pensions Commission: Interim Report
http://slidepdf.com/reader/full/independent-public-service-pensions-commission-interim-report 124/176
120
Indeendent Public Service Pensions Commission: Interim Reort - 7 October 2010
cost have generally fallen to the taxpayer, either through increased employer contributionsto schemes, or as a direct subsidy from the Exchequer when benet payments are made. echange in the measure of indexation from RPI to CPI has oset some of these costs andshould be taken into account.
8. In the section on the history of public service pensions the Commission reported how when many schemes were established the intention was to have a fair division of costsbetween the taxpayer and the employee. e Teachers’ Pension Scheme set contributions atve per cent from the employer and ve per cent from the employee in the 1920s. e localgovernment and NHS schemes had similar arrangements so employees were paying around
half of the cost when these schemes were initially established.
8. e position now is nothing like this as shown in Chapter 5. Employees in theseschemes now pay somewhere between a fth and a third of the cost of accrual.
8.6 A further complication is the extent to which the cost of pensions promises are beingproperly accounted for. Pension costs are split between employers and employees afterthe total contributions required have been calculated. is calculation involves using thediscount rate that was discussed in Chapter 4. If the discount rate currently in use by schemes for making calculations about the size of contributions required is too high, thencosts will be underestimated.
8. e Commission is asking the Government to review this rate. If they reach theconclusion that the rate is too high then total contributions to schemes will need to rise. eCommission estimates that reducing the discount rate by half a per cent, for example, couldincrease the total contribution rate by nearly three per cent of pensionable payroll. ere isthen the issue of how this increase is split between employers and employees.
8.8 Because most of the increased costs to date, driven by longevity improvements inparticular, have been nanced by employers in the form of increased contributions, thereis an argument that employees should pay a greater share of the extra cost, as they are theprincipal beneciaries of this unexpected increase in the cost of their pension.
8/8/2019 Independent Public Service Pensions Commission: Interim Report
http://slidepdf.com/reader/full/independent-public-service-pensions-commission-interim-report 125/176
121
Indeendent Public Service Pensions Commission: Interim Reort - 7 October 2010
Options for short term changes
8.9 If the Government decides to make changes in light of the analysis above, then there aretwo main ways of making savings from public service pensions in the short term:
• reduce the level o benefts being paid out; and/or
• increase contributions being paid by active scheme members.
Altering benet levels8. e Government has already taken steps to change how pensions in payment areindexed in line with prices, by changing the measure of movements in prices from RPI toCPI. ere appears limited further scope for reducing the level of benets being paid outin the short-term. Chart 8.A below shows the level of benets as a proportion of GDPprojected to be paid over the next 50 years by the type of member. is illustrates that themajority of benets that will be paid out over the next spending review period are to peoplecurrently in receipt of a pension.
8. e terms of reference for the Commission set out that the review should protect
accrued rights. e pension awards already made and often already in payment are clearly accrued rights and as such should not be aected by changes in pension structures.
8. Most of the other benet payments that will be made over the spending review period are also accrued rights, but belong to current active members who will retire shortly.ere is a fairly large amount of expenditure in this area because of lump sums taken atretirement. Lump sums account for around a fth of payments to pensioners. Governmentcould, in theory, make a saving over the spending review period, by providing incentivesfor people to delay taking their lump sum, or to swap it in exchange for higher ongoingpension payments. However, information provided by police, re and NHS schemes1 showsthat people generally prefer to maximise their lump sum, so schemes would need to oergenerous terms to scheme members to persuade them to give up lump sums. is wouldincrease long-term costs at the expense of short-term savings and is unlikely to oer value formoney to Government.
1 Evidence from scheme returns data provided to IPSPC. In the NHS scheme over half of people retiring chose to commute
some of their pension to receive an even larger lump sum than the minimum amount and 80 per cent of these people
commuted the maximum amount allowed.

8/8/2019 Independent Public Service Pensions Commission: Interim Report
http://slidepdf.com/reader/full/independent-public-service-pensions-commission-interim-report 126/176
122
Indeendent Public Service Pensions Commission: Interim Reort - 7 October 2010
Chart 8.A: Gross benet expenditure by type of member
Source: GAD modelling for IPSPC.
8. It therefore appears that changing the benet structure will have little or no impact within the spending review period. As part of the nal report the Commission will considerchanges to benet structures to ensure that the system is fair and sustainable in the future.ese are outlined in the next chapter.
Increasing employee contributions
8. If the Government wishes to make savings in the short-term it will be more eective toincrease member contributions rather than alter the benet structure.
8. To give an indication of scale, a one percentage point rise in contributions for all activepublic service members could raise around £1 billion per year across the unfunded schemes2 (this is before the eect of tax relief is considered).
8.6 It is up to the Government to decide on changes to the structure and level of employeecontributions. Since eective benet levels vary considerably between dierent schemes,particularly between pre and post reform schemes, then changes to employee contributionscould be made to reect this. However, these dierences will, to some extent, be due tohistoric negotiations around pensions and pay.
2 IPSPC calculations based on data provided by schemes.
0.0%
0.2%
0.4%
0.6%
0.8%
1.0%
1.2%
1.4%
1.6%
1.8%
2.0%
2009/10 2019/20 2029/30 2039/40 2049/50 2059/60
P e r c e n
t a g e o f p r o j e c t e d G D P
Year
Existing pensioners and deferreds Current employees - past service
Current employees - future service Future employees

8/8/2019 Independent Public Service Pensions Commission: Interim Report
http://slidepdf.com/reader/full/independent-public-service-pensions-commission-interim-report 127/176
123
Indeendent Public Service Pensions Commission: Interim Reort - 7 October 2010
8. e Commission’s terms of reference set out that any case for delivering savings shouldbe consistent with the Government’s commitment to protect those on low incomes. is isimportant as an issue of fairness but also because of two important factors:
• it is reasonable to assume that lower paid workers are more likely to opt out o apension scheme than higher paid workers i they ace the same increase in pensioncontributions as a proportion o their salary. This is in no one’s interests, since thesepeople could end up with an inadequate retirement income and could all ontomeans tested benefts later in lie. The Government would lose revenue in the short-term since these people would no longer be paying any contributions to the scheme;
and
• the Commission has shown that in fnal salary schemes, which still dominate thepublic service pension landscape, high yers tend to do better rom schemes. People
with higher pensions also live or longer and so beneft rom pensions or longer.This suggests that there may be a case or targeting contribution increases athigh-earners, or to introduce tiered contribution levels; in a similar way that membercontributions are currently tiered in the local government and NHS schemes.
8.8 To reduce the level of opt-out across the board, the Government should considerstaging any increase in contributions, especially in the context of the current pay freeze.
Although this might appear to reduce savings in the rst few years, if it reduces opt-out levelssuch staging could in fact maximise extra revenue from member contributions at all incomelevels. In addition, the Commission does not believe that member contributions should beintroduced for the armed forces at this time.
Contracting into State Second Pension
8.9 Public service pensions are currently contracted-out of the State Second Pension. ismeans that employers and employees pay lower levels of National Insurance, but employeesare not generally entitled to receive the State Second Pension when they retire. Instead they receive the basic State Pension and their public service pension.
8. Reversing this arrangement and contracting public service pensions into the StateSecond Pension is a potential option for short-term savings, since the extra NationalInsurance contributions from employers and employees would be payable to Government.
8. However, these savings will diminish over time due to announced plans to reducethe contracting out rebate and at rate the State Second Pension. In the long-term, in theabsence of further reforms, there would be a cost to contracting in public service pensions,since extra State Second Pension paid out in the future will outweigh the short-term savings.
ere would also be considerable administrative issues to overcome. As such, this optiondoes not look attractive from a value for money perspective in the long-term.

8/8/2019 Independent Public Service Pensions Commission: Interim Report
http://slidepdf.com/reader/full/independent-public-service-pensions-commission-interim-report 128/176
124
Indeendent Public Service Pensions Commission: Interim Reort - 7 October 2010

8/8/2019 Independent Public Service Pensions Commission: Interim Report
http://slidepdf.com/reader/full/independent-public-service-pensions-commission-interim-report 129/176
125
Indeendent Public Service Pensions Commission: Interim Reort - 7 October 2010
9 Long-term structural reform
Box 9.A: Summary
• The current public service pension system has been unable to respond exibly to changes
in demographics over the past few decades and the need for greater mobility between the
public and other sectors.
• This system has led to disproportionate benets for some – high yers accruing more
generous levels of benets than low yers – and an unfair division of costs between the
employer and the employee.
• Long-term structural reform is needed as these issues cannot be dealt with through
provision of traditional nal salary dened benet schemes. But neither can they be dealt
with appropriately through a funded, individual account, dened contribution model for all
employees, which would place a major nancing burden on taxpayers, ignore the ability of
Government as a large employer to manage certain types of risk and increase uncertainty
of post-retirement income for scheme members, which is difcult in particular for the lowpaid to manage.
• An alternative scheme model that provides a fair sharing of risk between the employer and
employee; and adequate pensions for members is needed.
• In the Commission’s nal report a range of alternative structures will be considered,
drawing upon international experiences and other risk sharing models.
• This will enable the Commission to make a recommendation on a sustainable framework
for a new pensions deal for the public service.
9. Given the evidence presented in this report, there is a case for longer-term structuralreform that deals with issues not dealt with eectively under the current system:
• the rising costs o benefts due in particular to increasing longevity;
• the changing periods o time spent in work and retirement and how pensions – andpension ages in particular – can respond more exibly to these changes;
• the unequal treatment o members within the same proessional group, in particularthe disproportionate benefts earned by high yers in fnal salary defned beneft
schemes when compared to low yers;
• the greater need to acilitate, or at least not prevent, many dierent ways o providing public services and mobility between public and private sectors;
8/8/2019 Independent Public Service Pensions Commission: Interim Report
http://slidepdf.com/reader/full/independent-public-service-pensions-commission-interim-report 130/176
12
Indeendent Public Service Pensions Commission: Interim Reort - 7 October 2010
• the possibilities or increasing choice over contributions and pension terms;
• the airer sharing o costs between employees and employers and taxpayers; and
• the management o risk and uncertainty.
9. is range of issues cannot be tackled through provision of nal salary dened benetschemes. But neither would it be feasible or desirable to move towards a funded, individualaccount DC model for all public service employees. Apart from the major nancingburden on the current generation of taxpayers, who would have to pay for both employer
contributions and current benet payments, this ignores the ability of Government as a largeemployer to pool and manage certain types of risk better than individuals. In addition, if lower paid employees were fully exposed to investment risk, this would increase uncertainty of income in retirement, which is dicult in particular for the low paid to manage. is isnot desirable or necessary. Instead, the public service should aim to identify an appropriate
way of sharing the uncertainties and risks inherent in pension provision between both theemployee and employer.
9. As part of taking this work forward the Commission will be examining innovativeinternational models. For example, Sweden manages to share risk in an unfunded modelthrough a particular type of notional dened contribution arrangement. is gives individuals
more certainty about their accruals than in traditional DC schemes, but also shares the risk of increasing longevity through calculating annuities using life expectancy factors.
9. In the Netherlands, their funded collective DC schemes move the onus of risk fromthe employer to the members, by using solvency margins and conditional indexation whiletargeting career average pensions.
9. Meanwhile, Poland and other countries may have some interesting lessons in how they have introduced top-up funded DC elements into their pension provision.
9.6 However, the Commission will not be conning itself to international lessons, but willalso be examining the whole range of schemes available where the risk is not solely placed onthe employer or the employee.
9. is will include:
• career average defned beneft schemes that include ways to share risk and givemembers a pension pot ater each period o membership (usually a year) that is basedon a percentage o the salary earned in that year. Those pots are then usually revalued(‘dynamised’) until the date a pension is taken by a actor related to prices or nationalor occupational earnings. Those individual pension pots are then added together or
periods o scheme membership to produce an overall pension;
8/8/2019 Independent Public Service Pensions Commission: Interim Report
http://slidepdf.com/reader/full/independent-public-service-pensions-commission-interim-report 131/176
127
Indeendent Public Service Pensions Commission: Interim Reort - 7 October 2010
• notional DC schemes with added protections that, while not being unded,still determine the value o pensions at retirement by an assumed return oncontributions and an annuity rate or rates. In theory the latter might be linked tothose available in the market at retirement or at various periods o time while theperson was a scheme member, but to provide reasonable certainty would have addedprotections such as an annuity rate wholly or partly set by the provider on the basiso their own assessment o longevity risk and the proportion o that risk to be borneby members;
• collective DC schemes where all contributions are placed into one und that is
then managed on behal o the members. As in standard DC schemes, members’pensions will vary according to the value o the underlying investments. However, within collective DC schemes there is the option to use inter-generational sharing tosmooth the eects o market conditions;
• cash balance schemes where the employer puts a notional amount into the member’spot every year, which is then guaranteed. This credit can be expressed as a percentageo salary or each year worked. I cash contributions rom the employee andemployer, plus investment returns, do not match the promised ‘notional credit’then the employer will have to meet any shortall. On retirement the resulting ‘cashbalance’ can be used either to purchase an annuity or to make other arrangements
or retirement;
• sequential hybrids (or nursery schemes) that are schemes with more than one sectionor part where a member may earn both a DB pension and DC pension during theircareer with an employer. Members, however, would be earning either DB or DCbenefts at any one time;
• capped DB schemes, where there is a limit on the amount o salary that counts orpension purposes or on pension payments rom the scheme; and
• combination hybrids, where members simultaneously earn benefts that are part DBand part DC. For example, a capped DB pension, based on earnings up to a certainlevel and a DC beneft on earnings above this level.
9.8 e Commission will also consider elements of to scheme design such as:
• ensuring normal pension ages are in line with latest developments in longevity;
• reviewing rules around changes to pension payments when they are taken beore orater normal pension age to increase labour market exibility;
• the implications o dierent indexation options or pension costs and incomes overtime; and
• accrual rates in the dierent schemes.

8/8/2019 Independent Public Service Pensions Commission: Interim Report
http://slidepdf.com/reader/full/independent-public-service-pensions-commission-interim-report 132/176
12
Indeendent Public Service Pensions Commission: Interim Reort - 7 October 2010
9.9 In deciding what pension design or designs might be more appropriate for the future theCommission will also take account of decisions on the new framework for pensions taxation.
9. Likewise, when considering what pension ages might be appropriate and whetherpublic service pensions might continue to be contracted out of the State Second Pension, theCommission will take into account any further developments in the levels of State pensionbenets; the ages at which they are available; and the arrangements for contracting out of theState Second Pension.
9. It will be necessary to consider the case for and against greater simplicity in numbers and
types of scheme and greater exibility for individual employers to determine pension designs,as well as who should be eligible for participation in schemes.
9. e Commission will also be considering the extent of accrued rights, their protectionand the implications for future pensions terms. e Commission is clear that protectingaccrued rights does not extend as far as protecting current terms for future pension accrual.
9. Pension awards already made would not be changed and neither would the years of pensionable service built up so far, based on a particular pension age, that have been accruedby those still building up pension rights.
9. However, after giving appropriate notice and meeting requirements for consultation onchanges to scheme rules and any other legal requirements needed to manage the process of reform going forward, it should be possible to make changes to pension schemes for existingmembers relating to their future service. But, when deciding on the timing and nature of any reforms, it will be necessary to bear in mind that some of the present benets, such asfor death and dependants, are a form of long-term insurance. at will also need to be takeninto account, when making recommendations.
Implementing change
9. When the Commission considers options in the nal report, it will need to ensurethat both the transitional arrangements for moving from current to new structures and thelonger-term structures result in:
• the protection o the range o accrued entitlements provided by pension schemes;
• providing an eective transition to new ways o providing or retirement pensionsand protections against risk o ill health, death and redundancy; and
• the ability to practically implement reorms, taking account o the wide range and
diversity o public service groups that will be aected.
9.6 at will require appropriate planning, timetabling and administrative resources, bothin personnel and systems.

8/8/2019 Independent Public Service Pensions Commission: Interim Report
http://slidepdf.com/reader/full/independent-public-service-pensions-commission-interim-report 133/176

8/8/2019 Independent Public Service Pensions Commission: Interim Report
http://slidepdf.com/reader/full/independent-public-service-pensions-commission-interim-report 134/176
130
Indeendent Public Service Pensions Commission: Interim Reort - 7 October 2010
8/8/2019 Independent Public Service Pensions Commission: Interim Report
http://slidepdf.com/reader/full/independent-public-service-pensions-commission-interim-report 135/176
131
Indeendent Public Service Pensions Commission: Interim Reort - 7 October 2010
Annexes
IndependentPublic Service
Pensions Commission

8/8/2019 Independent Public Service Pensions Commission: Interim Report
http://slidepdf.com/reader/full/independent-public-service-pensions-commission-interim-report 136/176
132
Indeendent Public Service Pensions Commission: Interim Reort - 7 October 2010
8/8/2019 Independent Public Service Pensions Commission: Interim Report
http://slidepdf.com/reader/full/independent-public-service-pensions-commission-interim-report 137/176
133
Indeendent Public Service Pensions Commission: Interim Reort - 7 October 2010
A The Commission’s terms ofreference
A. e terms of reference for the ISPSPC were published on 20 June 2010.
Terms of referenceTo conduct a fundamental structural review of public service pension provision and to makerecommendations to the Chancellor and Chief Secretary on pension arrangements that aresustainable and aordable in the long term, fair to both the public service workforce and thetaxpayer and consistent with the scal challenges ahead, while protecting accrued rights.
In reaching its recommendations, the Commission is to have regard to:
• the growing disparity between public service and private sector pension provision, inthe context o the overall reward package – including the impact on labour market
mobility between public and private sectors and pensions as a barrier to greaterplurality o provision o public services;
• the needs o public service employers in terms o recruitment and retention;
• the need to ensure that uture provision is air across the workorce;
• how risk should be shared between the taxpayer and employee;
• which organisations should have access to public service schemes;
• implementation and transitional arrangements or any recommendations; and
• wider Government policy to encourage adequate saving or retirement and longer working lives.
As part of the review, the Commission is invited to produce an interim report by theend of September 2010. is should consider the case for delivering savings on publicservice pensions within the spending review period – consistent with the Government’scommitment to protect those on low incomes – to contribute towards the reduction of thestructural decit. e commission is invited to produce the nal report in time for Budget
2011.

8/8/2019 Independent Public Service Pensions Commission: Interim Report
http://slidepdf.com/reader/full/independent-public-service-pensions-commission-interim-report 138/176
134
Indeendent Public Service Pensions Commission: Interim Reort - 7 October 2010
Scheme coverage • For civil servants:
• Principal Civil Service Pension Scheme
• Principal Civil Service Pension Scheme (Northern Ireland)
• Armed Forces Pension Scheme
• For NHS employees:
• NHS Pension Scheme
• NHS Superannuation Scheme (Scotland)
• Health and Personal Social Services Northern Ireland Superannuation Scheme
• For teachers:
• Teachers’ Pension Scheme (England and Wales)
• Scottish Teachers’ Superannuation Scheme
• Northern Ireland Teachers’ Superannuation Scheme
• For Local Government:
• Local Government Pension Scheme (England and Wales)
• Local Government Pension Scheme (Scotland)
• Northern Ireland Local Government Pension Scheme
• Police Pension Scheme (administered locally)
• Firefghters’ Pension Scheme (administered locally)
• United Kingdom Atomic Energy Authority Pension Schemes
• Judicial Pensions Scheme
• Department or international Development – Overseas Superannuation Scheme
• Research Councils’ Pension Schemes
In addition to the schemes mentioned above, there are a number of smaller schemes andmany established to cover only one senior appointment which do not specically need toform part of the review but which will be required to act on the recommendations.
8/8/2019 Independent Public Service Pensions Commission: Interim Report
http://slidepdf.com/reader/full/independent-public-service-pensions-commission-interim-report 139/176
135
Indeendent Public Service Pensions Commission: Interim Reort - 7 October 2010
B Comparison of the differentpublic service pension schemes
Table B.1 is designed to provide a general overview of the main (larger) public servicepension schemes. It is acknowledged that there are a number of complex rules which aectscheme membership and that some members may be entitled to dierent terms than those
outlined here.
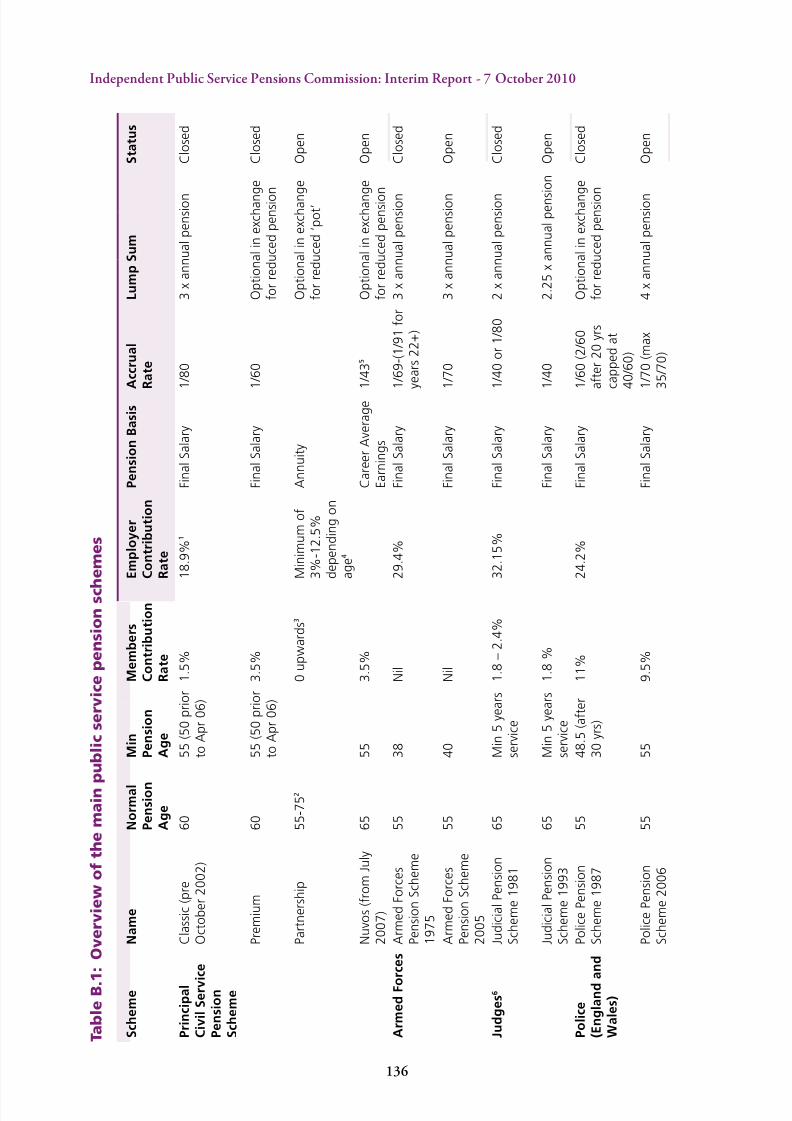
8/8/2019 Independent Public Service Pensions Commission: Interim Report
http://slidepdf.com/reader/full/independent-public-service-pensions-commission-interim-report 140/176
13
Indeendent Public Service Pensions Commission: Interim Reort - 7 October 2010
T a b l e B . 1 : O v e r v i e w
o f t h e m a i n p u b l i c s e r v i c e p e n s i o n s c h e m e s
S c h e m e
N a m e
N o r m a l
P e n s i o n
A g e
M i n
P e n s i o n
A g e
M e m b e r s
C o n t r i b u t i o n
R a t e
E m p l o y e r
C o n t r i b u t i o n
R a t e
P e n s i o n B a s i s
A c c r u a l
R a t e
L u m p S u m
S t a t u s
P r i n c i p a l
C i v i l S e r v i c e
P e n s i o n
S c h e m e
C l a s s i c ( p r e
O c t o b e r 2 0 0 2 )
6 0
5 5 ( 5 0 p r i o r
t o A p r 0 6 )
1 . 5 %
1 8 . 9 % 1
F i n a l S a l a r y
1 / 8 0
3 x a n n u a l p e n s i o n
C l o s e d
P r e m i u m
6 0
5 5 ( 5 0 p r i o r
t o A p r 0 6 )
3 . 5 %
F i n a l S a l a r y
1 / 6 0
O p t i o n a l i n e x c h a n g e
f o r r e d u c e d p e n s i o n
C l o s e d
P a r t n e r s h i p
5 5 - 7 5 2
0 u p w a r d s 3
M i n i m u m o f
3 % - 1 2 . 5 %
d e p e n d i n g o n
a g e 4
A n n u i t y
O p t i o n a l i n e x c h a n g e
f o r r e d u c e d ‘ p o t ’
O p e n
N u v o s ( f r o m J u l y
2 0 0 7 )
6 5
5 5
3 . 5 %
C a r e e r A v e r a g e
E a r n i n g s
1 / 4 3 5
O p t i o n a l i n e x c h a n g e
f o r r e d u c e d p e n s i o n
O p e n
A r m e d F o
r c e s A r m e d F o r c e s
P e n s i o n S c h e m e
1 9 7 5
5 5
3 8
N i l
2 9 . 4 %
F i n a l S a l a r y
1 / 6 9 - ( 1 / 9 1 f o r
y e a r s 2 2 + )
3 x a n n u a l p e n s i o n
C l o s e d
A r m e d F o r c e s
P e n s i o n S c h e m e
2 0 0 5
5 5
4 0
N i l
F i n a l S a l a r y
1 / 7 0
3 x a n n u a l p e n s i o n
O p e n
J u d g e s 6
J u d i c i a l P e n s i o n
S c h e m e 1 9 8 1
6 5
M i n 5 y e a r s
s e r v i c e
1 . 8 – 2 . 4 %
3 2 . 1 5 %
F i n a l S a l a r y
1 / 4 0 o r 1 / 8 0
2 x a n n u a l p e n s i o n
C l o s e d
J u d i c i a l P e n s i o n
S c h e m e 1 9 9 3
6 5
M i n 5 y e a r s
s e r v i c e
1 . 8 %
F i n a l S a l a r y
1 / 4 0
2 . 2 5 x a n n u a l p e n s
i o n
O p e n
P o l i c e
( E n g l a n d
a n d
W a l e s )
P o l i c e P e n s i o n
S c h e m e 1 9 8 7
5 5
4 8 . 5 ( a f t e r
3 0 y r s )
1 1 %
2 4 . 2 %
F i n a l S a l a r y
1 / 6 0 ( 2 / 6 0
a f t e r 2 0 y r s
c a p p e d a t
4 0 / 6 0 )
O p t i o n a l i n e x c h a n g e
f o r r e d u c e d p e n s i o n
C l o s e d
P o l i c e P e n s i o n
S c h e m e 2 0 0 6
5 5
5 5
9 . 5 %
F i n a l S a l a r y
1 / 7 0 ( m a x
3 5 / 7 0 )
4 x a n n u a l p e n s i o n
O p e n
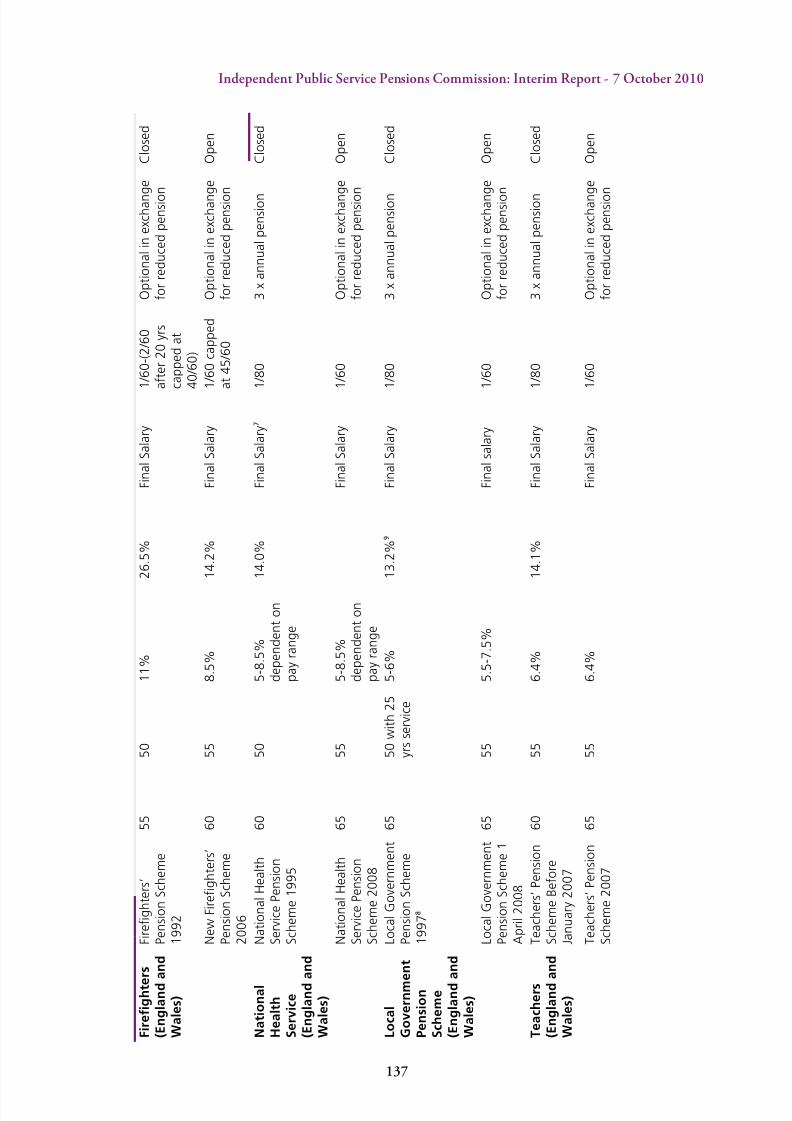
8/8/2019 Independent Public Service Pensions Commission: Interim Report
http://slidepdf.com/reader/full/independent-public-service-pensions-commission-interim-report 141/176
137
Indeendent Public Service Pensions Commission: Interim Reort - 7 October 2010
F i r e g h t e
r s
( E n g l a n d
a n d
W a l e s )
F i r e g h t e r s ’
P e n s i o n S c h e m e
1 9 9 2
5 5
5 0
1 1 %
2 6 . 5 %
F i n a l S a l a r y
1 / 6 0 - ( 2 / 6 0
a f t e r 2 0 y r s
c a p p e d a t
4 0 / 6 0 )
O p t i o n a l i n e x c h a n g e
f o r r e d u c e d p e n s i o n
C l o s e d
N e w F i r e g h t e r s ’
P e n s i o n S c h e m e
2 0 0 6
6 0
5 5
8 . 5 %
1 4 . 2 %
F i n a l S a l a r y
1 / 6 0 c a p p e d
a t 4 5 / 6 0
O p t i o n a l i n e x c h a n g e
f o r r e d u c e d p e n s i o n
O p e n
N a t i o n a l
H e a l t h
S e r v i c e
( E n g l a n d
a n d
W a l e s )
N a t i o n a l H e a l t h
S e r v i c e P e n s i o n
S c h e m e 1 9 9 5
6 0
5 0
5 - 8 . 5 %
d e p e n d e n t o n
p a y r a n g e
1 4 . 0 %
F i n a l S a l a r y 7
1 / 8 0
3 x a n n u a l p e n s i o n
C l o s e d
N a t i o n a l H e a l t h
S e r v i c e P e n s i o n
S c h e m e 2 0 0 8
6 5
5 5
5 - 8 . 5 %
d e p e n d e n t o n
p a y r a n g e
F i n a l S a l a r y
1 / 6 0
O p t i o n a l i n e x c h a n g e
f o r r e d u c e d p e n s i o n
O p e n
L o c a l
G o v e r n m e n t
P e n s i o n
S c h e m e
( E n g l a n d
a n d
W a l e s )
L o c a l G o v e r n m e n t
P e n s i o n S c h e m e
1 9 9 7 8
6 5
5 0 w i t h 2 5
y r s s e r v i c e
5 - 6 %
1 3 . 2 % 9
F i n a l S a l a r y
1 / 8 0
3 x a n n u a l p e n s i o n
C l o s e d
L o c a l G o v e r n m e n t
P e n s i o n S c h e m e 1
A p r i l 2 0 0 8
6 5
5 5
5 . 5 - 7 . 5 %
F i n a l s a l a r y
1 / 6 0
O p t i o n a l i n e x c h a n g e
f o r r e d u c e d p e n s i o n
O p e n
T e a c h e r s
( E n g l a n d
a n d
W a l e s )
T e a c h e r s ’ P e n s i o n
S c h e m e B e f o r e
J a n u a r y 2 0 0 7
6 0
5 5
6 . 4 %
1 4 . 1 %
F i n a l S a l a r y
1 / 8 0
3 x a n n u a l p e n s i o n
C l o s e d
T e a c h e r s ’ P e n s i o n
S c h e m e 2 0 0 7
6 5
5 5
6 . 4 %
F i n a l S a l a r y
1 / 6 0
O p t i o n a l i n e x c h a n g e
f o r r e d u c e d p e n s i o n
O p e n

8/8/2019 Independent Public Service Pensions Commission: Interim Report
http://slidepdf.com/reader/full/independent-public-service-pensions-commission-interim-report 142/176
13
Indeendent Public Service Pensions Commission: Interim Reort - 7 October 2010
Notes
1 This is a weighted average of employer rates that vary by level of pensionable pay. The average was reduced to 18.9%
from April 2009.
2 No specic NPA as such – date at which this DC stakeholder pension is taken is limited only by tax rules.
3 Members do not have to contribute, but where they do the employer provides additional employer contributions that
match the employees’ contributions, up to a ceiling of 3% of pay.
4 The rate of minimum employer contribution varies by age from 3% below age 21 to 12.5% at age 46 and above.
5 The annual amounts of pension earned before a pension is awarded are uprated by prices, not earnings, using the same
price index as used for pensions once awarded (formerly RPI, now CPI from April 2011).
6 Some Judicial Ofcers had different rates of accrual, minimum service requirements and minimum age before pensions
could be drawn. The gures shown reect the position of the majority.
7 Pensions for General Practitioners in the NHS Scheme are based on career average salaries.
8 The LGPS 97 was closed wef 31 March 2008 with reserved rights to benets earned to that date. Members were
automatically transferred to the new scheme on 1 April 2008.
9 As at March 2010, based on a notional national model fund valuation using 2007 data and excludes the investment
surpluses and decits on individual local authority pension funds.
8/8/2019 Independent Public Service Pensions Commission: Interim Report
http://slidepdf.com/reader/full/independent-public-service-pensions-commission-interim-report 143/176
13
Indeendent Public Service Pensions Commission: Interim Reort - 7 October 2010
C Projection of future benetexpenditure on public service
pensions
C. In December 2009 the Government Actuary’s Department (GAD) producedprojections for HM Treasury to inform the December 2009 Long-term public nancereport. ese projections and the assumptions underlying them1 were discussed in the
National Audit Oce’s March 2010 report on the cost of public service pensions.
2
eseprojections exclude the cost of funded schemes such as the Local Government PensionScheme (LGPS).
C. e Commission asked GAD to update their analysis for a number of developmentssince these results were made available.
C. e key updates the Commission asked GAD to allow for were:
• the change in pensions indexation rom RPI to CPI ination ollowing theChancellor’s announcement in the Budget on June 2010;
• the short-term pay reeze, and short-term public sector workorce reductions as setout in the Ofce o Budget Responsibility’s 13 July 2010 document;3 and
• a central public service workorce growth assumption o 0.25 per cent per annum,responding to the main criticism o the December 2009 projections in the NAO’sreport above, which assumed zero public service workorce growth.
RPI to CPI
C. e Commission asked GAD to assume that in the future pensions in payment anddeferment will increase, and career average benets will revalue, by CPI rather than RPIination.
C. In the short-term the Commission requested that GAD base CPI and RPI assumptionson the most recent forecasts produced by the Oce of Budget Responsibility. ese aredetailed in Table C.1.
1 http://www.gad.gov.uk/Documents/Occupational%20Pensions/December_2009_Cashow_Projections_Methodology_
data_and_assumptions.pdf
2 http://www.nao.org.uk/publications/0910/public_service_pensions.aspx
3 http://budgetresponsibility.independent.gov.uk/d/general_gov_employment_forecast_130710.pdf
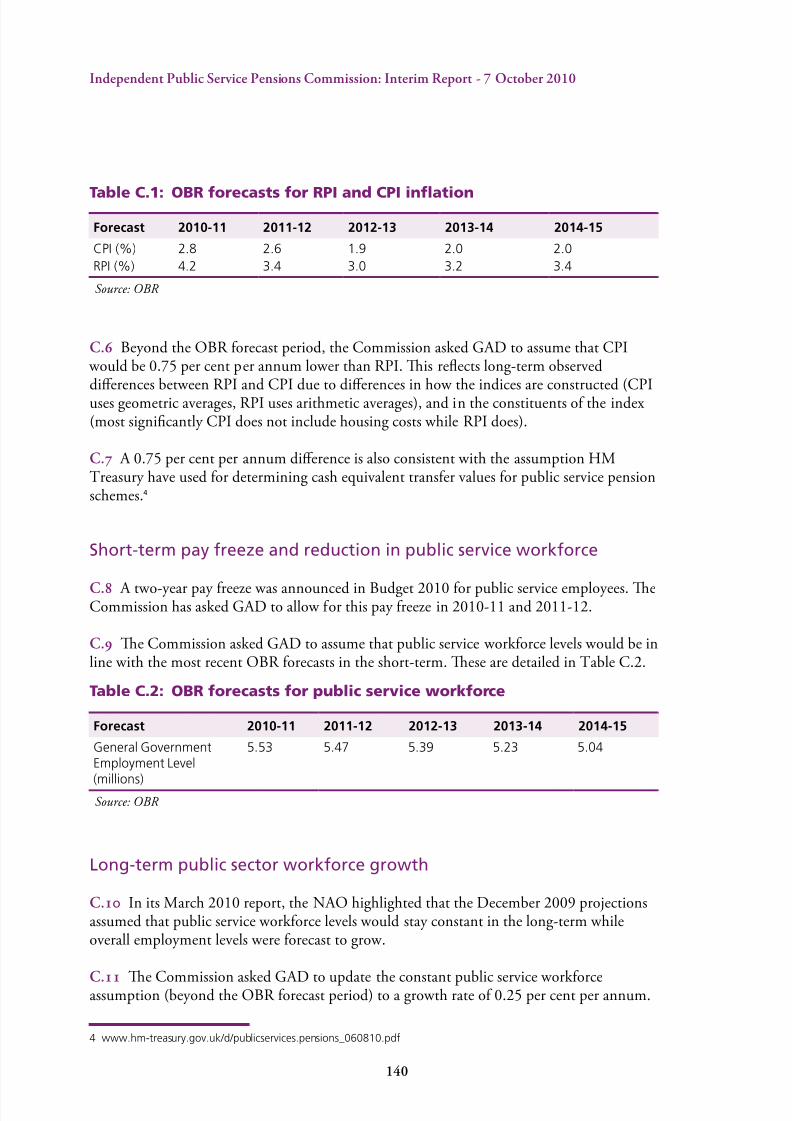
8/8/2019 Independent Public Service Pensions Commission: Interim Report
http://slidepdf.com/reader/full/independent-public-service-pensions-commission-interim-report 144/176
140
Indeendent Public Service Pensions Commission: Interim Reort - 7 October 2010
Table C.1: OBR forecasts for RPI and CPI ination
Forecast 2010-11 2011-12 2012-13 2013-14 2014-15
CPI (%) 2.8 2.6 1.9 2.0 2.0
RPI (%) 4.2 3.4 3.0 3.2 3.4
Source: OBR
C.6 Beyond the OBR forecast period, the Commission asked GAD to assume that CPI would be 0.75 per cent per annum lower than RPI. is reects long-term observed
dierences between RPI and CPI due to dierences in how the indices are constructed (CPIuses geometric averages, RPI uses arithmetic averages), and in the constituents of the index(most signicantly CPI does not include housing costs while RPI does).
C. A 0.75 per cent per annum dierence is also consistent with the assumption HMTreasury have used for determining cash equivalent transfer values for public service pensionschemes.4
Short-term pay freeze and reduction in public service workforce
C.8 A two-year pay freeze was announced in Budget 2010 for public service employees. eCommission has asked GAD to allow for this pay freeze in 2010-11 and 2011-12.
C.9 e Commission asked GAD to assume that public service workforce levels would be inline with the most recent OBR forecasts in the short-term. ese are detailed in Table C.2.
Table C.2: OBR forecasts for public service workforce
Forecast 2010-11 2011-12 2012-13 2013-14 2014-15
General GovernmentEmployment Level
(millions)
5.53 5.47 5.39 5.23 5.04
Source: OBR
Long-term public sector workforce growth
C. In its March 2010 report, the NAO highlighted that the December 2009 projectionsassumed that public service workforce levels would stay constant in the long-term whileoverall employment levels were forecast to grow.
C. e Commission asked GAD to update the constant public service workforceassumption (beyond the OBR forecast period) to a growth rate of 0.25 per cent per annum.
4 www.hm-treasury.gov.uk/d/publicservices.pensions_060810.pdf
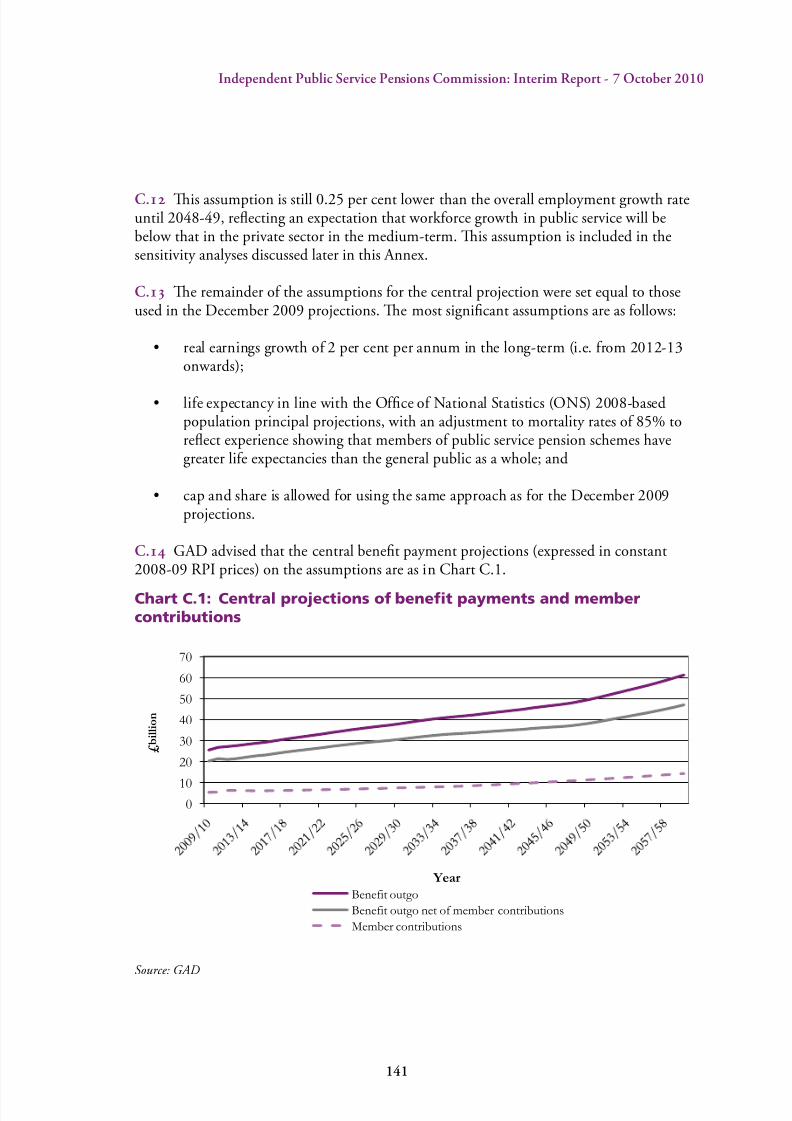
8/8/2019 Independent Public Service Pensions Commission: Interim Report
http://slidepdf.com/reader/full/independent-public-service-pensions-commission-interim-report 145/176
141
Indeendent Public Service Pensions Commission: Interim Reort - 7 October 2010
C. is assumption is still 0.25 per cent lower than the overall employment growth rateuntil 2048-49, reecting an expectation that workforce growth in public service will bebelow that in the private sector in the medium-term. is assumption is included in thesensitivity analyses discussed later in this Annex.
C. e remainder of the assumptions for the central projection were set equal to thoseused in the December 2009 projections. e most signicant assumptions are as follows:
• real earnings growth o 2 per cent per annum in the long-term (i.e. rom 2012-13onwards);
• lie expectancy in line with the Ofce o National Statistics (ONS) 2008-basedpopulation principal projections, with an adjustment to mortality rates o 85% toreect experience showing that members o public service pension schemes havegreater lie expectancies than the general public as a whole; and
• cap and share is allowed or using the same approach as or the December 2009projections.
C. GAD advised that the central benet payment projections (expressed in constant2008-09 RPI prices) on the assumptions are as in Chart C.1.
Chart C.1: Central projections of benet payments and membercontributions
Source: GAD
010
20
30
40
50
60
70
£ b
n
Year
Benefit outgo
Benefit outgo net of member contributions
Member contributions
£ b i l l i o n

8/8/2019 Independent Public Service Pensions Commission: Interim Report
http://slidepdf.com/reader/full/independent-public-service-pensions-commission-interim-report 146/176
142
Indeendent Public Service Pensions Commission: Interim Reort - 7 October 2010
C. Benet payments in constant RPI terms are expected to rise from around £25 billionin 2009-10 to over £60 billion in 2059-60. Employee contributions are expected to risefrom around £5 billion in 2009-10 to around £14 billion in 2059-60.
C.6 e results were then combined with GDP projections (also at constant 2008-09 RPIprices) to show benet payments as a proportion of GDP.
GDP projections
C. e Commission constructed GDP projections by using the 2008-09 outturn andGDP growth projections to 2015-16 as contained in the OBR forecast, these are detailed inTable C.3.
Table C.3: OBR forecasts for GDP growth
Forecast 2009-10 2010-11 2011-12 2012-13 2013-14 2014-15 2015-16
Real GDP growth (%) -3.7 1.8 2.4 2.9 2.8 2.7 2.7
Source OBR
C.8 Beyond 2016-17, the Commission used GDP growth projections in line with the
principal GDP growth projections in the December 2009 Long-term public nance report.e signicant underlying assumptions for these projections are as follows:
• productivity growth o 2 per cent per annum;
• employment growth o 0.5 per cent per annum until 2048-49, and then 0.25 percent rom 2049-50 to 2059; and
• there is consistency in the long-term assumptions between beneft payments andGDP projections. For example, long-term real earnings growth is set equal toproductivity growth in both sets o projections.
Historical benet payments as a percentage of GDP
C.9 e Commission also calculated benet payments as a percentage of GDP from1999-2000 onwards to provide some historical context for the projections. ese gures arealso in constant 2008-09 RPI prices and were calculated using GDP gures from the Oceof National Statistics and using benet payments and employee contributions based ongures for the four largest unfunded schemes from the National Audit Oce’s March 2010report on the cost of public service pensions.
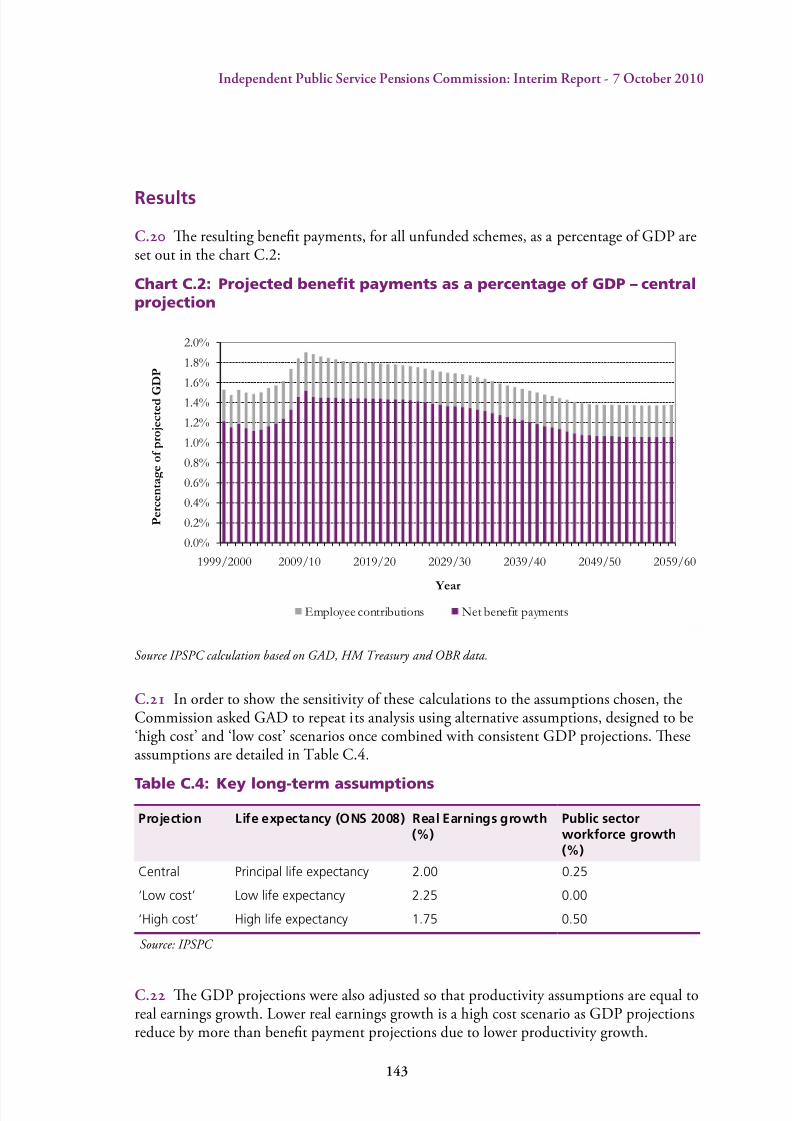
8/8/2019 Independent Public Service Pensions Commission: Interim Report
http://slidepdf.com/reader/full/independent-public-service-pensions-commission-interim-report 147/176
143
Indeendent Public Service Pensions Commission: Interim Reort - 7 October 2010
Results
C. e resulting benet payments, for all unfunded schemes, as a percentage of GDP areset out in the chart C.2:
Chart C.2: Projected benet payments as a percentage of GDP – centralprojection
Source IPSPC calculation based on GAD, HM reasury and OBR data.
C. In order to show the sensitivity of these calculations to the assumptions chosen, theCommission asked GAD to repeat its analysis using alternative assumptions, designed to be‘high cost’ and ‘low cost’ scenarios once combined with consistent GDP projections. eseassumptions are detailed in Table C.4.
Table C.4: Key long-term assumptions
Projection Life expectancy (ONS 2008) Real Earnings growth(%)
Public sectorworkforce growth(%)
Central Principal life expectancy 2.00 0.25
‘Low cost’ Low life expectancy 2.25 0.00
‘High cost’ High life expectancy 1.75 0.50
Source: IPSPC
C. e GDP projections were also adjusted so that productivity assumptions are equal toreal earnings growth. Lower real earnings growth is a high cost scenario as GDP projectionsreduce by more than benet payment projections due to lower productivity growth.
0.0%
0.2%
0.4%
0.6%
0.8%
1.0%
1.2%
1.4%
1.6%
1.8%
2.0%
1999/2000 2009/10 2019/20 2029/30 2039/40 2049/50 2059/60
P e r c e n t a g e o f p r o j e c t e d G
D P
Year
Employee contributions Net benefit payments

8/8/2019 Independent Public Service Pensions Commission: Interim Report
http://slidepdf.com/reader/full/independent-public-service-pensions-commission-interim-report 148/176
144
Indeendent Public Service Pensions Commission: Interim Reort - 7 October 2010
C. e eect of changing these assumptions on benet payments in constant RPI pricescan be seen in the Chart C.3.
Chart C.3: Projected benet payments at constant 2008-09 RPI prices
Source: GAD.
C. It can be seen that the eect of higher real earnings growth in the low cost scenariois more than oset by the lower life expectancy and public sector workforce growth. ereverse is true in the high cost scenario. Broadly, actual benet payments vary little betweenthe scenarios.
C. e main dierence arises when equivalent assumptions are applied to the GDPprojections in terms of productivity growth and longevity. is gives the results detailed inChart C.4.
20
25
30
35
40
45
50
55
60
65
2009/10 2019/20 2029/30 2039/40 2049/50 2059/60
£ b n
Year
Central High cost Low cost
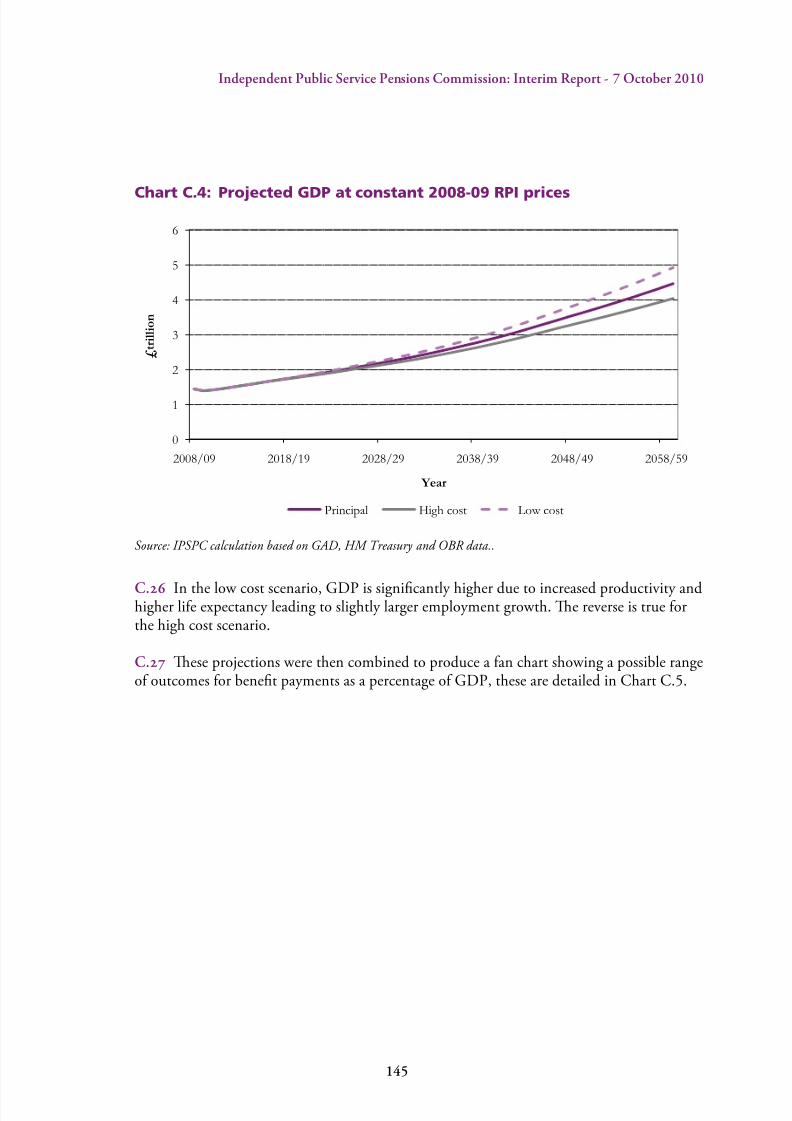
8/8/2019 Independent Public Service Pensions Commission: Interim Report
http://slidepdf.com/reader/full/independent-public-service-pensions-commission-interim-report 149/176
145
Indeendent Public Service Pensions Commission: Interim Reort - 7 October 2010
Chart C.4: Projected GDP at constant 2008-09 RPI prices
Source: IPSPC calculation based on GAD, HM reasury and OBR data..
C.6 In the low cost scenario, GDP is signicantly higher due to increased productivity andhigher life expectancy leading to slightly larger employment growth. e reverse is true forthe high cost scenario.
C. ese projections were then combined to produce a fan chart showing a possible rangeof outcomes for benet payments as a percentage of GDP, these are detailed in Chart C.5.
0
1
2
3
4
5
6
2008/09 2018/19 2028/29 2038/39 2048/49 2058/59
£ t r i l l i o n
Year
Principal High cost Low cost
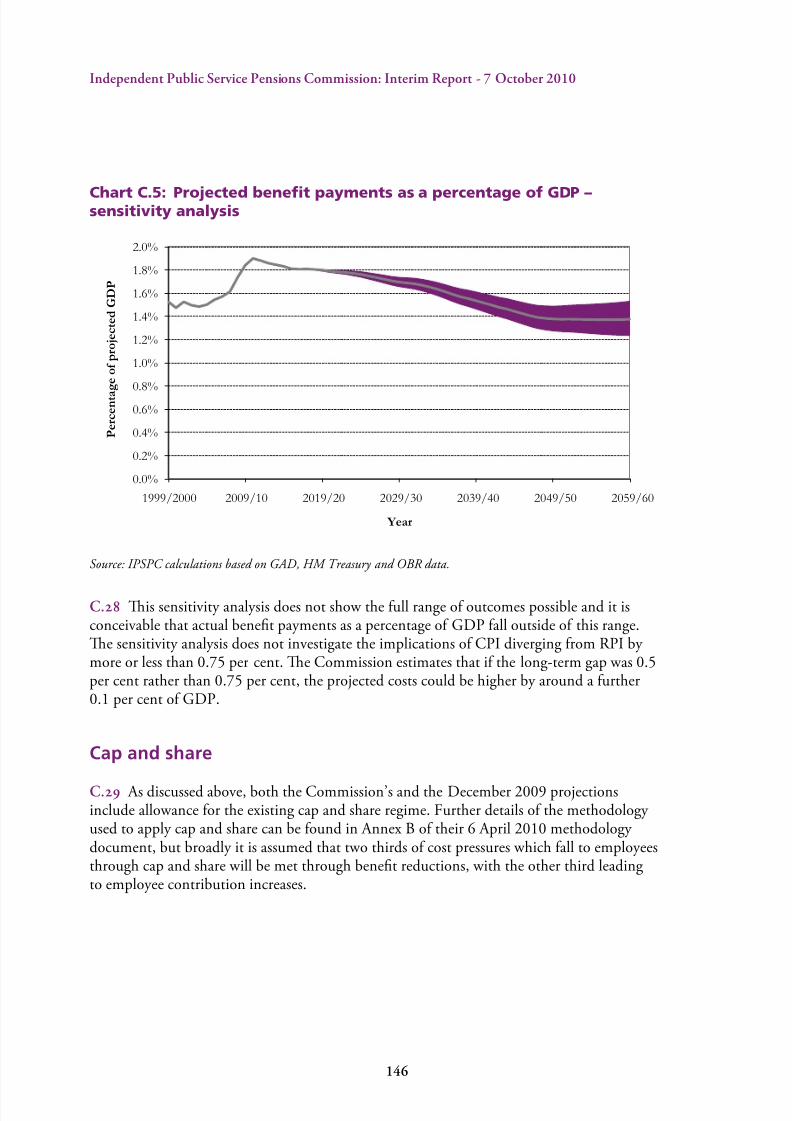
8/8/2019 Independent Public Service Pensions Commission: Interim Report
http://slidepdf.com/reader/full/independent-public-service-pensions-commission-interim-report 150/176
14
Indeendent Public Service Pensions Commission: Interim Reort - 7 October 2010
Chart C.5: Projected benet payments as a percentage of GDP –sensitivity analysis
Source: IPSPC calculations based on GAD, HM reasury and OBR data.
C.8 is sensitivity analysis does not show the full range of outcomes possible and it isconceivable that actual benet payments as a percentage of GDP fall outside of this range.e sensitivity analysis does not investigate the implications of CPI diverging from RPI by more or less than 0.75 per cent. e Commission estimates that if the long-term gap was 0.5per cent rather than 0.75 per cent, the projected costs could be higher by around a further0.1 per cent of GDP.
Cap and share
C.9 As discussed above, both the Commission’s and the December 2009 projectionsinclude allowance for the existing cap and share regime. Further details of the methodology used to apply cap and share can be found in Annex B of their 6 April 2010 methodology document, but broadly it is assumed that two thirds of cost pressures which fall to employeesthrough cap and share will be met through benet reductions, with the other third leadingto employee contribution increases.
0.0%
0.2%
0.4%
0.6%
0.8%
1.0%
1.2%
1.4%
1.6%
1.8%
2.0%
1999/2000 2009/10 2019/20 2029/30 2039/40 2049/50 2059/60
P e r c e n t a g e o f p r o j e c t e d G D P
Year
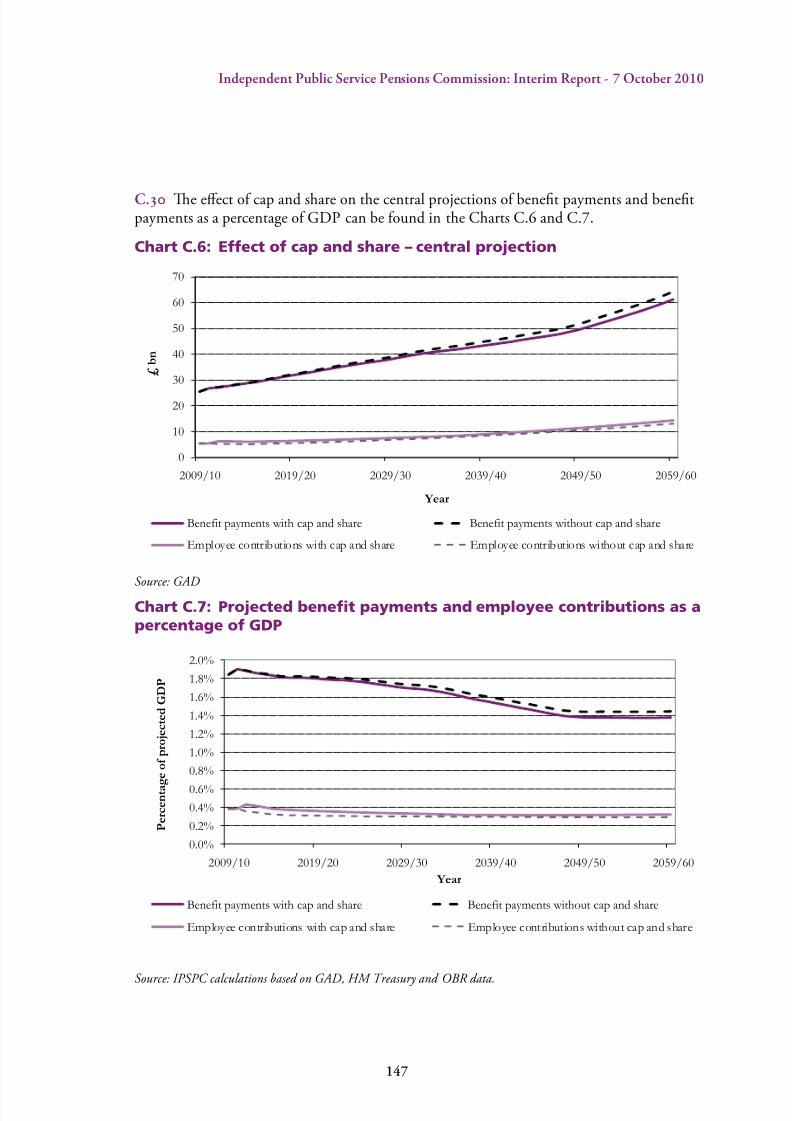
8/8/2019 Independent Public Service Pensions Commission: Interim Report
http://slidepdf.com/reader/full/independent-public-service-pensions-commission-interim-report 151/176
147
Indeendent Public Service Pensions Commission: Interim Reort - 7 October 2010
C. e eect of cap and share on the central projections of benet payments and benetpayments as a percentage of GDP can be found in the Charts C.6 and C.7.
Chart C.6: Effect of cap and share – central projection
Source: GAD
Chart C.7: Projected benet payments and employee contributions as apercentage of GDP
Source: IPSPC calculations based on GAD, HM reasury and OBR data.
0
10
20
30
40
50
60
70
2009/10 2019/20 2029/30 2039/40 2049/50 2059/60
£ b n
Year
Benefit payments with cap and share Benefit payments without cap and share
Employee contributions with cap and share Employee contributions without cap and share
0.0%
0.2%
0.4%
0.6%
0.8%
1.0%
1.2%
1.4%
1.6%
1.8%
2.0%
2009/10 2019/20 2029/30 2039/40 2049/50 2059/60
P e r c e n t a g e o f p r o j e c t e d G D P
Year
Benefit payments with cap and share Benefit payments without cap and share
Employee contributions with cap and share Employee contributions without cap and share
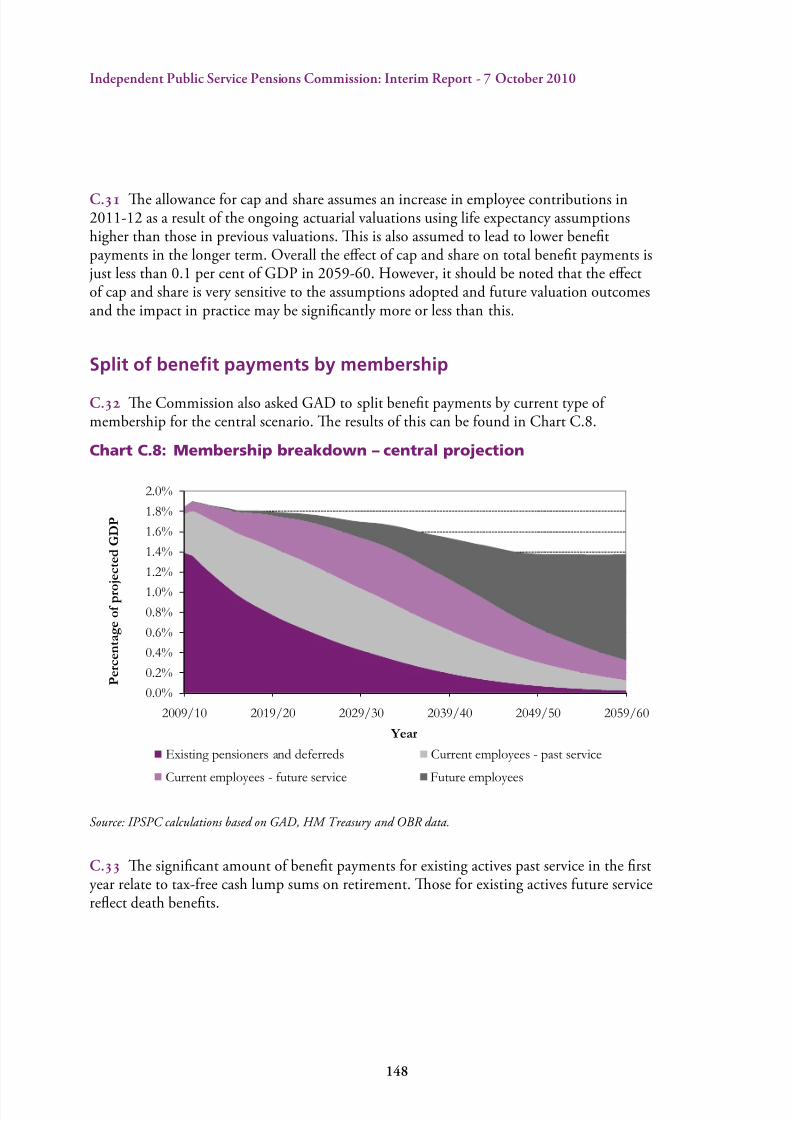
8/8/2019 Independent Public Service Pensions Commission: Interim Report
http://slidepdf.com/reader/full/independent-public-service-pensions-commission-interim-report 152/176
14
Indeendent Public Service Pensions Commission: Interim Reort - 7 October 2010
C. e allowance for cap and share assumes an increase in employee contributions in2011-12 as a result of the ongoing actuarial valuations using life expectancy assumptionshigher than those in previous valuations. is is also assumed to lead to lower benetpayments in the longer term. Overall the eect of cap and share on total benet payments is
just less than 0.1 per cent of GDP in 2059-60. However, it should be noted that the eectof cap and share is very sensitive to the assumptions adopted and future valuation outcomesand the impact in practice may be signicantly more or less than this.
Split of benet payments by membership
C. e Commission also asked GAD to split benet payments by current type of membership for the central scenario. e results of this can be found in Chart C.8.
Chart C.8: Membership breakdown – central projection
Source: IPSPC calculations based on GAD, HM reasury and OBR data.
C. e signicant amount of benet payments for existing actives past service in the rstyear relate to tax-free cash lump sums on retirement. ose for existing actives future servicereect death benets.
0.0%
0.2%
0.4%
0.6%
0.8%
1.0%
1.2%
1.4%
1.6%
1.8%
2.0%
2009/10 2019/20 2029/30 2039/40 2049/50 2059/60
P e r c e n t a g e o f p r o
j e c t e d G D P
Year
Existing pensioners and deferreds Current employees - past service
Current employees - future service Future employees
8/8/2019 Independent Public Service Pensions Commission: Interim Report
http://slidepdf.com/reader/full/independent-public-service-pensions-commission-interim-report 153/176
14
Indeendent Public Service Pensions Commission: Interim Reort - 7 October 2010
D Summary of evidence
D. On the 28 June, Lord Hutton, wrote an article in the Financial Times calling for allinterested parties to contact the Commission directly with their comments and views onpensions reform. e Commission also wrote directly to interested groups in the rst week
of July to ask for evidence in assisting the Commission with its interim report. Lord Huttonreceived evidence from over 100 organisations and numerous individuals who had respondedby the end of August with their contributions.
D. Stakeholder responses to the ‘call for evidence’ have tended to focus around vemain issues.
The cost of pension provision now and in the future
D. First, a majority of respondents were concerned about the cost of pension provision
at present and in the future. Most felt that public service pensions as they stand areunsustainable in the long-term. As a result, the majority of stakeholders have called forreform, although, some suggested that reform should wait until the completion of thecomprehensive spending review. A second group, however, felt that the pensions liability
was under control, noting that funded schemes like the LGPS do not contribute to the UK’sstructural decit.
D. ere was a signicant amount of debate regarding the urgency and necessary magnitude of potential reforms. ere was great variability in the valuation of pensioncosts and the measurements used. Accordingly, a number of commentators have called forupdated gures and projections in advance of any recommendations.
D. ose who did call for cost savings felt that substantial reform – whether throughscheme restructuring, a change in accrual rates, or an increase in the retirement age – wouldnot produce results in the short-term. Most agree that the only driver of rapid savings will bean increase in employee contribution rates.
Recruitment and retention
D.6 Second, a large number of stakeholders placed a high value on public service pensions
for the recruitment and retention of sta. Across a range of sectors, it was felt that goodpensions were a necessary tool with which to compete with the private sector, especially against a background of economic recovery and accelerating private sector starting salaries.
8/8/2019 Independent Public Service Pensions Commission: Interim Report
http://slidepdf.com/reader/full/independent-public-service-pensions-commission-interim-report 154/176
150
Indeendent Public Service Pensions Commission: Interim Reort - 7 October 2010
High quality pensions were viewed by organisations not only as a tool to attract and retainsta, but to motivate them around the image of being a ‘good employer’.
D. Specically, respondents focused on the recruitment and retention of high-level sta that tend to be older and more experienced. In addition, older sta were seen as valuingpensions more highly than younger sta as part of the overall remuneration package.
D.8 e cost of turnover in organisations was also highlighted. Some suggested that higherturnover of skilled sta due to reformed public service pensions may nullify any potentialsavings from public service pension reform. ere was debate over the time it would take
for reforms to impact on recruitment and retention. Some felt that reform would have animmediate eect; others recognised the potential short-term gains, but warned of a long-term impact on attracting sta.
RPI to CPI
D.9 ird, concern was expressed over the change in indexation from RPI to CPI. Many argued that this switch would wipe a great deal o the value of their pensions and viewed itas a breach of the accrued rights of public service sta. Some felt that this apparent erosionof accrued rights could have a detrimental impact on a wider savings culture.
D. ough some respondents appreciated the nancial rationale behind the initiative,most were not in favour.
Balance of pension provision between public and
private sector
D. Fourth, a high number of respondents felt that the fundamental problem in pensionprovision lay in the erosion of high quality private service pensions. Accordingly, they oftenargued that an overall pensions strategy should be targeting adequate provision for all. Someviewed public service pensions as a benchmark for nation-wide adequacy and excellence,calling for retention of dened benet pensions rather than a wholesale switch to denedcontribution schemes. ere was also a view that public service pensions are not ‘gold-plated’, and that an average public service salary is lower than its private sector equivalent.
D. A minority expressed concern over the long-term sustainability of the current balancebetween public and private sector pensions. It was seen as unfair that taxpayers fundedpublic service pensions, whilst also tending to receive poorer provision than in the past in theprivate sector.
D. Many called for a more accurate system of comparative analysis between schemesand sectors. ey felt that a lack of this was driving media concentration on a few ‘outlier’cases. Some also criticised the public sector for contributing to a non-level playing eld. e
8/8/2019 Independent Public Service Pensions Commission: Interim Report
http://slidepdf.com/reader/full/independent-public-service-pensions-commission-interim-report 155/176
151
Indeendent Public Service Pensions Commission: Interim Reort - 7 October 2010
requirements to provide a ‘broadly comparable’ pension were in particular viewed as a barrierto the provision of competitive outsourcing.
Protection of accrued rights
D. Fifth, many stakeholders expressed concern over possible impacts on their accruedrights. ere was also widespread confusion as to what exactly accrued rights meant. Somefelt that it was reasonable to protect previously accrued benets, but loosen restrictionsaround future accruals. Others saw an interference in future accruals for schemes already in
place as unreasonable. Most asked for clarication around this issue.
Other points of interest
D. Responses to the call for evidence covered a range of other points. In particular:
• there are noticeable dierentials in public service provision. Employer and employeecontribution rates, or example, vary enormously rom scheme to scheme. Inaddition, the nature o dierent proessions – some bear more risk than others – is aactor in the adequacy o pension provision;
• the question o risk requires careul examination – not only between taxpayer andemployee, but also between generations. It may not be air that one generation tendsto und the pensions o a previous (or uture) generation; and
• cost-savings will need to be examined strategically, with a view to the long-term as well as the impact on dierent sectors o society. In particular, the wider budgetlandscape will have to be considered, so that immediate savings in pensions do notlead to increased demand or means-tested benefts in the uture.
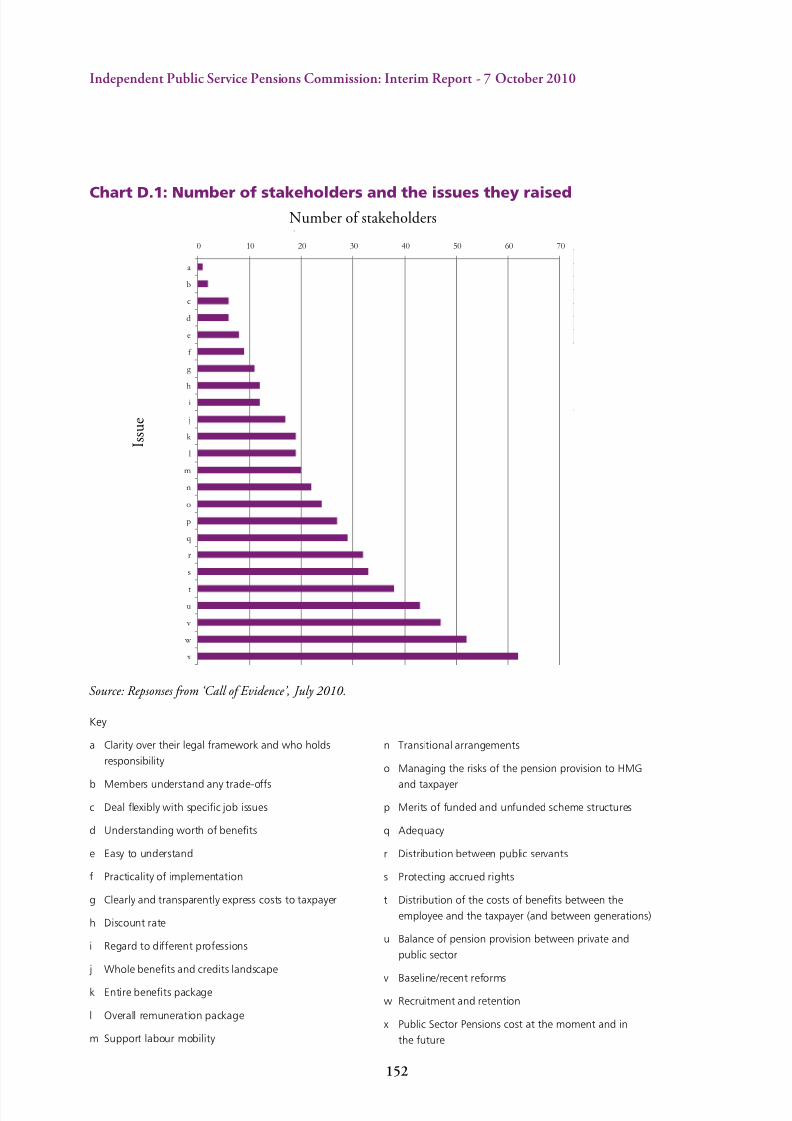
8/8/2019 Independent Public Service Pensions Commission: Interim Report
http://slidepdf.com/reader/full/independent-public-service-pensions-commission-interim-report 156/176
152
Indeendent Public Service Pensions Commission: Interim Reort - 7 October 2010
Chart D.1: Number of stakeholders and the issues they raised
Key
a Clarityovertheirlegalrameworkandwhoholds
responsibility
b Membersunderstandanytrade-os
c Dealexiblywithspecifcjobissues
d Understandingworthobenefts
e Easytounderstand
Practicalityoimplementation
g Clearlyandtransparentlyexpresscoststotaxpayer
h Discountrate
i Regardtodierentproessions
j Wholebeneftsandcreditslandscape
k Entirebeneftspackage
l Overallremunerationpackage
m Supportlabourmobility
n Transitionalarrangements
o ManagingtherisksothepensionprovisiontoHMG
andtaxpayer
p Meritsoundedandunundedschemestructures
q Adequacy
r Distributionbetweenpublicservants
s Protectingaccruedrights
t Distributionothecostsobeneftsbetweenthe
employeeandthetaxpayer(andbetweengenerations)
u Balanceopensionprovisionbetweenprivateand
publicsector
v Baseline/recentreorms
w Recruitmentandretention
x PublicSectorPensionscostatthemomentandin
theuture
Source: Repsonses from ‘Call of Evidence’, July 2010.
0
10
20
30
40
50
60
70
D e a l f l e x i b l y
w i t h s p e c i f i c
r e
g i o n a l o r
j o
b i s s u e s
E a s y t o
u
n d e r s t a n d
C l e a r l y a n d
t r a n
s p a r e n t l y
e x p r e s s c o s t s
t o
t a x p a y e r
0 10 20 30 40 50 60 70
a
b
c
d
e
f
g
h
i
j
k
l
m
n
o
p
q
r
s
t
u
v
w
x
I s s u e
Number of stakeholders

8/8/2019 Independent Public Service Pensions Commission: Interim Report
http://slidepdf.com/reader/full/independent-public-service-pensions-commission-interim-report 157/176
153
Indeendent Public Service Pensions Commission: Interim Reort - 7 October 2010
E Panel of Experts
As well as beneting from the wide range of evidence received I have established a smallgroup of academics and other experts, who have assisted me, mainly on a one-to-one basis,in shaping my views and have provided helpful comments on this report. I am grateful to
them all for their help, however the report represents my views alone.
e panel members are:
• Ron Amy OBE;
• Proessor Nicholas Barr;
• Lord Bichard1 o Nailsworth;
• Proessor David Blake;
• Niki Cleal;
• Baroness Jeannie Drake CBE;
• Carl Emmerson;
• Proessor John Hills; and
• Proessor Alasdair Smith.
1 Lord Bichard will be advising the Commission for the second half of the review.

8/8/2019 Independent Public Service Pensions Commission: Interim Report
http://slidepdf.com/reader/full/independent-public-service-pensions-commission-interim-report 158/176
154
Indeendent Public Service Pensions Commission: Interim Reort - 7 October 2010

8/8/2019 Independent Public Service Pensions Commission: Interim Report
http://slidepdf.com/reader/full/independent-public-service-pensions-commission-interim-report 159/176
155
Indeendent Public Service Pensions Commission: Interim Reort - 7 October 2010
F List of charts and tables
Charts
Chart Ex.1 Private sector employees by type of pension provision
Chart Ex.2 Projected pension payments as a percentage of GDP – sensitivity analysis
Chart Ex.3 Actual and projected period life expectancy at birth for UK males
Chart Ex.4 Employee contributions as a proportion of the overall cost of accrual (preand post reform)
Chart 1.A Scheme membership in UK pension schemes
Chart 1.B NHS scheme membership by age
Chart 1.C Earnings of active members
Chart 1.D Cumulative distribution of pension payments and pensioner members
Chart 1.E Pensions in payment from UK teachers pension schemes
Chart 1.F Employer-sponsored pension provision among UK employees.
Chart 1.G Non-public service active DB membership
Chart 4.A Projected benet payments as a percentage of GDP – central projection
Chart 4.B Projected benet payments as a percentage of GDP – sensitivity analysis
Chart 4.C Period life expectancies for those reaching age 60 – general population
Chart 4.D Cohort life expectancy assumptions for current pensioners aged 60 by scheme
Chart 4.E Assumed proportion of adult life in retirement, NHS Pension Scheme
Chart 4.F Estimated standard contribution rates for the NHS Pension Scheme usingalternative longevity assumptions (as a proportion of salaries)

8/8/2019 Independent Public Service Pensions Commission: Interim Report
http://slidepdf.com/reader/full/independent-public-service-pensions-commission-interim-report 160/176
15
Indeendent Public Service Pensions Commission: Interim Reort - 7 October 2010
Chart 4.G Actual and projected period life expectancy at birth for UK males
Chart 5.A Distribution of pensions in payment by gender
Chart 5.B Hypothetical replacement rates from public service pensions
Chart 5.C Average eective employee benet rates for reformed public service pensionschemes new entrants
Chart 5.D Mean value of total benets as a percentage of pay across all employees
Chart 5.E Eect of tiered contributions on the eective employee benet rate in theNHS scheme
Chart 5.F Average eective benet rates – existing members and new joiners
Chart 5.G Employee contributions as a proportion of the overall cost (pre and postreform)
Box 6.B Cost of job moves in nal salary pension schemes
Chart 6.A Mean pension loss among stayers and movers
Chart 6.B Median age-earnings proles for employees in the public and private sectors
Chart 8.A Gross benet expenditure by type of member
Chart C.1 Central projections of benet payment and member contributions
Chart C.2 Projected benet payments as a percentage GDP – central projection
Chart C.3 Projected benet payments at constant 2008-09 RPI prices
Chart C.4 Projected GDP at constant 2008-09 RPI prices
Chart C.5 Projected benet payments as a percentage of GDP – sensitivity analysis
Chart C.6 Eect of cap and share – central projection
Chart C.7 Projected benet payments and employee contributions as a percentage of GDP
Chart C.8 Membership breakdown – central projection
Chart D.1 Number of stakeholders and the issues they raised

8/8/2019 Independent Public Service Pensions Commission: Interim Report
http://slidepdf.com/reader/full/independent-public-service-pensions-commission-interim-report 161/176
157
Indeendent Public Service Pensions Commission: Interim Reort - 7 October 2010
Tables
Table 1.A Pensions in payment over the last decade
Table 1.B e evolution of pension payments from the ve largest schemes
Table 1.C OBR forecasts for public service workforce
Table 1.D Distribution of members in private sector DB schemes
Table 2.A Summary of public service pension scheme reforms 2005-08
Table 2.B Recent evolution of average eective employee benet rates for the mainschemes
Table 2.C Current cost caps and employer contribution rates in the four biggestschemes
Table 4.A OBR Budget 2010 forecast: net cash expenditure
Table 4.B Accrued liability estimates
Table 4.C Current service cost and interest cost
Table 4.D Comparison of contributions paid and current service costs in Teachers’Pension Scheme
Table 4.E Public service pensions benet projections
Table 4.F Age related expenditure as a percentage of GDP
Table 5.A Benchmark replacement rates set out by Lord Turner’s Pensions Commission
Table B.1 Overview of the main public service pension schemes
Table C.1 OBR forecasts for RPI and CPI ination
Table C.2 OBR forecasts for public service workforce
Table C.3 OBR forecasts for GDP growth
Table C.4 Key long-term assumptions

8/8/2019 Independent Public Service Pensions Commission: Interim Report
http://slidepdf.com/reader/full/independent-public-service-pensions-commission-interim-report 162/176
15
Indeendent Public Service Pensions Commission: Interim Reort - 7 October 2010

8/8/2019 Independent Public Service Pensions Commission: Interim Report
http://slidepdf.com/reader/full/independent-public-service-pensions-commission-interim-report 163/176
15
Indeendent Public Service Pensions Commission: Interim Reort - 7 October 2010
G Glossary
Accrual: A payment earned in one period but not paid until a later period.
Active Members: ese are current employees who are contributing (or have contributions
made on their behalf) to an organisation’s occupational pension scheme. ey are distinctfrom deferred members and pensioners.
Accrual rate: e proportion of earnings that a dened benet (DB) pension scheme paysas pension for each year of membership. For example, a scheme with an accrual rate of 1/60provides 1/60th of earnings for each year of membership, which is higher than a pensionbased on an accrual rate of 1/80 of earnings.
Accrued Liabilities: A measure of the value, in today’s money, of all pension entitlements tobe paid in the future that have been earned to date.
Accrued Rights: Rights to pension and other benets under scheme rules, deriving directly or indirectly from membership of the scheme. Such rights include pension awards already received and pensionable service built up so far based on a particular pension age. However,there is no standard denition of accrued rights across public service pension schemes: therights will depend on specic circumstances, such as the terms of the individual pensionschemes.
Actuarial valuation: A report of the nancial position of a DB pension scheme carried outby an actuary every three or four years. e report typically sets out the scheme’s assets andliabilities as at the date of the valuation; the rate at which the sponsoring employer mustcontribute to meet the liabilities accruing as they become due; and the additional rate at
which the employer must contribute to eradicate any decit (the excess of liabilities overassets) within a stated time period.
Additional Benets: ese are benets in addition to the pension under a scheme that Active Members may purchase to add to the pension (“added pension”), the years of pensionable service (“added years”), or for a separate money purchase pension (“additionalvoluntary contributions”).
Additional Voluntary Contribution (AVC): ese are personal pension contributionsmade by someone who is also a member of an occupational scheme as a top-up to their
occupational entitlement. AVCs can be made into the occupational scheme or to a stand-alone product called a Freestanding AVC plan.

8/8/2019 Independent Public Service Pensions Commission: Interim Report
http://slidepdf.com/reader/full/independent-public-service-pensions-commission-interim-report 164/176
10
Indeendent Public Service Pensions Commission: Interim Reort - 7 October 2010
Admitted Body Status: Admitted body status refers to the practice of the Local GovernmentPension Scheme of accepting as members the employees of bodies not covered by theoriginal or primary ambit of the scheme as set out in its founding statute. It enablescontractors, who take on an authority’s services or functions with employees transferringfrom the authority, to oer the transferring sta continued eligibility of the transferringauthority’s pension scheme.
Annuity : A series of regular payments usually payable for the life of the annuitant. Annuitiesare usually purchased by a lump sum of cash. Pension schemes sometimes discharge theirpromise of pension benet by purchasing an annuity. Individuals can purchase an annuity
using their own capital. ere is a wide range of options available e.g. level, escalating,guaranteed, single or joint lives.
Automatic enrolment : A pension scheme where an individual is made a member by defaultand has actively to decide to leave the scheme.
basic State Pension (bSP): Non-earnings-related pension based on an individual’s NationalInsurance Contribution record.
Cap and Share: is is an arrangement applying to the pension schemes for the NHS,Teachers, Civil Service and Local Government, whereby increases or reductions in the costs
of a scheme identied in a pension scheme actuarial valuation are shared between employeesand employers up to the value of the cap. Above the cap the increases or reductions areborne by employees, either by changing employee contributions or the cost of employeebenets or both. Below the cap, increases or reductions are shared between employers andemployees.
Capped DB scheme: A DB pension scheme where a limit is placed on pension entitlement,for example by placing a ceiling on the amount of annual earnings that are pensionable or by limiting the amount of pension that might be awarded under scheme rules.
Career Average Scheme: A dened benet scheme that gives individuals a pension based ona percentage of the salary earned in each year of their working life.
Cash balance scheme: A scheme where the employer puts a notional amount into themember’s pension pot every year, which is then guaranteed. is credit can be expressed asa percentage of salary for each year worked. If cash contributions from the employee andemployer, plus investment returns, do not match this promised “notional credit” then theemployer has to meet any shortfall. On retirement the resulting “cash balance” can be usedto purchase an annuity or to make other arrangements for retirement.
CEV (Cash Equivalent ransfer Value): e value of accrued pension rights when any
worker ceases to be an active member of a scheme before pension is payable. Everyone canrequest a CETV except in the year before retirement but schemes can refuse to accept them.

8/8/2019 Independent Public Service Pensions Commission: Interim Report
http://slidepdf.com/reader/full/independent-public-service-pensions-commission-interim-report 165/176
11
Indeendent Public Service Pensions Commission: Interim Reort - 7 October 2010
Cohort Life Expectancy : e estimate of an individual’s probability of surviving futureyears allowing for possible changes in mortality rates over time.
Collective DC scheme: All member pension contributions are placed in one fund that isthen managed on behalf of the members. As in standard DC schemes the pensions willvary according to the value of the underlying investments. However, within collectiveDC schemes there is the option to spread the eects across the various groups of members(“intergenerational sharing”) to smooth the eects of market conditions.
Combination hybrid scheme: Where members simultaneously earn benets that are part
DB and DC.
Commission: e Independent Public Service Pensions Commission.
Commutation factor: A number used to convert a pension annuity into a lump sum. efactor usually depends on the sex of the member and the age at which the conversion takesplace. e factors are scheme specic and are either set out in the pension scheme’s rules orare updated periodically by the scheme’s trustees or administrators.
Conditional Indexation: Where the uprating of a pension fund or pensions in paymenteach year is variable and dependent on other factors, such as investment returns.
Consumer Prices Index (CPI): It is an internationally comparable measure of inationbased on structures in international legislation and guidelines and launched in 1996. Likethe Retail Prices Index (RPI) it tracks the changing cost of a xed basket of goods andservices over time. However unlike the RPI it disregards some items, such as housing costs. Italso has a dierent population base for the indices from the RPI and a dierent way in whichthe index is calculated.
Cost Sharing : e cost of any benet increases is shared between individual and employer.
Contracting-out : e facility to opt out of the additional state pension and build upbenets in a private pension scheme.
Current contribution rate: e standard contribution rate as adjusted for past surpluses anddecits and payable by employers and employees
Current Service Cost : A measure of the value of the new pension promises built up over ayear.
Death Benet Lump Sum: See Death in service.
Death in retirement benet : A pension scheme benet that is usually paid to the spouse of a scheme member if that member dies after retirement. e benet typically takes the formof a pension paid to the dependant of a proportion of the pension the member was receiving
when he or she died.

8/8/2019 Independent Public Service Pensions Commission: Interim Report
http://slidepdf.com/reader/full/independent-public-service-pensions-commission-interim-report 166/176
12
Indeendent Public Service Pensions Commission: Interim Reort - 7 October 2010
Death In Service benet : A pension scheme benet which is usually paid to the spouse (orsometimes other nominated dependant) of a scheme member if that member dies whilst anactive member. e benet typically takes the form of a lump sum (Death Benet LumpSum), calculated as a multiple of salary, plus a pension paid to the dependant of a proportionof the pension the member would have received if he or she had lived until retirement age.
Deferred Members: Deferred members are scheme members who have left employment, orceased to be an active member of the scheme whilst remaining in employment, but retain anentitlement to a pension from the scheme.
Dened Benet (DB) Pension Scheme: A pension scheme where the pension is related tothe members’ salary or some other value xed in advance.
Dened Contribution (DC) Pension Scheme: A scheme where the individual receivesa pension based on the contributions made and the investment return that they haveproduced. ese are sometimes referred to as money purchase schemes.
Deferred Pension Benet : e benet awarded to a dened benet scheme member whohas left the scheme.
Dependent Member: An individual who is eligible to receive retirement benets following
the death of a scheme member.
Employee Contribution Rates: e percentage of their pensionable salary that employeespay as a contribution towards a pension.
Employer Contribution Rates: e percentage of the salary of employees that employerspay as a contribution towards the employees’ pension.
Employer Covenant : e willingness and ability of an employer to support the pensionscheme in the long-term.
Fair Deal: A non-statutory code of practice introduced in 1999 that protects the pensionprovisions of public sector workers that have their employment compulsorily transferred outof the public sector. In such a situation the transferring organisation is required to ensurethat the pension provision for future service is “broadly comparable” after the transfer.
Final salary scheme: A DB scheme that gives individuals a pension based on the number of years of pensionable service, the accrual rate and nal earnings as dened by the scheme.
FRS17: A nancial reporting standard that sets out accounting treatment for retirementbenets.
Funded: Pension schemes in which pension contributions are paid into a fund that isinvested and pensions are paid out of this pot.

8/8/2019 Independent Public Service Pensions Commission: Interim Report
http://slidepdf.com/reader/full/independent-public-service-pensions-commission-interim-report 167/176
13
Indeendent Public Service Pensions Commission: Interim Reort - 7 October 2010
IAS19: An international accounting standard that sets out the accounting treatment foremployee benets, including post-employment benets such as pensions.
Index Linked Gilt Yields: Gilts are UK government bonds, the benchmarks for the sterlingxed income markets. Yields shown for index-linked gilts are based on an assumed inationrate.
Indexation: e technique used to adjust income payments or the uprating of a pensionfund in line with an index.
Interest Cost : Estimates the amount by which the value of accrued liabilities increased overa year as a result of the ‘unwinding’ of the discount rate, reecting the fact that pensionpayments are closer to being paid.
Life expectancy : Life expectancy at a given age, x, is the average number of years that a maleor female aged x will live thereafter.
Longevity : e length or duration of human life.
Maturity : e maturity of a pension scheme indicates the number of active members relativeto the number of members receiving pensions. An immature scheme, such as the NHS
scheme, is one that has more active members building up pensions than pensioner membersreceiving pensions.
Member contributions: e amounts paid by active scheme members into their pensionschemes.
Mutualisation: Employee participation in, and of, an organisation. Implied sharing of therisks and benets.
National Insurance (NI): e national system of benets paid in specic situations, suchas retirement, based on compulsory earnings-related contributions by employers andemployees. Self-employed people make contributions on a dierent basis.
NES (National Employment Savings rust): e arms length from Government, low cost pensions scheme associated with the automatic enrolment reforms planned for 2012.
Net Cash Expenditure: Benets paid to recipients less contributions received by centralgovernment from employees and employers in one year.
Normal Pension age: e earliest age at which, in the normal course of events, a schememember may retire with payment of his or her unreduced accrued superannuation benets.
Normal Retirement Age: e age at which the employer is entitled to terminate thecontract of employment on grounds of age. Age discrimination legislation presently prohibitsthis being less than 65 save in exceptional circumstances.

8/8/2019 Independent Public Service Pensions Commission: Interim Report
http://slidepdf.com/reader/full/independent-public-service-pensions-commission-interim-report 168/176
14
Indeendent Public Service Pensions Commission: Interim Reort - 7 October 2010
Notional Dened Contribution scheme: A scheme whereby the values of the pensions atretirement are determined by an assumed return on contributions and an annuity rate orrates.
Normal Retirement Age (NRA): e normal retirement age (NRA) is the age at whichretirement benets (before rounding) are equal to the “primary insurance amount.”
Occupational Pension: A pension, which is provided via the employer, but from a pensionscheme that takes the form of a trust arrangement and is legally separate from the employer.
Old-age dependency ratio: e number of people above 65 to the number of people aged18 or 20 to 64 in the population.
Pay As You Go (PAYG): See “Unfunded Pension Schemes.”
Pensioner Member: Individuals who now draw a pension and who are mainly formeremployees. However they may also include widows, widowers and other dependants of former active members.
Independent Public Service Pensions Commission: An independent commissionundertaking a fundamental structural review of public service pension provision by Budget
2011
Pension credit : e main income-related benet for pensioners, which combines theGuarantee Credit and the Savings Credit.
Pension replacement ratio: Income in retirement as a proportion of income beforeretirement.
Period Life Expectancy : Represents the amount of time an individual is expected to live if mortality rates were equal to the experience of other individuals in that year.
Public sector pension schemes: ese comprise both public service pension schemesand other schemes in the wider public sector such as the BBC, Transport for London, theBank of England and the Royal Mail. ese schemes are not authorised by statute and theorganisation concerned makes the rules of the schemes.
Public Sector ransfer Club: A group of some 120 salary related occupational pensionschemes. It allows easier movement of sta mainly within the public sector. It does thisby making sure that employees receive broadly equivalent credits when they transfer theirpensionable service to their new scheme regardless of any increase in salary when they moveto their new employment.
Public service pension schemes: Pension schemes authorised by statute where the relevantMinisters make the rules of the schemes. e main schemes are those for civil servants,
8/8/2019 Independent Public Service Pensions Commission: Interim Report
http://slidepdf.com/reader/full/independent-public-service-pensions-commission-interim-report 169/176
15
Indeendent Public Service Pensions Commission: Interim Reort - 7 October 2010
the armed forces, NHS employees, teachers, local government employees, the police andreghters. ere are over 200 public service pension schemes.
Public Services Forum (PSF) Agreement : An agreement in October 2005 betweentrades unions and the then Government, made at the Public Services Forum run by theGovernment, on how reforms to public service pension schemes should be taken forward.
Retail Prices Index (RPI): It is a measure of ination and like the Consumer Prices Index(CPI) it tracks the changing cost of a xed basket of goods and services over time. However,unlike the CPI it takes into account items such as housing costs. It also has a dierent
population base for the indices from the CPI and a dierent way in which the index iscalculated.
SCAPE (Superannuation Contributions Adjusted for Past Experience): A methodology used to set employer contribution rates across public service intended to mirror the operationof a funded scheme by keeping track of a notional ‘Pension Account’.
Scheme liabilities: e scheme liabilities at a given date are an estimate of the total valueof future payments that the scheme will have to make to all scheme members in respect of pension rights which have been earned before that date.
Sequential hybrid scheme: A pension scheme where a member may earn both a DBpension and a DC pension during their career with an employer. Members earn either a DBor DC benet at any one time.
Social ime Preference: e value society places on current consumption as opposed tofuture consumption.
Standard Contribution Rate: e total rate of contributions (employer plus employee) which would need to be paid in order to meet the cost of pension benets accruing over adened period, expressed as a percentage of payroll.
State Earnings Related Pension Schemes (SERPS): e forerunner of the State SecondPension, which provides an earnings-related National Insurance pension based oncontributions.
State Pension Age (SPA): e age at which an individual can claim their state pension. It iscurrently 65 for men and 60 for women. e SPA for women will gradually increase to 65between 2010 and 2020.
State Second Pension (S2P): e National Insurance pension that gives benets based onan individual’s earnings and contributions.
op-up DC: Where a DC arrangement is available to supplement another form of pensionprovided by an employer.

8/8/2019 Independent Public Service Pensions Commission: Interim Report
http://slidepdf.com/reader/full/independent-public-service-pensions-commission-interim-report 170/176
1
Indeendent Public Service Pensions Commission: Interim Reort - 7 October 2010
UPE: Transfer of Undertakings (Protection of Employment) Regulations 2006.
Unfunded Pension Schemes: Pension schemes, which are not backed by a pension fund.Instead current contributions are used to pay current pensions along with other fundsprovided by the employer. Most public service schemes are unfunded, except for the LocalGovernment scheme, which is funded.

8/8/2019 Independent Public Service Pensions Commission: Interim Report
http://slidepdf.com/reader/full/independent-public-service-pensions-commission-interim-report 171/176
8/8/2019 Independent Public Service Pensions Commission: Interim Report
http://slidepdf.com/reader/full/independent-public-service-pensions-commission-interim-report 172/176
1
Indeendent Public Service Pensions Commission: Interim Reort - 7 October 2010
OECD Organisation for Economic Co-operation and DevelopmentONS Oce for National Statistics
OPSS Occupational Pension Scheme Survey
PAYG Pay As You Go
PBR Pre-Budget Report
PCSPS Principle Civil Service Pension Scheme
PESA Public Expenditure Statistical Analysis
PPI Pensions Policy Institute
PRB Pay Review Body PSF Public Service Forum
PSPC Public Sector Pay Committee
PSPS Public Service Pensions Schemes
RPI Retail Price Index
SERPS State Earnings Related Pension Schemes
SSP/S2P State Second Pension
SPA State Pension Age
TPS Teachers’ Pension Scheme
TUPE Transfer of Undertakings Protection of Employment
UKAEA UK Atomic Energy Authority
USS Universities Superannuation Scheme

8/8/2019 Independent Public Service Pensions Commission: Interim Report
http://slidepdf.com/reader/full/independent-public-service-pensions-commission-interim-report 173/176
1
Indeendent Public Service Pensions Commission: Interim Reort - 7 October 2010
I Bibliography
Audit Commission (2010), Local government pensions in England: An information paper
Barrell, R. and Weale, M. (2010), ‘Fiscal policy, fairness between generations and national saving’ , Oxford Review of Economic Policy, Vol. 26, No. 1, pp. 87-116
Cabinet Oce (2000), Sta ransfers in the Public Sector: Statement of Practice
Cabinet Oce (2010), Draft Structural Reform Plan
Clery, E., McKay, S., Phillips, M. and Robinson, C. (2007), ‘Attitudes to pensions: the 2006 survey’ , Department for Work and Pensions Research Report No. 434
Crawford, R., Emmerson, C. and Tetlow, G. (2010), ‘Occupational Pension Value in the Public and Private Sectors’ , IFS Working Paper W10/03
Department for Communities and Local Government (2010), Local Government Financial
Statistics England , No. 20
Disney, R., Emmerson, C. and Tetlow, G. (2007), ‘Pension Rights, Choice of Pension Planand Job Mobility in Britain’ , mimeo
Disney, R., Emmerson, C. and Tetlow, G. (2009), ‘What is a Public Sector Pension Worth?’ ,Economic Journal, Vol. 119, Issue 541, pp. F517-F535
Disney, R. and Gosling, A. (2008), ‘Changing Public Sector Wage Dierentials in the UK’ , IFS Working Paper WP08/02
Gilling-Smith, G.D. (1968), Te Complete Guide to Pensions and Superannuation, Penguin
Government Actuary’s Department (2010), Pay-As-You-Go Public Service Pension Schemes December 2009 Cashow Projections: Methodology, data and assumptions
HM Government (2010), Te Coalition: Our programme for government
HM Treasury (2003), Te Green Book: Appraisal and Evaluation in Central Government
HM Treasury (2009), Long-term public nance report: an analysis of scal sustainability
HM Treasury (2009), Pre-Budget Report 2009 , Cm 7747
HM Treasury (2010), Public Expenditure Statistical Analyses 2010 Howse, K. (2007), ‘Updating the debate on intergenerational fairness in pension reform’ ,Oxford Institute of Ageing Working Paper 107

8/8/2019 Independent Public Service Pensions Commission: Interim Report
http://slidepdf.com/reader/full/independent-public-service-pensions-commission-interim-report 174/176
170
Indeendent Public Service Pensions Commission: Interim Reort - 7 October 2010
Hymans Robertson (2009), Public Sector Pensions – A Frontline Perspective Institute for Fiscal Studies (2008), Te IFS Green Budget January 2008
Institute for Fiscal Studies (2010), Te IFS Green Budget February 2010
Levy, S., Mitchell, H., Guled, G. and Coleman, J. (2010), ‘otal reward: pay and pensioncontributions in the private and public sectors’ , Economic and Labour Market Review, Vol. 4,No. 9
National Audit Oce (2010), Te Cost of Public Service Pensions
Oce for Budget Responsibility (2010), Pre-budget forecast June 2010 Oce for Budget Responsibility (2010), Budget forecast June 2010
Oce for Budget Responsibility (2010), Budget 2010: Te Economy & Public Finances – supplementary material
Oce for National Statistics (2009), Occupational Pension Schemes Annual Report 2008
Palacios, R. and Whitehouse, E. (2006), ‘Civil Service Pension Schemes around the World’ , World Bank Social Protection Discussion Paper No. 0602
Pensions Commission (2004), Pensions: Challenges and Choices – Te First Report of the Pensions Commission
Pensions Commission (2005), A New Pension Settlement for the wenty-First Century - Te Second Report of the Pensions Commission
Pensions Policy Institute (2008), An assessment of the Government’s reforms to public sector pensions
Pensions Policy Institute (2010), Public sector pension schemes: policy objectives and options for the future
e Pensions Regulator (2009), Scheme funding: An analysis of recovery plans
Review Body on Senior Salaries (2010), Tirty-Second Report on Senior Salaries , Cm 7804
Shaw, C. (2007), ‘Fifty years of United Kingdom national population projections: how accurate have they been?’ , Population Trends, No. 128, Oce for National Statistics
Stern, N. (2007), The Economics of Climate Change: Te Stern Review , Cambridge University Press
Sutclie, C. (2007), ‘Should Dened Benet Pension Schemes be Career Average or Final Salary’ , ICMA Centre Discussion Papers in Finance, DP 2007-6

8/8/2019 Independent Public Service Pensions Commission: Interim Report
http://slidepdf.com/reader/full/independent-public-service-pensions-commission-interim-report 175/176

8/8/2019 Independent Public Service Pensions Commission: Interim Report
http://slidepdf.com/reader/full/independent-public-service-pensions-commission-interim-report 176/176