
Perspectives from Mozambican Community Multimedia Centres, IPID 2011 (Lugano, CH)
description

Strategic Plan 2012/17 and Annual Performance Plan 2012/13
INDEPENDENT POLICE INVESTIGATIVE DIRECTORATE (IPID)
BRIEFING TO THE PORTFOLIO COMMITTEE ON POLICE6 August 2013
Expenditure on Last Quarter of 2012/13 and First Quarter 2013/14

INTRODUCTION AND OVERVIEW
ACCOMODATION OF 2012 BUDGETARY REVIEW RECCOMENDATIONS
BUDGET 2012/13 – As at end 4th Quarter 2012/13
Overall Departmental spending
Budget & Expenditure per Programme
Slide 2
Slide 3-4
Slide 5
Slide 6-7
Slide 8
Budget & Expenditure per Eco’ Classification Slide 11
BUDGET 2013/14 – As at end of 1st Quarter 2013/14
Budget & Expenditure per Eco’ Classification: 1st Quarter 13/14
Analysis of spending trends: 1st Quarter 13/14
Action taken/planned to avoid reoccurrence: 1st Quarter 13/14
Slide 15
Slide 17
Slide 18
Slide 19
Budget & Expenditure per Programme: 1st Quarter 13/14 Slide 16
CLOSURE Slide 20
Quarterly Expenditure per Programme Slide 9
Analysis of spending trends per programme: 2012/13 Slide 10
Quarterly Expenditure per Eco’ Classification Slide 12
Analysis of spending trends per Eco’ Classification: 2012/13 Slide 14
Quarterly Spending Trends : Expenditure split per quarter Slide 13
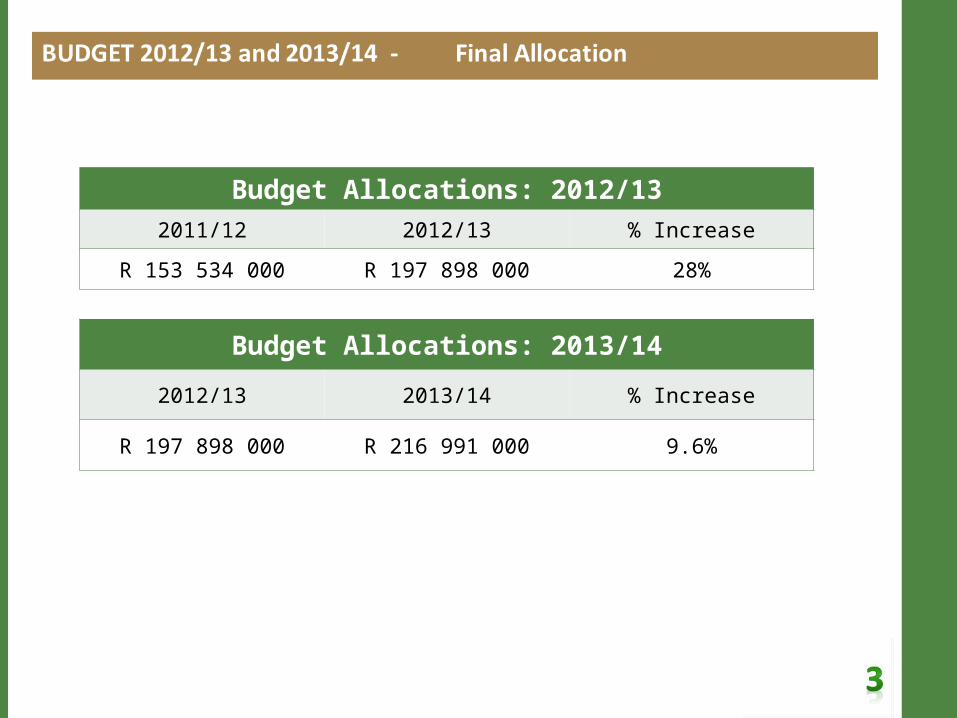
Budget Allocations: 2012/132011/12 2012/13 % Increase
R 153 534 000 R 197 898 000 28%
Budget Allocations: 2013/14
2012/13 2013/14 % Increase
R 197 898 000 R 216 991 000 9.6%
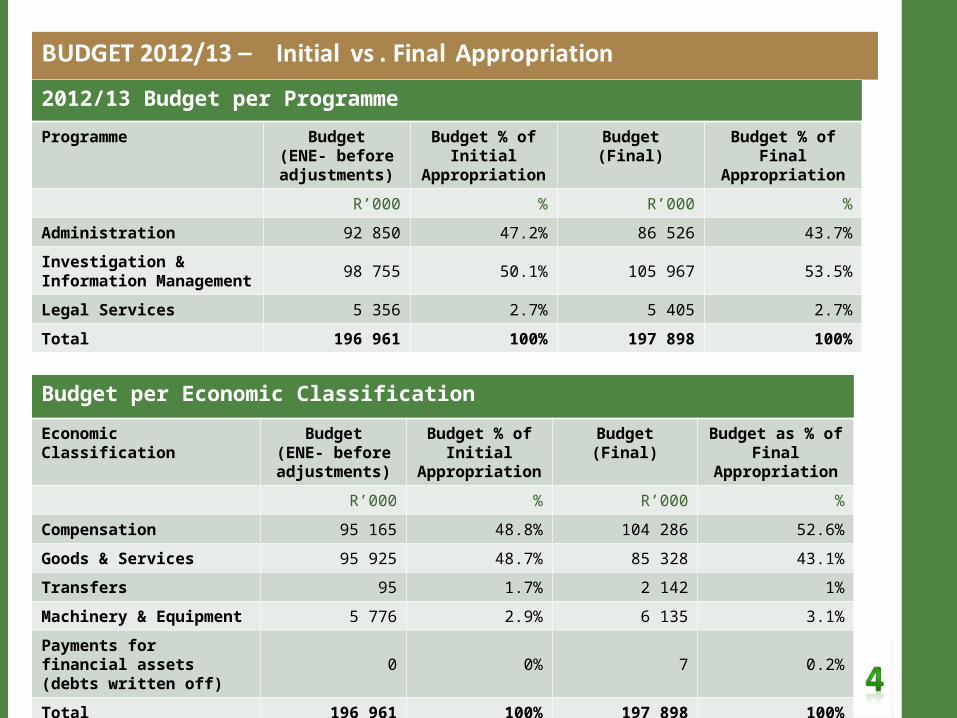
2012/13 Budget per Programme
Programme Budget(ENE- before adjustments)
Budget % of Initial Appropriation
Budget (Final) Budget % of Final Appropriation
R’000 % R’000 %
Administration 92 850 47.2% 86 526 43.7%
Investigation & Information Management 98 755 50.1% 105 967 53.5%
Legal Services 5 356 2.7% 5 405 2.7%
Total 196 961 100% 197 898 100%
Budget per Economic Classification
Economic Classification Budget(ENE- before adjustments)
Budget % of Initial Appropriation
Budget (Final) Budget as % of Final Appropriation
R’000 % R’000 %
Compensation 95 165 48.8% 104 286 52.6%
Goods & Services 95 925 48.7% 85 328 43.1%
Transfers 95 1.7% 2 142 1%
Machinery & Equipment 5 776 2.9% 6 135 3.1%
Payments for financial assets (debts written off) 0 0% 7 0.2%
Total 196 961 100% 197 898 100%
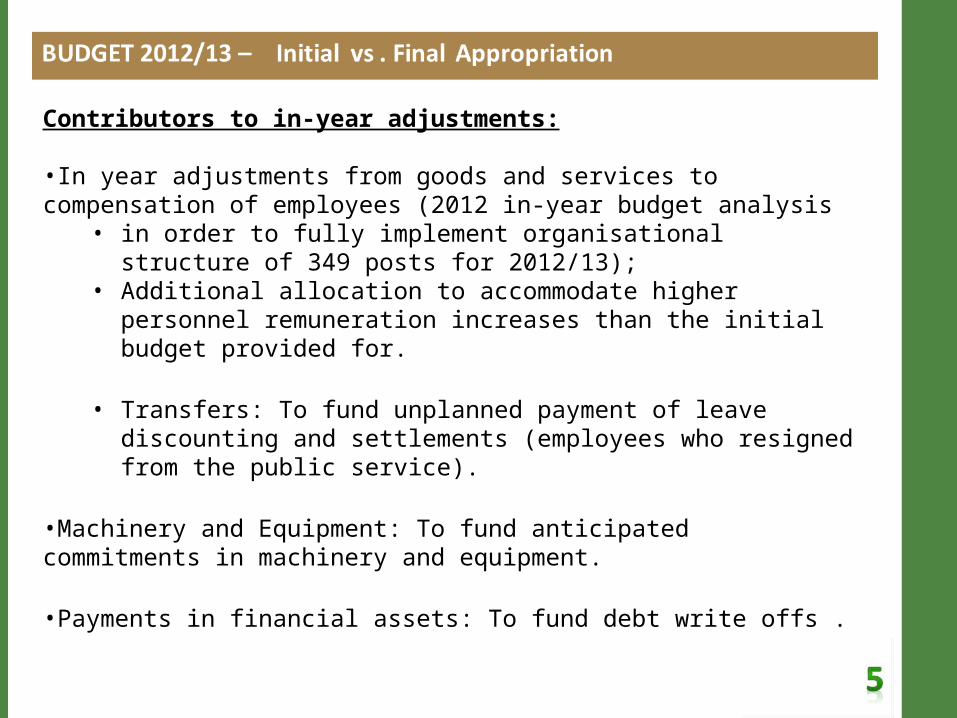
Contributors to in-year adjustments:
•In year adjustments from goods and services to compensation of employees (2012 in-year budget analysis
• in order to fully implement organisational structure of 349 posts for 2012/13);
• Additional allocation to accommodate higher personnel remuneration increases than the initial budget provided for.
• Transfers: To fund unplanned payment of leave discounting and settlements (employees who resigned from the public service).
•Machinery and Equipment: To fund anticipated commitments in machinery and equipment.
•Payments in financial assets: To fund debt write offs .
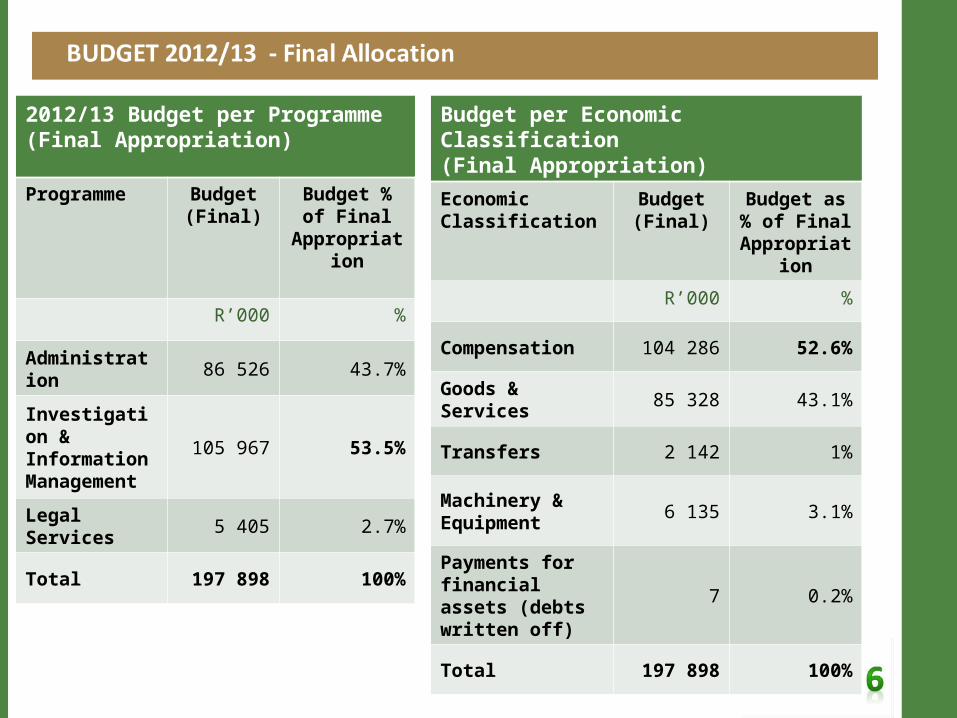
2012/13 Budget per Programme (Final Appropriation)
Programme Budget (Final)
Budget % of Final
Appropriation
R’000 %
Administration 86 526 43.7%
Investigation & Information Management
105 967 53.5%
Legal Services 5 405 2.7%
Total 197 898 100%
Budget per Economic Classification (Final Appropriation)
Economic Classification
Budget (Final)
Budget as % of Final
Appropriation
R’000 %
Compensation 104 286 52.6%
Goods & Services 85 328 43.1%
Transfers 2 142 1%
Machinery & Equipment 6 135 3.1%
Payments for financial assets (debts written off)
7 0.2%
Total 197 898 100%

SPENDING TRENDS PER QUARTER : 2012/13 – Per ProgrammeCumulative
Programme
Adjusted Annual
Appropriation 2012/13
Quarter 1
Cumulative
Spend
% Quarter 1
Spend
Quarter 2
Cumulative
Spend
% Quarter 2
Spend
Quarter 3
Cumulative
Spend
% Quarter 3
Spend
Quarter 4
Cumulative
Spend
% Quarter 4
Spend
R`000 R`000 % R`000 % R`000 % R`000 %
Administration 86 526 14 982 17% 35 734 41% 56 285 65% 70 258 81%
Investigation and Information Management
105 967 17 374 16% 38 330 36% 60 554 57% 97 009 92%
Legal Services 5 405 517 10% 1 260 23% 2 150 40% 4 182 77%
Total Actual Expenditure 197 898 32 873 17% 75 324 38% 118 989 60% 171 449 87%
Should have spent 25%
Should have spent 50%
Should have spent 75%
Should have spent 100%

SPENDING TRENDS PER QUARTER : 2012/13 – Per Economic ClassificationCumulative
Economic Classification
Adjusted Annual
Appropriation
2012/13
Quarter 1 Cumulative
Spend
% Quarter 1
Spend
Quarter 2 Cumulative
Spend
% Quarter 2
Spend
Quarter 3 Cumulative
Spend
% Quarter 3
Spend
Quarter 4 Cumulative
Spend
% Quarter 4
Spend
R`000 R`000 % R`000 % R`000 % R`000 %
Compensation of employees 104 286 20 886 20% 44 699 43% 68 898 66% 95 993 92%
Goods & Services 85 328 11 982 14% 30 362 36% 48 139 56% 69 962 82%Transfers & Subsidies 2 142 5 0% 6 0% 1 690 79% 2 142 100%Machinery & Equipment 6 135 0 0% 257 4% 257 4% 3 345 55%Payments for financial assets 7 0 0% 0 0% 5 71% 7 100%Total Actual Expenditure 197 898 32 873 17% 75 324 38% 118 989 60% 171 449 87%
Should have spent 25%
Should have spent 50%
Should have spent 75%
Should have spent 100%

SPENDING TRENDS PER QUARTER : 2012/13 – Per ProgrammeNon-cumulative(25% expectation)
Programme
Adjusted Annual
Appropriation
2012/13
Quarter 1 Actual
Spend
% Quarter 1
Spend
Quarter 2
Actual Spend
% Quarter 2
Spend
Quarter 3
Actual Spend
% Quarter 3
Spend
Quarter 4 Actual
Spend
% Quarter 4
Spend
R`000 R`000 % R`000 % R`000 % R`000 %
Administration 86 526 14 982 17% 20 752 24% 20 551 24% 13 973 16%
Investigation and Information Management
105 967 17 374 16% 20 956 20% 22 224 21% 36 455 34%
Legal Services 5 405 517 10% 743 14% 890 16% 2 032 38%
Total Actual Expenditure 197 898 32 873 17% 42 451 21% 43 665 22% 52460 27%
under/(over) expenditure 16 602 8% 7 024 4% 5 810 3% -2985,5 (2%)

SPENDING TRENDS PER QUARTER : 2012/13 – Per Economic ClassificationNon-cumulative(25% expectation)
10
Economic Classification
Adjusted Annual
Appropriation 2012/13
Quarter 1 Actual
Spend
% Quarter 1 Spend
Quarter 2 Actual
Spend
% Quarter 2
Spend
Quarter 3 Actual
Spend
% Quarter 3 Spend
Quarter 4
Actual Spend
% Quarter 4
Spend
R`000 R`000 % R`000 % R`000 % R`000 %Compensation of employees
104,286 20,886 20%
23,813 23%
24,199 23%
27,095 26%
Goods & Services 85,328 11,982 14%
18,380 22%
17,777 21%
21,823 26%
Transfers & Subsidies 2,142 5 0.2%
1 1%
1,684 76%
452 21%
Machinery & Equipment 6,135 0 0%
257 4%
- 0%
3,088 50%
Payments for financial assets
7
- -
5 2 29%
Total Actual Expenditure 197,898
32,873 17%
42,451 21%
43,665 22%
52,509 27%
under / (over) expenditure
16,602 8%
7,024 4%
5,810 3%
(3,034) (2%)

Spending Trends Per Quarter: 2012/13
• March Spike:• Compensation of employees: payout of performance bonuses
(levels 1-12)• Goods and services: machinery & equipment less than R5000• Machinery & equipment: late procurement and delivery
• Abnormal spikes:• Transfers (Q3 & Q4):unforeseen leave discounting and settlements
due to officials who left the public service

BUDGET 2012/13: Overall Expenditure per Programme
Budget per Programme (Final Appropriation) & ExpenditureProgramme Budget (Final) Expenditure Variance Expenditure as
% of Final Appropriation
R’000 R’000 R’000 %
Administration 86 526 70 258 16 268 81.2%
Investigation & Information Management
105 967 97 009 8 958 91.5%
Legal Services 5 405 4 182 1 223 77.4%
Total 197 898 171 449 26 449 86.6%

BUDGET 2012/13: Overall Expenditure per Economic Classification
Budget per Economic Classification (Final Appropriation) & ExpenditureEconomic Classification Budget (Final) Expenditure Variance Expenditure as
% of Final Appropriation
R’000 R’000 R’000 %
Compensation 104 286 95 993 8 293 92.0%
Goods & Services 85 328 69 962 15 366 82.0%
Transfers 2 142 2 142 - 100.0%
Machinery & Equipment 6 135 3 345 2 790 54.5%
Payments for financial assets (debts written off)
7 7 - 100.0%
Total 197 898 171 449 26 449 86.6%

Spending Trends: Per Programme : 2012/13
• Programme 1: Administration• The actual programme`s spending on the allocated budget of R86 526 000 was 81%
or R70 258 000 in monetary value which resulted in under-spending by 19% or R16 268 000.
• Quarterly expenditure not consistent, however 2nd and 3rd quarter expenditure was close to 25% target (1% short)
• Programme 2: Investigation and Information Management• The actual spending on the allocated budget of R105 967 000 was 92% or
R97 009 000 in monetary value with an under-spending of 8% or R8 958 000.
• Quarterly expenditure reveals a gradual improvement over the four quarters.
• Programme 3: Legal Services• The programme `s actual spending to the allocated budget of R5 405 000 was 77%
which translates to R4 182 000 in monetary value and has reported an under-spending of 23% or R1 223 000.
• Quarterly expenditure not consistent but improvement in last quarter
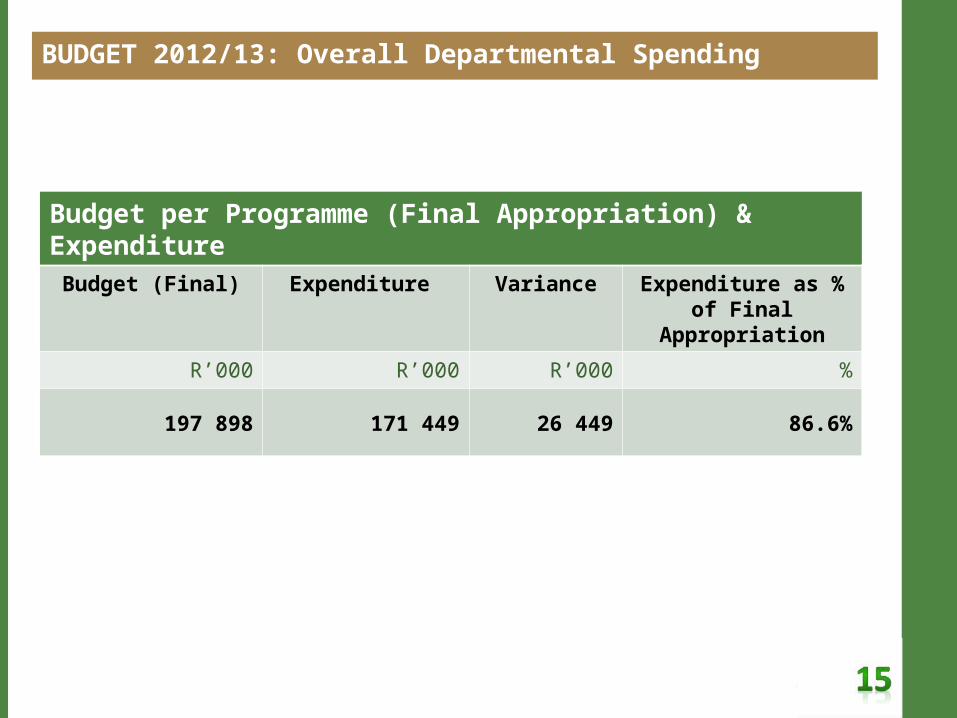
BUDGET 2012/13: Overall Departmental Spending
Budget per Programme (Final Appropriation) & Expenditure
Budget (Final) Expenditure Variance Expenditure as % of Final Appropriation
R’000 R’000 R’000 %
197 898 171 449 26 449 86.6%

BUDGET 2012/13: Overall Departmental Spending
• Spent on core activities.
• Introduction of cost cutting measures to avoid spending on non-core activities
• The budget`s allocation amongst others was prioritized to conduct public awareness on the directorate`s mandate and functions through:• community outreach events, media campaigns and the establishment of
satellite offices to increase public accessibility, • however the establishment of earmarked satellite offices could not take
place due to the delays in procurement process which was conducted in conjunction with the DPW.
• Delays in filling senior management posts, including appointment of nine provincial heads resulted in under spending in compensation of employees.
• Under spending on budgeted office furniture and IT equipment for the appointments which could not be made.

Economic classification R’ 000
Compensation of employees 8 293
Goods and services 15 366
Machinery and equipment 2 790
TOTAL Underspending 26 449
BREAKDOWN OF UNDERSPENDING

BREAKDOWN OF UNDERSPENDING - Compensation of employees: R8,2m
• R8, 2 million due to:
•1 x Executive Director for 7 months @ SR 15= R628 028•10 x Chief Director posts for 7 months @ SR 14 = R5 088 000•1 x Director ICT for 7 months @SR 13= R419 774•1x Director Investigations (Mpumalanga) for 6 months @SR13=R359 807 •Savings due to internal promotions: R 1 797 391
• Delays in filling some of the key funded posts including ED, provincial heads and PM: Investigations and Information Management has resulted in under-spending in compensation of employees
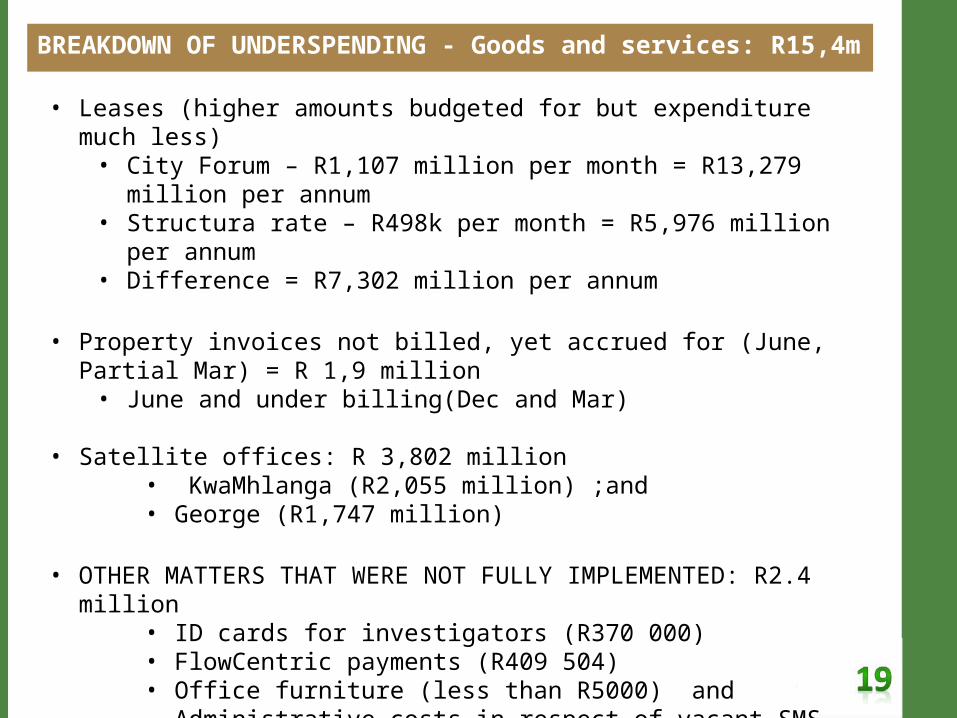
BREAKDOWN OF UNDERSPENDING - Goods and services: R15,4m
• Leases (higher amounts budgeted for but expenditure much less)• City Forum – R1,107 million per month = R13,279 million per annum• Structura rate – R498k per month = R5,976 million per annum• Difference = R7,302 million per annum
• Property invoices not billed, yet accrued for (June, Partial Mar) = R 1,9 million• June and under billing(Dec and Mar)
• Satellite offices: R 3,802 million• KwaMhlanga (R2,055 million) ;and • George (R1,747 million)
• OTHER MATTERS THAT WERE NOT FULLY IMPLEMENTED: R2.4 million• ID cards for investigators (R370 000)• FlowCentric payments (R409 504)• Office furniture (less than R5000) and Administrative costs in respect
of vacant SMS posts (R1 620 496)

BREAKDOWN OF UNDERSPENDING - Machinery and equipment: R2,8 m
• Delays in establishment of satellite offices R466 000
• Vacancies of Provincial Heads posts • Furniture R900 000• IT Equipment R282 000
• Delays in procurement and in delivery R1 152 000

Budget Allocations: 2013/14
2012/13 2013/14 % Increase
R 197 898 000 R 216 991 000 9.6%
2013/14 Budget per Programme (Final Appropriation)
Programme 2013/2014 Budget % of Final
Appropriation
R’000 %
Administration 88 446 40.8%
Investigation & Information Management
124 295 57.2%
Legal Services 4 250 2%
Total 216 991 100%
Budget per Economic Classification (Final Appropriation)
Economic Classification Budget (Final) Budget as % of Final
Appropriation
R’000 %
Compensation of employees 132 423 61%
Goods & Services 81 759 37.7%
Transfers 140 0.1%
Capital Assets 2 669 1.2%
TOTAL 216 991 100%

BUDGET 2013/14: First Quarter Expenditure per Programme
Budget per Programme (Appropriation) & Expenditure
Programme Budget (Final) Expenditure (Apr – June
2013)
Expenditure as % of Final Appropriation
R’000 R’000 %
Administration 88 446 19 337 21.9%
Investigation & Information Management
124 295 21 092 17.0%
Legal Services 4 250 1 085 25.5%
Total 216 991 41 514 19.1%

BUDGET 2013/14: First Quarter Expenditure per Economic Classification
Budget per Economic Classification (Appropriation) & Expenditure
Economic Classification
Budget (Final) Expenditure (April – June 2013)
Expenditure as % of Final Appropriation
R’000 R’000 %
Compensation 132 423 24 840 18.8%
Goods & Services 81 759 15 692 19.2%
Transfers 140 10 7.1%
Machinery & Equipment 2 669 972 36.4%
Payments for financial assets (debts written off)
- - -
Total 216 991 41 514 19.1%

Spending Trends: 1st Quarter 2013/14
•Compensation of Employees:Due to delays in the filling of various vacancies including:• Post of Executive Director vacant as from 01 September 2012,• Programme Manager 2 and 9 Provincial Heads (Chief Director
levels) have not yet been filled (vacant as from 01 April 2012).
•In terms of Goods & Services:• Leases: Structura vs. City Forum• Delays in finalisation of accommodation for satellite offices,
(Mpumalanga & Western Cape)
•In terms of Machinery and Equipment:• Awaiting outcome of roll-over application

Spending Trends: 1st Quarter 2013/14 as compared to 1st Quarter 2012/13Programme 2012/13 2013/14
R million Available
budget¹ April to June expenditure
2012/13April to June
percentage spent Main
appropriation Available
budget¹ April to June expenditure
2013/14April to June
percentage spent
Expenditure growth 12/13 to 13/14 April
to June²Operational Expenditure 1. Administration
86.4
15.0 17.3%
88.3
88.3
19.3 21.9% 29.1%
2. Investigation And Information Management
106.0
17.4
16.4% 124.3
124.3
21.1
17.0% 21.3%
3. Legal Services 5.4
0.5
9.6% 4.3
4.3
1.1
25.5% 109.9%
Sub Total 197.8 32.9 16.6% 216.9 216.9 41.5 19.1% 26.3%Transfers and Subsidies Departmental Agencies and Accounts
0.1
0.0
4.9% 0.1
0.1
-
0.0% -100.0%
Households -
-
- -
-
0.0
- -
Sub Total 0.1 0.0 4.9% 0.1 0.1 0.0 7.1% 100.0%Total 197.9 32.9 16.6% 217.0 217.0 41.5 19.1% 26.3%Economic Classification Current payments
192.0
32.9 17.1%
214.2
214.2
40.5 18.9% 23.3%
Compensation Of Employees
103.4
20.9
20.2% 132.4
132.4
24.8
18.8% 18.9%
Goods and services 88.6
12.0
13.5% 81.8
81.8
15.7
19.2% 31.0%
Interest And Rent On Land
-
-
- -
-
-
- -
Total transfers and subsidies
0.1
0.0
4.9% 0.1
0.1
0.0
7.1% 100.0%
Payments for capital assets
5.8
-
0.0% 2.7
2.7
1.0
36.4% -
Payments For Financial Assets
-
-
- -
-
-
- -
Total 197.9 32.9 16.6% 217.0 217.0 41.5 19.1% 26.3%1. After adjustments 2. Nominal
Actions taken/planned to avoid re-occurrence: Spending Trends
• Regular monitoring and update of action plan on the filling of vacancies • Regular engagement and follow up with the Department of Public Works.
The Directorate has developed a satellite office strategy which will improve the manner in which IPID satellite offices are established, particularly in rural areas
• The implementation of the proposed satellite office strategy will greatly contribute to the improvement in domestic travel cost pressures
• Improvement of internal control systems for the monitoring of expenditure patterns
• Continuous emphasis on cost effective measures to ensure that funds are spent on core activities of the Directorate
• Implementation of updated financial delegations• Close monitoring of procurement plans

PROGRESS ON PRIORITIES
27
• Implement ICT plan and governance framework ICT governance committee established ICT governance champion appointed
• Vacancy rate Reduced to 8.8 as at 31 July 2013 349 funded posts (318 filled)
• Prioritised training of investigators to ensure quality of investigation Recognition of Prior Learning: National Certificates – Resolving Crime (for Investigators
without a qualification) National Certificate: Resolving Crime National Diploma: Policing Investigation of Corruption Investigation of Torture Investigation of Sexual Offences DNA Training Training on IPID Manual
• The training on the IPID Manual is of significance importance as it focuses on investigation of criminal offences as provided for in Section 28 of the IPID Act including systemic corruption.
• The two groups of 40 Investigators each has completed the two weeks intensive training on the IPID Manual. The other two groups will attend training in September and October respectively.
• In addition to the above, the IPID has engaged the SAPS to accommodate its Investigators in their 2014/15 training schedule, there is also an agreement to train limited number of the IPID Investigators on the Detective Commander Training for the current financial year.

THANK YOU


