
Independent observations of catches and subsurface...
40
Independent observations of catches and subsurface mitigation efficiencies of modified trawl nets for endangered, threatened and protected megafauna bycatch in the Pilbara Fish Trawl Fishery Corey B. Wakefield a *, Stuart Blight a , Stacey R. Dorman a , Ainslie Denham a , Stephen J. Newman a , John Wakeford b , Brett W. Molony a , Adrian W. Thomson a , Clinton Syers a , Shane O’Donoghue a Fisheries Research Report No. 244, 2014 Fisheries Research Division Western Australian Fisheries and Marine Research Laboratories PO Box 20 NORTH BEACH, Western Australia 6920 a Western Australian Fisheries and Marine Research Laboratories, Department of Fisheries, Government of Western Australia, P .O. Box 20, North Beach, Western Australia, 6920, Australia. b M.G. Kailis Group, 50 Mews Road, Fremantle, Western Australia, 6160 * Corresponding author: Phone +61 (08) 9203 0111; Fax +61 (08) 9203 0199
-
Upload
nguyendieu -
Category
Documents
-
view
213 -
download
0
Transcript of Independent observations of catches and subsurface...

Independent observations of catches and subsurface mitigation efficiencies of modified trawl nets
for endangered, threatened and protected megafauna bycatch in
the Pilbara Fish Trawl FisheryCorey B. Wakefield a*, Stuart Blight a, Stacey R. Dorman a,
Ainslie Denham a, Stephen J. Newman a, John Wakeford b, Brett W. Molony a, Adrian W. Thomson a, Clinton Syers a,
Shane O’Donoghue a
Fisheries Research Report No. 244, 2014
Fisheries Research Division Western Australian Fisheries and Marine Research Laboratories PO Box 20 NORTH BEACH, Western Australia 6920
a Western Australian Fisheries and Marine Research Laboratories, Department of Fisheries, Government of Western Australia,
P.O. Box 20, North Beach, Western Australia, 6920, Australia.b M.G. Kailis Group, 50 Mews Road, Fremantle, Western Australia, 6160
* Corresponding author: Phone +61 (08) 9203 0111; Fax +61 (08) 9203 0199

ii Fisheries Research Report [Western Australia] No. 244, 2014
Correct citation:
Wakefield, C. B., Blight, S., Dorman, S. R., Denham, A., Newman, S. J., Wakeford, J., Molony, B. W., Thomson, A. W., Syers, C. and O’Donoghue, S. 2014. Independent observations of catches and subsurface mitigation efficiencies of modified trawl nets for endangered, threatened and protected megafauna bycatch in the Pilbara Fish Trawl Fishery. Fisheries Research Report No. 244. Department of Fisheries, Western Australia. 40 pp.
Enquiries:
WA Fisheries and Marine Research Laboratories, PO Box 20, North Beach, WA 6920 Tel: +61 8 9203 0111 Email: [email protected] Website: www.fish.wa.gov.au ABN: 55 689 794 771
A complete list of Fisheries Research Reports is available online at www.fish.wa.gov.au
© Department of Fisheries, Western Australia. February 2014. ISSN: 1035 - 4549 ISBN: 978-1-921845-60-4

Fisheries Research Report [Western Australia] No. 244, 2014 iii
Contents
Summary ............................................................................................................................... 1
1.0 Introduction .................................................................................................................. 2
2.0 Materials and Methods ................................................................................................ 4
2.1 PFTF area of operation and observer program regime .......................................... 4
2.2 Deck camera systems .............................................................................................. 6
2.3 Net camera systems ................................................................................................ 7
2.4 Trawl net designs .................................................................................................... 7
2.5 Video analysis ......................................................................................................... 9
2.6 Statistical analysis ................................................................................................... 11
3.0 Results ........................................................................................................................... 13
3.1 Levels and spatial distribution of observer coverage ............................................. 13
3.2 Observed abundances of megafauna in catches relative to subsurface interactions in trawl nets ........................................................................................................... 15
3.3 Reporting of ETP megafauna in statutory logbooks .............................................. 20
3.4 Comparisons of subsurface escapement efficiencies between the three trawl net configurations .................................................................................................. 20
3.5 Marine mammal attendance .................................................................................... 25
4.0 Discussion ...................................................................................................................... 26
5.0 Recommendations for future management strategies of ETP species interactions in the Pilbara Fish Trawl (Interim) Managed Fishery ................................................. 30
Acknowledgements .............................................................................................................. 31
References ............................................................................................................................. 32
Appendix 1. Wildlife Trade Operation approval and provisions for the Western Australian Pilbara Fish Trawl Interim Managed Fishery from the Commonwealth of Australia for the period of March 2011 to June 2013. ... 34

iv Fisheries Research Report [Western Australia] No. 244, 2014

Fisheries Research Report [Western Australia] No. 244, 2014 1
Summary
Mitigation of endangered, threatened and protected (ETP) species is a challenge in many commercial fisheries globally and independent observer programs are often implemented to determine accurate estimates of interaction rates. However, interactions with ETP species may be extremely rare requiring very high and therefore costly levels of observer coverage to provide adequate statistical rigor for such programs. The Pilbara Fish Trawl (Interim Managed) Fishery (PFTF) has a long history of developing and adopting mitigation measures that have resulted in very low capture rates of ETP megafauna, i.e. dolphins, turtles, sea snakes and sawfish. However, there has been uncertainty over the potential for unaccounted mortality of ETP megafauna from subsurface expulsion in poor condition through escape hatches in the PFTF trawl nets (particularly air breathing species). To examine this issue, all trawl vessels in the PFTF (n = 3) were fitted with dual-lens above water and subsurface within-net camera systems from June to December 2012. Above water cameras recorded continuously (except during malfunctions) and all video files were stored in read only folders and encrypted with passwords to prevent tampering. At the end of each trip these secure folders containing the video files were transferred onto external hard drives by Department of Fisheries staff for later analysis. The observer coverage rates of 85.2% of trawl catches above water (n = 1,916 trawls observed), and 71.7% of day-trawls (n = 774 trawls observed) and 53.9% of day-trawl hours (n = 1,013 h observed) below water, far exceeded that stipulated in the Bycatch Action Plan (22%) and levels achieved from previous studies from the PFTF. Captures of ETP megafauna were rare, despite very high levels of attendance in and around trawl nets by bottlenose dolphins (> 75% of trawls). All observed catches of ETP species were reported in statutory logbooks and these catches were consistent with previous data since exclusion grids were mandated in March 2006. Therefore, there was no evidence to suggest that captures of ETP species were being unreported by commercial fishers. About two thirds of all megafauna, including chondrichthyans, were expelled from escape hatches during trawling, with the majority of megafauna expelled relatively quickly (< 10 min). This resulted in more than half of the trawl catches containing no megafauna (51.4%). A total of 705 megafauna individuals were observed to exit the nets through an escape hatch during trawling. Of these megafauna, only one bottlenose dolphin was observed to exit these trawls in poor condition. A large turtle was observed to persist in a trawl for an extended period (60.1 min). However, despite its condition being inconclusive upon exiting, its duration in the net was well within the breath holding capabilities for marine turtles. Thus, the subsurface expulsion of megafauna in poor condition was extremely rare. No megafauna were observed to exit through the top opening escape slit. However, an upward excluding grid with a top opening escape hatch resulted in a higher proportion of escapement for most chondrichthyans. The loss of targeted scalefish through escape hatches occurred during less than 3% of trawls. Extensive subsurface observations determined that current mitigation strategies are highly effective for sea snakes, turtles and chondrichthyans (except sawfish), and that further investigation in the forward sections of trawl nets may provide useful information to improve mitigation strategies for dolphins and sawfish. The very low rates of mortalities of these ETP megafauna by the PFTF were considered to pose a negligible risk to their sustainability based on 1) these rates likely to be less than their natural mortality rates (e.g. at least 371 bottlenose dolphins stranded from 1981-2010), 2) they appear abundant in Western Australian waters despite large scale mortalities from historic foreign fishing (e.g. 13,459 cetacean mortalities from Taiwanese fishing from 1981-86), and 3) they have wide distributions and are highly mobile.
2 Fisheries Research Report [Western Australia] No. 244, 2014
1.0 Introduction
The retained catch, number of vessels, fishing effort, fishing area and level of bycatch from the contemporary State-managed Pilbara Fish Trawl (Interim) Managed Fishery (PFTF) are among the lowest compared to other trawl fisheries around the World (cf. Campos et al., 2007; Thurstan et al., 2010; Davie and Lordan, 2011; Witherell et al., 2012). The PFTF constitutes a significant commercial fishery asset for the state of Western Australia, recording the highest annual demersal scalefish catches of any state-managed fishery, with average annual landings valued at approximately $6.8 million since 2002 (Newman et al., 2012). Sustainable management of this major fisheries resource has reduced operations to three fulltime stern trawl vessels within an area of ca 6,900 square nautical miles, representing less than 5% of the total shelf area on the north coast of Western Australia (Newman et al., 2012).
There has been a relatively long and continuous history of trawling on the North West Shelf of Western Australia prior to the establishment of the State-managed PFTF in 1987. Since at least 1959, trawling in this area was dominated by vessels from Japan (1959 – 1963), Taiwan (1971 – 1989), South Korea and China (1979-1989) and Thailand (1985 – 1990), sometimes under joint-venture arrangements with Australia (Sainsbury, 1987; Sainsbury, 1988; Sainsbury, 1991; Ramm, 1994). Foreign fleets, particularly the Taiwanese, fished the area heavily until 1986, with more than 30,000 trawl hours per year and a peak catch in 1973 of more than 37,000 t (Ramm, 1994). Catches by foreign fleets declined rapidly in the 1980s due to a combination of changes in effort and fleets after the declaration of a 200 nm Economic Exclusion Zone, but also as a result of declining catches. Catches by the Taiwanese fleet declined to approximately 10,000 t by 1986 and to approximately 200 t in 1990 (Ramm, 1994). The declines in catches were associated with declines in the abundance of Lutjanus and Lethrinus species over the period from 1962 – 1983 (Sainsbury, 1988).
Since 1986, due to declining catches of scalefish (see Ramm, 1994) and concerns over the impacts of trawling, the Western Australian Department of Fisheries implemented a range of controls including effort limits, spatial closures and catch limits (Newman et al., 2012). Some of these spatial closures to trawling still exist and are among the longest standing trawl closures in Australia. The current PFTF is a fraction of the scale of the fishery at the height of Taiwanese effort. The current fleet of three vessels recorded less than 7,400 hours of effort in 2011, landing approximately 1,085 t of scalefish (Newman et al., 2012). This large reduction in the total trawl effort between the historic foreign fisheries and contemporary fisheries would have also likely resulted in a large reduction in interactions with endangered, threatened and protected (ETP) species. Although there are limited data available on the interactions of ETP species with foreign trawl vessels that fished the North West Shelf, in the nearby waters of the Kimberley and Arafura Seas a total of 13,459 cetaceans were estimated by independent observers to have been caught by Taiwanese gillnet and pair-trawlers over a 5-year period from mid-1981 to mid-1986 (Harwood et al., 1984; Hembree, 1986; Harwood and Hembree, 1987). Information on the incidental catches of other ETP species by foreign fishing vessels is not available.
The PFTF was first awarded a Wildlife Trade Operation (WTO) under the Commonwealth of Australia’s Environment Protection and Biodiversity Conservation (EPBC) Act in 2004 (http://www.environment.gov.au/coasts/fisheries/wa/pilbara-trawl/index.html). This included specific conditions around the observing, reporting and mitigation of cetacean and turtle interactions (http://www.environment.gov.au/coasts/fisheries/wa/pilbara-trawl/declaration.html). Further WTOs for the PFTF were awarded in 2007 (http://www.environment.gov.au/coasts/fisheries/wa/pilbara-trawl/pubs/declaration-december-2007.pdf) and 2011 (http://www.environment.gov.au/

Fisheries Research Report [Western Australia] No. 244, 2014 3
coasts/fisheries/wa/pilbara-trawl/pubs/wto-march2011.pdf), with further recommendations and conditions around dolphin and turtle interactions. Since 2004, the recording of interactions with ETP species by the PFTF has been compulsory in statutory logbooks. The mandatory use of exclusion grids and escape hatches in trawl nets from March 2006, resulted in much lower numbers of dolphin and turtle mortalities as recorded by independent observers (Stephenson et al., 2008). However, given the much greater effort from foreign trawl fleets (in excess of 65,000 h in some years, Ramm, 1994) and the recorded numbers of dolphin mortalities from the same fishing vessels in nearby waters in northern Australia (Harwood et al., 1984; Hembree, 1986; Harwood and Hembree, 1987), it is likely that dolphins, and other ETP species mortalities were many orders of magnitude greater by foreign trawlers over the four decades they operated in the North West Shelf, than those reported by the PFTF in recent years.
Mitigation of ETP species interactions is a common problem in many trawl and gillnet fisheries globally, with 98% of cetacean bycatch reported in gillnet fisheries (Read et al., 2006). Independent observer programs are commonly implemented in these fishery to acquire accurate estimates of interaction rates (Northbridge, 1996). However, interactions with ETP species may be extremely rare requiring very high and therefore costly levels of observer coverage to provide adequate statistical rigor for such programs (Rossman, 2007; Taylor et al., 2007). If the level of observer coverage is insufficiently low then caution needs to be taken when considering subsequent research findings (e.g. ~1% observer coverage, Jaiteh et al., 2012). However, the higher levels of observer coverage associated with improved mitigation measures ultimately result in a significant increase in costs, which are typically shared between Governing agencies, license holders, and, to a certain degree, passed onto consumers. Allen and Loneragan (2010) reported the capture of dolphins to be very rare (~0.005 trawl-1 in 2010), despite dolphins being observed foraging (depredating) inside trawl nets during 98% of trawls. This low capture rate formed the current high estimate for the level of observer coverage (~62%) required to provide suitable statistical power for analyses. It was also recommended that cameras be mounted within trawl nets to observe the condition of ETP megafauna expelled from escape gaps during trawling (Stephenson et al., 2008; Allen and Loneragan, 2010). A more recent pilot study provided useful advice into the practicalities of using an electronic observer program for the PFTF (Diver, 2012). The report by Diver (2012) suggested that an electronic observer program could be used to collect information on the catches of large animals (i.e. megafauna), but would benefit by being accompanied by subsurface observations of escape hatches within the nets.
This project addresses the provisions set out in the current WTO (Appendix 1), aimed at conducting an intensive six month observer program to obtain independent observations of catches to improve precision and accuracy in estimating ETP megafauna interactions and captures. In addition, this study aimed to collect within-net observations to determine the effectiveness and efficiency of three configurations of exclusion gear in trawl nets to mitigate subsurface interactions with all megafauna species during trawling. The efficiencies of these modified trawl nets also considered the rates of targeted scalefish loss associated with the exclusion gear.

4 Fisheries Research Report [Western Australia] No. 244, 2014
2.0 Materials and Methods
2.1 PFTF area of operation and observer program regime
The PFTF uses a single stern trawl net towed close to the substrate to target demersal scalefish (e.g. Lutjanidae, Lethrinidae and Epinephelidae, Newman et al., 2012). The boundaries of the PFTF were established in 1998 and allow trawl operations on the North West Shelf of Western Australia (WA) between 116° and 120° E and essentially within the 50 to 100 m depth contours (Fig. 1). There are four management areas open to fishing within this trawl fishery (areas 1, 2, 4 and 5, Fig. 1), each with separate annual transferable effort allocations. In addition to the areas outside of these being closed to trawling, there is a Targeted Fisheries Closed area located centrally in this trawl fishery which has been closed to commercial trawl and trap fishing since 1998 (area 3, Fig. 1). The allocated annual trawl effort is currently consolidated onto three full time vessels, which are each fitted with tamperproof satellite monitoring systems to ensure trawling is regulated within the management boundaries and annual effort allocations.
A six month observer program was established to independently collect catch information and subsurface interactions with ETP and chondrichthyan megafauna species with exclusion gear in trawl nets on all three vessels operating in the PFTF from mid June to mid December 2012. Cameras were used in place of human observers as a cost effective method for obtaining high levels of representative coverage to adequately sample rare events, based on reported capture rates of dolphins and turtles (see Allen and Loneragan, 2010). Deck cameras were installed on all three vessels to observe the numbers of each megafauna species in catches from all trawls (day and night) and surface interactions with marine mammals during net retrieval (day only). In addition, cameras were installed in trawl nets during daylight (0830-1630 h) to observe the effectiveness and efficiency of mitigating megafauna species interactions with three different exclusion gear configurations in trawl nets (Fig. 2).
The start and end positions, times and depths of each trawl were obtained from statutory logbooks populated by the Master of each vessel. Incidental catches of four ETP megafauna groups (i.e. dolphins, turtles, sea snakes and sawfish) and their condition (alive or dead) upon discard were also recorded in these logbooks. This information facilitated comparisons between catches of ETP megafauna observed from deck cameras and those reported in logbooks. In addition, the numbers of ETP megafauna caught during this six month study were compared with those recorded in logbooks since 2004, to determine differences over time, between seasons or during periods with no independent observer program.

Fisheries Research Report [Western Australia] No. 244, 2014 5
Figure 1. Map of the five management areas of the Pilbara Fish Trawl Fishery (areas 1 to 5) on the northwest coast of Western Australia (WA). Note Area 3 and outside of areas 1 to 5 have been closed to commercial trawl fishing since 1998.

6 Fisheries Research Report [Western Australia] No. 244, 2014
Figure 2. Schematic diagrams (above) and in situ images taken from the net camera systems with the camera positioned behind the grid facing forward (below), for the three different net configurations, i.e. (a) downward excluding net, (b) upward excluding net and (c) experimental net (SM, stretched mesh).
2.2 Deck camera systems
Deck camera systems (MOBOTIX DualDome D14) were installed on each vessel and consisted of two independent lenses that recorded in high definition (1280 x 960 pixels per lens) and were waterproof and shock proof (containing no mechanical moving parts). A single deck camera was mounted at a high vantage point at the stern of each vessel to optimise the field of view for both lenses. This allowed one lens to be positioned above and directed toward the catch-sorting area and the other to be directed astern of the vessel to observe surface interactions with dolphins and other megafauna that may occur during net retrieval. The cameras recorded continuously at one frame per second (fps) to a computer (Apple Mac Mini™) located in the wheelhouse via a shielded Power Over Ethernet cable on each vessel. A live feed was setup
Fisheries Research Report [Western Australia] No. 244, 2014 7
on a monitor in the wheelhouse to allow camera function to be monitored periodically by the vessels crew. Video images were truncated into files containing one hour of elapsed time and stored in a ‘read only’ folder with password encryption to prevent tampering. At the end of each trip when vessels returned to port, these secure folders containing all video files were transferred onto external hard drives by Fisheries Research staff. The files on these external hard drives were also password encrypted and sent registered post to the Western Australian Fisheries and Marine Research laboratories (WAFMRL) for analysis. Wheelhouse computers were enabled with a secure internet connection, which became available when the vessels were within range, typically only in port. This internet connection allowed for remote monitoring of potential shifts in lens positions caused by vibrations during trawling (see Diver, 2012), remote computer programming if required and monitoring of available storage space to determine the frequency for downloading footage to hard drives.
2.3 Net camera systems
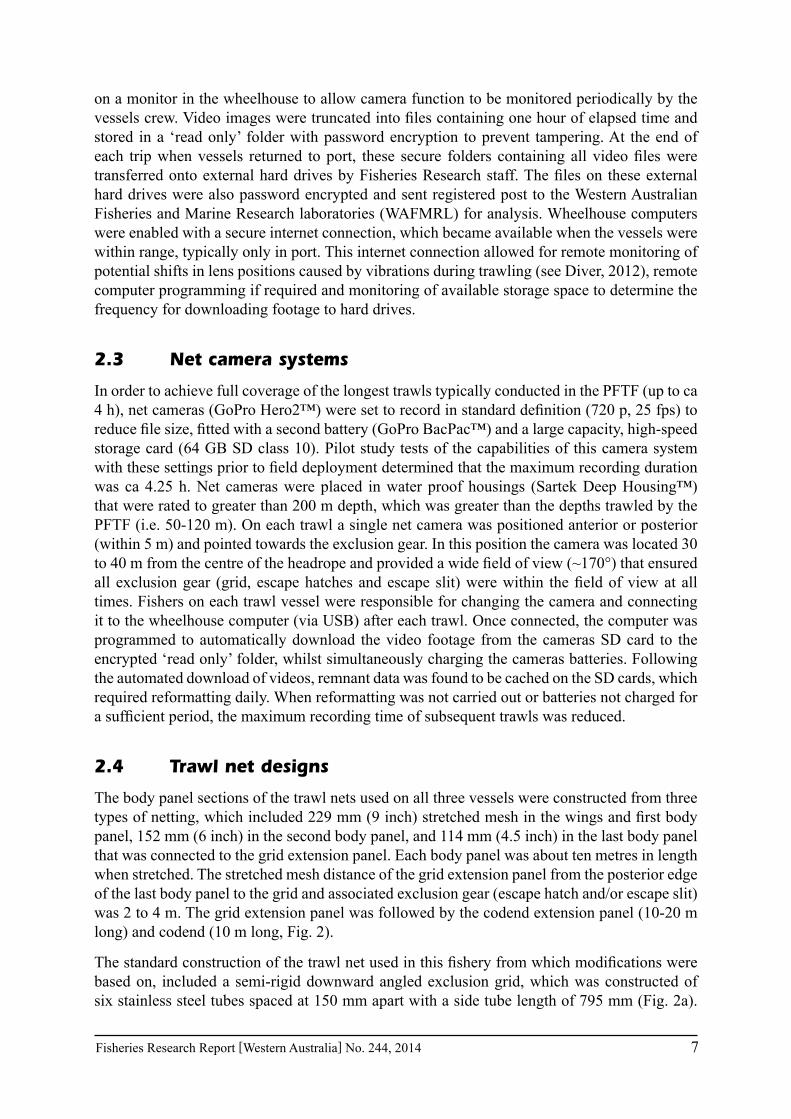
In order to achieve full coverage of the longest trawls typically conducted in the PFTF (up to ca 4 h), net cameras (GoPro Hero2™) were set to record in standard definition (720 p, 25 fps) to reduce file size, fitted with a second battery (GoPro BacPac™) and a large capacity, high-speed storage card (64 GB SD class 10). Pilot study tests of the capabilities of this camera system with these settings prior to field deployment determined that the maximum recording duration was ca 4.25 h. Net cameras were placed in water proof housings (Sartek Deep Housing™) that were rated to greater than 200 m depth, which was greater than the depths trawled by the PFTF (i.e. 50-120 m). On each trawl a single net camera was positioned anterior or posterior (within 5 m) and pointed towards the exclusion gear. In this position the camera was located 30 to 40 m from the centre of the headrope and provided a wide field of view (~170°) that ensured all exclusion gear (grid, escape hatches and escape slit) were within the field of view at all times. Fishers on each trawl vessel were responsible for changing the camera and connecting it to the wheelhouse computer (via USB) after each trawl. Once connected, the computer was programmed to automatically download the video footage from the cameras SD card to the encrypted ‘read only’ folder, whilst simultaneously charging the cameras batteries. Following the automated download of videos, remnant data was found to be cached on the SD cards, which required reformatting daily. When reformatting was not carried out or batteries not charged for a sufficient period, the maximum recording time of subsequent trawls was reduced.
2.4 Trawl net designs
The body panel sections of the trawl nets used on all three vessels were constructed from three types of netting, which included 229 mm (9 inch) stretched mesh in the wings and first body panel, 152 mm (6 inch) in the second body panel, and 114 mm (4.5 inch) in the last body panel that was connected to the grid extension panel. Each body panel was about ten metres in length when stretched. The stretched mesh distance of the grid extension panel from the posterior edge of the last body panel to the grid and associated exclusion gear (escape hatch and/or escape slit) was 2 to 4 m. The grid extension panel was followed by the codend extension panel (10-20 m long) and codend (10 m long, Fig. 2).
The standard construction of the trawl net used in this fishery from which modifications were based on, included a semi-rigid downward angled exclusion grid, which was constructed of six stainless steel tubes spaced at 150 mm apart with a side tube length of 795 mm (Fig. 2a).
8 Fisheries Research Report [Western Australia] No. 244, 2014
An escape hatch was cut into the bottom of the trawl net at the base of and forward to this grid with a mesh cover opening backward to facilitate the subsurface expulsion of megafauna and benthos during trawling (Figs 2a and 3). The mesh panels on this net consisted of 105 mm (stretched) diamond mesh in the grid and codend extension panels and 110 mm (stretched) diamond mesh in the codend. Herein, this standard trawl net configuration was referred to as the ‘downward excluding net’.
The first of the two modified trawl nets consisted of an exclusion grid that was rotated to achieve an upwardly inclined grid (Fig. 2b). The escape hatch and mesh cover for this net was shifted to the top of the net immediately forward of the grid (Fig. 2b). The grid was made rigid and the spacing of the stainless steel tubes was increased to 200 mm with the length of the side bars increased to 1030 mm (Fig. 2b). The mesh sizes used in this modified net were identical to the downward excluding net. Flume tanks trials of this net determined that additional floats were needed on the top of the grid to optimise the nets fishing performance (Figs 2b and 3). Herein, this modified trawl net was referred to as the ‘upward excluding net’.
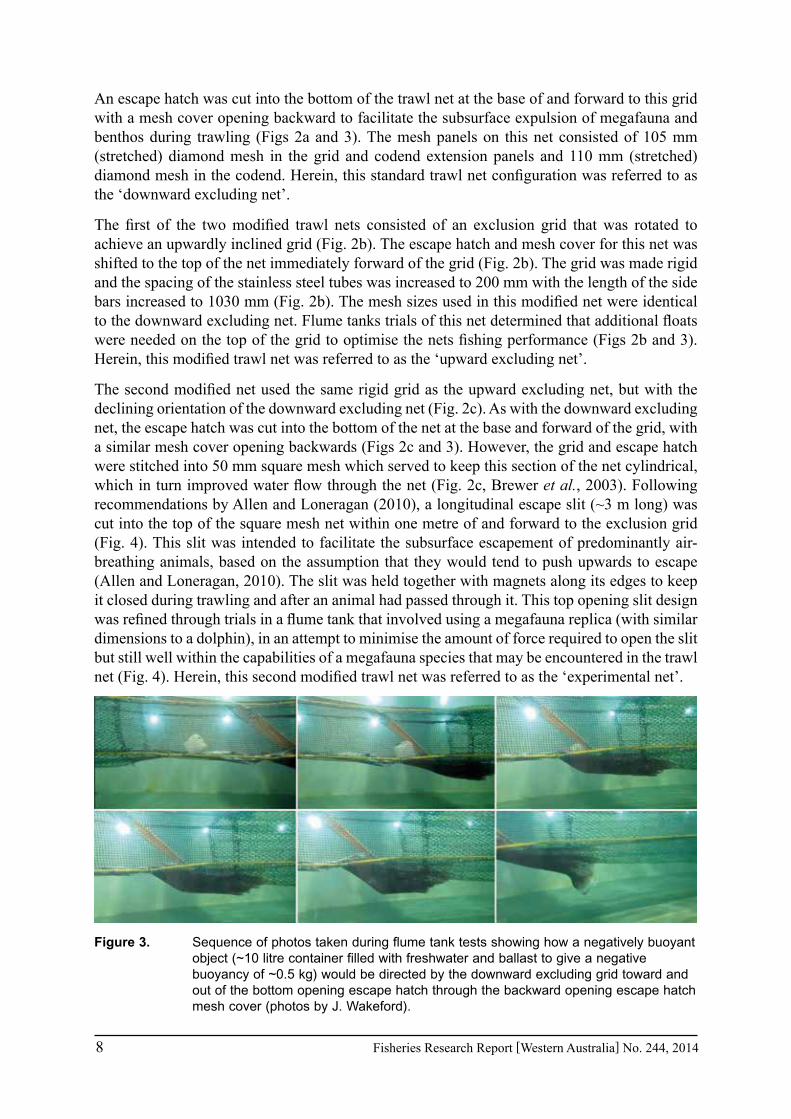
The second modified net used the same rigid grid as the upward excluding net, but with the declining orientation of the downward excluding net (Fig. 2c). As with the downward excluding net, the escape hatch was cut into the bottom of the net at the base and forward of the grid, with a similar mesh cover opening backwards (Figs 2c and 3). However, the grid and escape hatch were stitched into 50 mm square mesh which served to keep this section of the net cylindrical, which in turn improved water flow through the net (Fig. 2c, Brewer et al., 2003). Following recommendations by Allen and Loneragan (2010), a longitudinal escape slit (~3 m long) was cut into the top of the square mesh net within one metre of and forward to the exclusion grid (Fig. 4). This slit was intended to facilitate the subsurface escapement of predominantly air-breathing animals, based on the assumption that they would tend to push upwards to escape (Allen and Loneragan, 2010). The slit was held together with magnets along its edges to keep it closed during trawling and after an animal had passed through it. This top opening slit design was refined through trials in a flume tank that involved using a megafauna replica (with similar dimensions to a dolphin), in an attempt to minimise the amount of force required to open the slit but still well within the capabilities of a megafauna species that may be encountered in the trawl net (Fig. 4). Herein, this second modified trawl net was referred to as the ‘experimental net’.
Figure 3. Sequence of photos taken during flume tank tests showing how a negatively buoyant object (~10 litre container filled with freshwater and ballast to give a negative buoyancy of ~0.5 kg) would be directed by the downward excluding grid toward and out of the bottom opening escape hatch through the backward opening escape hatch mesh cover (photos by J. Wakeford).

Fisheries Research Report [Western Australia] No. 244, 2014 9
Figure 4. Sequence of photos taken during flume tank tests showing a performance evaluation of a megafauna replica passing through the top-opening escape slit (photos by J. Wakeford).
2.5 Video analysis
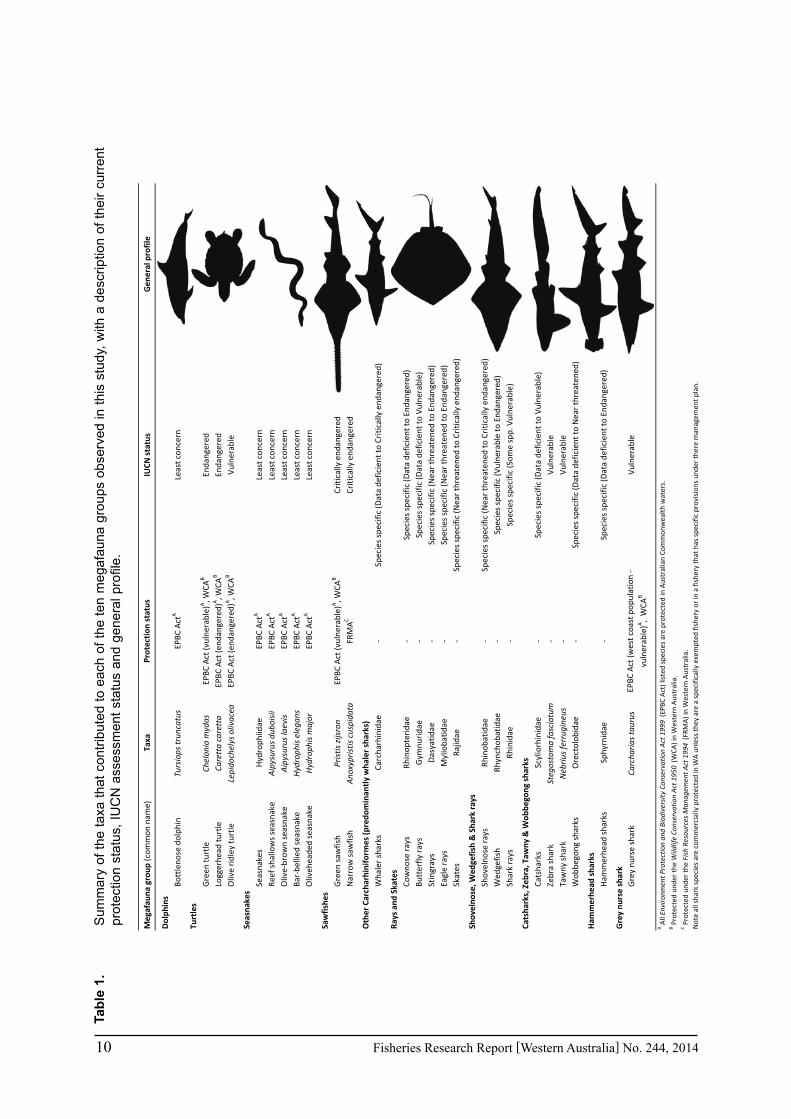
Videos from the deck cameras were viewed at WAFMRL (QuickTime 10.1™) with data input into a custom database (FileMaker Pro 12™). The numbers of individuals of each megafauna species were counted from each trawl catch. Each megafauna species was identified to the lowest possible taxa. These megafauna species were placed into ten groups based on their overall body profile (Table 1). The duration of each trawl was measured from the time the net drum (reel) stopped rotating with the trawl net deployed, to the time the net drum commenced rotating signifying the commencement of net retrieval. During daylight retrievals, the relative abundances of marine mammals interacting with the net on the surface were determined as the maximum number visible in the field of view within a single frame (MaxN). On the surface, trawl nets were closely monitored for potential fallouts of any megafauna species from the escape gaps and net mouth. The reduced visibility at night prevented confident observations of these surface interactions and fallouts. The incidental catches of megafauna species and their position of retention within the trawl net was recorded for each trawl. The condition of all ETP individuals upon discarding was obtained from vessel logbooks, as this was difficult to determine from deck camera videos.
Videos recorded from the net cameras were analysed using a custom interface (Event Measure version 3.32, developed by the Australian Institute of Marine Science) to collect information on subsurface interactions of megafauna species within each of the three net configurations. The relative abundances of each megafauna species recorded inside the nets were the total number observed per trawl. The pathway taken by each megafauna interaction within nets was categorised as; 1) passing through the grid to the codend, 2) retained ahead of grid, or 3) exited through an escape hatch or slit. The time taken for each individual to escape through a hatch or slit was measured from their initial contact or close proximity to the exclusion grid to the time they had entirely passed through the hatch or slit. The condition status of each individual prior to exiting or during retention, particularly air breathing animals, was determined from the video footage. The occurrences and causes of any loss of targeted scalefish were also noted for each of the three trawl net configurations. The attendance outside of the net during trawling for any of the megafauna groups was also recorded with their relative abundance determined as the maximum number visible in the field of view at any one time (MaxN).
10 Fisheries Research Report [Western Australia] No. 244, 2014
Tab
le 1
.
Sum
mar
y of
the
tax
a th
at c
ontr
ibut
ed t
o ea
ch o
f th
e te
n m
egaf
auna
gro
ups
obse
rved
in t
his
stud
y, w
ith a
des
crip
tion
of t
heir
curr
ent
prot
ectio
n st
atus
, IU
CN
ass
essm
ent
stat
us a
nd g
ener
al p
rofil
e.
Meg
afau
na gro
up (c
omm
on n
ame)
Taxa
IUCN
sta
tus
Gen
eral
pro
file
Dol
phin
sBo
ttle
nose
dol
phin
Tursiops
trun
catu
sLe
ast c
once
rn
Turtle
sG
reen
turt
leCh
elon
ia m
ydas
Enda
nger
edLo
gger
head
turt
leCa
retta ca
retta
Enda
nger
edO
live
ridl
ey tu
rtle
Lepido
chelys
oliv
acea
Vuln
erab
le
Seas
nake
sSe
asna
kes
Hyd
roph
iidae
Leas
t con
cern
Reef
sha
llow
s se
asna
keAipys
urus
dub
oisii
Leas
t con
cern
Oliv
e-‐br
own
seas
nake
Aipys
urus
laev
isLe
ast c
once
rnBa
r-‐be
llied
sea
snak
eHyd
roph
is elega
nsLe
ast c
once
rnO
liveh
eade
d se
asna
keHyd
roph
is m
ajor
Leas
t con
cern
Saw
fishe
sG
reen
saw
fish
Pristis
zijs
ron
Criti
cally
end
ange
red
Nar
row
saw
fish
Ano
xypr
istis
cus
pida
taCr
itica
lly e
ndan
gere
d
Oth
er C
arch
arhi
nifo
rmes
(pre
dom
inan
tly w
hale
r sh
arks
)W
hale
r sh
arks
Carc
harh
inid
ae-‐
Rays
and
Ska
tes
Cow
nose
ray
sRh
inop
teri
dae
-‐Sp
ecie
s sp
ecifi
c (D
ata
defic
ient
to E
ndan
gere
d)Bu
tter
fly r
ays
Gym
nuri
dae
-‐Sp
ecie
s sp
ecifi
c (D
ata
defic
ient
to V
ulne
rabl
e)St
ingr
ays
Das
yatid
ae-‐
Spec
ies
spec
ific
(Nea
r th
reat
ened
to E
ndan
gere
d)Ea
gle
rays
Myl
ioba
tidae
-‐Sp
ecie
s sp
ecifi
c (N
ear
thre
aten
ed to
End
ange
red)
Skat
esRa
jidae
-‐
Shov
elno
se, W
edge
fish
& Sha
rk ray
sSh
ovel
nose
rays
Rhin
obat
idae
-‐W
edge
fish
Rhyn
chob
atid
ae-‐
Spec
ies
spec
ific
(Vul
nera
ble
to E
ndan
gere
d)Sh
ark
rays
Rhin
idae
-‐Sp
ecie
s sp
ecifi
c (S
ome
spp.
Vul
nera
ble)
Cats
hark
s, Zeb
ra, T
awny
& W
obbe
gong
sha
rks
Cats
hark
sSc
ylio
rhin
idae
-‐Sp
ecie
s sp
ecifi
c (D
ata
defic
ient
to V
ulne
rabl
e)Ze
bra
shar
kSt
egos
tom
a fa
sciatu
m-‐
Vuln
erab
leTa
wny
sha
rkNeb
rius
ferrug
ineu
s-‐
Vuln
erab
leW
obbe
gong
sha
rks
Ore
ctol
obid
ae-‐
Spec
ies
spec
ific
(Dat
a de
ficie
nt to
Nea
r th
reat
ened
)
Ham
mer
head
sha
rks
Ham
mer
head
sha
rks
Sphy
rnid
ae-‐
Spec
ies
spec
ific
(Dat
a de
ficie
nt to
End
ange
red)
Gre
y nu
rse
shar
kG
rey
nurs
e sh
ark
Carcha
rias
taur
usVu
lner
able
A A
ll En
viro
nmen
t Pro
tection an
d Biod
iver
sity
Con
serv
ation Act 199
9 (E
PBC
Act
) lis
ted
spec
ies
are
prot
ecte
d in
Aus
tral
ian
Com
mon
wea
lth w
ater
s.B P
rote
cted
und
er th
e W
ildlife Co
nser
vatio
n Act 195
0 (W
CA) i
n W
este
rn A
ustr
alia
.C P
rote
cted
und
er th
e Fish
Res
ources
Man
agem
ent A
ct 199
4 (F
RMA
) in
Wes
tern
Aus
tral
ia.
Not
e al
l sha
rk s
peci
es a
re c
omm
erci
ally
pro
tect
ed in
WA
unl
ess
they
are
a s
peci
fical
ly e
xem
pted
fish
ery
or in
a fi
sher
y th
at h
as s
peci
fic p
rovi
sion
s un
der
ther
e m
anag
emen
t pla
n.
EPBC
Act
(end
ange
red)
A, W
CAB
EPBC
Act
A
EPBC
Act
A
EPBC
Act
A
Prot
ection
sta
tus
EPBC
Act
A
EPBC
Act
(vul
nera
ble)
A, W
CAB
EPBC
Act
(end
ange
red)
A, W
CAB
EPBC
Act
A
EPBC
Act
A
EPBC
Act
(vul
nera
ble)
A, W
CAB
FRM
AC
EPBC
Act
(wes
t coa
st p
opul
atio
n -‐
vuln
erab
le)A
, W
CAB
Spec
ies
spec
ific
(Nea
r th
reat
ened
to C
ritic
ally
end
ange
red)
Spec
ies
spec
ific
(Nea
r th
reat
ened
to C
ritic
ally
end
ange
red)
Spec
ies
spec
ific
(Dat
a de
ficie
nt to
Cri
tical
ly e
ndan
gere
d)
Fisheries Research Report [Western Australia] No. 244, 2014 11
2.6 Statistical analysis
The spatial distribution of trawls observed from both the deck and net camera systems were analysed from maps overlayed with mid latitudes and longitudes of each trawl within each management area using GIS software (ArcMAP 10). This spatial distribution was compared to MaxN estimates of marine mammals in attendance on the outside of the trawl nets during fishing.
The consistency of the electronic observer program to report similar numbers of ETP megafauna (i.e. dolphins, turtles, sea snakes, green sawfish and narrow sawfish) to those recorded in statutory logbooks was assessed by comparing the historic range and trends in catches from the previous six seasons (2006 – 2012) since exclusion gear was mandated (March 2006). The abundance of these animals were identified as possibly varying between quarters and so as to reduce any issues of effort varying between quarters across seasons these comparisons of catches were restricted to similar periods within each year, i.e. the last two quarters of each year (June – December). Due to the low number of data points (i.e. six seasons) a statistical method such as time series analysis was not considered appropriate for assessing the consistency of observed catches from the six month observer period to that expected based on historic logbook data.
The effectiveness of each exclusion gear configuration was determined by firstly, comparing the mean numbers of interactions of megafauna observed within the nets to those recorded in the catches. Secondly, any important behavioural responses made by the megafauna during subsurface interactions in relation to the exclusion gear that may aid in improving mitigation strategies were recorded. The efficiency of the three net configurations in mitigating megafauna retention in trawls was investigated using the proportions of escape for each net type and associated escape times. Analyses were conducted individually for each of the ten megafauna groups (see Table 1). Each interaction was considered as an independent observation for a given net configuration. All analyses were conducted using the R language for statistical computing (R Development Core Team, 2013). The proportions of animals that escaped from each of the three net configurations for each megafauna group were assumed to follow a binomial distribution, ~ ( , )X B n p ; where n is the number of trials and p the probability of escaping. Clopper-Pearson confidence intervals were calculated for the proportion of animals escaping for each of the three net configurations and the ten megafauna groups. It should be noted that this interval tends to be larger than necessary for 1-a confidence, and therefore it is said to be a conservative confidence interval (Zar, 2010).
Differences in the proportions of escapement for each megafauna group between the three net configurations were examined using contingency table analysis (using chi-square tests). This test requires adequate sample sizes, with counts of more than five in 80% of categories and no categories with zero expected counts (Zar, 2010). Based on these guidelines, there was insufficient data (i.e. interactions were rare) spread over all three net treatments to facilitate net efficiency comparisons for five of the ten megafauna groups (dolphins, turtles, sawfishes, hammerhead sharks and grey nurse sharks). A chi-square test of homogeneity was conducted to assess whether the proportion of animals that escaped differed among net configurations for these five remaining megafauna groups, testing the null hypothesis that the proportions of animals escaping for each of the three net configurations were similar. When a significant relationship was observed, post-hoc multiple pairwise comparisons using a procedure that is analogous to a Tukey-type multiple comparison test was used to explore differences (Zar, 2010). As proportions from 0 to 1 form a binomial rather than a normal distribution, with the deviation from normality being greater for small or large percentages (i.e. 0–30% and 70–100%), an angular transformation of each sample proportion was used, such that the resultant data had an underlying distribution that was nearly normal (Zar, 2010);
12 Fisheries Research Report [Western Australia] No. 244, 2014
;
where X is the count and n is the sample size composing each sample proportion. The difference in the transformed proportions was calculated, along with the standard error, for each comparison using;
;
where An and Bn were the sample sizes for the two proportions being compared. The test statistic, known as the studentised range, is the difference in the transformed proportions divided by the standard error. Significant differences among proportions at the a level were observed if the test statistic was greater than the critical studentised range statistic given (qα,∞,k), with 3k = groups in this analysis.
The expected proportion of escapement and associated uncertainty for each net configuration for each megafauna group were generated from 10,000 bootstrap estimates. Each bootstrap sample consisted of the same number of samples for each net configuration as the original sample. The distributions of the bootstrap estimates of escape proportions were compiled for each net type within each of the five megafauna groups, and 2.5 and 97.5 percentiles of these estimates were used to form the upper and lower 95% confidence limits and were comparable with the Clopper-Pearson intervals computed previously. If a non-significant relationship was observed for escape proportions among net types, a post-hoc power analysis was conducted to examine whether small sample sizes may have influenced the significance of some of the statistical comparisons. Power analyses were used to calculate the minimum sample sizes required to achieve 80% power based on the effect size observed for other species, i.e.
;
where P1i are the cell proportions under the null hypothesis of no difference between net configurations and P0i are the cell proportions observed (Cohen, 1988).
The distributions of escapement times for each net configuration and megafauna group combination were considered as an additional measure of mitigation efficiency. As with the analysis of escape proportions, there were insufficient data (i.e. interactions were rare) spread over all three net treatments to facilitate net efficiency comparisons for five of the ten megafauna groups (dolphins, turtles, sawfishes, hammerhead sharks and grey nurse sharks). Escape times were analysed using cumulative frequency distributions to identify those nets for which some individuals may have taken extended periods of time to exit through the escape hatches or slit.

Fisheries Research Report [Western Australia] No. 244, 2014 13
3.0 Results
3.1 Levels and spatial distribution of observer coverage
During the six-month observer period there were 2,250 trawls completed by the three commercial vessels. Catches from 85.2% of these trawls were independently observed using the deck camera systems (Table 2). The level of coverage differed among the vessels, with the lowest being 67.1% due to a camera malfunction that rendered it inoperable for two fishing trips (ca four weeks). The other two vessels had higher levels of observer coverage (i.e. 98.9% and 91.2%, Table 2). During this period, net camera systems were deployed in 774 day-trawls with an observer coverage rate of 71.7%. However, considering the net cameras did not always record the entire trawl, observer coverage based on trawl hours was slightly lower (53.9%). Overall, a total of 1,013 h of subsurface footage were observed from within the trawl nets (Table 2).
The numbers of trawls observed for the three net types were not evenly distributed among the three vessels (Table 3). While two of the vessels used more than one net configuration, each vessel primarily used one net type. This meant that statistical differences among vessels could not be investigated. As such, subsequent analyses were assumed to primarily explore differences in net type, but influencing factors such as vessel and/or skipper could not be excluded. The spatial distribution of observed trawls from both the deck and net camera systems were well spread throughout the four trawl managed areas (Fig. 5). The high levels of observer coverage and similarities between the spatial distributions of observed versus all trawls, suggested that the data collected during this six month period provided adequate representation of the fishing operations of the PFTF.
Table 2. Total number of trawls and cumulative hours trawled (during the day from 0830-1630 h), and the level of observer coverage from deck and net camera systems for each vessel from mid-June to mid-December 2012.
Deck camera
all trawls day trawls day hours all trawls (%) day trawls (%) day hours (%)
A 796 389 658 787 (98.9%) 286 (73.5%) 399 (60.6%)B 634 302 593 579 (91.2%) 185 (61.3%) 257 (43.3%)C 820 388 628 550 (67.1%) 303 (78.1%) 357 (56.8%)
Overall 2,250 1,079 1,879 1,916 (85.2%) 774 (71.7%) 1,013 (53.9%)
Net cameraVessel logbookVessel
Table 3. Numbers of trawls observed from the deck and net camera systems for each trawl net configuration used by each vessel.
Downward Upward Experimental Downward Upward Experimental
A 787 − − 286 − −B 34 545 − 15 170 −C − 179 371 − 46 257
Overall 821 724 371 301 216 257
VesselDeck camera Net camera

14 Fisheries Research Report [Western Australia] No. 244, 2014
Figure 5. Spatial Distribution of (a) all trawls from mid June to mid December from statutory logbooks, (b) observed trawls from the deck camera systems (grey circles, n = 1,916) and net camera systems (black circles, n = 774) and (c) the numbers of marine mammals (bottlenose dolphins Tursiops truncatus being the only species observed) observed in attendance either on the surface of the water or subsurface interactions on the outside of the trawl nets.

Fisheries Research Report [Western Australia] No. 244, 2014 15
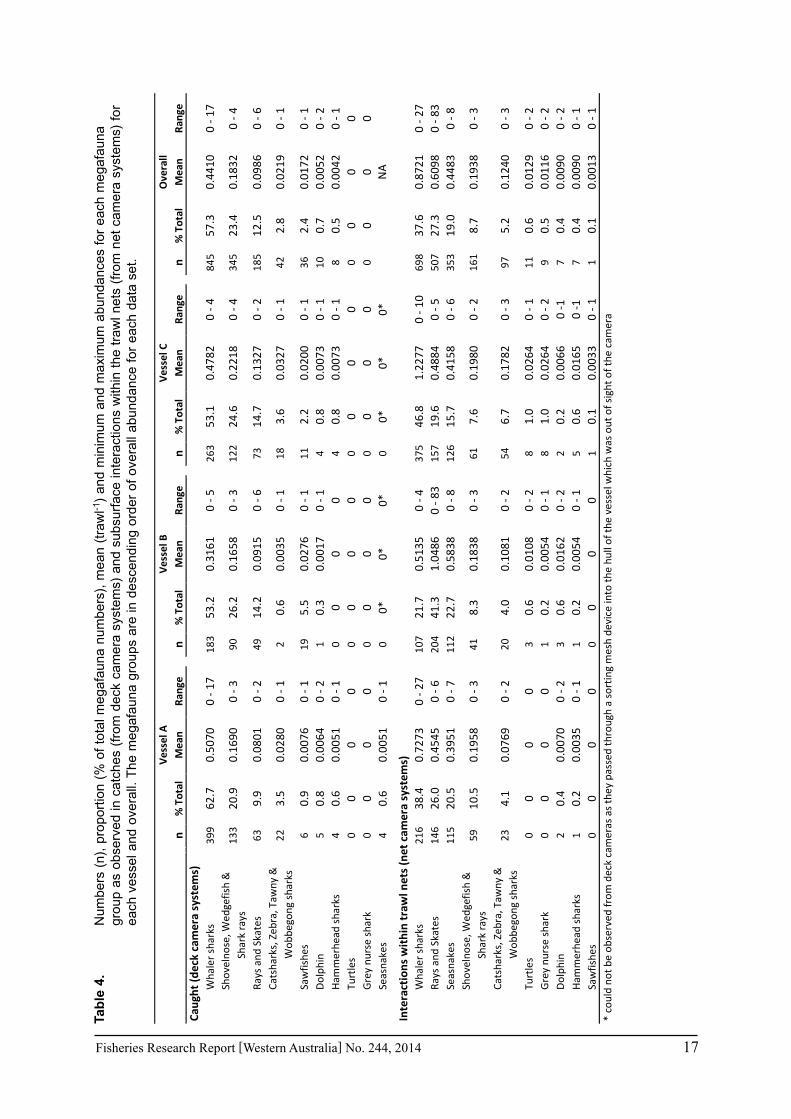
3.2 Observed abundances of megafauna in catches relative to subsurface interactions in trawl nets
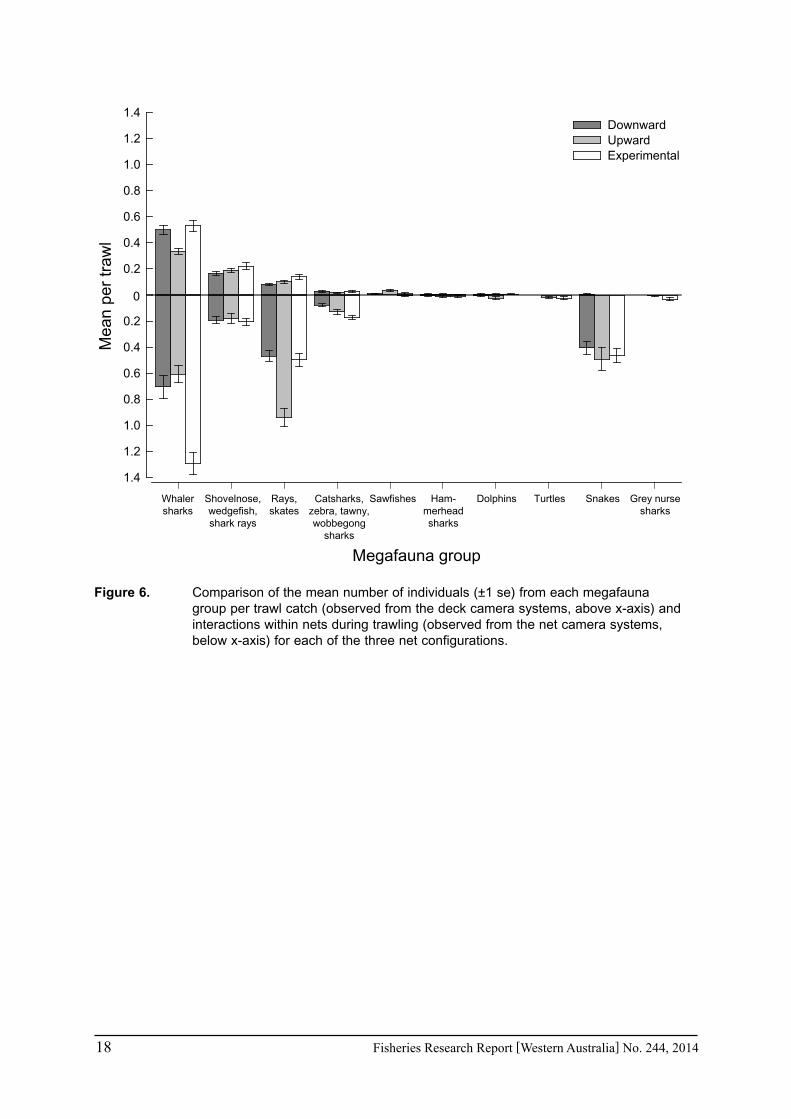
There were a total of 1,475 megafauna individuals observed in catches of 1,916 trawls, i.e. 0.77 individuals per trawl. Slightly more than half of the observed trawl catches contained no megafauna (51.4%). Whaler sharks were the most commonly caught group representing 57.3% of overall megafauna and the highest catch rates (Table 4, Fig. 6). Sawfishes, dolphins and hammerhead sharks were among the lowest encountered species in the trawl catches, accounting for 2.4%, 0.7% and 0.5% of all megafauna, respectively. Sea snakes could not be accurately observed in the catches of two of the trawl vessels, as they passed through a sorting grid into the hull of the vessel and were discarded out of sight of the camera. However, sea snakes were rarely encountered in the catches of the third vessel (Table 4). There were no turtles or grey nurse sharks observed in the trawl catches, despite being observed within the trawl nets during fishing (Table 4).
In comparison, interaction rates of megafauna in nets during trawling were much higher than rates observed in catches. A total of 1,851 megafauna individuals were observed in trawl nets from 774 day-trawls, i.e. 2.4 individuals per day-trawl. This suggested that about two thirds of all megafauna that entered the trawl nets exited through an escape hatch and were not retained in catches. Only 8.3% of trawls (n = 64) were observed to have no subsurface within-net interactions with megafauna. Rates of escapement varied among megafauna groups and the time taken for individuals to exit the trawl nets were considered most important for air breathing animals. Further analysis of escape proportions and times for chondrichthyan megafauna are outlined in Section 3.3, as they were used to compare mitigation efficiencies among the three trawl nets.
The highest rates of escapement were observed for sea snakes (Fig. 6), which readily exited trawl nets through the mesh or escape hatches in less than two minutes. A large majority (86.1%, Fig. 7) of sea snakes retained in catches were returned alive, according to logbook records. All grey nurse sharks (n = 9) and turtles (n = 11) were observed to exit trawls through an escape hatch. Nine of the eleven turtle interactions exited trawls in less than 2.5 minutes, while the remaining two took 7.8 and 60.1 minutes. The latter of which was a very large individual interacting with the less flexible escape hatch in the square mesh of the experimental net, which greatly impeded its escape. The condition of this turtle upon exiting was inconclusive from the video.
Seven dolphins, all Tursiops truncatus, were observed to come within close proximity to exclusion gear inside the trawl nets during five trawls. This resulted in a very rare interaction rate with exclusion gear inside the nets of 0.009 dolphins per day-trawl. All seven of these dolphins appeared to be distressed at this point (following the terminology used by Stephenson et al., 2008). The most conspicuous behaviour observed for this species at this stage was short bursts of swimming in a direction upstream toward the mouth of the net, i.e. short (< 10 seconds), infrequent and non-sustained bursts of swimming. These distressed dolphins (n = 7) did not always make obvious movements upwards toward the top of the net. Four of these seven dolphins were observed to asphyxiate and be retained within the net ahead of the exclusion grid. All four of these dolphins were observed in the catches by the deck camera systems and all were recorded in statutory logbooks as dead. Two of the remaining three dolphins exited from the upward excluding net through the top opening escape hatch within relatively short periods of time (i.e. 0.3 and 5.0 minutes). These two dolphins were considered to have a high chance of survival based on their conspicuous swimming movements during escapement. The dolphin that exited the net in the shortest time approached the exclusion grid head first and exited through the escape hatch head first, whereas the orientation of the dolphins during the

16 Fisheries Research Report [Western Australia] No. 244, 2014
other six interactions all approached the grid tail first. The latter of these orientations usually involved the tail of the dolphin passing through the grid and becoming lodged. During the last of these observations, the dolphin appeared to asphyxiate and was retained within the net forward of the grid for 27 minutes. Whilst that trawl was near the water’s surface during hauling and under excessive turbulence, the tail of that dolphin was observed to become dislodged from the exclusion grid, the net rotated 180° and the dolphin fell out of the net through the top opening escape hatch that was now orientated downward. This was the only observation of an asphyxiated dolphin exiting through an escape hatch.
Only one sawfish was observed to come within close proximity to the exclusion gear in the nets during trawling. This was due to the rostrums of the sawfishes typically becoming entangled with the mesh in the forward body panel sections of the trawl nets, as observed from the deck camera systems. Overall, there were no megafauna or scalefish observed to exit the trawl nets through the top opening escape slit, which was designed to facilitate escapement of predominantly air breathing animals. There was however a single dolphin observed to attempt to enter the trawl net through this escape slit.
Although the numbers of scalefish lost through the escape hatches was difficult to estimate, its occurrence was rare for each net type. Scalefish escapement was observed to occur in 1.3% of trawls for the downward excluding net, 2.8% of trawls for the upward excluding net and 1.2% of trawls for the experimental net. The loss of scalefish was always associated with a large object, usually a sponge, being lodged in the escape hatch.
Fisheries Research Report [Western Australia] No. 244, 2014 17
Tab
le 4
.
Num
bers
(n)
, pr
opor
tion
(% o
f to
tal m
egaf
auna
num
bers
), m
ean
(tra
wl-1
) an
d m
inim
um a
nd m
axim
um a
bund
ance
s fo
r ea
ch m
egaf
auna
gr
oup
as o
bser
ved
in c
atch
es (
from
dec
k ca
mer
a sy
stem
s) a
nd s
ubsu
rfac
e in
tera
ctio
ns w
ithin
the
tra
wl n
ets
(fro
m n
et c
amer
a sy
stem
s) f
or
each
ves
sel a
nd o
vera
ll. T
he m
egaf
auna
gro
ups
are
in d
esce
ndin
g or
der
of o
vera
ll ab
unda
nce
for
each
dat
a se
t.
n%
Tot
alM
ean
Rang
en
% T
otal
Mea
nRa
nge
n%
Tot
alM
ean
Rang
en
% T
otal
Mea
nRa
nge
Wha
ler
shar
ks39
962
.70.
5070
0 - 1
718
353
.20.
3161
0 - 5
263
53.1
0.47
820
- 484
557
.30.
4410
0 - 1
7Sh
ovel
nose
, Wed
gefis
h &
Sh
ark
rays
Rays
and
Ska
tes
639.
90.
0801
0 - 2
4914
.20.
0915
0 - 6
7314
.70.
1327
0 - 2
185
12.5
0.09
860
- 6Ca
tsha
rks,
Zeb
ra, T
awny
&
Wob
bego
ng s
hark
sSa
wfis
hes
60.
90.
0076
0 - 1
195.
50.
0276
0 - 1
112.
20.
0200
0 - 1
362.
40.
0172
0 - 1
Dol
phin
50.
80.
0064
0 - 2
10.
30.
0017
0 - 1
40.
80.
0073
0 - 1
100.
70.
0052
0 - 2
Ham
mer
head
sha
rks
40.
60.
0051
0 - 1
00
00
40.
80.
0073
0 - 1
80.
50.
0042
0 - 1
Turt
les
00
00
00
00
00
00
00
00
Gre
y nu
rse
shar
k0
00
00
00
00
00
00
00
0Se
asna
kes
40.
60.
0051
0 - 1
00*
0*0*
00*
0*0*
Inte
ract
ions
wit
hin
traw
l net
s (n
et c
amer
a sy
stem
s)W
hale
r sh
arks
216
38.4
0.72
730
- 27
107
21.7
0.51
350
- 437
546
.81.
2277
0 - 1
069
837
.60.
8721
0 - 2
7Ra
ys a
nd S
kate
s14
626
.00.
4545
0 - 6
204
41.3
1.04
860
- 83
157
19.6
0.48
840
- 550
727
.30.
6098
0 - 8
3Se
asna
kes
115
20.5
0.39
510
- 711
222
.70.
5838
0 - 8
126
15.7
0.41
580
- 635
319
.00.
4483
0 - 8
Shov
elno
se, W
edge
fish
&
Sh
ark
rays
Cats
hark
s, Z
ebra
, Taw
ny &
W
obbe
gong
sha
rks
Turt
les
00
00
30.
60.
0108
0 - 2
81.
00.
0264
0 - 1
110.
60.
0129
0 - 2
Gre
y nu
rse
shar
k0
00
01
0.2
0.00
540
- 18
1.0
0.02
640
- 29
0.5
0.01
160
- 2D
olph
in2
0.4
0.00
700
- 23
0.6
0.01
620
- 22
0.2
0.00
660
-17
0.4
0.00
900
- 2H
amm
erhe
ad s
hark
s1
0.2
0.00
350
- 11
0.2
0.00
540
- 15
0.6
0.01
650
-17
0.4
0.00
900
- 1Sa
wfis
hes
00
00
00
00
10.
10.
0033
0 - 1
10.
10.
0013
0 - 1
133
9012
234
5
222
1842
2320
5497
20.9
4161
161
0.16
5826
.20
- 30.
1690
0 - 4
0.22
1824
.60
- 3
8.7
0.19
380
- 3
0 - 4
0.18
3223
.4
0 - 3
7.6
0.19
800
- 2
Caug
ht (d
eck
cam
era
syst
ems)
* co
uld
not b
e ob
serv
ed fr
om d
eck
cam
eras
as
they
pas
sed
thro
ugh
a so
rtin
g m
esh
devi
ce in
to th
e hu
ll of
the
vess
el w
hich
was
out
of s
ight
of t
he c
amer
a
0.17
820
- 35.
20.
1240
2.8
0.02
190
- 1
59
0 - 2
6.7
NA
4.1
0.07
690
- 24.
00
- 3
10.5
0.19
58
0.02
800
- 10.
6
0.10
81
0 - 3
8.3
0.18
38
Ove
rall
0 - 1
Ves
sel A
Ves
sel B
Ves
sel C
0.00
350
- 13.
60.
0327
3.5
18 Fisheries Research Report [Western Australia] No. 244, 2014
Mea
n pe
r tr
awl
0.0
0.2
0.4
0.6
0.8
1.0
1.2
1.4
Megafauna group
0.0
0.2
0.4
0.6
0.8
1.0
1.2
1.4
Downward Upward Experimental
Whalersharks
Shovelnose,wedgefish,shark rays
Rays,skates
Catsharks,zebra, tawny,wobbegong
sharks
Sawfishes DolphinsHam-merheadsharks
Turtles Snakes Grey nursesharks
0
Figure 6. Comparison of the mean number of individuals (±1 se) from each megafauna group per trawl catch (observed from the deck camera systems, above x-axis) and interactions within nets during trawling (observed from the net camera systems, below x-axis) for each of the three net configurations.
Fisheries Research Report [Western Australia] No. 244, 2014 19
Dolphins
2102 1102 0102 9002 8002 7002 6002 5002 4002
Num
bers
0
10
20
30
40
50
Turtles
2102 1102 0102 9002 8002 7002 6002 5002 4002
Num
bers
0
10
20
30
40
50
Sea snakes
2102 1102 0102 9002 8002 7002 6002 5002 4002
Num
bers
0
10
20
30
40
50
Green sawfish
2102 1102 0102 9002 8002 7002 6002 5002 4002
Num
bers
0
10
20
30
40
50
Narrow sawfish
Year (quarterly)
2102 1102 0102 9002 8002 7002 6002 5002 4002
Num
bers
0
10
20
30
40
50
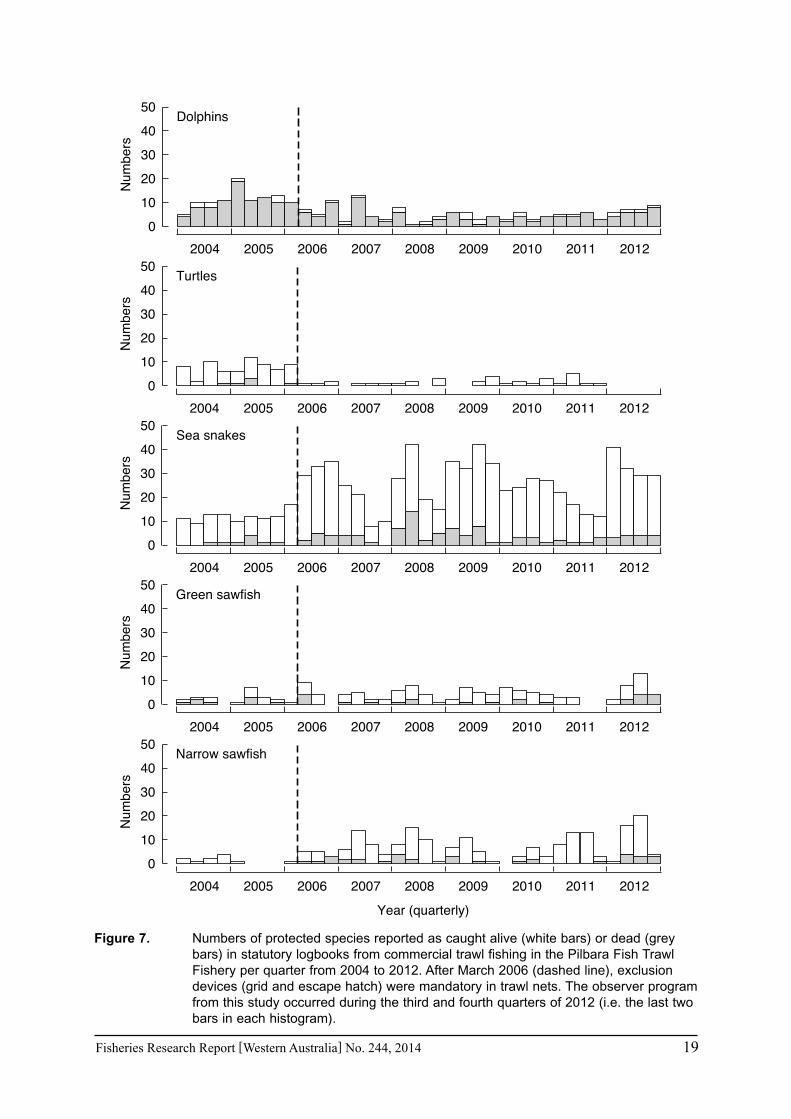
Figure 7. Numbers of protected species reported as caught alive (white bars) or dead (grey bars) in statutory logbooks from commercial trawl fishing in the Pilbara Fish Trawl Fishery per quarter from 2004 to 2012. After March 2006 (dashed line), exclusion devices (grid and escape hatch) were mandatory in trawl nets. The observer program from this study occurred during the third and fourth quarters of 2012 (i.e. the last two bars in each histogram).
20 Fisheries Research Report [Western Australia] No. 244, 2014
3.3 Reporting of ETP megafauna in statutory logbooks
All dolphins, turtles, sea snakes, green sawfish and narrow sawfish observed in the trawl catches during the six month observer period were recorded in their associated vessels statutory logbook. Catches of these ETP megafauna during this period were well within catch ranges reported historically in logbooks since exclusion grids were mandated (March 2006, Fig. 7). The number of dolphin mortalities reported in logbooks from March 2006 to June 2012 ranged from 1 to 12 per quarter. There were an additional 1 to 3 dolphins per quarter that were reported to be returned alive. The numbers of dolphin mortalities reported in logbooks during the recent observer period were well within this range, i.e. 6 and 8 for the third and fourth quarters of 2012, respectively (Fig. 7). The numbers of dolphin mortalities reported in statutory logbooks has averaged 16.7 per year and ranged from 11 to 24 per year since the mandatory use of exclusion grids.
There has not been a turtle mortality reported in statutory logbooks since exclusion grids were mandated. The number of turtles reported to be returned alive during this period has averaged 1.3 per quarter. According to logbook data, there were no turtles caught in trawl catches in 2012. This was confirmed from independent observations of catches from the deck camera systems in the last half of 2012 (Fig. 7).
The number of sea snake mortalities reported from catches in logbooks since grids have been used in trawls nets has ranged from 0 to 14 per quarter, with an average of 3.6 per quarter. A large proportion of the sea snakes reported in logbooks during this period were returned alive (86.1%, Fig. 7). The numbers of sea snake mortalities reported in logbooks during the recent observer period were well within this historic range, i.e. 9 and 0 for the third and fourth quarters of 2012, respectively (Fig. 7).
The number of green sawfish reported from catches in logbooks since grids have been used in trawls nets has ranged from 0 to 9 per quarter returned alive and 0 to 4 per quarter dead. The number of narrow sawfish reported from these catches in logbooks over the same period has ranged from 0 to 17 per quarter returned alive and 0 to 4 per quarter dead. The catches of green and narrow sawfishes recorded in logbooks during the third quarter of 2012, although relatively low (i.e. 4 dead, 9 alive and 3 dead, 17 alive, respectively), were at the upper limits of these historic catch ranges. These catches however were in line with the overall increasing trend for these animals from previous seasons (Fig. 7). The catches of these sawfishes were lower in the last quarter of 2012 (i.e. 4 dead, 0 alive, and 3 dead, 1 alive, for green and narrow, respectively). Typically, trends in catches for sawfishes were historically higher during the second and third quarters of each year, which suggested there is a strong seasonal influence associated with catches.
3.4 Comparisons of subsurface escapement efficiencies between the three trawl net configurations
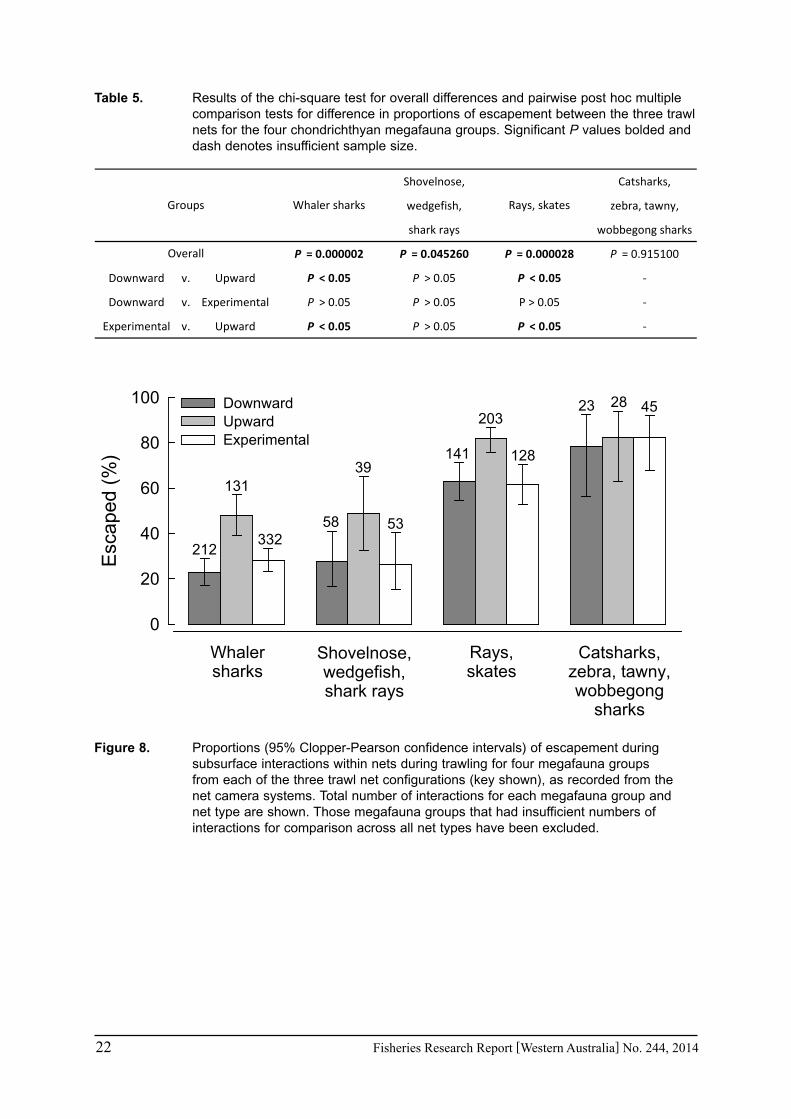
The subsurface interactions in the trawl nets for dolphins, turtles, sawfishes, hammerhead sharks and grey nurse sharks were unable to be used to investigate mitigation efficiencies among different exclusion gear configurations, as there were insufficient numbers of interactions across all net types (i.e. interactions were rare). Similarly, sea snake interactions in trawl nets during fishing provided no indication of the efficiencies among exclusion gear as a large majority readily passed through the grid to the codend or escaped through the mesh. Of the remaining four megafauna groups, the overall proportion of individuals that escaped were highest for the catshark, zebra, tawny, wobbegong shark group at 81% and the rays, skates group at 71%. The
Fisheries Research Report [Western Australia] No. 244, 2014 21
overall proportions of escapement for the whaler sharks and shovelnose, wedgefish, shark rays groups were lower at 30% and 33%, respectively. The proportions of escapement differed among the three net types (Fig. 8). The upward excluding net had higher proportions of escapement for three of the chondrichthyan megafauna groups, whereas these proportions were similar for all net types for the catshark, zebra, tawny, wobbegong sharks group (Fig. 8).
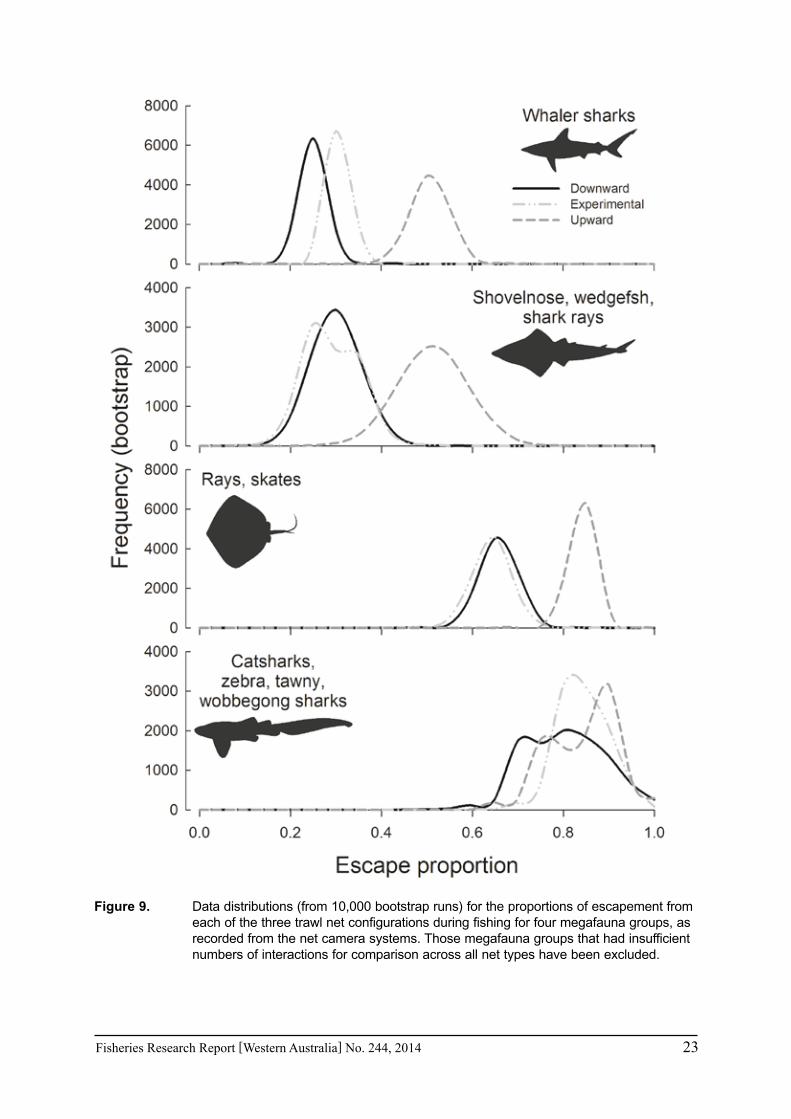
Chi-square tests of homogeneity indicated that the unimodal distributions of the proportions of escapement were greater for the upward excluding net for three of the chondrichthyan megafauna groups (Table 5, Fig. 9). However, the overlapping distributions of the proportions of escapement for the catshark, zebra, tawny, wobbegong shark group suggested there was no difference among net types (Table 5, Fig. 9). Post-hoc multiple pairwise comparisons indicated that the upward excluding net had significantly higher proportions of escapement for the whaler shark and ray, skate groups (P < 0.05), and that there was no significant difference between those proportions for the downward excluding and experimental nets (P > 0.05). The pairwise comparisons were unable to detect a significant difference among the trawl net configurations for the shovelnose, wedgefish, shark ray group (P > 0.05, Table 5). However, the distributions of the resampled escape proportions for these three chondrichthyan groups suggested that the upward excluding net had ca 20% greater proportions of escape than the other two nets (Fig. 9). Post-hoc power analysis suggested that, on the basis of the effect size observed for the other groups, small sample sizes may have resulted in insufficient statistical power to test for a significant difference in proportions of escapement among the net types for the catshark, zebra, tawny, wobbegong shark group (Table 5). However, resampled distributions of the data were similar among the three net types and suggested that the proportions of escapement for this megafauna group were equally high among the three net types (81%, Fig. 9).
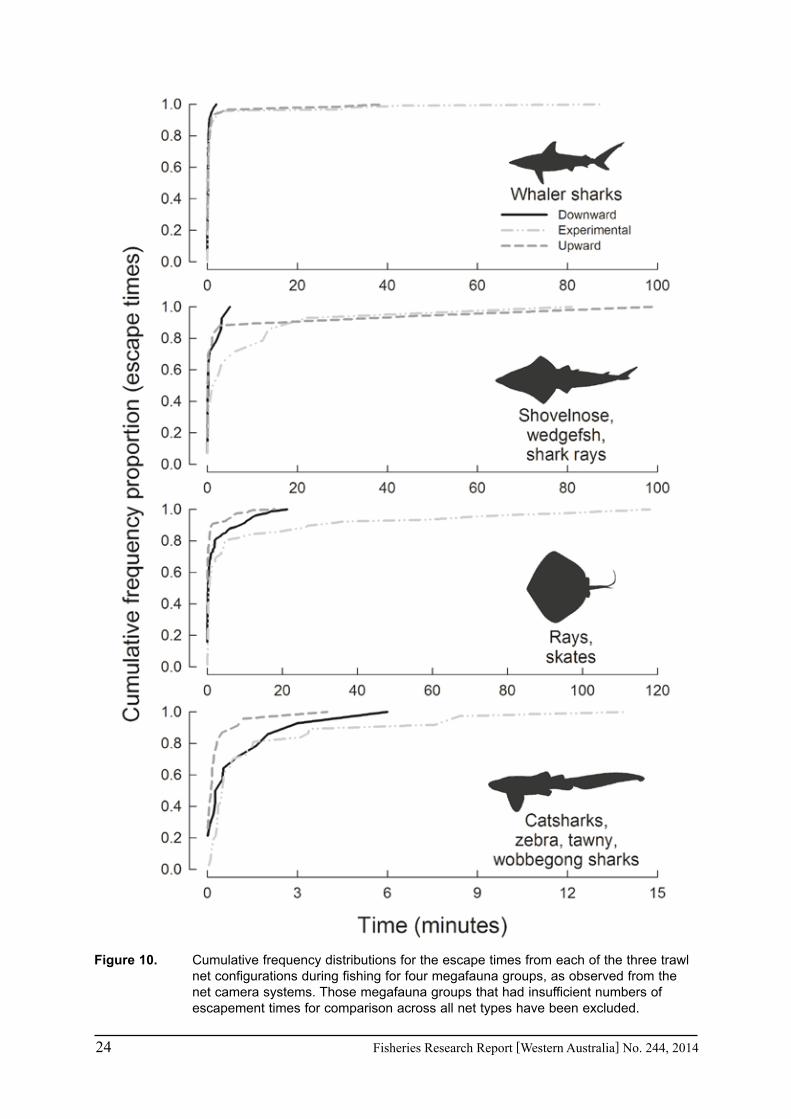
A large majority of individual chondrichthyan megafauna escaped all three trawl net configurations relatively quickly (< 10 min). However, a small number of individuals occasionally became lodged for longer periods. This resulted in a highly skewed distribution for some of the escape time data sets. These extended escape times were commonly encountered in the experimental net for each of the four chondrichthyan groups (Fig. 10). In contrast, the maximum escapement times for these groups were always markedly lower in the downward excluding net, suggesting greater mitigation efficiency (Fig. 10). The escape times for the upward excluding net showed mixed results among the four chondrichthyan groups. Escape times for this net were relatively low for the ray, skate and catshark, zebra, tawny, wobbegong shark groups, but some individuals did persist in this net type for extended periods among the whaler shark and shovelnose, wedgefish, shark ray groups (Fig. 10).
22 Fisheries Research Report [Western Australia] No. 244, 2014
Table 5. Results of the chi-square test for overall differences and pairwise post hoc multiple comparison tests for difference in proportions of escapement between the three trawl nets for the four chondrichthyan megafauna groups. Significant P values bolded and dash denotes insufficient sample size.
Shovelnose, Catsharks,
wedgefish, zebra, tawny,
shark rays wobbegong sharks
P = 0.000002 P = 0.045260 P = 0.000028 P = 0.915100
Downward v. Upward P < 0.05 P > 0.05 P < 0.05 -
Downward v. Experimental P > 0.05 P > 0.05 P > 0.05 -
Experimental v. Upward P < 0.05 P > 0.05 P < 0.05 -
Overall
Groups Rays, skatesWhaler sharks
Whalersharks
Shovelnose,wedgefish,shark rays
Rays,skates
Catsharks,zebra, tawny,wobbegong
sharks
Esc
aped
(%
)
0
20
40
60
80
100 Downward Upward Experimental
212
131
33258
39
53
141
203
128
23 28 45
Figure 8. Proportions (95% Clopper-Pearson confidence intervals) of escapement during subsurface interactions within nets during trawling for four megafauna groups from each of the three trawl net configurations (key shown), as recorded from the net camera systems. Total number of interactions for each megafauna group and net type are shown. Those megafauna groups that had insufficient numbers of interactions for comparison across all net types have been excluded.
Fisheries Research Report [Western Australia] No. 244, 2014 23
Figure 9. Data distributions (from 10,000 bootstrap runs) for the proportions of escapement from each of the three trawl net configurations during fishing for four megafauna groups, as recorded from the net camera systems. Those megafauna groups that had insufficient numbers of interactions for comparison across all net types have been excluded.
24 Fisheries Research Report [Western Australia] No. 244, 2014
Figure 10. Cumulative frequency distributions for the escape times from each of the three trawl net configurations during fishing for four megafauna groups, as observed from the net camera systems. Those megafauna groups that had insufficient numbers of escapement times for comparison across all net types have been excluded.

Fisheries Research Report [Western Australia] No. 244, 2014 25
3.5 Marine mammal attendance
The only marine mammal species recorded during the observer period was the bottlenose dolphin Tursiops truncatus. Observed behaviours of this species generally involved foraging, socialising and frequently and intentionally making contact with the trawl nets. Estimates of the prevalence and numbers of bottlenose dolphins in attendance during trawling were considered conservative as they were limited to the maximum number within a camera’s field of view in a single frame. In addition, deck cameras could only observe dolphins when they breached the water’s surface and the net cameras were purposely orientated to observe the exclusion gear within the net, with dolphin interactions limited to the periphery of the field of view (Fig. 2). Nonetheless, dolphins were observed during daylight interacting with trawl nets on the surface during hauling for 75.7% of trawls and averaged 2.4 dolphins per trawl (ranging from 0-16 individuals). Similarly, dolphins were observed underwater on the outside of trawls nets during fishing in 76.4% of trawls and averaged 2.0 dolphins per trawl (ranging from 0-13 individuals). The spatial distribution of dolphin attendance during trawling was spread throughout all four trawl management areas and was strongly associated with the spatial distribution of observed trawl effort (Fig. 5).
26 Fisheries Research Report [Western Australia] No. 244, 2014
4.0 Discussion
This independent observer program incorporated simultaneous dual lens above water and subsurface within-net camera systems, which provided a unique multi-dimensional approach that facilitated exceptionally high levels of coverage whilst including all important angles of operations and delivered permanent, tamperproof, archival records for reference (video footage). A high level of observer coverage was achieved across all three vessels over six months from mid-June to mid-December 2012 (i.e. 85.2% or 1,916 trawls). The level of coverage far exceeded that stipulated in the Bycatch Action Plan (22%) and levels achieved in previous studies in this fishery (Stephenson et al., 2008; Allen and Loneragan, 2010). This study also provided an improved understanding of subsurface interactions, exclusion gear effectiveness and efficiency and appropriate mitigation strategies for megafauna species from a high level of within-net observer coverage during trawling (i.e. 774 day-trawls or 1,013 h).
The four ETP megafauna groups for which PFTF fishers are required to keep catch records (i.e. dolphins, turtles, sea snakes and sawfishes) were rarely encountered and represented a very small proportion of the overall megafauna abundances observed in catches and interacting within trawl nets (Table 1). During the observer program, all independently observed captures of these four groups (noting no turtles were caught) were reported in statutory logbooks. In addition, numbers of these four species caught during the six month observer program were within historically reported levels from logbook records, since exclusion gear was made compulsory in the PFTF (March 2006). Therefore, there was no evidence during this study to suggest that incidental catches of these ETP megafauna were being unreported in these statutory logbooks.
Considering fishers were acutely aware that fishing operations were being continually monitored and scrutinised onboard all vessels during the six month survey period, provided considerable incentive for the vigilant recording of all ETP megafauna bycatch interactions in statutory logbooks. This effectively facilitated comparisons of reporting rates between human (fishers) and video observations. The fact that records of ETP megafauna interactions were identical between these two types of observers provided circumstantial evidence that the electronic observer program was a valid method for monitoring bycatch of these ETP species. The deck camera systems also provided additional benefits over human observers, some of which included 1) capturing permanent secure archival footage that could be revisited to assist with accuracy in species identification, abundance estimates and interaction pathways (e.g. fallouts); 2) markedly higher levels of continuous (excluding malfunctions) observer coverage that was more cost effective; 3) the cameras were mounted at a higher vantage point (on the gantry) which increased distance and depth (i.e. looking down into the water) perception of observations during net retrieval on the waters surface astern of the vessels; and 4) the use of dual lenses on the deck camera systems allowed for simultaneous observations of multiple aspects of fishing operations onboard vessels.
Net camera systems were deployed in trawl nets to compare the effectiveness and efficiency of subsurface escapement and the condition of megafauna, from three different exclusion gear configurations. The high level of observer coverage from the within-net cameras was unprecedented, achieving coverage rates of 71.7% of day-trawls and 53.9% of day-trawl hours across all three vessels over the six month period. Within-net observations of the efficiency of exclusion gear determined that all three configurations successfully facilitated escapement of megafauna, but that the effectiveness and efficiency of current mitigation strategies varied among megafauna groups. The exclusion grid and escape hatch configurations of all three trawl net types allowed 100% of turtles to escape (n = 11). One of these escapements was
Fisheries Research Report [Western Australia] No. 244, 2014 27
prolonged (60.1 min) due to the large size of the individual and limited flexibility (stretch) of the square mesh surrounding the escape hatch for the experimental net. Although the condition of that individual was uncertain upon exiting, the escapement time for this interaction was well within the breath holding capabilities for marine turtles that have the ability to endure total anoxia for many hours (Lutz and Bentley, 1985). Thus, the subsurface expulsion of turtles in poor condition was considered extremely unlikely and therefore current mitigation strategies for turtles should be considered effective. Sea snakes were observed frequently escaping through the mesh and escape hatches of all three trawl net types. In addition, a large majority of sea snakes retained in catches were returned alive (86.1% according to logbook records). This suggested that current mitigation strategies are effective for sea snakes and future monitoring of incidental captures may not be required.
Two species of sawfish were identified in catches from the PFTF, i.e. narrow sawfish Anoxypristis cuspidata and green sawfish Pristis zijsron. The other two Australian sawfish species (P. clavata and P. microdon) have predominantly nearshore distributions, well inshore of the PFTF management areas and are unlikely to interact with this fishery. Observed catches of narrow and green sawfish in the PFTF were rare (0.007 trawl-1 and 0.011 trawl-1, respectively). Trends in catch rates from logbooks showed a strong seasonal influence, with higher catches from April to September. No sawfish were observed to exit the trawl nets through any escape hatches and only one sawfish was observed to come within close proximity to exclusion gear before becoming entangled with the mesh. All other sawfish were observed (from deck camera systems) with their rostrums entangled in mesh in the forward body panel sections of the net. This suggested that the current location of the exclusion grid and escape hatches in the trawl nets (ca 30-40 m from the headrope) were not effective to mitigate subsurface interactions with sawfish in the PFTF. Both narrow and green sawfish appear abundant in Western Australian waters and they have wide distributions that extend from the Red Sea, through Malaysia and Indonesia to northern Australia, well beyond the management areas of the PFTF (Last and Stevens, 2009). Thus, while the International Union for the Conservation of Nature and Natural Resources (IUCN) have globally assessed these sawfish species as Critically Endangered, these assessments were based on evidence of population depletions in other parts of the world and may therefore not necessarily represent the status of Australian populations. In Australian waters, P. clavata, P. microdon and P. zijsron, have been assessed as Vulnerable under the Environmental Protection and Biodiversity Conservation (EPBC) Act, while Anoxypristis cuspidata has not been listed as a threatened species.
There has been considerable focus and investment toward understanding and mitigating dolphin interactions in the PFTF over the last decade. Stephenson and Chidlow (2003) documented bycatch in the PFTF from 100 days of observer coverage in 2002, spread over the (then) five vessel fleet. Bycatch data were obtained from 427 trawl shots representing 1,581 hours of trawling and an observer coverage rate of 7.7%. Bottlenose dolphins were observed around and in (using video cameras) almost every trawl shot. A total of four incidental dolphin deaths were reported. In parallel, research on the effectiveness of exclusion grids and escape hatches fitted to trawl nets (Stephenson et al., 2008) was undertaken in conjunction with an assessment of pingers (Stephenson and Wells, 2008) to reduce dolphin interactions. These studies highlighted dolphins deliberately entering trawl nets to forage (provisioning) and purposely making contact with the nets (from clinging to the headrope to bouncing along the net) during almost all trawl shots (> 98% trawls). They also reported that not all dolphins used escape hatches and that these early model pingers (Savewave) were ineffective in mitigating dolphin interactions with trawl nets.
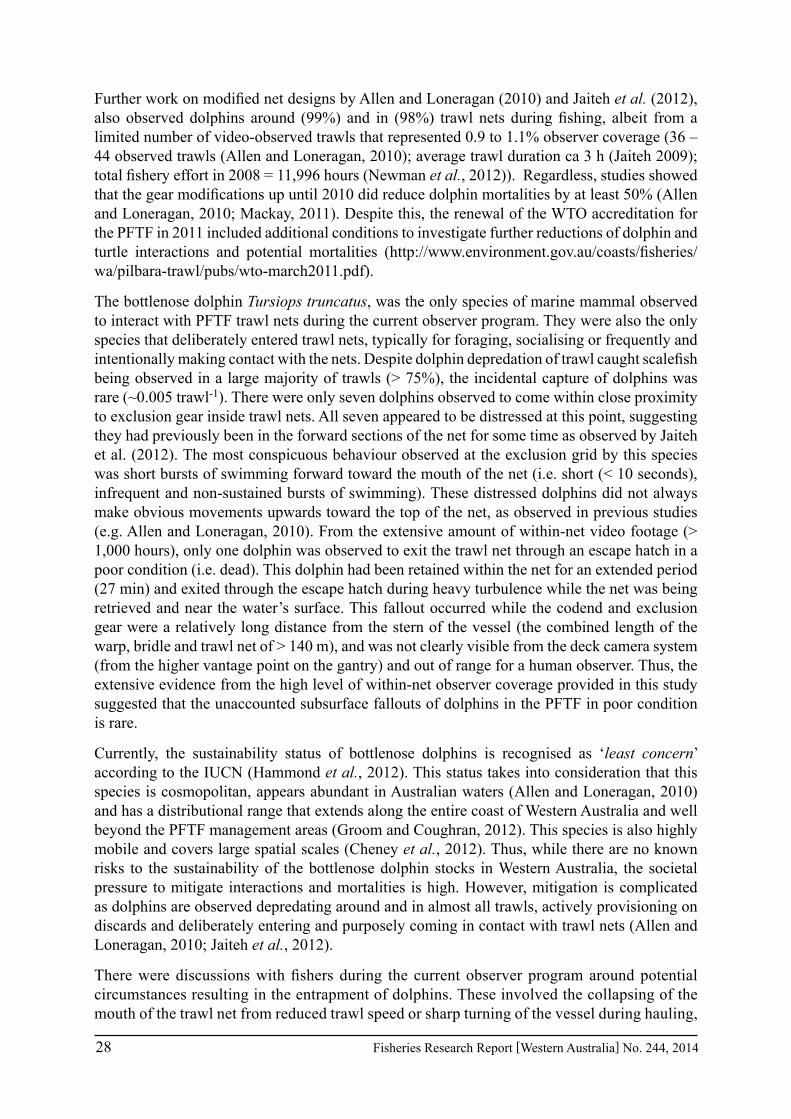
28 Fisheries Research Report [Western Australia] No. 244, 2014
Further work on modified net designs by Allen and Loneragan (2010) and Jaiteh et al. (2012), also observed dolphins around (99%) and in (98%) trawl nets during fishing, albeit from a limited number of video-observed trawls that represented 0.9 to 1.1% observer coverage (36 – 44 observed trawls (Allen and Loneragan, 2010); average trawl duration ca 3 h (Jaiteh 2009); total fishery effort in 2008 = 11,996 hours (Newman et al., 2012)). Regardless, studies showed that the gear modifications up until 2010 did reduce dolphin mortalities by at least 50% (Allen and Loneragan, 2010; Mackay, 2011). Despite this, the renewal of the WTO accreditation for the PFTF in 2011 included additional conditions to investigate further reductions of dolphin and turtle interactions and potential mortalities (http://www.environment.gov.au/coasts/fisheries/wa/pilbara-trawl/pubs/wto-march2011.pdf).
The bottlenose dolphin Tursiops truncatus, was the only species of marine mammal observed to interact with PFTF trawl nets during the current observer program. They were also the only species that deliberately entered trawl nets, typically for foraging, socialising or frequently and intentionally making contact with the nets. Despite dolphin depredation of trawl caught scalefish being observed in a large majority of trawls (> 75%), the incidental capture of dolphins was rare (~0.005 trawl-1). There were only seven dolphins observed to come within close proximity to exclusion gear inside trawl nets. All seven appeared to be distressed at this point, suggesting they had previously been in the forward sections of the net for some time as observed by Jaiteh et al. (2012). The most conspicuous behaviour observed at the exclusion grid by this species was short bursts of swimming forward toward the mouth of the net (i.e. short (< 10 seconds), infrequent and non-sustained bursts of swimming). These distressed dolphins did not always make obvious movements upwards toward the top of the net, as observed in previous studies (e.g. Allen and Loneragan, 2010). From the extensive amount of within-net video footage (> 1,000 hours), only one dolphin was observed to exit the trawl net through an escape hatch in a poor condition (i.e. dead). This dolphin had been retained within the net for an extended period (27 min) and exited through the escape hatch during heavy turbulence while the net was being retrieved and near the water’s surface. This fallout occurred while the codend and exclusion gear were a relatively long distance from the stern of the vessel (the combined length of the warp, bridle and trawl net of > 140 m), and was not clearly visible from the deck camera system (from the higher vantage point on the gantry) and out of range for a human observer. Thus, the extensive evidence from the high level of within-net observer coverage provided in this study suggested that the unaccounted subsurface fallouts of dolphins in the PFTF in poor condition is rare.
Currently, the sustainability status of bottlenose dolphins is recognised as ‘least concern’ according to the IUCN (Hammond et al., 2012). This status takes into consideration that this species is cosmopolitan, appears abundant in Australian waters (Allen and Loneragan, 2010) and has a distributional range that extends along the entire coast of Western Australia and well beyond the PFTF management areas (Groom and Coughran, 2012). This species is also highly mobile and covers large spatial scales (Cheney et al., 2012). Thus, while there are no known risks to the sustainability of the bottlenose dolphin stocks in Western Australia, the societal pressure to mitigate interactions and mortalities is high. However, mitigation is complicated as dolphins are observed depredating around and in almost all trawls, actively provisioning on discards and deliberately entering and purposely coming in contact with trawl nets (Allen and Loneragan, 2010; Jaiteh et al., 2012).
There were discussions with fishers during the current observer program around potential circumstances resulting in the entrapment of dolphins. These involved the collapsing of the mouth of the trawl net from reduced trawl speed or sharp turning of the vessel during hauling,
Fisheries Research Report [Western Australia] No. 244, 2014 29
which may have prevented escapement. It was suggested that this could have resulted in a small number of the 14 dolphin mortalities recorded in statutory logbooks during the six month observer program. Two of the three vessels use monitoring sensors (MARPORT Canada Inc.) on their otter boards to provide immediate feedback to the fishers on the board’s orientation (pitch, roll, depth) and performance to prevent net collapse. However, it appears the few instances when net collapse occurred were when a relief skipper was onboard. Thus, in an attempt to reduce the already low catches of dolphins, a vessel operating Code of (best) Practice could be developed to help prevent net collapse and to document other standard operational procedures to ensure a consistent standard of mitigating ETP interactions is maintained. The extensive evidence provided from the high level of subsurface within-net observations at the exclusion grid, suggested that the initial causes of dolphin distress are occurring toward the mouth of the net. Therefore, it would be beneficial to obtain in situ observations of dolphin behaviour in this forward part of the trawl nets in an attempt to determine the potential circumstances that lead to distress, and to develop and trial further mitigation measures and strategies in this part of the net.
Only the more commonly observed subsurface interactions with four chondrichthyan megafauna groups permitted the comparison of mitigation efficiencies of the three trawl net configurations. The proportions of chondrichthyan megafauna that escaped were relatively high for all four groups and net types. However, the upward excluding net did have about a 20% significantly greater proportion of escapement for three of these four groups. No megafauna were observed to attempt to exit the experimental trawl net through the top opening escape slit. A large majority of the subsurface escapements of chondrichthyan megafauna were rapid (< 10 min). There were a small number of chondrichthyan individuals that persisted at an exclusion grid before escapement. This was most common for the experimental net and was likely to be associated with large individuals passing through an escape hatch that had limited flexibility (or stretch) from being cut into square rather than diamond mesh. These comparisons of mitigation efficiency among net types should only be considered in terms of chondrichthyan megafauna and should not be applied to the other four ETP megafauna groups, as they had very different body shapes, behaviours and associated escapement dynamics.
The results of this project will need to be weighed against the high value of the PFTF fishery resource in the supply of fish for human consumption and revenue generated for the State government, the significant investment and success in reducing ETP megafauna interactions and mortalities over the past decade (Stephenson and Wells 2008; Stephenson et al. 2008; Allen and Loneragan, 2010) and the large investment in the current project. Consideration also needs to be given to the negligible risks the PFTF poses to the sustainability of ETP megafauna stocks, the other risks to sustainability posed from large-scale anthropogenic development on the north coast of Western Australia (e.g. ship movements, habitat modifications, marine noise, mortalities in other jurisdictions) and the relative natural mortality rates of bottlenosed dolphins (at least n = 371 strandings from 1981-2010, Groom and Coughran, 2012). The likely establishment of extensive marine bioregional zones and representative areas by the Commonwealth of Australia will undoubtedly have conservation benefits to these ETP megafauna and others species, which thus further emphasises the negligible risks to sustainability posed from the PFTF. Robust estimates of the size of the ETP stocks interacting with the fisheries would assist with sustainable management strategies, especially if the conservation benefits from this and other projects are resulting in an increase in the size of their populations in Western Australia.
30 Fisheries Research Report [Western Australia] No. 244, 2014
5.0 Recommendations for future management strategies of ETP species interactions in the Pilbara Fish Trawl (Interim) Managed Fishery
1. Industry and Department of Fisheries to develop a code of best practice and standard vessel operating procedures to ensure a consistent standard of operations relating to mitigating ETP interactions is maintained into the future, as outlined in condition 4(b) of the current WTO for the Fishery (Appendix 1).
2. Consider an ongoing electronic observer program for verification of incidental catches of ETP megafauna taken by the PFTF as outlined in condition 4(c) of the current WTO for the Fishery (Appendix 1).
3. Consider obtaining in situ observations of dolphin behaviour toward the mouth of the trawl nets in an attempt to determine the potential circumstances that lead to distress and/or asphyxiation, and depending on these results, potentially develop and trial mitigation measures and strategies that could further reduce dolphin interactions with fish trawling, as outlined in condition 4(d) of the current WTO for the Fishery (Appendix 1).

Fisheries Research Report [Western Australia] No. 244, 2014 31
Acknowledgements
We gratefully acknowledge logistical and financial support from the Department of Fisheries, Government of Western Australia, Westmore Seafoods Pty Ltd, M.G. Kailis Group and the Western Australian Fishing Industry Council. We would also like to thank Grace Davis, Dion Boddington, Elaine Lek, Ben Rome and Gabby Mitsopoulos for assistance with video analyses; Kim Gray for regional technical support; and Steve Guy for information technology support. We are indebted to the Masters and crews of the FV Raconteur, FV Torbay and FV Ocean Raider who helped in the collection of data for this project.
32 Fisheries Research Report [Western Australia] No. 244, 2014
ReferencesAllen, S. J., and Loneragan, N. R. 2010. Reducing dolphin bycatch in the Pilbara finfish trawl fishery.
Murdoch University. FRDC Project No. 2008/048. 59 pp pp.
Brewer, D. T., Heales, D. S., Eayrs, S. J., Taylor, B. R., Day, G., Sen, S., Wakeford, J., et al. 2003. Assessment and improvement of TEDs and BRDs in the NPF: a co-operative approach by fishers, scientists, fisheries technologists, economists and conservationists. CSIRO Division of Marine Research. FRDC Project No. 2000/173. 422 pp.
Campos, A., Fonseca, P., Fonseca, T., and Parente, J. 2007. Definition of fleet components in the Portugese bottom trawl fishery. Fisheries Research, 83: 185-191.
Cheney, B., Thompson, P. M., Ingram, S. N., Hammond, P. S., Stevick, P. T., Durban, J. W., Culloch, R. M., et al. 2012. Integrating multiple data sources to assess the distribution and abundance of bottlenose dolphins Tursiops truncatus in Scottish waters. Mammal Review, 43: 71-88.
Cohen, J. 1988. Statistical Power Analysis for the Behavioural Sciences. Second Edition, Lawrence Erlbaum, Hillsdale, New Jersey, USA.
Davie, S., and Lordan, C. 2011. Definition, dynamics and stability of métiers in the Irish otter trawl fleet. Fisheries Research, 111: 145-158.
Diver, G. 2012. Development and cost-benefit analysis of an electronic observer system to monitor a remote small vessel commercial fishery. Diversity - Sustainable Development Consultants Pty Ltd. Fisheries Research and Development Corporation Final Report No. 2009/048.20. 27 pp.
Groom, C. J., and Coughran, D. K. 2012. Three decades of cetacean strandings in Western Australia: 1981 to 2010. Journal of the Royal Society of Western Australia, 95: 63-77.
Hammond, P. S., Bearzi, G., Bjørge, A., Forney, K. A., Karkzmarski, L., Kasuya, T., Perrin, W. F., et al. 2012. Tursiops truncatus. IUCN Red List of Threatened Species. Version 2012.2.
Harwood, M. B., and Hembree, D. 1987. Incidental catch of small cetaceans in the offshore gillnet fishery in northern Australian waters: 1981-1985. Rep. Int. Whal. Commn., 37: 363-367.
Harwood, M. B., McNamara, K. J., and Anderson, G. R. V. 1984. Incidental catch of small cetaceans in a gilnnet fishery in northern Australian waters. Rep. Int. Whal. Commn., 34: 555-559.
Hembree, D. 1986. Final report to Australian national parks and wildlife service on incidental catches in northern Australian seas. Australian National Parks and Wildlife Service. Research and Survey Consultancy Programs.
Jaiteh, V. F., Allen, S. J., Meeuwig, J. J., and Loneragan, N. R. 2012. Subsurface behavior of bottlenose dolphins (Tursiops truncatus) interacting with fish trawl nets in northwestern Australia: Implications for bycatch mitigation. Marine Mammal Science: doi: 10.1111/j.1748-7692.2012.00620.x.
Last, P. R., and Stevens, J. D. 2009. Sharks and Rays of Australia. Second Edition, CSIRO Publishing, Collingwood, Victoria, Australia.
Lutz, P. L., and Bentley, T. B. 1985. Respiratory physiology of diving in the sea turtle. Copeia, 3: 671-679.
Mackay, A. I. 2011. An investigation of factors related to the bycatch of small cetaceans in fishing gear. Ph.D. Thesis. Scottish Oceans Institute, Sea Mammal Research Unit, School of Biology, University of St. Andrews. p. 329.
Newman, S. J., Skepper, C. L., Wakefield, C. B., Sawyer, M., Boddington, D. K., and Green, R. 2012. North Coast Demersal Fisheries Status Report. In Status Reports of the Fisheries and Aquatic Resources of Western Australia 2011/12: the State of the Fisheries. Ed. by W. J. Fletcher, and K. Santoro. Department of Fisheries, Western Australia.

Fisheries Research Report [Western Australia] No. 244, 2014 33
Northbridge, S. P. 1996. A review of marine mammal bycatch observer schemes with recommendations for best practice. Joint Nature Conservation Committee, Aberdeen, United Kingdom. JNCC report 219.
R Development Core Team 2013. R: A language and environment for statistical computing. R foundation for statistical computing, Vienna, Austria.
Ramm, D. C. 1994. Australia’s Northern Trawl Fishery. Assessment of the status, composition and market potential of demersal trawl fish resources in northern Australian waters. Fisheries Division, Department of Primary Industries and Fisheries, Northern Territory Government, Darwin. Final report to the Fisheries Research and Development Corporation, Project No. 86/049. 59 pp.
Read, A. J., Drinker, P., and Northridge, S. 2006. Bycatch of marine mammals in U.S. and global fisheries. Conservation Biology, 20: 163-169.
Rossman, M. C. 2007. Allocating observer sea days to bottom trawl and gillnet fisheries in the northeast and mid-Atlantic regions to monitor and estimate incidental bycatch of marine mammals U.S. Department of Commerce, National Oceanic and Atmospheric Administration, Northeast Fisheries Science Center Document 07-19. 17 pp.
Sainsbury, K. J. 1987. Assessment and management of the demersal fishery on the continental shelf of north western Australia. In Tropical snappers and groupers: biology and fisheries management, pp. 465-503. Ed. by J. J. Polovina, and S. Ralston. Westview Press, Boulder, CO, USA.
Sainsbury, K. J. 1988. The ecological basis of multispecies fisheries and management of a demersal fishery in tropical Australia. In Fish population dynamics, pp. 349-382. Ed. by J. A. Gulland. John Wiley, London.
Sainsbury, K. J. 1991. Application of an experimental approach to management of a tropical multispecies fishery with highly uncertain dynamics. ICES Marine Science Symposia, 193: 301-320.
Stephenson, P. C., and Chidlow, J. 2003. Bycatch in the Pilbara trawl fishery. Department of Fisheries, Western Australia. ISBN No. 1877098302. Final report to the Natural Heritage Trust. 74 pp.
Stephenson, P. C., and Wells, S. 2008. Evaluation of the effectiveness of reducing dolphin catches with pingers and exclusion grids in the Pilbara trawl fishery. Department of Fisheries Western Australia. Fisheries Research Report No. 173. 44 pp.
Stephenson, P. C., Wells, S., and King, J. A. 2008. Evaluation of exclusion grids to reduce the bycatch of dolphins, turtles, sharks and rays in the Pilbara trawl fishery. Department of Fisheries Western Australia. Fisheries Research Report No. 171. 24 pp.
Taylor, B. L., Martinez, M., Gerrodette, T., Barlow, J., and Hrovat, Y. N. 2007. Lessons from monitoring trends in abundance of marine mammals. Marine Mammal Science, 23: 157-175.
Thurstan, R. H., Brockington, S., and Roberts, C. M. 2010. The effects of 118 years of industrial fishing on UK bottom trawl fisheries. Nature Communications, 1: 15.
Witherell, D., Fey, M., and Fina, M. 2012. North Pacific Fishery Management Council Fishing Fleet Profiles. National Oceanic and Atmospheric Administration. 72 pp.
Zar, J. H. 2010. Biostatistical Analysis. Fifth edition., Pearson Prentice-Hall Inc., Upper Saddle River, New Jersey, USA.
34 Fisheries Research Report [Western Australia] No. 244, 2014
Appendix 1. Wildlife Trade Operation approval and provisions for the Western Australian Pilbara Fish Trawl Interim Managed Fishery from the Commonwealth of Australia for the period of March 2011 to June 2013.
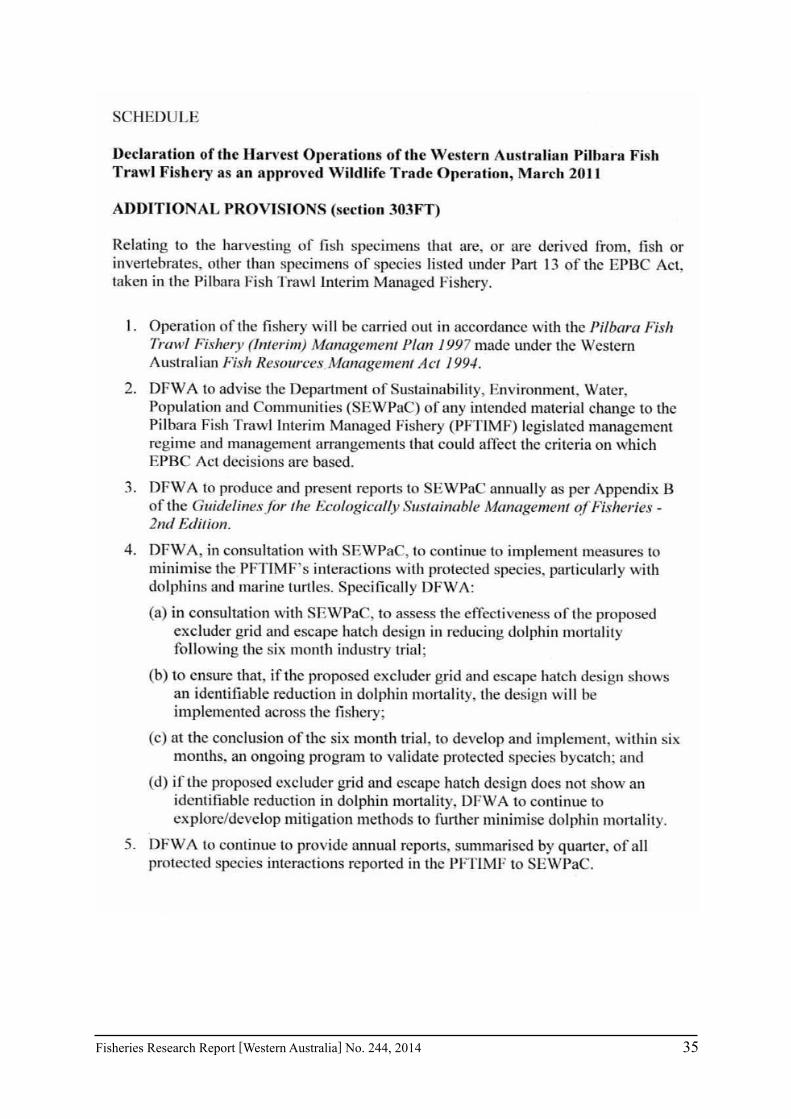
Fisheries Research Report [Western Australia] No. 244, 2014 35

36 Fisheries Research Report [Western Australia] No. 244, 2014


![Frederik Ramm: OpenStreetMap, the free Wiki world map [24c3]](https://static.fdocuments.net/doc/165x107/545b3192b1af9fcf338b605c/frederik-ramm-openstreetmap-the-free-wiki-world-map-24c3.jpg)