Independent Market Study: Commercial Hypersonic Transportation
33
1 1 Independent Market Study: Commercial Hypersonic Transportation Executive Summary DATSS TO 36 Delivery Order 80HQTR20F0177 Ms. Carie Mullins, Technical Lead, Bryce Space and Technology Dr. Ronald Lehmer, Task Order Manager, SAIC February 25, 2021
Transcript of Independent Market Study: Commercial Hypersonic Transportation

1 1
Independent Market Study: Commercial Hypersonic Transportation Executive Summary DATSS TO 36 Delivery Order 80HQTR20F0177
Ms. Carie Mullins, Technical Lead, Bryce Space and Technology
Dr. Ronald Lehmer, Task Order Manager, SAIC
February 25, 2021

2
Study Overview Market Characterization Task 1: Define the Market Task 2: Define the Business Case Task 3: Identify the Barriers
3
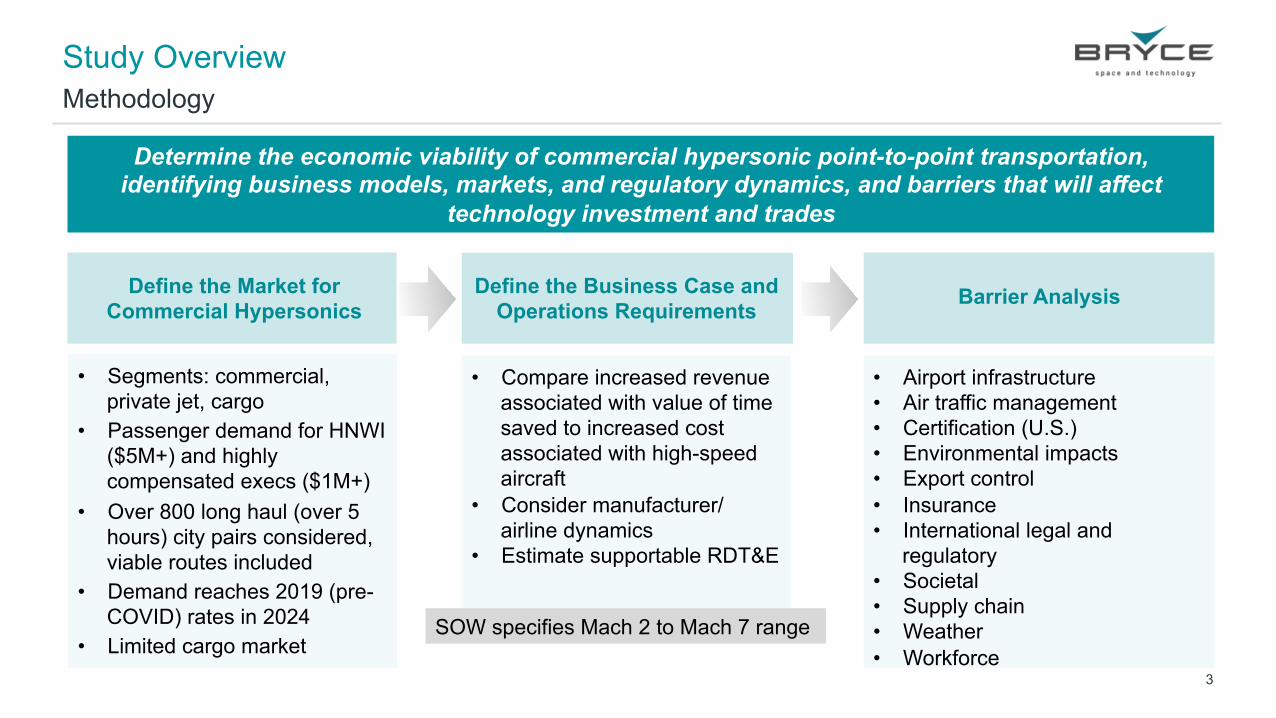
Study Overview Methodology
Define the Market for Commercial Hypersonics
Define the Business Case and Operations Requirements Barrier Analysis
• Segments: commercial, private jet, cargo
• Passenger demand for HNWI ($5M+) and highly compensated execs ($1M+)
• Over 800 long haul (over 5 hours) city pairs considered, viable routes included
• Demand reaches 2019 (pre-COVID) rates in 2024
• Limited cargo market
• Compare increased revenue associated with value of time saved to increased cost associated with high-speed aircraft
• Consider manufacturer/ airline dynamics
• Estimate supportable RDT&E
• Airport infrastructure • Air traffic management • Certification (U.S.) • Environmental impacts • Export control • Insurance • International legal and
regulatory • Societal • Supply chain • Weather • Workforce
Determine the economic viability of commercial hypersonic point-to-point transportation, identifying business models, markets, and regulatory dynamics, and barriers that will affect
technology investment and trades
SOW specifies Mach 2 to Mach 7 range
4
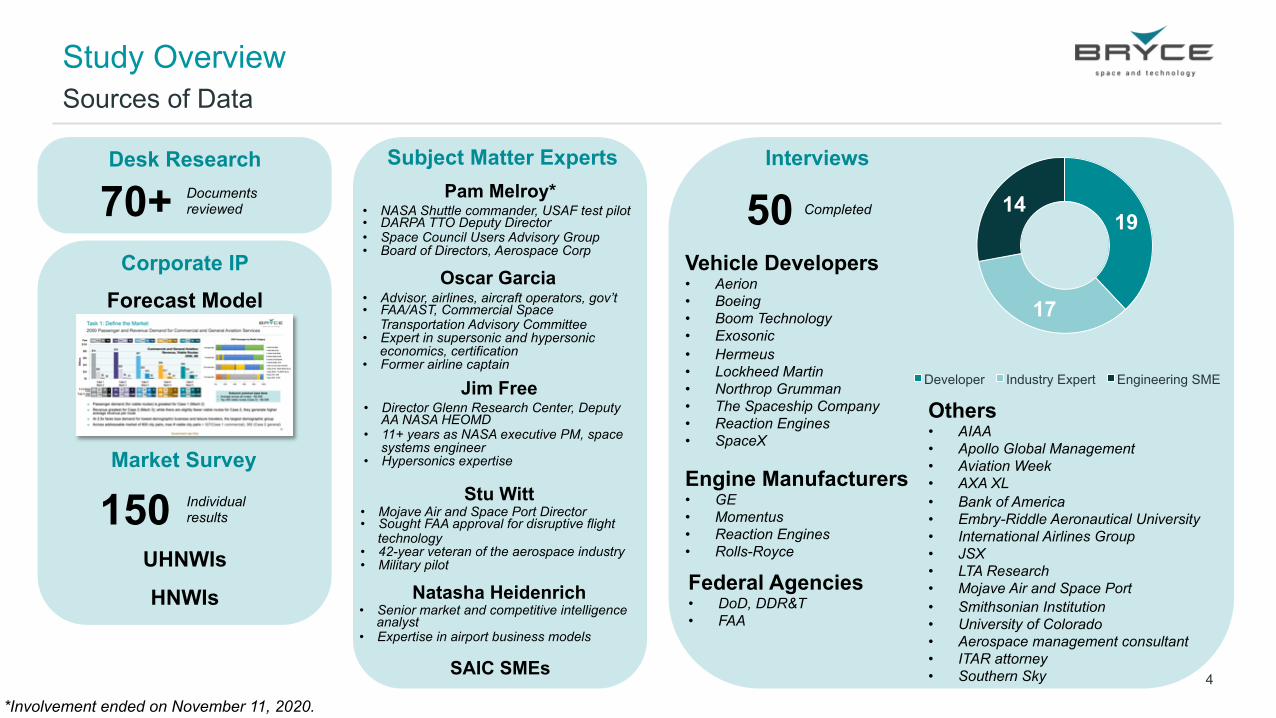
Study Overview Sources of Data
Desk Research Subject Matter Experts Interviews
Market Survey
50 Vehicle Developers • Aerion • Boeing • Boom Technology • Exosonic • Hermeus • Lockheed Martin • Northrop Grumman • The Spaceship Company • Reaction Engines • SpaceX
Pam Melroy*
Oscar Garcia
Jim Free
Stu Witt
Natasha Heidenrich
150 UHNWIs
HNWIs
70+
Forecast Model
Completed
Individual results
*Involvement ended on November 11, 2020.
SAIC SMEs
Documents reviewed
Corporate IP
Engine Manufacturers • GE • Momentus • Reaction Engines • Rolls-Royce
Federal Agencies • DoD, DDR&T • FAA
Others • AIAA • Apollo Global Management • Aviation Week • AXA XL • Bank of America • Embry-Riddle Aeronautical University • International Airlines Group • JSX • LTA Research • Mojave Air and Space Port • Smithsonian Institution • University of Colorado • Aerospace management consultant • ITAR attorney • Southern Sky
• NASA Shuttle commander, USAF test pilot • DARPA TTO Deputy Director • Space Council Users Advisory Group • Board of Directors, Aerospace Corp
• Advisor, airlines, aircraft operators, gov’t • FAA/AST, Commercial Space
Transportation Advisory Committee • Expert in supersonic and hypersonic
economics, certification • Former airline captain
• Director Glenn Research Center, Deputy AA NASA HEOMD
• 11+ years as NASA executive PM, space systems engineer
• Hypersonics expertise
• Mojave Air and Space Port Director • Sought FAA approval for disruptive flight
technology • 42-year veteran of the aerospace industry • Military pilot
• Senior market and competitive intelligence analyst
• Expertise in airport business models
19
17
14
Developer Industry Expert Engineering SME

5
Study Overview Results
Define the Market for Commercial Hypersonics
Define the Business Case and Operations Requirements Barrier Analysis
• Strongest case: Mach 3 aircraft, commercial aviation fare 1.5x subsonic, general aviation 2.5x • 200M pax • $244B revenue (25 yrs, NPV 2020) • $24B available RDT&E
• Mach 4+ cases • Costs > revenue at lower fares • Market driven by price insensitive
pax, private jet sales • Mach 5 cases constrained by few
viable routes due to increased cost
• Lower fares result in largest fleet size (300 - 700) over 25 yrs
• Biz cases highly sensitive to fuel costs
• 28 barriers characterized through analysis, SME input, vehicle developer interviews
• Identified 6 priority barriers based on consequence and impact
• Type certification in increasingly strict safety and environmental conditions
• Stability and control across all speed regimes
• Overflight prohibition • Emissions • Current avionics performance
assumptions (e.g., GNSS receivers)
• Impact on special materials
• Pax willingness to pay + route viability (revenue > op costs) define demand for each case
• Willingness to pay ↑ w/ speed, rate of increase ↓ above Mach 3
• Drops off significantly for commercial aviation above 1.5x subsonic fare, for general aviation above 2.5x
• Viable routes ↓ w/ speed due to higher operating costs
• No appreciable cargo demand • Addressable market of 800 city
pairs considered

6
Study Overview Market Characterization Task 1: Define the Market Task 2: Define the Business Case Task 3: Identify the Barriers
7
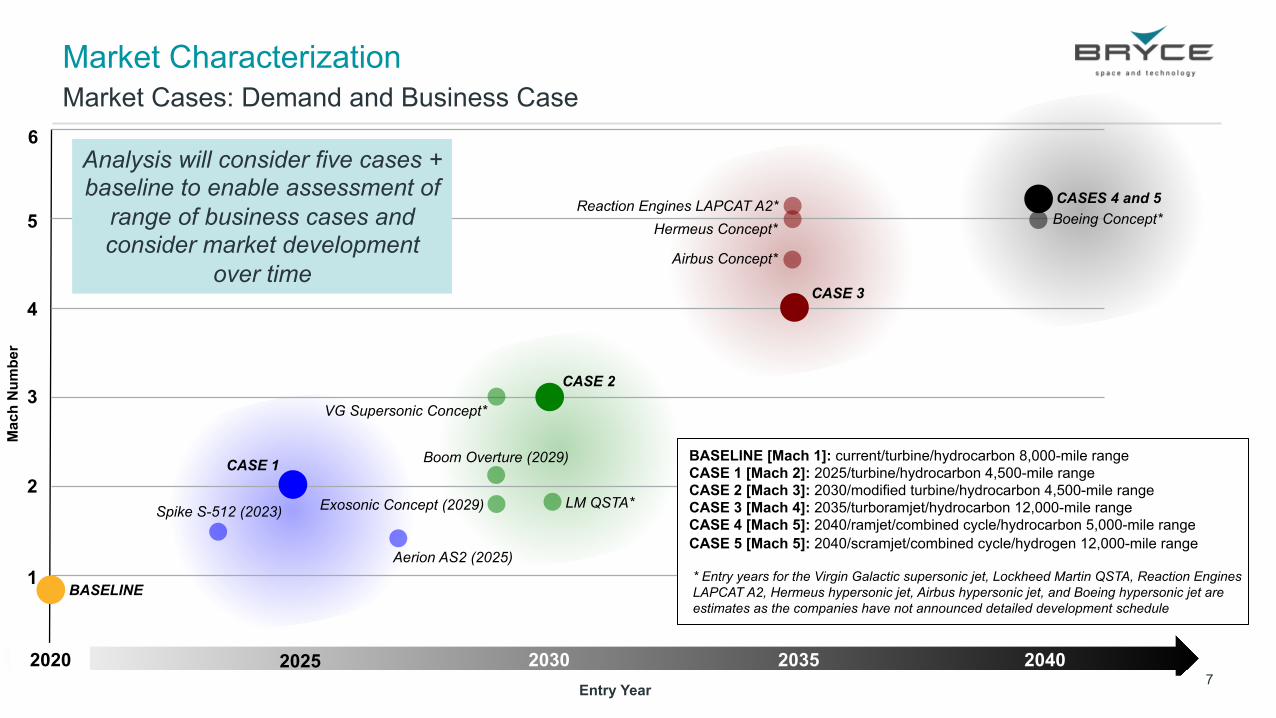
Market Characterization Market Cases: Demand and Business Case
1
2
3
4
5
6
Mac
h N
umbe
r
Entry Year
2020
Aerion AS2 (2025)
Spike S-512 (2023) LM QSTA*
Boom Overture (2029)
VG Supersonic Concept*
Reaction Engines LAPCAT A2* Boeing Concept*
Hermeus Concept*
2040
BASELINE
CASE 1
CASE 2
CASE 3
CASES 4 and 5
BASELINE [Mach 1]: current/turbine/hydrocarbon 8,000-mile range CASE 1 [Mach 2]: 2025/turbine/hydrocarbon 4,500-mile range CASE 2 [Mach 3]: 2030/modified turbine/hydrocarbon 4,500-mile range CASE 3 [Mach 4]: 2035/turboramjet/hydrocarbon 12,000-mile range CASE 4 [Mach 5]: 2040/ramjet/combined cycle/hydrocarbon 5,000-mile range CASE 5 [Mach 5]: 2040/scramjet/combined cycle/hydrogen 12,000-mile range
* Entry years for the Virgin Galactic supersonic jet, Lockheed Martin QSTA, Reaction Engines LAPCAT A2, Hermeus hypersonic jet, Airbus hypersonic jet, and Boeing hypersonic jet are estimates as the companies have not announced detailed development schedule
Exosonic Concept (2029)
Analysis will consider five cases + baseline to enable assessment of
range of business cases and consider market development
over time Airbus Concept*
2025 2030 2035

8
Study Overview Market Characterization Task 1: Define the Market Task 2: Define the Business Case Task 3: Identify the Barriers

9
Task 1: Define the Market Air Transportation Market Segments Mapped to Demand Model Elements
Commercial Aviation
Commercial Aviation Passengers
Commercial Cargo
General Aviation
Private Aircraft Sales
General Aviation Cargo
General Aviation Services
• Scheduled commercial flights for passengers (priced by seat) and cargo
• Addressable passenger market consists of existing passengers flying subsonic business and first class (not upgraded)
Demand Model Elements Demand Model Elements
• On-demand commercially-operated flights, including charters, fractional flights for passengers (priced by itinerary) and cargo
• At-will flights of privately-owned aircraft (including individually-owned, corporate-owned)
• Addressable passenger market consists of charters, fractional flights and sales of aircraft purchased by individuals or corporations for their own use. A proportion of those privately-owned aircraft are made available to commercial operators for charters, so model will excise overlap
10
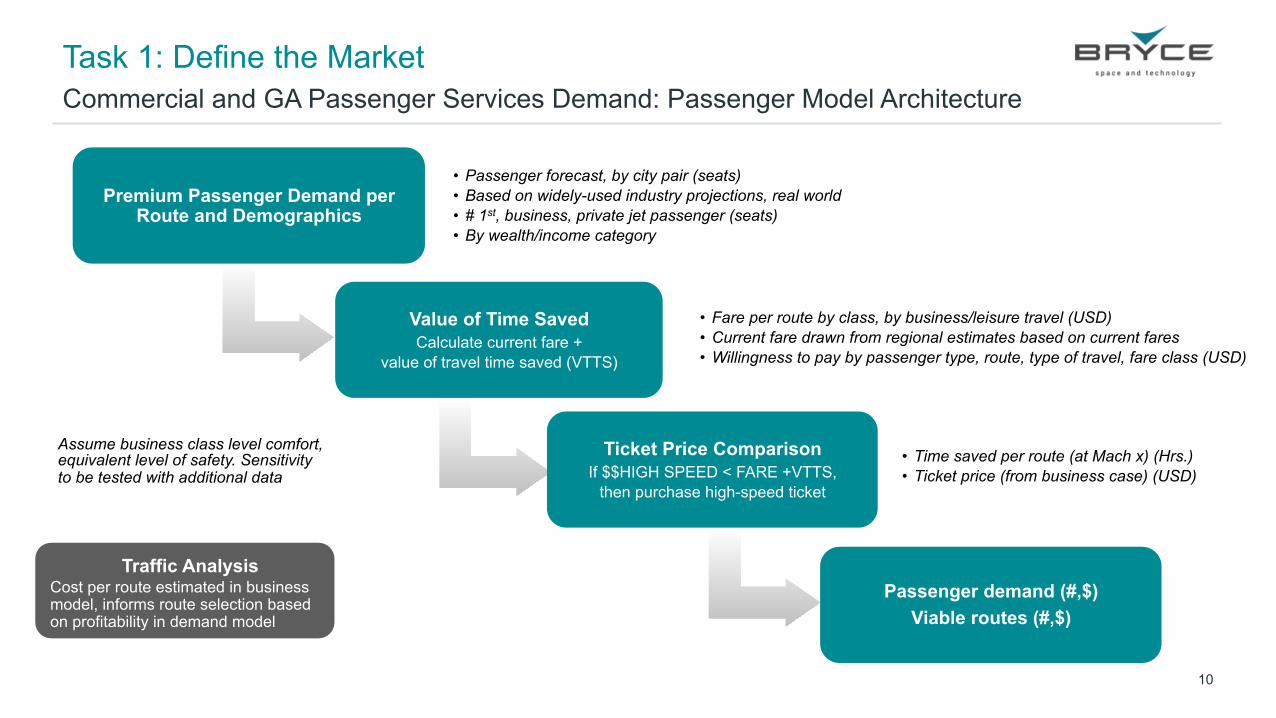
Task 1: Define the Market Commercial and GA Passenger Services Demand: Passenger Model Architecture
Premium Passenger Demand per Route and Demographics
• Passenger forecast, by city pair (seats) • Based on widely-used industry projections, real world • # 1st, business, private jet passenger (seats) • By wealth/income category
Value of Time Saved Calculate current fare +
value of travel time saved (VTTS)
• Fare per route by class, by business/leisure travel (USD) • Current fare drawn from regional estimates based on current fares • Willingness to pay by passenger type, route, type of travel, fare class (USD)
Ticket Price Comparison If $$HIGH SPEED < FARE +VTTS,
then purchase high-speed ticket
• Time saved per route (at Mach x) (Hrs.) • Ticket price (from business case) (USD)
Passenger demand (#,$) Viable routes (#,$)
Assume business class level comfort, equivalent level of safety. Sensitivity to be tested with additional data
Traffic Analysis Cost per route estimated in business model, informs route selection based on profitability in demand model

11
Task 1: Define the Market
Passenger demand (for viable routes) is greatest for Case 1 (Mach 2) Revenue greatest for Case 2 (Mach 3); while there are slightly fewer viable routes for Case 2, they generate higher
average revenue per route At 2.5x fares lose demand for lowest demographic business and leisure travelers, the largest demographic group Across addressable market of 800 city pairs, max # viable city pairs = 327 (Case 1 commercial), 382 (Case 2 general)
2050 Passenger and Revenue Demand for Commercial and General Aviation Services
# of profitable routes 296 64 29 0
11M 1.3M 0.2M 0M
249 49 30 9
10M 1.4M 0.2M 0.06M
177 50 29 19
8.2M 1.3M 0.5M 0.1M
85 24 21 8
4.6M 0.8M 0.3M 0.05M
69 22 22 5
4.1M 0.8M 0.3M 0.03M # pax on viable routes
0% 20% 40% 60% 80% 100%
1.5x base fare
2.5x base fare
5x base fare
10x base fare
2050 Passengers by Wealth Category
HNWI $1M-$5M
HNWI $5M-$10M
UHNWI $10M-$50M
UHNWI $50M-$100M
UHNWI $100M-$500M
UHNWI $500M -$1B+
Does not meet salary threshold
Salary $100k - $500k ($200k Bonus)
Salary $500k - 1M ($500k Bonus)
Salary $1M - $5M
Salary $5M - $10M+
Subsonic premium base fares • Average across all routes: ~$3,500 • Top 249 viable routes (Case 2): ~$4,000
$74 $78 $67
$39 $36
$20 $29 $25
$17 $20
$3 $4 $15
$6 $11 $0 $1 $2 $1 $1
$0
$10
$20
$30
$40
$50
$60
$70
$80
$90
Case 1 Mach 2
Case 2 Mach 3
Case 3 Mach 4
Case 4 Mach 5
Case 5 Mach 5
Bill
ions
Commercial and General Aviation Revenue, Viable Routes
2050, $B
1.5x 2.5x 5x 10x 1.5x 2.5x 5x 10x 1.5x 2.5x 5x 10x 1.5x 2.5x 5x 10x 1.5x 2.5x 5x 10x Fare

12
$0 $10 $20 $30 $40 $50 $60 $70 $80 $90
2030 2035 2040 2045 2050
Total Revenue per Year on Viable Routes at 1.5x Subsonic Fare
Case 1 Case 2 Case 3 Case 4 Case 5
Task 1: Define the Market
Case 1 yields most pax trips; ~15% of 2050 addressable market (i.e., premium pax on long-haul routes)
Case 2 yields highest revenue; ~25% of 2050 addressable market
Context, current subsonic industry • 2019 total airline industry revenue
$870B; representing 4B passengers • 15% of industry revenue is from
premium pax on long haul routes, ~$130B
Commercial and General Aviation Services Demand at 1.5x Fare, All Cases
Bill
ions
0
2,000,000
4,000,000
6,000,000
8,000,000
10,000,000
12,000,000
2030 2035 2040 2045 2050
Total Passenger Trips per Year on Viable Routes at 1.5x Subsonic Fare
Num
ber o
f Trip
s

13
0% 10% 20% 30% 40% 50% 60% 70% 80% 90% 100%
Profitable Routes
Routes by Percent of Revenue EuropeAfrica EuropeC.I.S. EuropeCentral America EuropeChina EuropeEurope EuropeMiddle East EuropeNortheast Asia EuropeOceania EuropeSouth America EuropeSouth Asia EuropeSoutheast Asia Middle EastChina North AmericaAfrica North AmericaC.I.S. North AmericaCentral America North AmericaChina North AmericaEurope North AmericaMiddle East North AmericaNorth America North AmericaNortheast Asia North AmericaOceania North AmericaSouth America North AmericaSouth Asia North AmericaSoutheast Asia
Task 1: Define the Market
• Best case: Case 2 (Mach 3) at 1.5x base fare • 249 viable city pairs in 2050
Commercial Services Routes for Case 2: Mach 3 with 4,500 mi Range
N. America/ China
N. America/ Europe
Europe/ Middle East
Top 25 City Pairs (2050) London/Dubai
New York/London Middle East China
San Francisco/Hong Kong London/Mumbai
New York/Shanghai London/Doha London/Delhi Paris/Dubai
Los Angeles/London Anchorage/Hong Kong
New York/Beijing Dubai/Beijing
Los Angeles/Hong Kong Manchester/Dubai
New York/Paris Los Angeles/Shanghai New York/Hong Kong
London/Abu Dhabi New York/Frankfurt
Frankfurt/Delhi Birmingham/Dubai New York/Tel Aviv Chicago/London New York/Delhi
Europe/South Asia
Europe/China Middle East/China
Europe/North East Asia

14
Task 1: Define the Market
Very few commercial markets for urgent cargo delivery are sensitive to changes of hours • Organ transplants • Urgent documents • Disaster aid
Little new commercial demand expected for high-speed cargo transport; small marginal gains • Currently, air freight is dwarfed by maritime freight
‒ Of the 108 trillion tonne-km of freight transported in 2015, 70% went by sea and less than 0.25% by air ‒ 50% of air freight travels aboard passenger aircraft
• Currently, next-day shipping is available between every inhabited continent for small delivery fees • Hypersonic cargo transportation would continue to face “last-mile” challenges
A military hypersonic cargo market may emerge, separate from commercial demand • The U.S. Transportation Command signed a non-funded cooperative research and development agreement with
SpaceX and XArc to study the use of space launch vehicles to transport supplies in emergencies • U.S. Army and Air Force officials have previously entered discussions with SpaceX regarding the possibility of
using the Starship for point-to-point transportation around Earth and to deliver intercontinentally
Hypersonic Cargo Market
Some niche cargo revenue likely; not a driver of business case
• Perishable luxury goods • Emergency repair parts

15
Study Overview Market Characterization Task 1: Define the Market Special Topic: Survey of High-Net-Worth Individuals Task 2: Define the Business Case Task 3: Identify the Barriers

16
Task 2: Define the Business Case Business Case Model Architecture
Demand-Driven Annual Revenue, Pax for Viable Routes
(from Task 1)
• Set timing (intro year – n years) - Developmental phase start - Vehicle integration, cert phase start - Manufacturing level phase start • Fleet size, turnaround estimate based
on pax demand, pax/vehicle, flight frequency
• Operating costs: fuel, non-fuel, target profitability as % revenue • Depreciation, interest excluded from operating costs • Costs estimated based on equivalent subsonic costs * high-speed multipliers • Multipliers applied to fuel and non-fuel costs
• Market timing for operations by industry segment (intro year + n years) • Private aircraft phase start year 5 yrs prior to general aviation • General aviation phase start year 5 yrs prior to commercial start • Commercial aviation phase start
Operator Business Model • NPV (phase-adjusted revenue) –
NPV (all-up operating costs) = budget for aircraft acquisition
• NPV = 2020 dollars
Set Market Timing (Operations) • Private aircraft sales phase • General aviation phase • Commercial aviation phase
Manufacturer Business Model • Set development phase timing • Add private jet sales revenue, fleet • Estimate marginal production cost, target profit,
profit from services, fleet size, cost/vehicle • NPV (phase-adjusted revenue) – NPV (fleet
marginal production cost) = funds available for RDT&E (developmental, vehicle, manufacturing)
Available RDT&E • NPV (2020)
General Aviation (services + private jet sales) Commercial Aviation
Traffic Analysis Cost per route estimated in business model, informs route selection based on profitability in demand model

17
Task 2: Define the Business Case Overview of Operating Cost Inputs
Operating costs estimated relative to subsonic • Multipliers calculated and applied per seat-mile • Applied to fuel and non-fuel costs • Informed by insight from SMEs/aircraft developers, recent conceptual design
studies, historical data comparing Concorde with Boeing 747
Operating costs considered • Fuel is largest single operating cost for airlines with significant increases
anticipated for high-speed aircraft • Non-fuel costs being escalated: maintenance, insurance, and ground (aircraft
handling, airport fees, and passenger/cargo processing) • Non-fuel costs held constant: air crew, and system (transport related, G&A, pax
service, marketing)
Propulsion Speed Fuel Multiplier
Non-Fuel CA
Non-Fuel GA
CASE 1 Turbine Mach 2.0 4.5x 1.5x 1.9x
CASE 2 Modified Turbine Mach 3.0 5.5x 1.7x 2.3x
CASE 3 Turboramjet Mach 4.0 7x 1.9x 2.7x
CASE 4 Ramjet Mach 5.0 10x 2.1x 3.2x
CASE 5 Scramjet Mach 5.0 11x 2.5x 3.7x
Fuel
Maint. Crew
Insurance
Ground
System
General Aviation Costs (2020)
Fuel
Maint.
Crew Insurance Ground
System
Commercial Aviation Costs (2020)
Sources: Kharina, Anastasia, et al. “Environmental Performance of Emerging Supersonic Transport Aircraft.” The International Council on Clean Transportation, July 2018 Pincini, Margherita. “Analysis of Cost Drivers Impact on Direct Operating Costs Estimation of a Hypersonic Point-to-Point Vehicle.” Polytechnic University of Turin, March 2018

18
Task 2: Define the Business Case Overview of Manufacturing Cost Inputs
Marginal manufacturing cost, excluding RDT&E, profit • RDT&E excluded to calculate available RDT&E as model output • Aircraft sale prices are typically quoted including RDT&E, profit • Marginal cost typically ~75% of aircraft sale price [AIAA]
Includes cost of production, tooling for building single aircraft
Estimated as an input value denominated in $, considered in business case model to determine available RDT&E
Assumed to increase with speed regime, vehicle complexity • Powerplant cost driven by required enhancements such as pre-cooling technology, variable inlets, augmented thrust,
more robust components, etc. • Airframe cost driven by use of titanium, Inconel, and other expensive materials, combined with optimized structures • Wide range of expert views regarding costs for higher Mach cases
Speed
CASE 1 Mach 2.0
CASE 2 Mach 3.0
CASE 3 Mach 4.0
CASE 4 Mach 5.0
CASE 5 Mach 5.0
Model Input: Unit Cost
Propulsion 10 Pax 50 Pax
Turbine $150M $200M
Modified Turbine $200M $300M
Turboramjet $250M $400M
Ramjet $400M $500M
Scramjet $450M $500M

19
$17 $14
$2 $0
($7)
$7
$13
$6 $3 $4 $4 $5
$11
$4 $3 $2 $2 $2 $1 $2
-$75
-$50
-$25
$0
$25 CASE 1 [Mach 2] CASE 2 [Mach 3] CASE 3 [Mach 4] CASE 4 [Mach 5] CASE 5 [Mach 5]
Task 2: Define the Business Case Analysis of Market-Supported Available RDT&E: Total
1.5x 2.5x 5x 10x 1.5x 2.5x 5x 10x 1.5x 2.5x 5x 10x 1.5x 2.5x 5x 10x 1.5x 2.5x 5x 10x Fare
Total (CA + GA incl Private Jet Sales) RDT&E
Available ($B, NPV 2020)
CA GA: Services GA: Jet Sales
$15 $4 $3 $0 ($3) $7 $0 $0 $2 $2 $2 $2
$5 $3 $3 $0 ($5) $1 $6 $0 $2 $2 $2 $2
($2) $2 $2 $0 $0 ($1) $0 $0 $2 $2 $2 $2
($9) $1 $1 $0 $0 $1 $0 $0 $2 $2 $2 $2
$13 $3 $1 $0 $2 $3 $0 $0 $2 $2 $2 $2
All cases at all fares, with one exception, achieve RDT&E > $0 Case 1 achieves highest available RDT&E for a given fare multiplier Case 2 achieves highest available RDT&E varying fares by market segment Cases 4/5 constrained by few viable routes
Contribution to RDT&E Available by Market (NPV $B)
2035 – 2055 2030 – 2055 2025 – 2055
2050 – 2070 2045 – 2070 2040 – 2070
2040 – 2060 2035 – 2060 2030 – 2060
2045 – 2065 2040 – 2065 2035 – 2065
2050 – 2070 2045 – 2070 2040 – 2070
CA GA: Services GA: Jet Sales
Time Horizon
$18B CA 1.5x fare GA 2.5x fare
$24B CA 1.5x fare GA 2.5x fare
$13B CA 1.5x fare GA 5x fare
$4B CA 2.5x fare, GA 10x fare
$4B CA 2.5x fare GA 2.5x fare
Max RDT&E Available
($B, NPV 2020)
Viable Routes Fleet Required
502 392 45 0 618 320 166 150
118 142 120 21 277 235 213 156
419 454 51 33 512 329 166 160
303 340 200 86 441 290 224 171
151 146 79 29 285 229 184 174

20
CA % total GA % total
Fuel $385 51% $126 44%
Maintenance $112 15% $84 30%
Crew $34 4% $20 7%
Insurance $28 4% $9 3%
Ground $106 14% $35 12%
System $92 12% $9 3%
Task 2: Define the Business Case Analysis of Market-Supported Available RDT&E: Best Case
CA 1.5x fare
GA 2.5x fare
302 382 2.6 2.3 2.9 3.2
2,780 2,650 94% 50% 252 299
Findings
Cost Breakdown ($B, CA 20 years, GA 25 years)
• Time horizon = CA: 2040 – 2060, GA: 2035 – 2060, Jet: 2030 – 2060 • Cost multipliers applied to approx. total cost per available premium-
seat-mile for subsonic operator • 25% profit
Inputs CA
1.5x fare GA
2.5x fare 50 10 7% 7%
$300M $200M 5.5x 5.5x 1.8x 2.3x
Cost / available premium-seat-mile $0.81 $2.32
$0
$20
$40
$60
$80
BB G7500 B737max B777 Concorde (M2.0)
Optimized Case (M3.0)
Avg Total Operating Cost, $K / hour / aircraft
= Average, range
14.9
9.0
$0
$5
$10
$15
$20
$25
Available RDT&E ($B, NPV 2020)
CA 1.5x fare
GA 2.5x fare
Best case: Mach 3 aircraft, 4,500 mi range, commercial and general aviation
Total $24B CA
GA
Discount Rate Aircraft Unit Cost
Fuel Multiplier
Pax Capacity
Non-Fuel Multiplier
Avg Route Length (hrs)
Implied Load Factor
Routes/Day Flight hrs/Year
Total Viable Routes
Fleet
21
Task 2: Define the Business Case
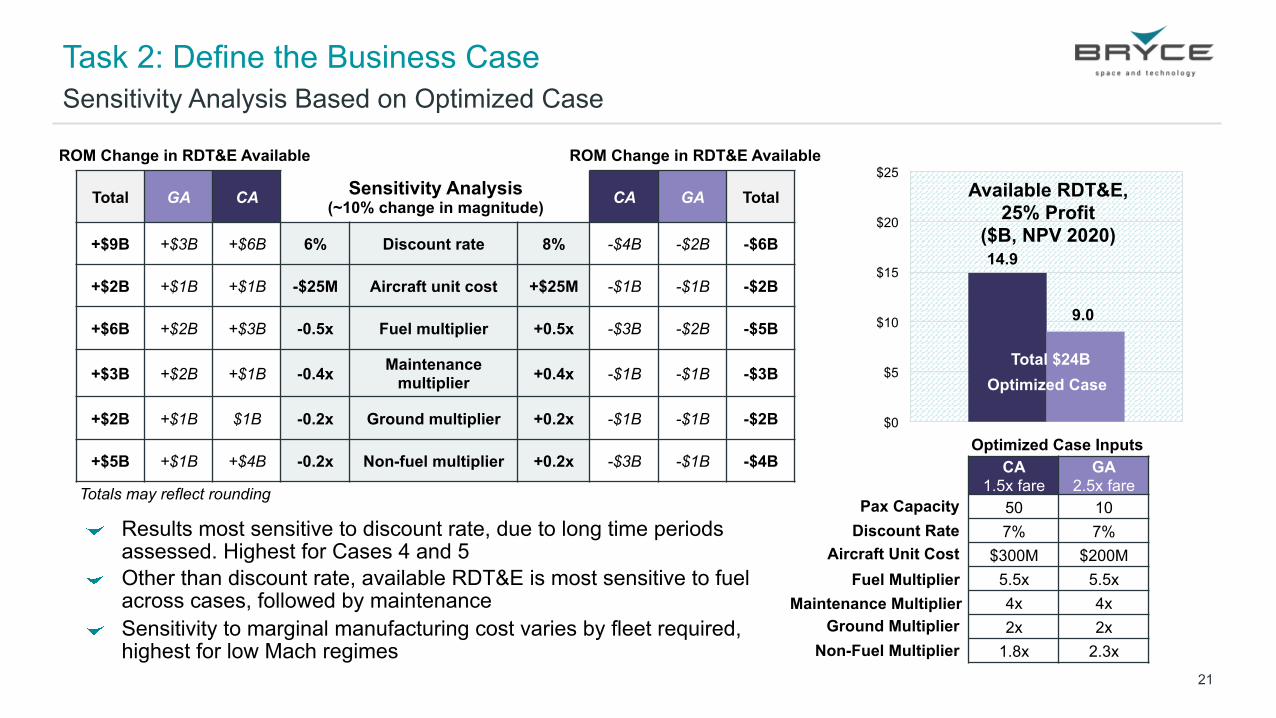
Results most sensitive to discount rate, due to long time periods assessed. Highest for Cases 4 and 5
Other than discount rate, available RDT&E is most sensitive to fuel across cases, followed by maintenance
Sensitivity to marginal manufacturing cost varies by fleet required, highest for low Mach regimes
Sensitivity Analysis Based on Optimized Case
ROM Change in RDT&E Available
Aircraft Unit Cost
Total GA CA Sensitivity Analysis (~10% change in magnitude) CA GA Total
+$9B +$3B +$6B 6% Discount rate 8% -$4B -$2B -$6B
+$2B +$1B +$1B -$25M Aircraft unit cost +$25M -$1B -$1B -$2B
+$6B +$2B +$3B -0.5x Fuel multiplier +0.5x -$3B -$2B -$5B
+$3B +$2B +$1B -0.4x Maintenance multiplier +0.4x -$1B -$1B -$3B
+$2B +$1B $1B -0.2x Ground multiplier +0.2x -$1B -$1B -$2B
+$5B +$1B +$4B -0.2x Non-fuel multiplier +0.2x -$3B -$1B -$4B Optimized Case Inputs
CA 1.5x fare
GA 2.5x fare
50 10 7% 7%
$300M $200M 5.5x 5.5x 4x 4x 2x 2x
1.8x 2.3x
Discount Rate
Fuel Multiplier
Pax Capacity
Non-Fuel Multiplier
ROM Change in RDT&E Available
14.9
9.0
$0
$5
$10
$15
$20
$25 Available RDT&E,
25% Profit ($B, NPV 2020)
Maintenance Multiplier Ground Multiplier
Totals may reflect rounding
Total $24B Optimized Case
22
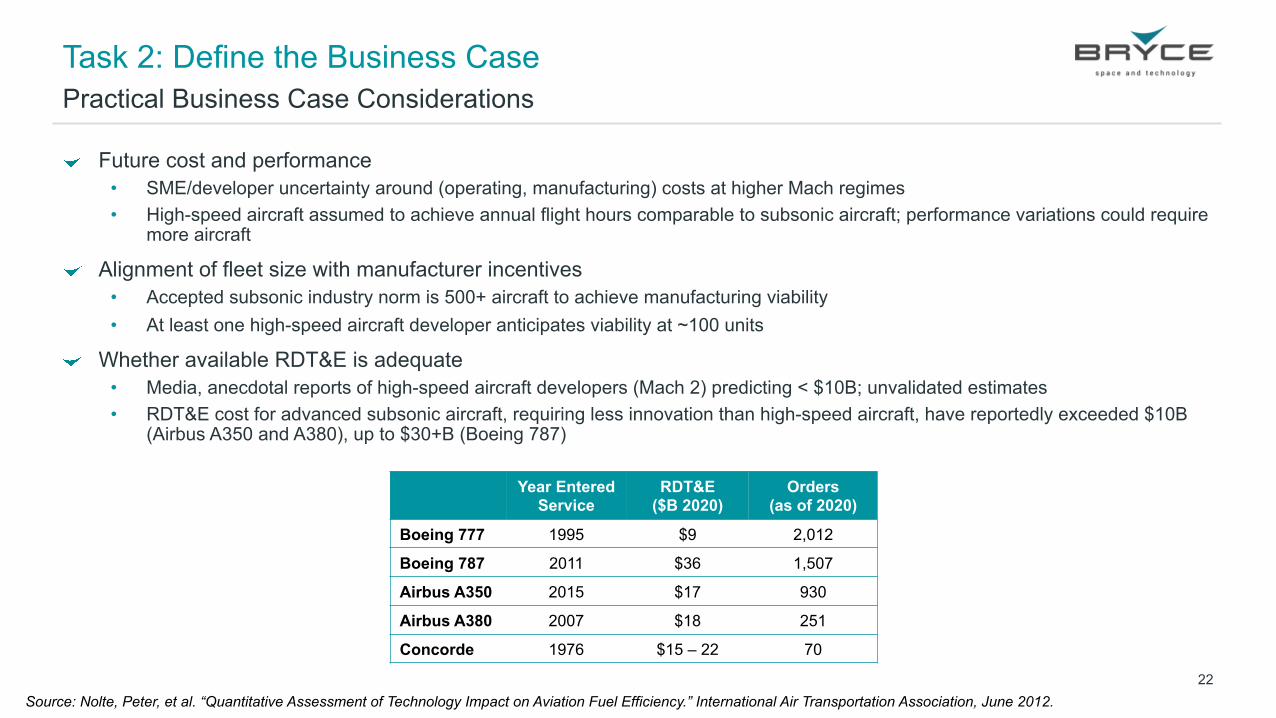
Task 2: Define the Business Case Future cost and performance
• SME/developer uncertainty around (operating, manufacturing) costs at higher Mach regimes • High-speed aircraft assumed to achieve annual flight hours comparable to subsonic aircraft; performance variations could require
more aircraft
Alignment of fleet size with manufacturer incentives • Accepted subsonic industry norm is 500+ aircraft to achieve manufacturing viability • At least one high-speed aircraft developer anticipates viability at ~100 units
Whether available RDT&E is adequate • Media, anecdotal reports of high-speed aircraft developers (Mach 2) predicting < $10B; unvalidated estimates • RDT&E cost for advanced subsonic aircraft, requiring less innovation than high-speed aircraft, have reportedly exceeded $10B
(Airbus A350 and A380), up to $30+B (Boeing 787)
Practical Business Case Considerations
Year Entered Service
RDT&E ($B 2020)
Orders (as of 2020)
Boeing 777 1995 $9 2,012
Boeing 787 2011 $36 1,507
Airbus A350 2015 $17 930
Airbus A380 2007 $18 251
Concorde 1976 $15 – 22 70
Source: Nolte, Peter, et al. “Quantitative Assessment of Technology Impact on Aviation Fuel Efficiency.” International Air Transportation Association, June 2012.

23
Task 2: Define the Business Case
Available RDT&E >$0 for most cases, max $24B (2020 $) • Available RDT&E lower for higher Mach cases • Fewer viable routes as operating and aircraft costs increase
Acquisition budget (e.g., revenue – [operating cost + profit]) shrinks at higher Mach speeds due to increased operating costs
Required fleet size ranges from ~150 to 600+ across cases • 50-pax commercial aircraft 100 - 300 at 1.5x fare, <50 at higher fares • 10-pax general aviation aircraft (other than private jet sales) 0 - 150 • 10-pax private jet sales estimated at 5/yr across cases, total 150 • Manufacturers typically seek production volume of several hundred,
potentially as high as 500 - 1,000 for a single aircraft
Best case: Mach 3 vehicle, $24B available RDT&E 1.5x fare commercial, 2.5x general
• 302 viable routes for commercial aviation, 382 for general • Fleet size: 252 commercial, 299 general (including private jets) • Aircraft marginal manufacturing cost (excluding RDT&E) $300M for
commercial, $200M for general • Available RDT&E $24B ($15B commercial, $9B general)
Takeaways

24
Study Overview Market Characterization Task 1: Define the Market Special Topic: Survey of High-Net-Worth Individuals Task 2: Define the Business Case Task 3: Identify the Barriers

25
• Reviewed articles, papers, studies, and reports
• Interviews with industry professionals
• Reviews with Bryce and SAIC SMEs
• Identify potential consequences of barriers
• Categorize consequences • Estimate magnitude of
consequences • Identify relevance by
vehicle configuration and fuel type
• Quantify consequences
• Map interdependencies among barriers
• Identify actions to mitigate barriers
• Map mitigations to barriers • Use categorization to elicit
further actions from interviews
• Categorize mitigations by type and actor
• Assess impact of mitigations
• Model mitigated barrier to determine impact on demand and business case
• Rank mitigations based on efficacy and cost
Task 3: Identify the Barriers
Catalog real and perceived non-technical barriers, conduct a preliminary assessment of ways to address those barriers, and forecast the likely consequences of different approaches
Identify and Catalog Barriers
Characterize Consequences
Identify Mitigations and Impacts Assess and Prioritize
Methodology

26
Barrier Category Barrier Description
Airport Infrastructure
1. Required runway lengths to support SST and HST likely to limit airport operation planning
2. Existing terminal layouts, vehicle clearances (especially length), and other facilities may be incompatible with SST and HST aircraft designs
3. Special maintenance and support personnel requirements (especially propulsion and materials)
4. Potential need for non-destructive inspection and other quality control and safety processes may slow turn around or increase costs
5. Need for post-flight cool down aircraft holding areas for some SST and all HST may increase flight time, slow turn around, increase costs, and increase fleet size
6. Need for specialized storage, transport, and handling of cryogenics (liquid hydrogen) safely may increase costs
Air Traffic Management 7. High-speed aircraft exiting and reentering terminal air traffic systems as well as traffic lane management may create handoff challenges, and potentially safety issues
Certification (U.S.)
8. Type certification during time when safety standards and environmental compliance trends are tightening
9. Stability and control challenges to include inadequate certification regulations, across the operational flight envelope may increase difficulty to certify as safe, increase test program duration, and/or require more highly skilled pilots
10. Extended operations (ETOPS) for twin-engine aircraft, polar operations
11. Emergency descent and landing requirements under FAR Part 25
12. Current avionic Minimum Operational Performance Standards (MOPS) will require reevaluation to determine if assumptions and algorithms are still valid for SST and HST operations (e.g., TCAS/ACAS traffic alerting, frequency shift due to Doppler effect, environmental testing (temperature and vibration), etc.
13. Prohibition of supersonic flight over the continental U.S. and certain areas outside the U.S. may prevent operations
14. Potential shortage or schedule availability of ground testing facilities (e.g., wind tunnels)
Airport Infrastructure
ATM Certification Environmental Impacts
Export Control
Insurance International/Regulatory
Societal Supply Chain
Weather Workforce
Number of Non-Technical Barriers by Group
Identify and Catalog Non-Technical Barriers Task 3: Identify the Barriers
IIII I I IIII II III II I II II I I II

27
Task 3: Identify the Barriers Identify and Catalog Non-Technical Barriers
Barrier Category Barrier Description
Environmental Impacts
15. Sonic boom and takeoff and landing noise may make it difficult for SST and HST aircraft to meet current Stage 4/5 international noise certification standards
16. Emissions (CO2, NOx, UHC, and particulates) may prevent chemical emission compliance
17. Need for special handling of certain hazardous materials may increase costs
Export Control 18. ITAR restrictions may prevent or hinder operations at non-U.S. facilities, especially in terms of maintenance, software and cyber security, and servicing
19. GNSS operations above 600 m/s (Mach 1.8) restricted by U.S. Munitions List (22 CFR Part 121 Category XII (d)(2))
Insurance 20. Non-existing or unclear insurance approach for SST and HST
International Legal and Regulatory
21. Length of time to develop and institute regulations will take several years
22. Coordination with international partners to ensure integrated regulatory approach (e.g., lack of International agreement for flight operations above 60,000 feet may impede safe operations)
Societal 23. Increased emissions may create resistance to high-speed aircraft in light of climate change
24. Virtual communication technologies replacing certain travel may reduce demand for high-speed flight
Supply Chain 25. Potential shortfalls in producing SST and HST aircraft and components in quantity; higher costs for lower volume
Weather 26. Weather can impact special materials needed at greater than Mach 4 cruise such as tiles, potentially degrading performance; de-icing systems and/or ground support
Workforce 27. Potential shortage of pilots with sufficient experience yet not about to retire
28. Potential shortage of engineers and skilled manufacturers to design, build, and maintain SST and HST aircraft and components, also regulators
28
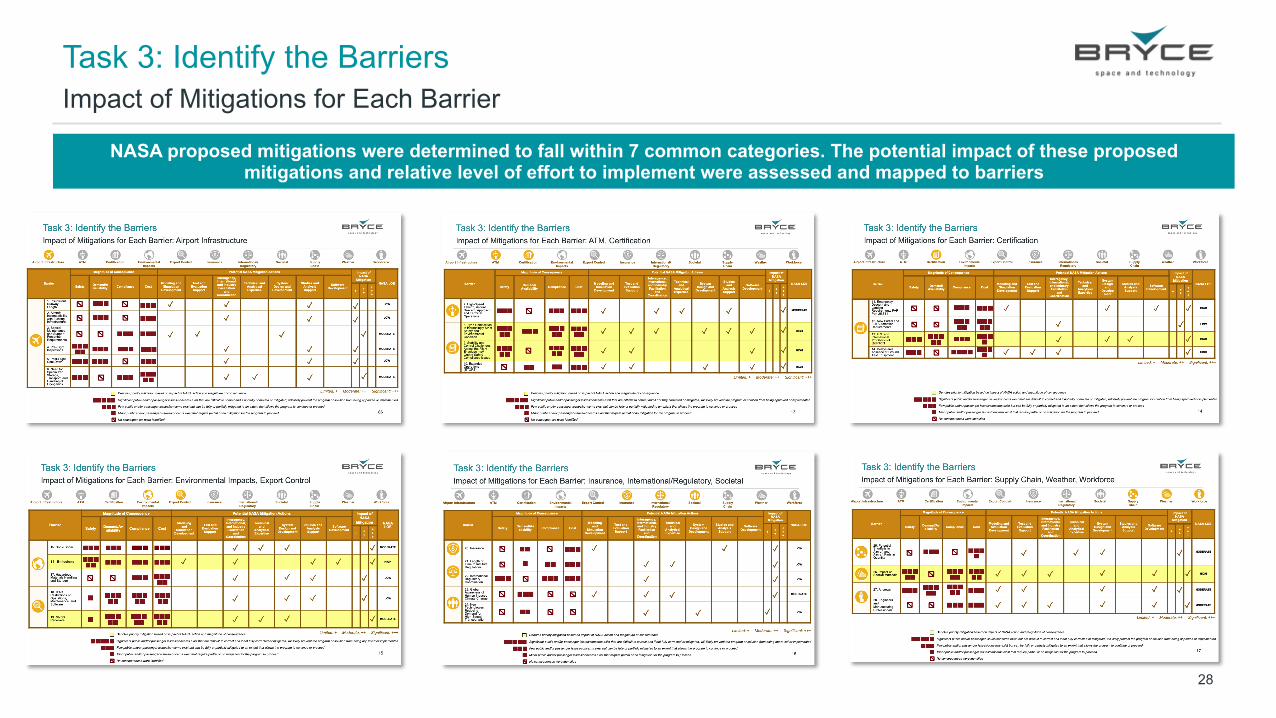
Task 3: Identify the Barriers Impact of Mitigations for Each Barrier
NASA proposed mitigations were determined to fall within 7 common categories. The potential impact of these proposed mitigations and relative level of effort to implement were assessed and mapped to barriers
29
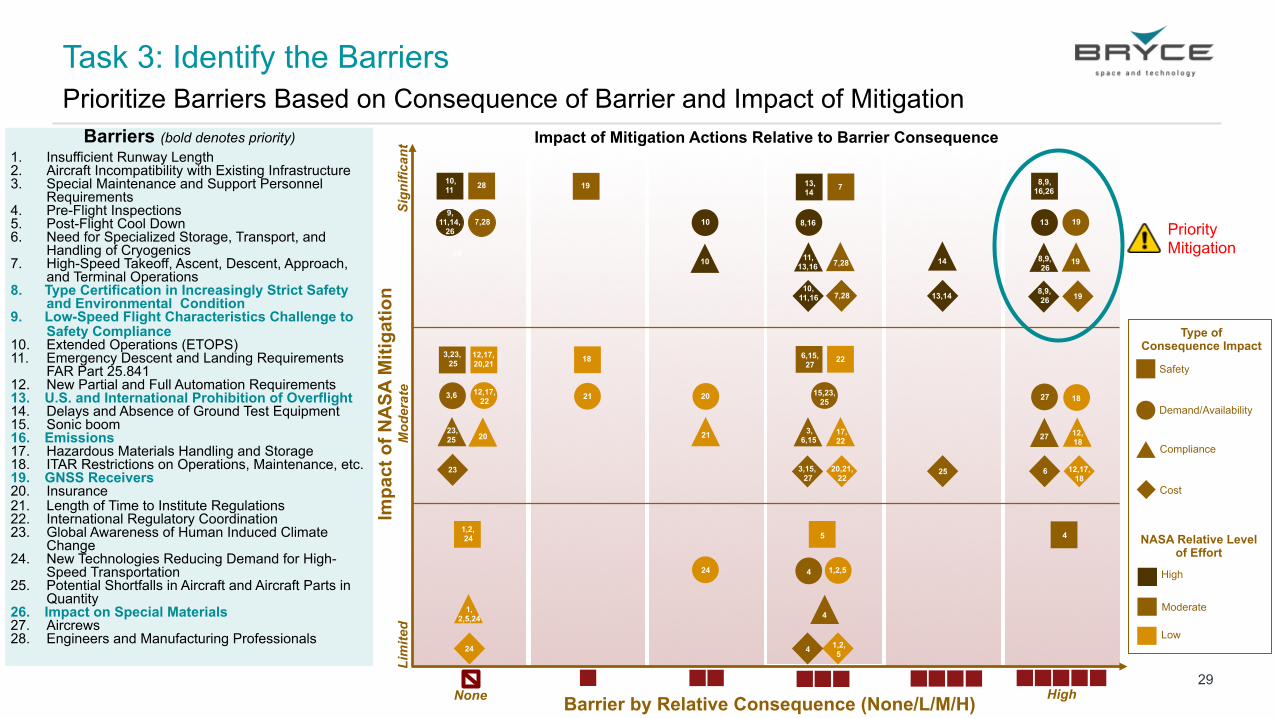
Barrier by Relative Consequence (None/L/M/H)
Impa
ct o
f NA
SA M
itiga
tion
Task 3: Identify the Barriers Prioritize Barriers Based on Consequence of Barrier and Impact of Mitigation
None High
Sign
ifica
nt
Lim
ited
NASA Relative Level of Effort
Safety
Demand/Availability
Compliance
Cost
High
Moderate
Low
Type of Consequence Impact
10 11
28
13, 14
4
18
5
7
8,16
8,9, 26
19
15,23, 25
3,6
24 1,2,5 4
12,17, 22
7,28 19
12,17, 20,21
8,9, 16,26
1,2, 24
3,23, 25
21
9, 11,14,
26
1. Insufficient Runway Length 2. Aircraft Incompatibility with Existing Infrastructure 3. Special Maintenance and Support Personnel
Requirements 4. Pre-Flight Inspections 5. Post-Flight Cool Down 6. Need for Specialized Storage, Transport, and
Handling of Cryogenics 7. High-Speed Takeoff, Ascent, Descent, Approach,
and Terminal Operations 8. Type Certification in Increasingly Strict Safety
and Environmental Condition 9. Low-Speed Flight Characteristics Challenge to
Safety Compliance 10. Extended Operations (ETOPS) 11. Emergency Descent and Landing Requirements
FAR Part 25.841 12. New Partial and Full Automation Requirements 13. U.S. and International Prohibition of Overflight 14. Delays and Absence of Ground Test Equipment 15. Sonic boom 16. Emissions 17. Hazardous Materials Handling and Storage 18. ITAR Restrictions on Operations, Maintenance, etc. 19. GNSS Receivers 20. Insurance 21. Length of Time to Institute Regulations 22. International Regulatory Coordination 23. Global Awareness of Human Induced Climate
Change 24. New Technologies Reducing Demand for High-
Speed Transportation 25. Potential Shortfalls in Aircraft and Aircraft Parts in
Quantity 26. Impact on Special Materials 27. Aircrews 28. Engineers and Manufacturing Professionals
Barriers (bold denotes priority) Impact of Mitigation Actions Relative to Barrier Consequence
1, 2,5,24
1,2, 5
3, 6,15
3,15, 27
Mod
erat
e
4
4
6,15,27
6
7,28
7,28
8,9, 26
10, 11
10
10
10, 11,16
11, 13,16
12, 18
12,17, 18
13
13,14
14
17, 22
18
19
19
20
20
20,21, 22
21
22
23, 25
23
24
25
27
27
28
Priority Mitigation

30
Task 3: Identify the Barriers High Consequence Barriers with Significant Mitigation Impact
Barrier 8. Type certification during time when safety standards and environmental compliance trends are tightening
Barrier 9. Aircraft designed to fly at high Mach regimes across all weather conditions may be less stable at lower speeds and be more difficult to certify as safe, increase test program duration, and/or require more highly skilled pilots
Barrier 13. Prohibition of supersonic flight over the continental U.S. and certain areas outside the U.S. may prevent operations
Barrier 16. Emissions (CO2, NOx, UHC, and particulates) may prevent chemical emission compliance Barrier 19. 600 m/s (Mach 1.8) velocity limit on GNSS receivers (22 CFR Part 121 U.S. Munitions List) Barrier 26. Weather can impact special materials needed at greater than Mach 4 cruise such as tiles,
potentially degrading performance; de-icing systems and/or ground support
Detailed consequences and mitigations for all barriers are incorporated in Appendix to this briefing
31
Task 3: Identify the Barriers
NASA • Facilitate working groups with FAA, Department of State, Department of Defense, airport authorities,
and industry as appropriate to address certification, regulatory, and environmental barriers • Provide technical expertise and modeling/simulation to FAA and industry relating to critical
technologies (e.g. materials, fuels) across a variety of environmental conditions to help reduce certification delays
• Work closely with developers to provide technical expertise in RDT&E of cleaner propulsion systems and fuels
• Continue to pursue sonic boom reduction technologies and social science experiments to determine the acceptable level of takeoff noise and sonic boom
• Work with industry to leverage government programs to develop innovative alternative capabilities, technologies, and processes to address cleaner propulsion, navigation receivers, and special materials
Industry – Establish early coordination with Department of State Department’s Directorate of Defense Trade Controls (DDTC) and Department of Commerce to determine if GNSS receivers are an export restricted technology
Priority Actions to Mitigate Barriers

32
@BryceSpaceTech @SAICInc
www.brycetech.com www.saic.com
Dr. Ronald Lehmer Senior Program Manager, Civil Space/National Security and Space Sector SAIC 925-257-3438 [email protected] Ms. Carie Mullins Analytic Lead, Consulting Team Bryce Space and Technology 724-766-2796 [email protected]

33