INDEPENDENT EVALUATION OF RWANDA S POVERTY … to... · RIEPA Rwanda Investment and Export...
118
1 INDEPENDENT EVALUATION OF RWANDA’S POVERTY REDUCTION STRATEGY 2002-2005 (PRSP1) FINAL REPORT February 20, 2006 Alison Evans (IDS) Laure-Hélène Piron (ODI) Zaza Curran (ODI) Ruth Driscoll (ODI) with Charles Twesigye-Bakwatsa (Centre for Resource Analysis) Iyadema Sezikeye J. Bosco (Centre for Resource Analysis)
Transcript of INDEPENDENT EVALUATION OF RWANDA S POVERTY … to... · RIEPA Rwanda Investment and Export...

1
INDEPENDENT EVALUATION OF RWANDA’S POVERTY REDUCTION STRATEGY 2002-2005
(PRSP1)
FINAL REPORT
February 20, 2006
Alison Evans (IDS) Laure-Hélène Piron (ODI)
Zaza Curran (ODI) Ruth Driscoll (ODI)
with
Charles Twesigye-Bakwatsa (Centre for Resource Analysis) Iyadema Sezikeye J. Bosco (Centre for Resource Analysis)

2
CONTENTS
ACRONYMS ........................................................................................................................5 ACKNOWLEDGEMENTS........................................................................................................7 EXECUTIVE SUMMARY.........................................................................................................8 1. BACKGROUND AND OBJECTIVES OF THE EVALUATION .............................................15
The PRSP Concept .................................................................................................15 Purpose and Focus of the Evaluation ..................................................................16 Evaluation Framework ...........................................................................................16 Evaluation methodology........................................................................................19
2. RWANDA’S DEVELOPMENT CONTEXT ......................................................................20 Overview..................................................................................................................20 Poverty & Vulnerability Trends .............................................................................20 Governance and State Building ............................................................................21 Other National Planning Instruments ...................................................................23 Aid Flows.................................................................................................................23
3. MAIN FINDINGS – PRIORITY AREAS AND CROSS CUTTING ISSUES ............................25 Relevance................................................................................................................25 Efficiency.................................................................................................................34 Effectiveness ..........................................................................................................35 Impact and Sustainability ......................................................................................48
4. MAIN FINDINGS – PRSP PROCESS..........................................................................60 Overview..................................................................................................................60 Consultation and Participation .............................................................................61 Sector Strategy Processes ....................................................................................67 Resource Allocation and Mobilisation .................................................................69 Monitoring and Evaluation ....................................................................................72 Donor Alignment and Harmonisation...................................................................76
5. OVERALL ASSESSMENT ..........................................................................................80 The PRSP ‘logic model’ .........................................................................................80
6. ISSUES AND RECOMMENDATIONS FOR THE NEXT PHASE..........................................85 Second generation PRSs - what have we learned? ............................................85 Scope and Policy Content .....................................................................................86 Scaling-up/Absorptive Capacity Challenges .......................................................89

3
Strategic Planning, Budgeting and M&E..............................................................90 Governance and Politics........................................................................................90 Building a Stronger Development Partnership....................................................92
REFERENCES....................................................................................................................94 ANNEX 1...........................................................................................................................96 POVERTY MONITORING INDICATORS ..........................................................................96 ANNEX 2...........................................................................................................................97 SELECTED BACKGROUND DATA & INDICATORS..........................................................97 COMPARATIVE GOVERNANCE INDICATORS...............................................................102 ANNEX 3.........................................................................................................................105 SUMMARIES OF EVALUATION WORKSHOPS ..............................................................105 ANNEX 4.........................................................................................................................112 STAKEHOLDER SURVEY...........................................................................................112 SURVEY RESPONDENTS...........................................................................................118
Figures Figure 1: Evaluation Framework.................................................................................................... 17 Figure 2: PRSP Logic Model ......................................................................................................... 18 Figure 3: Labour Productivity in Agriculture - Selected African Countries 1980-2000 .................. 21 Figure 4: Total Aid Flows 1990-2004 ............................................................................................ 24 Figure 5: Trends in Fertiliser Imports and Number of Importers 2001-5....................................... 37 Figure 8: Progress with Governance 1998, 2002 and 2004.......................................................... 57 Figure 9: Stakeholder Views on Progress with the PRSP Principles in Rwanda.......................... 60 Figure 10: Survey Responses on Government CSO Collaboration.............................................. 64 Figure 11: Survey Responses on Donor Behaviour ...................................................................... 77 Figure 12: Strengths and weaknesses of the PRSP logic model in Rwanda................................ 81 Figure 13: Survey Responses on the Relevance and Value Added of the PRS Process............. 82 Figure 14: FDI inflows, inter-country comparison........................................................................ 101
TABLES Table 1: Statement of Evaluation Criteria ..................................................................................... 17 Table 2: Income Poverty Data (Percentage below the Poverty Line) ........................................... 20 Table 3: Rwanda's Aid Dependence 2002-2003........................................................................... 24 Table 4: Main Elements of the Strategy ........................................................................................ 26 Table 5: How Cross Cutting Issues Have Evolved Over the PRS Period*.................................... 47 Table 6: Priority Spending Trends................................................................................................. 48 Table 7: Annual Average Growth Rates by Sector........................................................................ 50 Table 8: Selected 'Outcome/Impact' Indicators ............................................................................. 54 Table 9: Registered Investments - Operational vs. Non-Operational............................................ 56 Table 10: The PRSP has brought about Significant Changes for the Better in Which Areas?..... 82 Table 11: Survey Responses - What are the Main Things that PRSP1 lacks? ............................ 83 Table 12: Vision 2020, PRSP1 and the MDGs.............................................................................. 96
4
Table 13: Priority Spending Trends............................................................................................... 97 Table 14: Education Sector Performance ..................................................................................... 98 Table 15: Health Sector Performance ........................................................................................... 99 Table 16: Press Freedom – Rwanda and other African PRSP countries.................................... 104 Table 17: Composition of Survey Respondents .......................................................................... 118 Table 18: Composition of Survey Respondents by stated involvement in the PRSP Process ... 118
BOXES Box 1: Vision 2020......................................................................................................................... 22 Box 2: Income and Nutritional Outcomes in Rural Areas 1990-2000............................................ 28 Box 3: Identifying Rwanda's Governance Challenges .................................................................. 30 Box 4: Decentralisation and Efficiency in Health and Education................................................... 35 Box 5: PSTA Programmes and Sub-Programmes........................................................................ 36 Box 6: Stakeholder Participation in the Annual Education ............................................................ 41 Box 7: Towards a Justice Sector Strategy .................................................................................... 44 Box 8: Reasons for Low Fertilizer Use among Traditional Crop Farmers..................................... 51 Box 9: HIMO - What is Working; What is Not?.............................................................................. 52 Box 10: Health Insurance for the Poor .......................................................................................... 55 Box 11: Improved revenue performance - a sign of increasing government effectiveness .......... 57 Box 12: Civil Society in Rwanda.................................................................................................... 61 Box 13: Ubudehe - Impact on Livelihoods..................................................................................... 67 Box 14: Tanzania - From Priority Sectors to Outcomes................................................................ 70 Box 15: A New Framework for Monitoring and Evaluation............................................................ 73 Box 16: CSO Participation in the APR .......................................................................................... 75 Box 17: Grassroots engagement in PRSP monitoring .................................................................. 76 Box 18: Factors Contributing to Aid Harmonisation in Rwanda .................................................... 78 Box 19: Project support is not meeting the needs of the Education Sector .................................. 78 Box 20: Trade, Rural Development and Poverty Reduction in Rwanda ....................................... 86 Box 21: MDG Needs Assessment Approach ................................................................................ 87 Box 22: Mainstreaming Poverty in Public Policy ........................................................................... 88 Box 23: The Case for More aid?.................................................................................................... 89 Box 24: Lessons from Tanzania: Popularising the PRSP and the NGO Policy Forum (NPF)...... 93

5
ACRONYMS APR Annual Progress Report BSHG Budget Support Harmonisation Group CCI Cross Cutting Issue CDF Common Development Fund CEPEX Central Projects and External Finance Bureau COMESA Common Markets for Eastern and Southern Africa CSO Civil Society Organisation DAC Development Assistance Committee of the OECD DDP District Development Plan DFID (UK) Department of International Development DHS Demographic and Health Survey DP Development Partner DPCG Development Partners Coordination Group DPM Development Partners Meeting DTIS Diagnostic Trade Integration Study EICV Household Living Conditions Survey (Enquête Intégrale sur les Conditions de Vie des Ménages) ESSP Education Sector Support Programme EU European Union GBS General Budget Support GDP Gross Domestic Product GER Gross Enrolment Rate GNI Gross National Income GoR Government of Rwanda HARPP Harmonisation and Alignment in Rwanda for Projects and Programmes HIPC Highly Indebted Poor Countries Initiative HSSP Health Sector Strategic Plan ICT Information and Communication Technology IFIs International Financial Institutions IMF International Monetary Fund INGOs International Non Governmental Organisation I-PRSP Interim Poverty Reduction Strategy Paper M&E Monitoring and Evaluation MDG Millennium Development Goal MINAGRI Ministry of Agriculture MINALOC Ministry of Local Government MINECOFIN Ministry of Finance and Economic Planning MINEDUC Ministry of Education MINIFOTRA Ministry of Public Service and Labour MINISANTE Ministry of Health MINITERRE Ministry of Lands, Environment, Water and Natural Resources MTEF Medium Term Expenditure Framework NGO Non-Governmental Organisation NPA National Poverty Assessment NPRP National Poverty Reduction Programme (MINECOFIN) NURC National Unity and Reconciliation Commission PER Public Expenditure Review

6
PETS Public Expenditure Tracking Survey PGBS Partnership General Budget Support PIP Public Investment Plan PPA Participatory Poverty Assessment PRGF Poverty Reduction and Growth Facility PRSP Poverty Reduction Strategy Paper PSD Private Sector Development PSTA Strategic Plan for Agricultural Transformation REMA Rwanda Environment Management Authority RIEPA Rwanda Investment and Export Promotion Agency RPF Rwanda Patriotic Front RRA Rwanda Revenue Authority SPA Strategic Partnership with Africa SPU Strategic Planning and Poverty Monitoring Unit (MINECOFIN)

7
ACKNOWLEDGEMENTS The evaluation team would like to express their gratitude for all the assistance provided in the conduct of this evaluation by Ernest Rwamucyo, Director SPU MINECOFIN, his team in the Strategic Planning Unit, Sebastian Silva Leander and staff at UNDP, Kigali; Judy Walker and the DFID team, Kigali. Also to all the stakeholders in other Ministries and Government Departments who gave of their valuable time and to representatives of the international community, civil society, National Assembly and Government of Rwanda who participated in the various evaluation workshops held in Kigali during November 2005 and responded to the Survey. Special thanks to Fidel Kavira of MINALOC for arranging the field visit on ubudehe. Findings and opinions in this report are those of the evaluation team and should not be ascribed to any of the agencies that sponsored the study.

8
EXECUTIVE SUMMARY
Background to the PRSP in Rwanda This report summarises the findings of the Independent Evaluation of Rwanda’s first Poverty Reduction Strategy Paper (PRSP). The evaluation was carried out between late September and mid December 2005 and was timed to feed into the preparations of the next Poverty Reduction Strategy (EDPRS). The PRSP is intended to be a comprehensive strategy framework for guiding government action in tackling the causes and consequences of poverty. More than a strategy, the PRSP also embodies a set of principles which distinguish it from earlier planning frameworks and donor initiatives. These principles underscore the importance of a country-led and country owned strategy process involving broad-based consultation; a clear results orientation starting from the analysis of poverty and its causes and working back to the design of appropriate policies and their monitoring over the medium to long term; and a new basis for partnership based on the alignment of donor resources with nationally defined priorities in the PRSP. Preparation of Rwanda’s PRSP1 began in 2000 (with preparation of an interim PRSP) and finalised with full endorsement by the IFI Boards in 2002. The strategy covers the implementation period 2002 to 2005. During this time the Government of Rwanda has, in line with HIPC commitments, produced three Annual Progress Reports covering the financial years 2002, 2003 and 2004. A second Poverty Reduction Strategy (EDPRS) is planned for early 2007 with preparations beginning in early 2006. The objective of the evaluation is to examine progress towards PRSP1 goals with a specific emphasis on identifying lessons on process and impact for the EDPRS. The evaluation is structured around a core set of evaluation questions linked to the key stages of the PRSP process (Chapter 1, Figure 1). In line with current best practice in development evaluation, it applies the five standard evaluation criteria of the OECD/DAC – relevance, efficiency, effectiveness, impact and sustainability – to assess the strengths and weaknesses of PRSP1. To assess the value-added of the PRSP in terms of the way government, development partners and non-government actors do business for poverty reduction the evaluation also draws on a simplified ‘logic model’ identifying the main pathways through which the PRSP is expected to contribute to better outcomes for the poor (Chapter 1 Figure 2). By examining the robustness of these pathways it is possible to assess how far the PRSP has taken root in Rwanda and what, if anything, could be done differently to ensure a more consistent and effective approach to poverty reduction in the future. Rwanda’s Development Context In assessing progress under PRSP1 it is vital to understand where Rwanda was just six years before it started on its PRSP process. Firstly, Rwanda was emerging out of a devastating civil war and a genocide so vast as to be virtually unparalleled in the late twentieth century. Poverty trends prior to 1994 were already deteriorating but by the end of the genocide an estimated 78 percent of Rwanda’s population were absolutely poor. Incomes per capita collapsed by a massive 50 percent while the impact of the conflict on

9
health, education, agriculture and human capacity in general was deep and devastating. Second, the new Rwandan government inherited a governance regime that was deeply hierarchical and authoritarian, biased towards certain regions and profoundly elitist. State institutions had all but collapsed. The immediate challenge facing the new leadership was a fundamental rebuilding of the state and society through the provision of essential security, reconstructing key institutions, national reconciliation, providing justice to victims of the genocide and restoring macroeconomic stability. The preparation of the PRSP in 2000 can therefore be seen as strongly emblematic of the country’s recovery, and particularly its transition through the zero-generation reforms of the emergency phase to a set of structural and institutional reforms necessary to support broad based growth and poverty reduction. Although the decision to produce a PRSP in 2000/1 was not home grown, the PRSP nevertheless came at an important moment for Rwanda, providing as it did a crucial opportunity to link the country’s newly formed Vision with an explicit policy agenda for tackling poverty and the social inequities of earlier decades. Relevance of PRSP1 When compared with earlier planning frameworks and donor-led instruments (such as the PFP) the PRSP has proved strongly relevant to Rwanda. This relevance is clearest in the institutional sense through the PRSP’s support for a country-led and participatory process and its focus on building a comprehensive policy framework for tackling poverty reduction over the medium to long term. In process terms the Rwanda PRSP inspired almost unprecedented levels of direct citizen participation which ensured a strong locally owned process. The needs assessment contributed to the most comprehensive profile of poverty in the country at the time, and provided an important baseline for assessing progress on poverty reduction in the future. In terms of strategy content, the six main priority areas of rural development and agricultural transformation, human development, economic infrastructure, governance, private sector development and institutional capacity-building provided a comprehensive response to Rwanda’s main development challenges and closely reflected the six pillars of the nationally owned Vision 2020. At this time there was a relatively weak focus on the MDGs, but this was by no means exclusive to the Rwanda PRSP and since 2002 the international community, in particular, has been paying much more attention to the value-added of a long-term MDG focus in guiding effective public action on poverty. Governance issues were examined quite openly in PRSP1 with two of the most important planks of the government’s transformational agenda - grassroots participation and decentralisation - figuring prominently. The overall evaluation of relevance is nevertheless weakened by the limited analysis of the risks and vulnerabilities facing different poor groups in Rwanda, and particularly by weak analysis of the obstacles affecting access by the poor to critical public services, particularly in the health, water and sanitation, agriculture and housing. Some of these issues were not highlighted because of sensitivities about the post-conflict context but the result is a strategy that is less direct than it could be about what is required to ensure effective inclusion by the poor, particularly in and around access to basic services.

10
On a related note, although the PRSP is clear about Rwanda’s significant governance challenges, there is a sense in which it separates the more technical aspects of the pro-poor agenda – planning, budgeting and service delivery - from the deeper political questions of Rwanda’s long term peace, security and human rights. How much of this reflected the more technocratic instincts of donors, especially the IFIs, and how much was down to internal politics is not clear but, as argued later in the evaluation, such a separation is unhelpful in practice to the extent that it skews the country conversation about poverty away from deeper questions of rights and equity. The potential benefits of bringing these discourses together in a more integrative framework are explored further in the final section on recommendations. Caveats aside, and with Rwanda’s initial conditions in mind, the conclusion is that PRSP1 was, and continues to be, a relevant instrument for focusing the work of government and its main partners on the challenge of reducing poverty. Efficiency and Effectiveness of PRSP1 Many of the reform measures now underway actually date back to before the PRSP and identifying what is or is not attributable to the PRSP is, in practice, extremely difficult. The more pertinent question is to assess how much of the current reform effort reflects the priorities identified in the PRSP and, in turn, how effectively these priorities are being delivered through the ongoing reforms? Stakeholders interviewed during the evaluation noted tangible improvements in the degree of openness in government policy and in the level of transparency in the use of public resources. Starting from a low base, policy processes have become more inclusive following the PRSP and the introduction of the cluster system. Better and more structured opportunities for dialogue between government and development partners at sector level has opened up opportunities for more interaction with national and, specifically, NGO partners. While government remains highly cautious of the role and representativeness of NGOs and seeks to hold a tight rein over the operation of such groups, there are some signs of a gradually improving and constructive relationship, including around the PRSP process itself. Progress with public financial management reforms is widely acknowledged and seen as a crucial basis for moving ahead with a more effective and pro-poor system of public expenditure management. Sector strategy processes have helped to improve the process of sectoral policy formulation in some sectors, supported by the roll-out of sectoral MTEFs and joint reviews in at least a few key sectors (education particularly). The PRSP, MTEF and APRs have helped to create a clearer platform for internal policy coordination and a stronger basis for donor alignment, particularly through the move to budget support and more programmatic ways of working. Nevertheless the same set of stakeholders also expressed clear reservations about the breadth and depth of improvement in the systems and processes underpinning PRSP implementation. They noted continued weaknesses in prioritisation processes at sector level and inadequate attention to mechanisms that ensure the poor and poorest benefit most. The failure to put in place institutionally compatible systems for monitoring and evaluation at sector and programme level reflects a more deep seated problem of weak capacity and a weak demand-side for monitoring and evaluation data, compounded by

11
the multiple reporting requirements of donors and the lack of consistency in donor performance criteria. The government’s intention to shift to a more results-oriented budgeting process is widely endorsed, but qualified by concerns about the lack of manoeuvrability in the budget with which to reward better performance and ongoing capacity constraints at ministry level. Stakeholders across the board pointed to the slow pace of reforms for addressing implementation capacity constraints at central and local government levels (for example the capacity building fund of the CDF is still not functioning), and to uncertainties arising from the decentralisation and public service reform processes. Participatory policymaking, while improving, is also noted to be limited by capacity weaknesses in government agencies and amongst NGOs and by a continuing climate of suspicion hanging over civil society more generally. Rwanda has seen perhaps more activity on alignment and harmonisation than countries of a similar size or aid history. The creation of institutionalised structures to handle the dialogue between government and donors has been constructive. Nevertheless individual donor practices continue to vary widely and there is still a proliferation of donor projects at all levels. A shortage of aid management capacity within government means that efforts to streamline assistance are still required by donors themselves, but here progress is very slow. The Budget Support Group and the PRSC provide two strong focal points for more streamlined assistance, but still represent only about one-third of all ODA received by Rwanda, and many external resources are still not declared ‘on-budget’. Limitations on donor country office capacities and the degree of power held at country level by donor agencies has limited the scope for a more quantum change in alignment and harmonisation, while different donor political assessments of the credibility of the government’s reform programme and human rights record have tended to undermine efforts at building a more equal and trusting relationship between government and the donor community. Impact and Sustainability The assessment of impact is heavily constrained by the absence of poverty outcome data and incomplete reporting on intermediate outcomes at sector level. As a consequence the evaluation has had to rely on a highly partial set of output and outcome data with which to draw conclusions about the impact of PRSP1. In education, the sector programme has delivered a number of significant policy changes with implications for the poor. The introduction of fee-free compulsory primary education in particular has helped widen access, while the provision of the capitation grant directly to schools has improved school purchasing power and helped to directly support increased enrolments. Net enrolment rates have, as a result, increased dramatically with early signs that completion rates are also on the increase. However, budget outturn data shows that, despite recent policy shifts, actual spending in the sector continues to favour tertiary over primary education. In health there has been an expansion of insurance coverage through mutuelles de santé from 9 to 27 percent of the population during the PRSP period, along with improved staffing of rural health facilities, increased vaccination rates, a treatment programme for TB and an action plan for HIV/AIDS. Here, however, progress in outcomes appears more elusive, particularly in areas where the poor tend to figure most.

12
Health spending, for example, continues to favour tertiary over basic health care. Maternal and under-five mortality rates have not dropped at all, pointing to some serious implementation failures and the limited impact of ‘pro-poor thinking’ across the sector more generally. In the agricultural sector, there has also been some progress at the output level, most significantly in coffee and rice, and a substantial restocking of livestock which is now close to 1990 levels. Agricultural growth rates nevertheless remain highly vulnerable and food crop producers in particular continue to suffer large losses because of failed rains compounded by poor marketing and transport infrastructure. Fertiliser use remains well below PRSP expectations and extension services are still not fully operational in the new decentralised administrative structure. The new agricultural strategy (PSTA), while a welcome development, has come to late to make an impact in this PRSP period and still lacks clarity in terms of key institutional roles and responsibilities in the sector and a clear criteria for pro-poor prioritisation, especially given financial and human capacity constraints. Whereas agriculture is presented as the engine of growth and poverty reduction in the PRSP, in practice the PRSP has had had only limited traction over the pace or orientation of reform in the agricultural sector or, indeed, on the size of the sector budget. In private sector development revisions to the investment code and the restructuring of RIEPA (formerly RIPA) to include a focus on export promotion are evidence of a more outward oriented approach. Tourist numbers have continued to expand and a tourism strategy has been produced. Coffee has also continued to recover its place as Rwanda’s lead export with export earnings from coffee more than doubling in 2004. The most recent figures (2004) from RIEPA show signs of increasing registered investments in Rwanda over the base year of 2001. However the share of foreign direct investment remains very low, linked to continuing weaknesses in the wider business climate. International business climate indicators point to areas where Rwanda is significantly less attractive than neighbouring countries, most notably in the time taken to secure rights to property (one of the five most difficult countries in the world in which to register property) and the cost in per capita income terms of starting a business (World Bank 2004).1 High energy costs, estimated at nearly three times the regional average, are also a significant barrier to entry, forcing up production costs relative to producers in neighbouring countries. High transport costs restrict opportunities for trade while inconsistencies in the tax burden and limited financial capital for small and medium scale enterprises limit the opportunity for job creation at the lower end of the income spectrum. In the governance and human resources development sectors, there has been a significant degree of institutional transformation to implement the government’s political agenda. The 2003 Constitution, parliamentary and presidential elections, the initial phases of decentralisation and the establishment of a credible justice system are amongst the most important governance achievements of the period. There is, however, little information on the impacts on the poor and poorest of governance reforms, especially in terms of accessibility and public accountability. Deepening decentralisation, improving public service performance and a more effective strategy for capacity development are still required to ensure GoR capacity to implement its PRS commitments. Progress on democratisation, rights and equity remain important - the
1 World Bank (2004) Doing Business

13
development of a political culture of openness and accountability is a crucial part of creating and sustaining an enabling environment for growth and poverty reduction. Overall Assessment of PRSP1 The overall finding is that there have been clear and tangible efforts to operationalise the PRSP at the level of central systems for planning and budgeting. The PRSP underscored the importance of a more participatory approach to policy making and, with some caveats, this has resulted in a more empowered, nationally led approach to policy formulation. However, the PRSP’s influence on the efficiency and effectiveness of public action for the poor has been limited, particularly at the level of sector agencies and sub-national levels. Areas in which clear progress has been made (PFM, education etc) have been supported by the PRSP but have not been driven by it. While there is evidence of increased government leadership and ownership of the policy process, it remains unclear how much of this is about, or can be attributed to, the PRSP. Empowerment policies have ensured an absence of repeat conflict and the beginnings of justice for the victims of genocide, nevertheless disconnects between aspects of the government’s political programme and the implementation of the PRSP have tended to keep the poverty agenda away from the important questions of equity and rights. The lack of a systematic focus on long term goals such as the MDGs has also limited the policy and political traction of the PRSP for delivering the country’s vision. Development partners claim that they are improving alignment with the PRSP, but in many crucial ways their practices and procedures are still largely at odds with one another and the principles of the PRSP and subsequent international commitments on aid effectiveness. The conclusion is that much of the momentum behind the PRSP which began in MINECOFIN has largely stayed within MINECOFIN, and that a major challenge now for the EDPRS is to broaden this out to include a wider range of actors across government and beyond. Going Forward - Recommendations Building on the findings of the evaluation the main recommendations in going forward to the EDPRS are:
Consider using the EDPRS as a vehicle for integrating Rwanda’s national political vision of unity and prosperity with the need to reduce poverty, enhance equity and provide broad based growth for all. Draw more clearly on the MDGs as a useful political and instrumental framework for setting long term poverty reduction goals.
Ensure early political engagement in the PRS preparation and implementation
process as a way of extending ownership across government including at sub-national levels.
Ensure a clearer multi-sectoral focus on growth, emphasising the role of the
agricultural services, SME development, trade and the provision of basic infrastructure – energy, rural roads and water – in raising productivity and

14
boosting investment. Getting the basics right is going to be a crucial part of Rwanda’s growth story in the short to medium term.
Build on the achievements in the human development sectors while identifying
clearer criteria for ensuring a pro-poor focus in public spending. Review institutional roles and responsibilities in the light of decentralisation and ensure mechanisms for reaching poor users.
Align internal policy, planning and budgeting processes more effectively to
support delivery of PRS priorities and build a more consistent and effective focus on results across the government programme. This requires bringing together improvements in planning and budgeting at sector level that have, to date, happened in parallel rather than in conjunction with one another.
Strengthen sector prioritisation processes and the development of streamlined
approaches to M&E. Unify sector reporting formats to assess progress against short and medium term goals and the long term priorities of the EDPRS.
Make the MTEF the major strategic output of the annual budgetary cycle and
ensure that it, along with the annual progress report, goes to Parliament for wider consultation and public accountability.
Focus as much on quality of aid issues, as on the quantity of aid. Strengthen aid
management capacity within government to streamline donor processes, supported by a set of aid principles to guide alignment and delivery behind the EDPRS. Put in place a mechanism for monitoring government and donor progress against the Paris commitments on alignment and mutual accountability.
Develop a strategic vision for deepening aspects of political governance – rule of
law, democratisation and the protection and promotion of rights – as key building blocks for the achievement of poverty reduction goals.
Develop clearer institutionalised mechanisms for regular consultation with
Parliament and NGOs on the evolving policy framework and the implementation progress. Ensure a more popularised approach to EDPRS dissemination including non-technical versions of the strategy, its goals and targets for wider public debate and accountability.
15
1. BACKGROUND AND OBJECTIVES OF THE EVALUATION The PRSP Concept 1.1 Poverty Reduction Strategy Papers (PRSPs) were introduced in late 1999 as an instrument to link debt relief to progress on poverty reduction in enhanced HIPC eligible countries. PRSPs took the place of former Policy Framework Papers (PFPs) as the required statement of recipient government objectives for receipt of IFI concessional development assistance. 1.2 A number of stages constitute the PRSP ‘process’ beginning with preparation of an Interim PRSP (I-PRSP) as an initial condition for reaching the HIPC Decision Point and a signal for the release of debt relief. This is followed by preparation of a full PRSP involving broad consultation with national stakeholders which, together with the preparation of Annual Progress Reports (APRs) and monitoring of specific HIPC ‘triggers’, marks the transition towards HIPC Completion Point and the effective de-linking of the PRSP from the condition of debt relief. 1.3 In replacing PFPs, the PRSP concept sought to reflect criticisms of past ways of doing business, both within recipient countries and in the international community, and incorporated a number of principles to guide the process. The key principles are:
A country-led strategy process in which government engages in dialogue with other national stakeholders to ensure broad-based ‘consensus’ and ownership of the strategy and policies selected.
The strategy should be results or outcome oriented, starting from an analysis of poverty and its causes and working back to the design of appropriate policies and their monitoring
The approach should be comprehensive in its coverage of different macro, sectoral and cross-sectoral issues affecting poverty
The strategy and related process should be the basis of a new form of partnership with the international community that mobilises and coordinates external assistance behind the PRSP under the leadership of the national government
The PRSP should take a medium to long term perspective, implying the need for forward-looking commitments from both government and international partners to ensure full implementation of the strategy.
1.4 Since 2000/2001 the PRSP has expanded beyond HIPC-eligible countries to include all low-income countries receiving concessional assistance. Over time the PRSP approach has assumed wider significance in terms of its impact on policy, planning and budgeting for poverty reduction in low income countries and the way international support to poverty reduction is framed and delivered.2
2 Booth, D. (eds) 2003 Fighting Poverty in Africa. Are PRSPs making a difference? ODI, London.
16
1.5 Rwanda prepared its Interim PRSP in November 2000. The final Poverty Reduction Strategy Paper was completed in June 2002 and discussed by the Boards of the IMF and World Bank in July 2002. Since then the Government of Rwanda has produced three Annual Progress Reports covering the financial years 2002, 2003 and 2004. A second Poverty Reduction Strategy is planned for early 2007 with preparations beginning in early 2006. This evaluation is envisaged as a key initial stage in the road map for preparing PRS2. Purpose and Focus of the Evaluation 1.6 The Terms of Reference state the primary purpose of the evaluation as being ‘to undertake a full review of Rwanda’s first PRSP and related Annual Progress Reports with a view to identifying lessons arising from the impact and process of PRSP1’. Although the evaluation formally focuses on the period of PRSP preparation and implementation 2001 to 2005, to understand the context it also covers the period going back to 1997 when the groundwork was laid for the Government’s transitional reform programme and Vision 2020. 1.7 To guide the evaluation the TOR identifies a series of questions relating to the PRSP preparation and implementation process and subsequent impact. These questions form the basis of the evaluation framework (Figure 1). In addition the team identified a number of overarching questions that further define the scope of the evaluation:
How effectively have governmental processes for planning and budgeting, and specifically planning and budgeting at sector and sub-sector level, help to deliver on PRSP1 goals and objectives?
What kinds of institutional and political constraints – within and beyond government – have had a bearing on the PRSP process? To what extent have these constraints been material to the success or otherwise of PRSP implementation?
How have different development partners engaged with the PRSP approach in Rwanda? To what extent have expectations of changed donor behaviour been met? Are there specific lessons for donors on how they can support GoR more effectively in the next PRSP cycle?
Has PRSP1 helped to sharpen the focus on the MDGs? Was the focus in PRSP1 right in terms of policy priorities necessary to achieve long term poverty reduction and progress against Vision 2020?
Evaluation Framework 1.8 The evaluation framework structures the main issues/questions to be examined. Figure 1 presents a summary of these questions set against the key stages of the PRSP process.

17
Figure 1: Evaluation Framework
1.9 The evaluation applies the five standard evaluation criteria of the OECD/DAC – relevance, efficiency, effectiveness, impact and sustainability (Table 1). Table 1: Statement of Evaluation Criteria 3 Criteria OECD/DAC Guidelines Relevance The extent to which an activity is suited to the priorities and policies of
the target group, recipient and donor Efficiency Measures outputs – qualitative and quantitative - in relation to inputs.
Signifies use of the least costly resources possible in order to achieve the desired results
Effectiveness The extent to which an activity achieves its objectives Sustainability Measures whether the benefits of an activity or set of activities are likely
to continue after funding has been withdrawn Impact The positive and negative changes produced by an intervention, directly
or indirectly, intended or unintended 1.10 The Terms of Reference state that the evaluation should look at both the overall impact and implementation process of PRSP1. Assessing impact across such a wide canvass as the PRSP is difficult, partly because there are so many levels of impact to 3 OECD/DAC Criteria for Evaluating Development Assistance www.oecd.org/DAC/evaluation.
What was the fit between the PRSP1 and Rwanda’s long term PR needs?How were different stakeholders (e.g. civil society, Parliament) consulted during preparation? What was the effect of stakeholder consultations on the PRSP draft? How well coordinated were development partners inputs during preparation?Did PRSP1 clearly define, cost and prioritise public actions likely to reduce poverty?Did PRSP 1 have appropriate targets and indicators for poverty reduction as well as proposals for M&E?
PREPARATIONPRSP1
IMPLEMENTATION
MONITORING & EVALUATION
REPORTING
FEEDBACK & ADJUSTMENT
How did stakeholders translate PRSP1 priorities into concrete actions?Were responsibilities for implementation clearly articulated. How were they allocated?Did PRSP 1 effectively enhance resource mobilisation and a focus on priority sectors?Did development partners effectively align their financial assistance and policy conditionswith PRSP1?
To what extent has the budget implemented the aims of PRSP1?Was PRSP1 realistic in terms of the implementation time line?
To what extent were clear M&E mechanisms defined in the PRSP?Were those mechanisms feasible given country capacity? Were provisions for capacity enhancement made?Was sufficient information generated to allow effective M&E?
How useful have the APRs and M&E tools been in tracking implementation of PRSP1?To what extent have APRs been able to identify gaps in PRSP implementation? What has been the nature and effectiveness of the involvement of different stakeholders (Govt., civil society, Parliament) in the APR process?How far have development partners aligned demands for reporting with the APR cycle?
How effectively have M&E/reporting mechanisms been used to feedback into ongoing strategy implementation and adjustment?To what extent have financial, institutional and political constraints on government, civil society and other actors adversely affected the implementation of PRSP1? Have donor-government relations changed for the better as a result of the PRSP process?
PRSP2

18
MDGs
Vision 2020
PRSP 1
Policy Planning Finance Monitoring
Rural transformationAgric growth
Human DevelopmentGood Governance
Results
Priority Sectors
Local Government
Needs/povertydata
Externalresource flows
Policy Dialogue
Economic Infrastructure
APR/M&E
Civil society/Parliamentaryengagement
AlignmentHarmoniz-
ation
Civil Society
PrivateSector
assess – institutional, social and economic – and partly because of the absence of systematic M&E and poverty data.4 It is impossible, therefore, to come up with anything but the most rudimentary analysis of trajectories of change during the PRSP implementation period. 1.11 To systematise the evaluation of implementation progress the study draws on a simplified logic model of the PRSP approach5 identifying the main linkages between the ‘strategy’ and the implementation steps needed to make progress towards its main poverty reduction objectives (Figure 2). Testing the robustness of these links - between needs assessment and policy articulation, between policy, planning and monitoring; between external resource mobilisation and financial predictability; between public expenditure management and service delivery at central and local government levels – helps in making an overall assessment of the contribution of the PRSP approach to poverty policy making and outcomes in Rwanda. Figure 2: PRSP Logic Model
4 The first ECIV (ECIV1) – Living Standards and Conditions Survey – was completed in 2001. This provided the baseline data on income poverty for the PRSP. The second ECIV (ECIV2) is currently under preparation and not due for completion until October-December 2006, and therefore too late for this evaluation. Two interim CWIQ/QUIBB surveys provide various proxy measures of poverty but cannot be used to examine poverty trends during the PRSP period. 5 Reflecting the evolution of the PRSP concept as described earlier.

19
Evaluation methodology 1.12 A range of methods and information sources were utilised during the evaluation:
Document review and secondary data analysis Focus groups and evaluation workshops Individual interviews across government, amongst development partners and civil
society representatives Stakeholder survey (see Annex 3) 2 ‘rapid‘ field case studies
Four country visits were undertaken by some or all team members between late September and mid-December 2005. Three evaluation workshops were held with different stakeholder groups – Development Partners, NGOs/Civil Society and Government officials – in mid-November. Summaries of the main discussion points at the workshops are presented in Annex 3. The two rapid case studies were undertaken by Kigali-based consultants during late November-early December. Field interviews with district officials, farmers and workers on various HIMO projects were held in Gikongoro, Butare, Bugesera (Kigali-rurale) and Murambi (Umutara).

20
2. RWANDA’S DEVELOPMENT CONTEXT Overview 2.1 Ten years on from a devastating civil war and genocide, Rwanda’s progress as a nation has been remarkable. The present government came to power in 1994. Since then Rwanda’s leadership has been engaged in an extensive rebuilding of both the state and society involving the reconstruction of basic institutions, a return to security, the return and resettlement of refugees and provision of justice to the victims of the genocide, and a period of considerable macroeconomic and political stability. 2.2 Nevertheless, major political and development challenges remain. Poverty, which was rising well before 1994, remains high. Economic growth, after an initial post-conflict ‘bounce back’, struggles to reach the target necessary to impact on real per capita incomes. The economy remains dominated by a largely subsistence based agricultural sector facing enormous land pressures and productivity challenges. Human resource development and capacity challenges are severe. Security issues remain firmly on the domestic and international agenda. 2.3 The period after 1994 and up to 2003 when the new Constitution was introduced, represents a transition period in Rwanda; referring both to the graduation towards increased stability and security and the shift from short term emergency and reconstruction efforts towards medium term development planning and institutional development. During this time reviews of the poverty situation and the development of anti-poverty strategies tended to be prepared by development partners and their consultants, and were linked to specific project or programme interventions. The preparation of the PRSP during 2000-2 consequently marked an important stage in this transition in seeking (a) to develop a medium-term policy framework for poverty reduction, and (b) to ground it in a participatory and nationally led process. The fact that the PRSP in Rwanda is one element of a much wider and ongoing process of state building and reconciliation makes it something of a unique testing ground for the principles that underpin the PRSP approach. Poverty & Vulnerability Trends 2.4 GDP per capita and income poverty trends prior to 1994 show Rwanda already on a declining path. Between 1982 and 1992 per capita GDP declined 1.5 percent annually. In 1990 48 percent of the population were considered absolutely poor (50 percent in rural areas, 19 percent in urban areas). The political and economic trajectory was mainly downhill. Events in 1994 drastically worsened this trend with a recorded 50 percent drop in GDP per capita and an increase in the incidence of income poverty to 78 percent (82 percent rural, 28 percent urban) (Table 2). Table 2: Income Poverty Data (Percentage below the Poverty Line)
1990
1994
1999/2000 Poverty incidence 48 78 60 Rural 50 82 66 Urban 19 28 14 Gini coefficient 0.27 (1985) 0.46 Source: Various
21
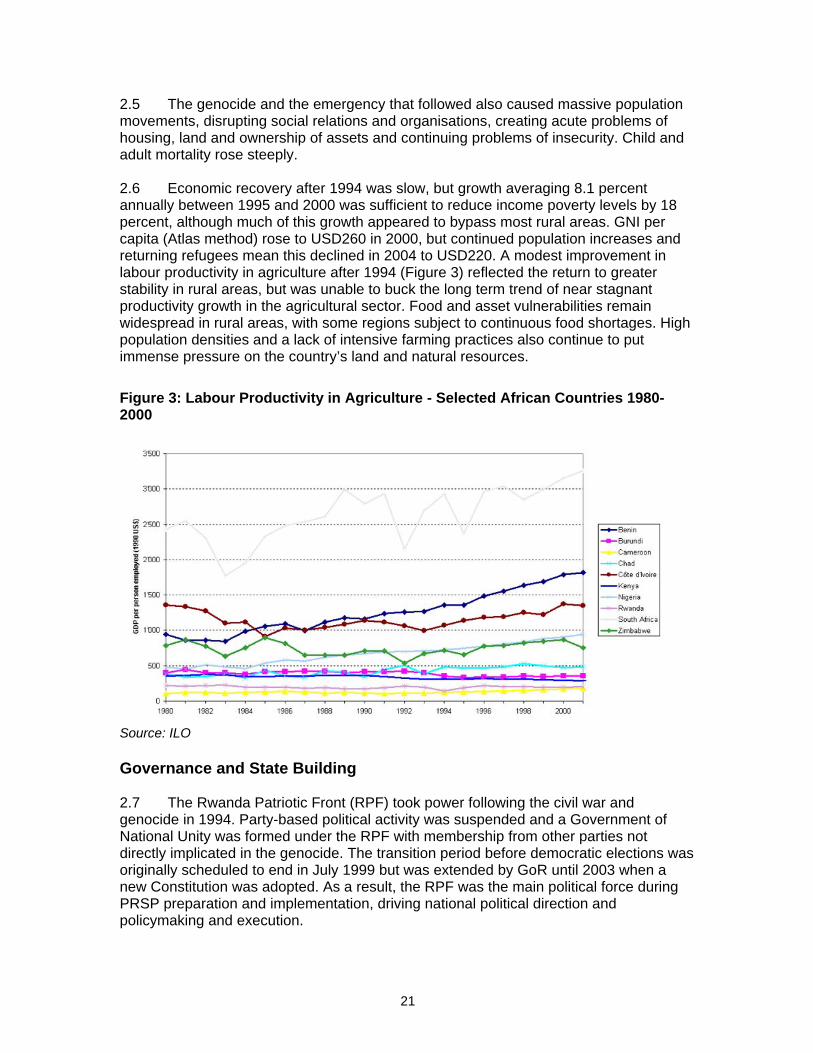
2.5 The genocide and the emergency that followed also caused massive population movements, disrupting social relations and organisations, creating acute problems of housing, land and ownership of assets and continuing problems of insecurity. Child and adult mortality rose steeply. 2.6 Economic recovery after 1994 was slow, but growth averaging 8.1 percent annually between 1995 and 2000 was sufficient to reduce income poverty levels by 18 percent, although much of this growth appeared to bypass most rural areas. GNI per capita (Atlas method) rose to USD260 in 2000, but continued population increases and returning refugees mean this declined in 2004 to USD220. A modest improvement in labour productivity in agriculture after 1994 (Figure 3) reflected the return to greater stability in rural areas, but was unable to buck the long term trend of near stagnant productivity growth in the agricultural sector. Food and asset vulnerabilities remain widespread in rural areas, with some regions subject to continuous food shortages. High population densities and a lack of intensive farming practices also continue to put immense pressure on the country’s land and natural resources. Figure 3: Labour Productivity in Agriculture - Selected African Countries 1980-2000
Source: ILO Governance and State Building 2.7 The Rwanda Patriotic Front (RPF) took power following the civil war and genocide in 1994. Party-based political activity was suspended and a Government of National Unity was formed under the RPF with membership from other parties not directly implicated in the genocide. The transition period before democratic elections was originally scheduled to end in July 1999 but was extended by GoR until 2003 when a new Constitution was adopted. As a result, the RPF was the main political force during PRSP preparation and implementation, driving national political direction and policymaking and execution.

22
2.8 In 1999 the Government’s Vision 2020 was prepared drawing on an extensive national consultative process. Preparation of Vision 2020 was an exercise in national reconstruction in which external influences were limited and, as a result, it continues to be highly influential in Government (Box 1). Vision 2020 sets the framework and context for subsequent PRSP preparation. Box 1: Vision 2020 The major aspiration of Vision 2020 is to transform Rwanda’s economy into a middle income country (per capita income of about 900 USD per year, from 290 USD today), requiring an annual growth rate of at least 7%. The Vision states that to achieve this Rwanda must, in the short run, ensure macro-stability and wealth creation to reduce aid dependency; in the medium term the objective is transforming from an agricultural to a knowledge-based economy, while the long term goal is creating a middle-class and fostering entrepreneurship capable of delivering a “modern, strong and united nation, proud of its fundamental values, politically stable and without discrimination amongst its citizens.” The Vision revolves around six pillars which later find expression in the PRSP:
Reconstruction of the nation and its social capital anchored on good governance, underpinned by a capable state;
Transformation of agriculture into a productive, high value, market oriented sector, with forward linkages to other sectors;
Development of an efficient private sector spearheaded by competitiveness and entrepreneurship;
Comprehensive human resources development, encompassing education, health, and ICT skills aimed at the public sector, private sector and civil society. To be integrated with demographic, health and gender issues;
Infrastructural development, entailing improved transport links, energy and water supplies and ICT networks;
Promotion of regional economic integration and cooperation. 2.9 In the aftermath of the genocide and the period leading up to PRSP preparation, international monitoring reports evaluated Rwanda’s record on human rights as poor. Concerns included the slow pace of genocide trials and conditions of detention, restrictions on freedom of the press, association and assembly. During this time much of GoR’s focus was on stabilising the country and creating the basis for future social and political cohesion. The implicit governance model was one of political and administrative decentralisation, empowerment of local communities and service delivery improvements. In 2000, just before the PRSP was prepared, GoR issued a decentralisation policy to give effect to this ‘transformative’ vision. 2.10 The draft Constitution approved in a referendum in May 2003 for the first time provided for higher levels of representation to previously marginalised groups such as women, youth and disabled. It also regulated the composition of power by limiting the majority party in Parliament to no more than 50 percent of the cabinet seats. The President, Prime Minister, President of Senate and Speaker of the lower house are from different parties. The implication is that the potential for domination by one identity group is limited by the Constitution. In 2003, party-based Parliamentary and Presidential elections were held heralding a new chapter in Rwanda’s post-conflict transition. 2.11 In understanding the context for the PRSP it is important to recognise that the transition following 1994 was first and foremost a political transition. A review of the early phases of the PRSP process (Mutebi, Stone and Thin 2003) stresses the importance of

23
seeing the value-added of the PRSP in this wider context: “The prospects for the PRS process in Rwanda to institutionalise poverty reduction policies, programmes, practices and monitoring systems are inextricably interlinked with the national unity and reconciliation process and the decentralisation process. Success in any one will depend on institutionalisation of the others…” (p231). They further conclude that in Rwanda these prospects (for PRSP institutionalisation) need to be set in the context of the political traditions of the country and how these are intended to change in the future to bring about a new democratic system of governance. The impact that these issues have had on the PRSP, and vice versa, remains highly pertinent and forms an important theme through the evaluation. Other National Planning Instruments 2.12 In 1994 the newly installed government issued a Declaration of Principles setting out medium term principles for social, political and economic development. A further Framework for Economic Policies 1998-2000 was agreed with the World Bank and IMF setting out strategies for making the transition from emergency to development. In 1999 a three year plan of action was prepared to manage the introduction and development of a Medium Term Expenditure Framework from 2000-2002. 2.13 Additional planning instruments include a National Investment Strategy prepared in 2003 as a basis for the Public Investment Plan (PIP) managed at that time by CEPEX. Responsibility for the development budget has since transferred to the Budget Department at MINECOFIN in a first step to removing administrative impediments to aligning budgets and strategies. Ministries also produce annual actions plans for the Prime Ministers Office. 6 The links between these action plans, sector strategies and the PRSP remain unclear to the evaluation team. Indications picked up during the evaluation are that GoR is also planning a 5 year National Development Plan to replace the NIS/PIP but still focusing exclusively on investment. What this might mean in the context of a second phase PRSP is discussed in the final chapter. Aid Flows 2.14 Rwanda is heavily aid dependent. In 1990 Rwanda received in the region of USD300-350 million of external assistance annually. This rose to just over USD700 million for the two years immediately following the genocide as donors provided increasing emergency and reconstruction assistance.7 The scale of the emergency was such that in 1994 aid flows were equivalent to almost 100 percent of Rwanda’s GNI. As Rwanda exited from its emergency phase, so aid flows began to drop back to pre-genocide levels with a much greater emphasis on development aid (Figure 4)
6 These appear to be linked to the monitoring of governmental commitments made during the 2003 elections but there is limited firm evidence of this. 7 All data from OECD/DAC aid statistics database.

24
Figure 4: Total Aid Flows 1990-2004
0
100
200
300
400
500
600
700
800
1990
1991
1992
1993
1994
1995
1996
1997
1998
1999
2000
2001
2002
2003
2004
USD
Mill
ions
0
20
40
60
80
100
120
Perc
ent Total
Emergency Aid
Aid as % of GNI
Source: OECD/DAC International Development Statistics www.oecd.org/dataoecd 2.15 The extent of Rwanda’s continued aid dependence is evident in Table 3. Aid continues to average around 20-21 percent of GNI, still a relatively high level when compared to the SSA and LIC average. Aid is also equivalent to 69 percent of total government spending, 126 percent of total domestic revenue and 109 percent of capital formation, the latter averaging 32 percent for SSA as a whole. In per capita terms, Rwanda is heavily aided compared with the average for SSA countries and all Low Income Countries (LICs), although comparable with other PRSP countries in the region. Table 3: Rwanda's Aid Dependence 2002-2003 Rwanda SSA LICs Mozambique
* Tanzania* Uganda*
Aid per capita (USD) 44 28 12 55 47 38 Aid as share of GNI (%) 21 6 3 Aid as share of total domestic revenue (%)
126
Aid as a share of all expenditures (%)
69
Aid as a share of capital formation
109 32 13
Aid as a share of imports 77 15 10 *Figures for 2003. Source: Killick (2005) Promoting a Third Phase in Rwanda-Donor Relations; World Development Indicators 2005. 2.16 The figures confirm the important role that aid plays in Rwanda and, consequently, how vital it is that GoR maximises the effectiveness of that aid for growth and poverty reduction. The PRSP has a crucial role to play here, and its role as an instrument in assisting the mobilisation and coordination of aid for long term poverty reduction is a central focus of this evaluation.
25
3. MAIN FINDINGS – PRIORITY AREAS AND CROSS CUTTING ISSUES Relevance 3.1 Relevance is examined through an assessment of the ‘fit’ or degree of alignment between the proposed poverty reduction strategy and the main development challenges facing Rwanda; the quality of the diagnosis underpinning the strategy, and the quality of the design of public actions to take it forward. 3.2 In terms of alignment with Rwanda’s main development challenges, the PRSP is judged to be broadly satisfactory. The document provides a good summary of the major structural problems facing the country and openly acknowledges the complex legacy of the genocide on the country’s future development prospects. The poverty profile was the most comprehensive at the time drawing on a cluster of important quantitative surveys - Household Living Conditions Survey (ECIV) 2001, Demographic and Health Survey (DHS) 2000, Rwanda’s first Core Welfare Indicators Questionnaire (CWIQ) 2001 and a Public Expenditure Tracking Survey 2001 - and on several innovative processes including the first participatory National Poverty Assessment, a pilot exercise in community action planning - ubudehe my kurwanya ubukene - and a series of consultation and ‘under the tree meetings’ directly with citizens. 3.3 The main correlates of poverty and the key characteristics of the poor are well described in the PRSP. The poverty profile points to important differences in income poverty between urban and rural areas and between some rural areas, pointing to a rise in inequality since the mid-1980s. Land holding and household size are major factors associated with poverty. Female headed households are more likely to be poor than male-headed ones. Ill health is highly significant as are long distances to water sources, the lack of safe water and sanitation, low utilisation of health services and damaged or poorly maintained infrastructure. Time use studies point to heavy domestic labour burdens amongst poor women and widespread underemployment amongst young men in rural areas. Weak governance is identified as a contributory factor to both poverty and ongoing problems of insecurity and conflict. Particular problems include the destruction of large swathes of capacity across state and non-state institutions and the overcrowding of cachots, prisons and of the courts post-genocide. 3.4 While the poverty analysis is clearly value-adding, relatively little analysis is provided, of the specific risks and vulnerabilities facing different groups in different localities in Rwanda, whether due to remoteness, exogenous shocks, deteriorating services or weak governance. The damage to Rwanda’s social fabric arising from the civil war and genocide and its impact on poverty is acknowledged in terms of returning refugees, the need to re-settle conflict-affected groups and to ensure justice for victims of the genocide. The main presentation in the PRSP, nevertheless, is one of generalised poverty with a limited focus on poverty dynamics, changing vulnerabilities or how the main drivers of conflict and poverty are intertwined. This in part is due to a lack of comparable time series data, but the qualitative data is also underutilised in helping to tease out factors that contribute to both chronic poverty and vulnerability, and in linking them to possible public actions.

26
3.5 The Strategy identifies six priority areas supported by eight cross cutting themes and eleven core programmes (Table 4). The main elements of the strategy are consistent with the development challenges facing Rwanda. Table 4: Main Elements of the Strategy
Priority Areas
Cross Cutting Themes Core Programmes
Rural development and agricultural transformation
Technology Intensifying small scale agriculture and livestock
Human development Gender Labour intensive public works Economic infrastructure Environment Malaria, HIV/AIDs prevention, health
mutuelles and animaturs Governance Imidugudu (grouped settlement) Primary school textbooks Private sector development HIV/AIDs Economic infrastructure including
rural roads and rural electrification Institutional capacity building Employment Skills development Capacity building Adult literacy Inequality Gacaca Demobilisation and reintegration Shelter and imidugudu Development of sector strategies Agricultural transformation and rural development 3.6 With around 90 percent of the active population engaged in the rural economy and an agricultural sector contributing around 45 percent of the national income, a primary focus on agricultural and rural development is highly relevant. Background analysis commissioned for the PRSP (Mellor 2002a) confirms the challenges presented by low and falling agricultural productivity aggravated by land pressure, heavily depleted soils and past policy failures. The analysis reinforces the potential for agricultural growth to not only expand agricultural incomes, but to also stimulate employment and income growth in the linked non-farm sector. The study posits a target growth rate for the agricultural sector of 5.3 percent, with over 90 percent of that growth coming from 5 commodity sets – bananas, fruit/vegetables, potatoes, tea/coffee and livestock – supported by a major increase in the use of chemical and organic fertilisers8 and more intensive farming methods. 3.7 The PRSP itself makes a good deal of this analysis emphasising agriculture as the primary engine of growth and a twin-track approach of intensification and commercialisation. The strategy identifies 5 target crops for enhanced public support –rice, maize, potatoes, soya and beans, in addition to the traditional cash crops, tea and coffee.9 The approach emphasises the importance of increased use of traditional and modern inputs (fertilisers in particular) for value-addition plus a range of public actions to create the right conditions for future investment and growth – research, extension, input
8 Mellor (2002a) estimates that 75 percent of the agricultural target could be realised with increased fertiliser use alone. Swamp reclamation could add another 9 percent with intensive farming methods accounting for the remainder. 9 The inclusion of rice as a target crop (apparently instead of bananas) is interesting in the light of Mellor’s analysis and the longstanding work of the MSU/MINAGRI Food Security Research Project pointing to the importance of bananas for food security as well as cash income in rural areas, and more recent concerns about the size of the market for domestically produced rice.

27
development, finance, infrastructure, marketing, livestock development, cash crop development and sector planning. 3.8 Faced with the challenge of addressing rural poverty where more than half of rural households are subsisting on less than 0.5 hectares and the urgent need to re-absorb at least half a million unemployed rural people among whom are demobilised soldiers, militias and released detainees awaiting judgement from grass roots Gacaca courts, the PRSP places important emphasis on the need to expand non-agricultural jobs through a programme of labour intensive public works. The main action is to prepare modalities for the implementation of a ‘substantial programme of rural public works’ with implementation expected to start during 2002. 3.9 Most obviously missing from the PRSP, and now being addressed by the Integrated Framework,10 is an analysis of regional and global pressures affecting the future of Rwanda’s fragile rural sector. Commodity price fluctuations, global value chains and climate change are creating a difficult setting for agricultural development, particularly for small scale producers. The implication is that what worked well in the past may not continue to do so in the future, but the PRSP conveys relatively little in the way of new thinking or innovation. There is also no real differentiation between high and low potential agricultural areas or how they link to Rwanda’s poorest and most at-risk areas and population groups. The possibility that a strategy of commercialisation may not reach all rural households is not fully considered. The role of food staples as the bedrock of household food security (and reasons for their recent decline) appears underplayed (Box 2). The strategy is weak on the division of public and private sector responsibilities in the sector and on potential synergies between public spending, taxation and regulatory policy in stimulating agricultural and, more crucially, broad based rural sector growth. 3.10 The list of public actions in agriculture is understandably broad given the extensive challenges facing the sector, but it lacks real prioritisation or a framework linking priorities to what is feasible over the short to medium term given institutional capacity and resource constraints. Actions listed in the policy matrix are not linked to clear or feasible targets or clearly justified in terms of their expected impact on the poor – a function at the time of the absence of a fully comprehensive strategy for agriculture. In fact, since the PRSP document was published, the policy matrix for agriculture has been a moving target making it difficult to assess progress other than at very broad levels. Progress made in developing a revised sector strategy for agriculture (one of the initial milestones in the PRS policy matrix) is returned to in the section on efficiency and effectiveness.
10 The work of the Integrated Framework and the Diagnostic Trade Integration Study will be a crucial resource for PRS2.

28
Box 2: Income and Nutritional Outcomes in Rural Areas 1990-2000 McKay and Loveridge (2005) revisit Revenue and Expenditure data for 1990, the ECIV 2000 and various agricultural production surveys and find that overall the value of agricultural production fell between 1990 and 2000. The share of agricultural production consumed at household level also increased significantly. They also find that production patterns changed over the period with a sharp reduction in the value of coffee output and an increase in the shares of sweet potatoes, irish potatoes, beans and cassava. Reduced agricultural production was largely compensated for by an increase in non-agricultural wage income. Data disaggregation shows a highly differentiated pattern of change between and within income groups, with poorer groups becoming worse-off in income terms while the richest groups increased their incomes - due mainly to engagement in non-agricultural wage employment. McKay and Loveridge posit that the three poorest groups (70 percent of rural households) would be unlikely to derive much, if any, benefit from agricultural commercialisation given that they have withdrawn from the market and are mostly cultivating land areas too small to be able to produce a surplus. Importantly the study also finds that it was precisely this withdrawal from the market that counts for declining child malnutrition over the period, against the odds! The study concludes “Measures to increase the productivity – and sustainability – of Rwanda’s small scale agriculture are critical but there is a clear risk that commercialisation by itself could further increase rural inequality (a process that already seems to be happening).” This puts a premium on increased agricultural productivity for most categories of smallholders, both to help them eat better from their own production and face lower food prices for what they purchase in the market, as well as to raise incomes for those farmers able to take advantage of commercial market opportunities. Source: McKay, A. Loveridge, S. (2005) Income and Nutritional Outcomes in Rwanda’s Rural Areas 1990 and 2000. USAID Office of Sustainable Development, Policy Synthesis no 74. Human development 3.11 The human development pillar of the PRSP is outlined under fourteen thematic headings spanning four sectors: health; education; water and sanitation; and housing. These priorities are supported by an analysis of the human development challenge in Rwanda. Overall, both the human development policies and the diagnosis underlying them are judged to be relevant to the main development challenges confronting Rwanda. 3.12 Clear links are drawn between the underlying diagnosis and the design of the policy response, but with some weaknesses:
There is a lack of information in the human development pillar on patterns of access by different groups of the population to basic services. The analysis treats service users as a whole and does not clearly differentiate needs/obstacles by income group. Equity issues in general are underplayed.
The analysis of the housing and water and sanitation (watsan) sectors is notably weaker than that for education and health. These weaknesses are partly the product of weak baseline data on the nature and scale of challenges in these areas, but also reflect the lack of an integrated approach to human settlements. For example, few attempts are made to trace recent, and anticipate future, patterns of urbanisation, or to analyse existing settlement patterns and anticipate potential priorities for rural and urban land planning and management. As a result, the housing and watsan challenge is not placed in a wider context which would highlight pertinent links between the two.
3.13 Objectives and actions are generally well articulated, though with some differences in quality between sectors. The education section is most clearly defined,
29
with health a close second, because the PRSP was able to draw on existing or finalised sector policies in both areas. The watsan and housing sections are weaker in presentation, with some internal inconsistencies appearing between the text of the main document and the matrix of policy actions attached as an annex. 3.14 Some design features are missing, but interviews suggest this was either inevitable given the tight deadline, or deliberate, given the plan to produce sector strategic plans and operational plans later. These include:
Limited baseline information and analysis is in evidence as a basis for policy-making, especially on the watsan and housing situation.
Links to the MDGs are made (e.g. eliminating gender disparities in education by 2005, and prioritising science and technology) but they are not used as the basis for identifying long term operational targets or timelines.
Very broad timelines are offered in the PRSP, with many actions only described as “ongoing” or to be completed in “2002/3”.
Operational implications are not described in detail (e.g. “some urban infrastructure will be rehabilitated during 2003-05”).
Detailed costing linked to each objective or action are missing, though an outline of the recurrent and general budgets for each government department and units within them is provided.
3.15 Most significantly, the prioritisation by poverty impact within sectors is weak. Although a shortlist of objectives and actions for each sector of the human development pillar is presented, it is not clear which of these is likely to make the most significant contribution to poverty reduction. Although basic education is clearly identified as the top priority, there is no further prioritisation, leaving the potential importance of areas such as tertiary education unclear. And some existing policies, such as the levying of user fees for health services goes unanalysed in terms of its impact on equity in access to healthcare. Governance and Institutional Capacity Building 3.16 One of the more distinctive characteristics of the Rwanda PRSP is its link to a more fundamental transformational agenda stated in Vision 2020 in terms of the ‘kind of nation’ Rwanda wants to be. The governance priorities and capacity building issues therefore largely reflect a continuity in thinking guided by pre-existing commitments to recovery and reconstruction including:
The 1993 Arusha Peace Accords (the political transition, establishing of key commissions and demobilisation and reintegration)
The 1998/9 national reflections at Village Urugwiro sponsored by the Presidency (gacaca and anti-corruption initiatives)
The extensive consultations of the National Unity and Reconciliation Commission (NURC)
The process to bring to an end the political transition period requiring a new Constitution.
3.17 In the context of the destruction of state and non-state institutions, the emphasis in the PRSP on improved governance and institutional capacity building is highly relevant both in the public goods sense and as a pre-requisite for ensuring that state institutions are able to tackle poverty effectively. Less clear, however, is how closely these priorities reflect the analysis in the National Poverty Assessment or the poverty

30
profile. Governance and capacity priorities do not emerge clearly from these exercises with the exception of some references to theft and security issues. Governance priorities are also not articulated in specifically pro-poor terms, for example, the rule of law objectives do not include the aim of enhancing the accessibility of justice for poor groups. What this may illustrate is a disconnect between the vision of Rwanda’s post-genocide political elite, which is encapsulated in Vision 2020 (and to some extent in the political demands placed on GoR by the international community), and the more technical, pro-poor policy agenda that was expected as the basis for the PRSP (Box 3). In fact what appears to have happened in Rwanda is something of a compromise between these two, with the PRSP dealing quite openly with key elements of the political governance agenda (more so than many PRSPs) but with some fairly significant gaps in the quality and depth of treatment of some issues, particularly around democratisation, human rights and security.11 Box 3: Identifying Rwanda's Governance Challenges An important demonstration of the complex relationship between GoR and donors regarding the PRSP and governance objectives can be seen in the events surrounding the Governance Conference in November 2001. The conference, organised with UNDP support, was designed to assist GoR develop a national governance framework for future donor funding. In his opening address the President laid out his vision for governance reform in Rwanda committing his government to ‘continue to lay the foundation for democratisation’ and asking development partners to support the democratisation process through support for decentralisation, the drafting of the constitution, elections and other transitional efforts underway. The conference was held as a closed event with few international participants. The relationship between the conference and the PRSP process remains unclear. Development partners hoped that it would inform the governance content of the PRSP and that the resulting report would be used as a more detailed strategic framework. However while there is reference to the conference in the PRSP, the 2002 Strategic Framework and 2003 programme document based on it have not been linked to PRSP processes. Few stakeholders seem clear about the relationship between the two. 3.18 The main components of the governance and capacity building agenda in the PRSP are security and demobilisation; national reconciliation; criminal justice and gacaca; constitutional reform; decentralisation and ubudehe; civil service reform and accountability and transparency. Capacity development is treated as cross cutting. 3.19 In all cases the policy priorities can be considered relevant and in many cases as important continuation of a political commitment to establish a new nation based on social inclusion. As discussed further in the section on effectiveness, however, not all the policy priorities were realistic, consistent or monitorable, for example, activities surrounding national reconciliation had no clear timelines attached, no targets or monitoring indicators; similarly with human rights. Several policy areas, including national reconciliation, human rights and constitutional reform actually revolved around the ongoing activities of a specific institution (mostly Arusha Accord based commissions) rather than of a wider reform strategy, which has subsequently raised questions about the degree of integration between these activities and the core PRSP. 12
11 As noted in World Bank 2005, despite recognition of the importance of the conflict to Rwanda’s poverty situation there is limited systematic conflict analysis and limited examination of how factors of conflict and poverty drive each other. 12 For example the PRSP Annual Progress Reports do not fully report on the work of the various independent commissions (although these commissions do report separately to Parliament).

31
3.20 Two of the most important planks of the government’s transformational agenda and of the PRSP are the broadening of grassroots participation and government responsiveness through decentralisation and human resource development and capacity building. Relevance here is without doubt and of the utmost importance to the entire poverty reduction strategy. Both areas emerge from an analysis of the political causes of the genocide and grassroots consultations linked to the Vision and subsequent governance framework. They are a central element of the new vision of the state which is at the core of the PRSP.
3.21 Prior to the PRSP preparation, the government had already started to replace appointed representatives by locally elected representatives on a non-party basis at the cell and district levels in 1999 and 2001. By the time the PRSP was finalised in 2002, GoR had already published its decentralisation policy. The associated priority actions focus on the need to establish the structure and systems to implement administrative and fiscal decentralisation (rather than further political decentralisation). Attention is put on the need to build district level capacity. Ubudehe, a particular innovation of the PRSP consultation process, is also identified as a separate priority area, with ambitious associated actions including a nationwide roll out by the end of 2002. 3.22 Human resource development and capacity building is another highly relevant policy priority, serving as the foundation to build public and private capacity to enable the implementation of the PRSP. This is also a priority area receiving particular Presidential attention. The PRSP is, however, silent on the strategy to be adopted, and its close relationship to public service reform. In fact it is only in the first APR that a more fully developed set of activities is presented, but still without any clear outcome indicators. Private Sector Development and Economic Infrastructure 3.23 Fairly high rates of economic growth during the late 1990s reflected a return to economic and political stability following the events of 1994, but deep structural problems remained including high transport, energy and communication costs linked to a weak and failing infrastructure to which the majority of the population had limited access; low private investment; an excess supply of low skilled labour; low levels of rural monetisation; a narrow financial sector; and, a narrow revenue base for future public investment. 3.24 The PRSP places highest priority on the need to stimulate agricultural growth and sees private enterprise as playing a key role in the transformation of the sector. The main poverty benefits are identified as coming through commercialisation and the ensuing demand for agricultural and non-agricultural goods and services in rural areas, and through non-farm employment creation. Over time, however, the PRSP recognises the need to diversify beyond primary agricultural commodities to find more sustaining engines of growth which include: agro-processing, garment exports, commercial and ICT services (including re-exports), tourism, mining and the export of skills within the region. 3.25 To stimulate growth and to build an enabling environment for PSD, the PRSP prioritises a number of key areas including investment in economic infrastructure; investment promotion, financial and commercial legal reform; privatisation and specific measures to stimulate growth in key sectors, including mining, tourism, artisanal activities and ICT.
32
3.26 The relevance of prioritising infrastructure development is undeniable. Access to commerce and markets was a significant priority in the NPA. Given the scale of the problem, the PRSP places its highest priority on road and bridge maintenance, with an emphasis on labour intensive methods, and on repairing and upgrading the areas of the rural road network in most need. The policy matrix also commits to a transport sector investment strategy and action plan for medium to long term development in the sector. Less clear is how the GoR envisages stimulating transport services in rural areas, although there is mention of a public/private partnership to reinforce the public transport network, and how it plans to monitor improvements to the network given devolution of responsibility to local authorities. 3.27 Other key aspects of the strategy for improved economic infrastructure include improved energy supplies to the formal sector (the price of energy in Rwanda is very high by regional standards); rural electrification (Rwanda’s per capita consumption of electricity is among the lowest in the world and almost entirely in the main cities) and improved communications (telephone density at the time of the PRSP was 1.1 percent with only one post office for every 333,000 inhabitants). The case for improved energy supply and access is clear, although the cost-benefit of a rapid move to rural electrification within the time frame of the PRSP is not assessed. 3.28 While undoubtedly a priority, the focus on private sector development in the PRSP is rather overshadowed by the other priority areas and is unclear on what would constitute an integrated strategy to stimulate broad-based, and therefore poverty reducing, growth. The main areas of action focus on investment promotion and the creation of a one-stop shop for foreign and domestic investors but without a clear commitment at this stage to a broad-based export promotion strategy. Trade issues are sorely underplayed. Financial sector reform, although given prominence, does not focus directly on the alarmingly low levels of bank credit used to finance activities in the agricultural sector or to the importance of micro-finance opportunities for poor producers. The policy matrix focuses largely on privatisation – although no clear targets are specified – and on discrete actions for specific sectors but no clear overarching strategy for trade or private sector development. Cross Cutting Issues 3.29 The PRSP identifies eight cross-cutting issues that have implications for all sectors/priority areas covered by the strategy. The selection of cross-cutting issues closely resonates with the analysis of Rwanda’s development challenges. Technology, employment and environment are identified as structural challenges, while HIV/AIDS is seen as part of the legacy of genocide. The poverty profile highlights problems of rising inequality while the NPA identifies employment, HIV/AIDS and settlement as priority problems. 3.30 Each cross cutting issue (CCI) has its own rationale, objectives and priorities which are handled with varying degrees of specificity. Issues, such as gender, are clearly linked to concrete areas of action (drawing as it does on the Gender Action Plan 2000) and backed by a clear institutional mandate (in this case MIGEPROF). An audit of gender in PRSPs undertaken in 2003 cites the Rwandan PRSP has having a significant
33
focus on gender compared to other first phase PRSPs (Zuckerman et al 2003).13 It commends the poverty analysis and positively assesses the treatment of gender issues in the areas of HIV/AIDS and reproductive health, education and decision making. It is less positive, however, about how gender is integrated into the growth and economic development components of the PRSP. The treatment of gender as a cross-cutting issue is also hotly debated. Opponents argue that placing gender as a CCI renders it vague, marginalises it politically and as a result increases the risk that it will fall off everyone’s agenda. Proponents, on the other hand, argue that gender is the quintessential CCI central to all other areas of development. In fact the central mission of MIGEPROF was to assist sector ministries in ensuring that the objectives of the National Gender Policy and later the PRSP were fully mainstreamed into sectoral plans and budgets. 3.31 Other CCIs, such as imidugudu, inequality and capacity building (somewhat confusingly because later it becomes a stand alone priority area) are largely undeveloped in the PRSP without specific goals or targets identified, or a clear indication of what is required institutionally to take them forward. 3.32 Although the range of CCIs is consistent with the picture of Rwanda’s development challenges, the number of issues selected seems disproportionate given weak capacities at central and local levels, and the uncertainties of the resource envelope. Only a few commitments relating to CCIs actually appear in the initial policy matrix. There is also little information on how cross cutting actions relate to sector priorities or any specific attempt to cost such actions, although subsequent attempts have been made in environment and gender. 3.33 All PRSPs face the challenge of incorporating cross-sectoral themes and issues into strategies that revolve around sectors and contexts unfamiliar with horizontal working. The Rwandan PRSP probably makes as good attempt as any to do this, particularly on gender issues, but in terms of the evaluation criteria the assessment is still less than satisfactory.
13 Although there were a few core NGOs involved in the PRSP consultations (mainly Pro-Femme, CCOAIB, Hagaruka etc), it was felt that the process was not particularly participatory (the Constitution and Vision 2020 processes were seen as being more consultative). However, the engendering of the PRSP was substantially assisted by an international technical advisor funded by donors.

34
Efficiency 3.34 In terms of efficiency the flow of funds to priority areas and decentralised levels is generally considered good but major weaknesses still exist in procurement, contracting and value-for-money.14 3.35 Respondents universally stressed how much they appreciated the advisory and technical support from MINECOFIN aimed at improving the quality of their plans and budgets, but some also suggested that greater effort is needed to integrate the two processes. This is exemplified through the many different types of progress report, which make assessing efficiency in the delivery of PRSP-related outputs very difficult. Physical progress is reported on through APRs, joint sector reviews and implementation reports on annual action plans produced for the Prime Minister’s office report. Financial progress is reported on through budget execution reports and PERs. While one set reports on progress against PRS objectives, the other reports on progress against MTEF and budget lines, but the two are not always easy to reconcile. Different sets of people within ministries, the donor and NGO communities are involved in each type of review, making it difficult for each to gain an overview of implementation progress. For example, some interviewees complained that clusters are unable to address the “big picture” question of the extent to which allocations are pro-poor and are instead confined to addressing lower level, technical questions. 3.36 Further efficiency concerns include weak prioritisation by poverty impact within sectors which has permitted significant resource allocation decisions which are not obviously pro-poor. For example, higher education has taken a greater share of the education budget than originally envisaged for the last two years, while resources for primary education have been insufficient to implement the programme envisaged in the sector plan, let alone address the unforeseen effects of the access shock after primary education became free and compulsory. In health, more than 1 billion FRw extra went to tertiary health services in 2004 while primary health received 1.5 billion FRw less than planned. Off-budget vertical financing for HIV/AIDS, TB and malaria moved the health budget 111% over the ceiling amount, while leaving the recurrent costs of basic health services under funded.15 3.37 Donor transactions costs also hamper efficiency improvements. The preponderance of small projects, weakly coordinated TA and consultancies, multiple donor missions and vertical financing all pose a significant burden on GoR. 3.38 Efficiency concerns are central to new policy design across GoR, but still at the early stages of implementation. Key examples include ongoing improvements to public financial management; the introduction of the National Tender Board to manage public procurement; the new policy to reduce the unit costs of higher education by introducing
14 The recent Country Financial and Accountability Assessment notes that public expenditure management is more or less functional in terms of the allocation and flow of funds but major concerns remain in terms of the efficient use of resources – particularly value for money aggravated by continued capacity shortfalls, and in some sectors donors slow to change their behaviour. 15 The concern here is that the health sector MTEF ceiling is effectively reached without addressing critical basic health services.

35
formula funding, reducing annual student loans over time, and widening the resource base by encouraging public higher learning institutions to seek private sector funding; and, the new performance based contracting of health centres intended to reduce waste and improve the links between inputs and results (Box 4). Box 4: Decentralisation and Efficiency in Health and Education Decentralisation appears to be associated with significant efficiency gains, but is still at an early stage. Interviewees stressed the continued prevalence of classic problems of centralised planning e.g. poor awareness of needs of local communities at the centre; tendency to see government role as “sensitising” the population to policies deemed appropriate for them, even where evidence suggested people were rejecting those policies as inappropriate to their needs e.g. imidugudu. Sector plans prepared at district level are often inadequately consolidated and analysed at province or central level, making it difficult to ascertain expenditure needs. Much procurement is still done at the central level. Efforts to improve efficiency include:
the new capitation grant for primary education introduced in 2004, and increased from 300FRw to 1000FRw in 2005 with plans for further increases. The grant is transferred directly from central government to primary schools, giving them purchasing power to make (in principle) more efficient expenditure choices. Decentralised expenditures like this are demonstrably more likely to be spent when committed than more centralised expenditures, but overall devolution of funding in education remains limited at present.
Piloting of performance-based financing for health centres in Butare and Cyangugu. MINISANTE is also planning to move towards direct transfers to hospitals as block grants, although this will take time.
Effectiveness 3.39 Effectiveness has many dimensions to it but in terms of the sheer scale of the reform effort in recent years overall performance is judged to be moderate to satisfactory. The performance record across sectors and cross-cutting themes is far from uniform, however. Agricultural Transformation and Rural Development 3.40 Notwithstanding the primacy of the agricultural transformation agenda in the PRSP document itself, the lack of a complementary sector strategy for much of the early PRSP period has contributed to significant delays in implementation of the PRS agenda in the agriculture and rural sector.16 3.41 Most recently, however, there are important signs of progress. In 2004 GoR finalised its National Agricultural Policy (NAP) and Agricultural Strategy (PSTA) both of which are intended to better align with PRSP1 and Vision2020. The goal of NAP is to contribute to national economic growth, improve food security and nutritional status and increase revenues of rural households. The PSTA further operationalises the policy with a focus on sustainable poverty reduction and economic growth through improved productivity, creation of added value, diversification and preservation of natural resources. There are four programme areas: (i) intensification and development of
16 This absence of a clear strategy and the need to focus on policy measures to reform the agricultural sector before shifting to a more complex rural sector strategy influenced the World Bank’s decision not to include preparation of a rural strategy as a trigger in its first Poverty Reduction Strategy Credit Operation in 2004.

36
sustainable production systems; (ii) support to farmer professionalisation and organisation; (iii) promotion of commodity chain and agribusiness development, and (iv) institutional development. Each programme areas is further divided into 17 activities (Box 5). Box 5: PSTA Programmes and Sub-Programmes The PSTA is organised into four main programmes and 17 sub-programmes. These are: Programme 1: Intensification and Development of Sustainable Production Systems
Sustainable management of natural resources and water and soil preservation Integrated system of breeding Marshland development Irrigation development Supply and use of fertiliser and mechanisation Food security and vulnerability management
Programme 2: Support to the Professionalisation of Producers Promotion of farmers organisations Restructuring services in proximity to producers Promotion of research for development Rural financial systems and agricultural loans
Programme 3: Promotion of Commodity Chains and Agribusiness Development Creation of a conducive environment for business development Promotion and development of specialist crops Transformation and competitiveness of agricultural and animal products Rural support infrastructures
Programme 4: Institutional Development Management support ICT development and coordination in the agricultural sector Planning, coordination and M&E in the agricultural sector
3.42 In addition to the new agricultural policy and sector strategy, significant achievements in the sector during the PRSP period include: contracts for service delivery by NGOs to support farmers associations; new research underway on the main target crops identified in the PRSP; improved seed production and distribution (albeit from a very low base); restocking of livestock to close to 1990 levels with associated growth in outputs from animal production, and a national policy and legal framework for cooperatives. In terms of crops, coffee (especially speciality coffee) and rice output continued to rise while tea output remained more or less constant. One tea factory was privatised, with remaining privatisations stalled. A land policy and land law covering, amongst other things land registration, was drafted and finally approved by Parliament in 2005. Lending to the agricultural sector also shows signs of increasing, albeit from a very low base, supported by a 1.1bn Rwf investment by government (with additional support from the Netherlands) in the Agricultural Guarantee Facility, hosted by BNR. Estimates show that in 2005 close to 5 percent of total Bank lending went to the agricultural sector up from less than 3 percent in 2004. 3.43 The record on other critical priority areas including extension, fertiliser use and capacity development (particularly in the tea sector) is less positive, however. In the 2003 PRS Annual Progress Report it was noted that 94 percent of households were still not attending demonstrations by agronomists despite more technical staff and more demonstration plots in use. The latest figures on this were not available to the evaluation team but qualitative evidence suggests that things have progressed only very slowly.

37
3.44 Figure 5 confirms that, in terms of the number of fertiliser importers operating in Rwanda, the policy has been broadly successful.17 This is not matched, however, by a similar rise in the quantity of fertiliser imports which reached their highest level in 2005 at 7, 349 tonnes; still below the 2000 baseline of 8000 tonnes.18 Based on this trajectory the PRSP target of 63,000 tonnes seems a very long way off. Figure 5: Trends in Fertiliser Imports and Number of Importers 2001-5
0.00
2,000.00
4,000.00
6,000.00
8,000.00
10,000.00
12,000.00
14,000.00
16,000.00
18,000.00
20,000.00
2001 2002 2003 2004 2005
Qua
ntity
Impo
rted
(Ton
nes)
0
5
10
15
20
25
30
35
40
45
Num
ber o
f Im
porte
rs
Quantityimported(tonnes)
Number ofimporters
Source: Customs Department – RRA 2005 3.45 Background work undertaken by MINAGRI/FSSP in 2000 found that lack of knowledge about fertilisers, high prices, inadequacy of supplies and lack of credit were major factors behind poor rates of fertiliser use.19 Field visits undertaken for the evaluation found a reasonably high level of awareness amongst small-scale farmers of the potential benefits of fertilisers; but utilisation rates still remain low. The suggestion that output markets and the prices of crops have a critical influence on fertiliser demand appears strong and convincing, but while GoR has tackled the macro policy constraints little has been done to tackle the underlying micro-level constraints linking demand and supply. Consequently the big commercial farmers/distributors such as OCIR Thé and Café and more recently horticultural producers are the ones that have benefited. 3.46 There are some encouraging signs, nevertheless. Commodity based cooperatives have played a key role in bringing fertilisers and other inputs to farmers, in particular through shielding farmers from the high input costs of the few and unreliable distributors; providing them with credit guarantees; benefiting from wholesale as opposed to retail prices, and providing associated extension services. The policy shift in PSTA to improve extension services, in part through local cooperatives and 17 Although more than 70 percent of imports are made by 5 large importers who import for specific crops, including OCIR The, OCIR Café, Kabuye Sugar works and Premier Tobacco. In 2005 only 4 importers were large scale farmers and only 1 was a cooperative. (RRA Customs Department Nov 2005). 18 2002 is an outlier explained by the fact that a large consignment of fertiliser was imported for a single donor project accounting for 74 percent of all imports for that year. 19 See Valerie Kelly & J. Nyirimana (2002) Using Analysis of Fertiliser Demonstration Plots to Improve Programmes for Stimulating Fertiliser Demand in Rwanda.

38
associations, could therefore be a way forward, but evaluation findings suggest that the focus should extend beyond cash crops to equally important food crops such as maize and beans. 3.47 The PSTA is clearly a good step forward and there is much to build on in going forward, but stakeholders approached during the evaluation also feel that the strategy still requires further prioritisation to ensure a strong pro-poor focus, including a clearer sense of the sequencing of policy and institutional reforms and supporting investments needed to remove constraints to agricultural growth in the short, medium and long term. There is also need for an urgent focus on the reconfiguration of central and local institutions (in the light of the decentralisation) and on capacity re-building in general if the PSTA goals are to be delivered. 3.48 Even with the sector strategy in place, implementation challenges in agriculture remain significant. This is in part because of the characteristics of the sector itself where implementing agencies are faced with a predominance of very small-scale producers across the breadth of the country. But it is also related to the fact that key priority areas linked to improving the climate for agricultural growth are beyond the sole responsibility of the agricultural ministry, for example, rural roads, transport and energy. This requires a level of institutional capacity for inter-sectoral coordination that goes beyond most other priority sectors. 3.49 Other challenges facing the sector include the larger systemic changes taking place across government, most notably the decentralisation policy which has fundamentally changed the landscape for the delivery of agricultural services (essentially removing the old structure of MINAGRI in favour of a new cadre of extension workers appointed by local government. Most have yet to be appointed), budgetary and PFM changes, and more recently the uncertainties of public service reform. 3.50 All these issues raise major questions about the capacity of MINAGRI and its various agencies –RADA, RARDA, ISAR etc..– to manage the process of institutional and policy coordination at both central and local levels. And central government and development partners are not necessarily helping. Despite the development of a sector strategic plan, financing in the sector remains heavily donor driven and largely projectised, hence limiting the scope for a more strategic approach. Budgetary allocations to the sector also remain well below international standards. In 2006 the budget (recurrent and development) for agriculture amounted to 4 percent of the total national budget, well short of the NEPAD proposal that participating governments should invest 10 percent of their national budgets in agriculture. There are some signs that this may be beginning to change with a commitment to a new sectoral MTEF and a costed plan to deliver the PSTA. Both should form the basis of a more coherent budgetary framework for domestic and external financing. However, budget execution rates remain poor in critical areas across the sector, and without a stronger justification for more resources linked to a clear set of measurable results, the danger is that agriculture will continue to lose out as a priority area in the PRS. Labour Intensive Rural Public Works - HIMO 3.51 Although not a priority area in itself in the PRSP, the need to tackle rural unemployment, particularly amongst demobilised groups and groups affected by the genocide and subsequent conflict, has made it an understandable area of focus for both
39
GoR and development partners. HIMO, the programme designed to deliver on the PRSP commitment, was finally launched in November 2003, roughly one year later than planned because of funding, logistical and institutional difficulties. 3.52 The programme was expected to create a total of 886,000 jobs throughout the country over a period of 5 years, of which 322,000 (36 percent) would be direct, and 564,000 jobs (64 percent) would be indirect, i.e. induced jobs. It was also anticipated that some 65,100 of the jobs created would be permanent, which was impressively ambitious considering that the programme was targeting the unskilled rural poor. 3.53 The investment required for the programme amounted to US$ 220 million of which around 92 percent had been requested from donors. It was projected that the annual revenues accruing from various HIMO related activities after the programme would amount to FRw 6.8 billion, which was considered a substantial contribution to the Rwanda rural economy. 3.54 Despite its promise, implementation under HIMO has yet to meet its initial targets. Initially the programme was launched in all of Rwanda’s 12 provinces but to date activities have only been implemented in 4 provinces and concentrated on two major projects – Afforrestation/tree planting in Bugesera region and Kanyonyomba Marshland Reclamation in Murambi District, Umutara. HIMO activities in Gikongoro and Butare are small and focused on rehabilitating road infrastructure. A training centre was also planned to help develop skills that would enable participants to create sustainable jobs, particularly in areas such as road construction supervision, operations and maintenance. A training manager is now based at the proposed training centre, but of the US$200,000 required, no pledge or commitment has been received and the programme remains on paper. 3.55 With respect to funding and implementation, HIMO has so far attracted funding from two sources – the Netherlands and Canadian Cooperation. Initial support came largely on a project basis, but recently it has been decided to channel funds for HIMO through the Common Development Fund (CDF) which provides budgetary transfers to local authorities to support capital investment in inter alia production infrastructure. The EU has also promised support to the programme through the CDF but is awaiting appraisal of the first phase. There are no indications as yet that HIMO is integrated into the district development planning process (DDPs and local government MTEFs) in a demand driven way. Human Development 3.56 Sector strategy plans have been developed to take forward the human development agenda and these address many of the design weaknesses of the PRSP.20 All the plans include more detail on operational implications including actions, targets, indicators and timelines. More comprehensive links to the MDGs are also in evidence, including attempts to reflect them in medium-term timelines and targets. References are
20 Education Sector Strategic Plan 2005-2010 (April 2005); Education Sector Strategic Plan 2004-2008 (October 2003); Health Sector Strategic Plan 2005-2009 (April 2004); Water and Sanitation Sector Strategy 2005-2010 (July 2004); Sector Strategy for Settlements, Urbanisation and Public Buildings 2004-2006 (2004).

40
made to other international commitments such as Lusaka on decentralisation, Dakar on education and Istanbul on habitat and urbanisation issues. 3.57 Some plans came earlier and are better designed than others, but prioritisation by poverty impact remains a weak link for all. The health and education plans were published within two years of the PRSP’s publication. They are models of the logical framework approach, beginning from the overall goal of the sector and moving through the purpose of interventions to specific programmes, activities and expected results. Performance indicators are presented at each level and potential risks are identified. Attempts are also made to address challenges specific to particular groups of the population such as girl’s education and the disease burden of children. The plans for the watsan and housing sectors came later and are weaker. For example, they lack detailed costing and tend towards qualitative rather than quantitative targets and indicators. Interviews suggest that donor-funded TA played a key role in ensuring high design quality in the health and education plans. None of the plans contains a thorough analysis of which policies are likely to make the most significant impact on poverty reduction, though basic education continues to be presented as the main priority for the education sector as does the expansion of a basic package of health care plus participation in mutuelles. 3.58 Significant improvements have been made to stakeholder participation in preparing and implementing the human development agenda:
All sector strategic planning processes included unprecedented forms of participation by provinces and districts, development partners, civil society and NGOs.
Clusters have also been created covering all key human development themes, but with varying degrees of success e.g. the infrastructure cluster is barely functioning at present. Key factors behind the more effective clusters (health, education, rural housing) include ministerial involvement, government ownership of the agenda, support from a lead donor and the selection of a dynamic and sufficiently senior chairperson. Thematic working groups have helped these clusters strike an appropriate balance between matters of strategy and detail.
The annual review of the education sector provides a strikingly effective example of stakeholder participation with potential for replication in other sectors (see Box 6). The APR process has also added some value. Interviewees stressed the importance of the APR in drawing attention to the need to improve M&E e.g. through quality targets and indicators, and consistency in reporting over time. However, donor reporting demands in the sectors continued to exist separately from the APR and were viewed as unreasonable and excessive by many government interviewees.

41
Box 6: Stakeholder Participation in the Annual Education
In 2003, MINEDUC organised the first joint review of the education sector, a highly successful approach to stakeholder participation which could be adapted for use by other sectors. The review took place over four days and involved over one hundred participants from central, provincial and district government, civil society organisations, and donor agencies. It was designed to review progress against the education SWAP within the PRS framework, including on donor co-ordination and harmonisation. An assessment was made of progress in finalising and costing the sector strategic plan and moves were made to agree a framework of common indicators to ensure PRS monitoring was aligned with monitoring in the education sector. Progress was also reviewed in crucial areas such as: curriculum, textbook and multilingual language policy; teacher recruitment, training and retention; decentralisation; school construction; and HIV/AIDS. The review included both discussions in Kigali and ‘reality check’ visits to education sites in other provinces, and specific, detailed recommendations were made for action in a number of areas. An Aide Memoire was subsequently produced to feed into the annual reporting cycle of the PRS and MTEF and the annual budget preparation process. The joint review has now become an annual fixture, with similar events held in 2004 and 2005, and participants consistently praise its focus on joint working to deliver results in the education sector. Source: Joint Review of the Education Sector: Aide Memoires 2003; 2004; 2005. 3.59 Despite these achievements, there remain significant constraints to the effectiveness of the human development agenda at the institutional level, where events have not played out entirely as planned at the start of the PRS process. The most tangible in education is what has been termed ‘access shock’ and the additional threat to educational quality resulting from the new policy of compulsory, fee-free primary education. In this context, the new policy of Nine Year Basic Education could be seen as overly ambitious. The pace of financial reform in higher education and in tertiary healthcare has also been disappointing, with interviews suggesting that the legal and political dimensions of reform have proved more complex than originally thought. 3.60 While improvements in health sector performance generally are noted, improvements specifically in areas most closely related to the health needs of the poor have underperformed (see the next section in impact). While there have been improvements in the delivery of certain inputs, such as staffing, these appear not to have been translated into improved outcomes, particularly for the poor. Continued issues, such as barriers to access and user fees have not been effectively addressed so far. How far this reflects capacity constraints and how far it reflects a failure of political will in the health sector is difficult to determine, but the contrast with education is a relatively stark one in this respect. 3.61 The effects of civil service reform on sector capacity generally, and on weaker sectors in particular, has also been a source of unforeseen uncertainty and constraint in relation to human development. For example MININFRA has only two desk officers left responsible for national housing policy while there has been a severe lack of financial and human resources in the housing and watsan sectors for much of the PRSP period. 3.62 Donor alignment of performance criteria and financial assistance with the PRS remains unfinished business in the human development sectors. All sectors purport to adopt a SWAP, but the practical meaning of this remains extremely vague. Off-budget, small-scale and proliferating projects are still very much in evidence and even simple attempts to map donor interventions in some sectors remain incomplete because donors
42
did not fully respond. Moves towards pooled funds were only in evidence in the health and education sector, with the latter furthest ahead. The pooled education fund may allow some element of donor earmarking to those policies they consider to be pro-poor. Some interviewees argued that the earmarked pool would be a more comfortable half-way house for donors that were nervous about moving directly into general budget support. Others conceded that the pooled fund was driven more by the concerns of existing budget support donors about recent allocations towards tertiary education, and their desire to demonstrate that they are “protecting” their funds for poverty reduction. Whether the fund will prove additional to budget support or detract from it remains to be seen. Governance and Capacity Building 3.63 An overall governance strategy has not been developed, nor did the PRSP commit to developing one – reference was made only to a public sector strategy. As discussed earlier, the November 2001 governance workshop, the 2001 national strategy for strengthening good governance for poverty reduction and the subsequent national programme provided a complementary framework to refine and implement PRSP governance objectives. At the same time very few informants are aware of this complimentary framework and there is almost nothing written on it in current PRSP documentation. The programme was meant to be complemented by more specific targets and indicators which could have been monitored. As a result, there has been an absence of a unified or coherent structure to coordinate government action across the governance agenda, making prioritisation and monitoring of initiatives particularly challenging. 3.64 The lack of obvious operationalisation of the framework may be due to:
The wide scope of the PRSP and the governance issues it covers, making operationalising a specific governance framework particularly challenging;
Limited capacity for delivering within MINALOC – appointed the lead Ministry for governance but lacking the legitimacy to lead on some aspects of the agenda such as justice, security, civil service reform or the independent commissions;
Weaknesses in the political and technical capacity needed to coordinate a large number of government actors and covering some of the more sensitive areas of the government’s agenda;
The sheer number of political initiatives and new reforms across the governance sector during the period; and
The multiplicity of donor projects and programmes. 3.65 Decentralisation is an area where the existence of a sectoral policy (dated 2000) and a single lead ministry in MINALOC made the possibility of a developing a coherent sector strategy and plan more possible. Beyond the general significance of administrative decentralisation specific achievements of the first phase of the DIP (Decentralisation Implementation Plan) include the establishment and mobilisation of resources for the Rwanda Association of Local Government Authorities (RALGA), funds for the Common Development Fund (CDF) which has successfully funded several local government initiatives and gradually gained donor confidence, establishment of decentralisation focal points in ministries and at province level and establishment of a governance and decentralisation unit in MINALOC. By 2004 3 percent of total domestic revenue was going to support recurrent expenditure at local government levels.

43
3.66 An evaluation of the decentralisation process in 2003 nevertheless noted some important weaknesses that still appear relevant in 2005. Most crucial is the need for a more effective institutional coordination framework for decentralisation. The second DIP is not being implemented as an overarching framework and the national steering committee is largely ineffective, with decentralisation perceived as MINALOC’s responsibility rather than as a cross-governmental responsibility. Other concerns include continued centralisation of budgets at line ministry level and significant delays in the devolution of service delivery functions from line ministries and agencies. The deconcentrated provincial level administrations have also not played their role of supporting decentralised entities instead playing a largely service delivery function. Coordination mechanisms to implement the DIP are not functioning well while donor projects and programmes continued to be designed, implemented and monitored through often parallel structures not always linked to the DIP – with the result that some regions receive significantly more assistance than others. The PRSP and sectoral planning processes are not well linked to the local planning process while M&E systems are not functional. This is evidenced by some local investment, such as the construction of bureaux de secteur, reflecting top-down rather than bottom-up priorities, and the weak link between ubudehe and local level planning processes. 3.67 In 2005 government acted to strengthen decentralised structures by initiating new territorial and administrative reforms. This caught the donors off-guard, but has contributed to re-invigorating the decentralisation sub-cluster. The new administrative reform proposal is associated with a medium term vision of a small central civil service accompanied by enhanced capacity at district levels for effective service delivery. While the move is consistent with the larger political vision, a key challenge facing civil servants in Rwanda is the frequency of significant institutional reforms giving little time for new reforms to get fully implemented and embedded. 3.68 Public service reform has been an early government concern and, in contrast to many other African countries, has been domestically driven. Reform started in 1998 with a new policy framework approved in 2002 and a new public service law, updating the 1974 statute. In 2004 a new strategy and implementation plan was issued by MIFOTRA (Reconfiguration and Transformation of the Rwandan Public Administration). The aims are to: review the role of the state in the context of decentralisation and partnership with the private sector and civil society; improve the professionalism of the public sector; and a functional analysis of institutions and the introduction of strategic management tools and systems. There have been some visible results, such as an increase in the number of personnel with university degrees – from 6.7% in 1998 to 41% in 2004. Retrenchment has been ongoing, with little social upheaval, with 960 central and provincial staff retrenched in 2004-5 alone. There has been little reaction to some of these difficult measures, sometimes introduced with limited consultation, such as the decision in 2005 to radically transform the government’s car fleet and the retrenchment of at least 1000 drivers – a measure taken before a system of car rentals could be established. 3.69 Constraints on the improvements to service delivery include the need for better incentives to recruit, motivate and retain staff and improve their performance. The restructuring of Ministries was meant to be associated with sector strategies but capacity has remained weak in many dimensions. Salary levels are low and staff are leaving for the private sector. There are many unfilled positions. The proposed pay reform has been delayed and there are concerns it might not be affordable. The large number of public agencies (estimated at 49, employing 11% of public sector staff but representing 39% of
44
the wage bill) is indicative of a tendency of policy makers to by-pass some of the ministries in order to better control public action . While there is a long tradition in more developed governmental systems of creating specialist agencies, there is nevertheless a concern that agencies are being created by an impatient political regime to get around some of the obstacles of a weak and, at times, resistant bureaucracy instead of tackling the core problems of weak capacity across the government system as a whole. Public service reform is thus an ongoing process, which has not always been supported by timely donor support – for example GoR still lacks a government-wide computerised human resources and payroll database. 3.70 In other governance priority areas, institutional rather than sectoral strategies have become the main framework for strategic planning and coordinating donor assistance. These include strategic plans for ministries (MIFOTRA, MINALOC, MINJUST, MININTER), agencies (Police) and commissions (NURC, NHRC, Ombudsman). The most significant recent progress in developing a ‘sub-strategy’ has been in the area of justice and in particular since late 2004, with moves towards becoming another recognised governance ‘sub-cluster’ led by MINIJUST and UNDP. (Box 7). Coordination in another sub-cluster focusing on capacity building appears to have been replaced by the World Bank led Multi-Sectoral Capacity Building Programme focusing on the establishment of an agency – the Human Resources and Institutional Development Agency (HIDA) – which has recently become operational after significant delays. Box 7: Towards a Justice Sector Strategy The MINIJUST Strategic Plan puts forward a sector-wide vision, entitled ‘Justice Sector Strategy 2005-7’, covering the response to the genocide, civil and commercial justice, good governance and human rights, law making/reform, legal training, sector monitoring and coordination, and the use of ICT (draft, December 2004). There were other triggers for the move towards sector-wide planning, including: a study tour to Uganda where this approach is more developed; pressure from the DPCG for better aid coordination to the sector; the realisation that separate institutional strategies entailed duplication (e.g. training, infrastructure and ICT) and that in a context of scarce resources, more could be achieved by jointly determining and funding shared priorities. As a result, during 2005, a number of steps have been taken to establish a formal ‘justice sector cluster’, recognised by the DPCG and led by MINIJUST and UNDP. Several meetings were held during 2005 to develop the approach and gain support for it; a joint Secretariat has now been established, and a number of donors have considered providing basket funding in support of a joint sector strategy. The framework includes a number of thematic teams to enable cross-sectoral collaboration (e.g. training). Already small practical collaborative initiatives have been undertaken, such as making use of the MINIJUST server for other sector institutions, instead of developing parallel capacity and encouraging use of the Nyanza justice training school for training police investigators. Private Sector Development and Economic Infrastructure 3.71 With no overarching private sector or commercial sector strategy in place for much of the PRSP period it is hard to assess the effectiveness of GOR’s actions in this area. There are some signs of progress, however. The new land law is significant as are key privatisations of the Commercial Bank of Rwanda and RwandaTel, although slow progress on privatisation in the tea sector remains a constraint. Revisions to the Investment code and the restructuring of RIEPA (formerly RIPA) to include a focus on export promotion are evidence of a more outward oriented approach. Tourist numbers

45
have continued to expand and a tourism strategy has been produced. Coffee has also continued to recover its place as Rwanda’s lead export with export earnings from coffee more than doubling in 2004. 3.72 2004-5 also saw increased collaboration between MINICOM, MINAGRI the private sector and donors in the context of the Diagnostic Trade Integration Study (DTIS) and the formulation of an Integrated Framework which is the nearest to thing to a comprehensive strategy for commercial sector development. The PSD cluster. Continues to provide an important forum for dialogue involving the private sector (in the form of Private Sector Federation) and development partners. 3.73 Notwithstanding clear political will to promote investments and develop the private sector as an engine of growth, coupled with continued macroeconomic stability and a relatively low level of institutionalised corruption compared with neiggbouring countires, overall the business climate remains severely constrained. The absence of a clear policy guiding the work of MINICOM is a continuing weakness. The proliferation of agencies (nine in all) overseeing various aspects of the private sector/investment agenda, including OCIR-Café and Thé and others, presents a major coordination challenge for MINICOM and raises questions both about the appropriate role of government in supporting PSD and the overall vision for commercial sector development in the country. International business climate indicators point to some continuing weaknesses in Rwanda relative to the regional average, most notably in the time taken to secure rights to property (one of the five most difficult countries in the world in which to register property) and the cost in per capita income terms of starting a business (World Bank 2004).21 High energy costs, estimated at nearly three times the regional average, are a significant barrier to entry while also forcing up production costs relative to producers in neighbouring countries. High transport costs restrict opportunities for trade while inconsistencies in the tax burden and limited financial capital for small and medium scale enterprises limit the opportunity for job creation at the lower end of the income spectrum. 3.74 In terms of dialogue, the private sector cluster is functioning but Ministry leadership is uneven. No formal terms of reference for the cluster exists although a draft was prepared in 2005. Donors are active in discussing and sharing information but tend to continue to work separately. Generally levels of donor funding to the sector have been low. The recent Baseline Survey of Donor Alignment and Harmonisation estimates that only 1 percent of total aid flows to Rwanda went to private sector development in 2004. The view from stakeholders is that this has to increase with the Integrated Framework (IF) and the push for a stronger growth focus in PRS2. In this regard the IF offers a major opportunity to forge ahead with improved donor coordination and harmonisation in the sector. 3.75 In economic infrastructure the picture on effectiveness is again hard to construct because of the lack of M&E data and statistics from decentralised levels. The recent review of the impact of decentralisation on service delivery does find some good news stories including increased targeting of public expenditure resources towards rural infrastructure development through the CDF22 mainly to construct markets, bridges and
21 World Bank (2004) Doing Business 22 There have been major disbursement problems in the CDF in the recent past. These appear to have been resolved in 2004-5.

46
rural feeder roads in districts, sectors and cells. The review also finds increased community involvement in planning, implementation and maintenance of infrastructure, mainly through umuganda a system of local community mobilisation. Infrastructure development projects are also slowly attracting private sector investment, largely from Kigali contractors at this point, and there are instances of new collaborative initiatives between local authorities and the private sector in the management of rural infrastructure.23 3.76 Constraints and challenges persist, the most significant of which are: the lack of sufficient financial resources to implement prioritised infrastructure activities and to maintain and develop them to required standards; high levels of rural poverty which often limits the contribution that communities can make to maintaining local infrastructure; restrictions on local O&M budgets24 and lack of coordination between local authorities, NGOs and, on occasion, donor agencies. 3.77 In national terms progress has been made in rehabilitating arterial roads and bridges. Feasibility studies are underway for many more. In energy only limited progress has been made. An energy sector policy was adopted by Cabinet in late 2004 highlighting major problems in the production and transmission of energy. The urgent need to implement such a policy was painfully evident in 2005 when low rainfall and low water levels together with increased urban demand, precipitated a major energy crisis in Rwanda’s predominantly hydroelectric system. The crisis required emergency reallocations within the government’s budget and potentially some loss of funds to other priority areas.25 The Government continues to push ahead with its rural electrification policy - but studies show that any future grid extension will have to face tighter economic justifications (World Bank 2003) pointing to the need to expand micro-hydro based independent grids and possibly solar power to reach those in least accessible areas. Lack of electricity access is a key bottleneck not only for the commercial sector in rural areas (coffee washing stations and rural non-farm enterprise) but also for education (distance education and ICT access in schools) and health (in remote health facilities). Cross-Cutting Issues 3.78 Weaknesses in implementation capacity and the problem of finding institutional champions for some agendas (such as inequality), has reduced the number of cross-cutting issues that GoR reports on from eight to four over the PRS period (Table 5). Inequality appears to have disappeared as a theme, along with imidugudu which is only given passing reference in connection with habitat and urbanisation, while capacity building, along with the human resource development component of human development, is elevated to a priority area. 23 The effectiveness of such initiatives depends greatly on the experience of private contractors and the capacity of local authorities to monitor and supervise contracts. 24 With financing for infrastructure coming through centrally administered projects and grants such as the CDF, there are still problems of assigning adequate O&M budgets at local level to cover the costs of future maintenance. 25 GoR has argued that these were funds that were reallocated from areas where execution levels were already low.

47
Table 5: How Cross Cutting Issues Have Evolved Over the PRS Period* PRSP
APR1
APR2
APR3
Technology Technology Gender Environment and Land
Gender Gender Technology HIV/AIDs Environment Environment Environment ICT Imidugudu Imidugudu HIV/AIDS Gender HIV/AIDS HIV/AIDS Inequality Inequality Employment Harmonisation &
Coordination
Capacity Building Capacity Building Employment Inequality *Order reflects the order in which they appear in the relevant document. 3.79 In terms of execution some progress has been made in environment and land with recent policies being adopted, a land law passed by Parliament and a new agency REMA established to carry forward environment and natural resource management.26 3.80 Environmental issues nevertheless remain weakly articulated across government falling, along with some other systemic themes, into a virtual ‘cross-cutting oblivion’. 3.81 Most obvious initial progress was made in the area of gender with the Constitution and Parliamentary elections ensuring near equitable representation of women in the newly formed National Assembly. In the Chamber of Deputies 48 percent of Deputies are now women. MIGEPROF (one of the few ministries of its kind in the region) prepared a gender promotion strategy and gender focal points were trained within key line Ministries, although not yet at province or district level. Gender machineries, including a Gender Observatory and Gender Commission in Parliament have been established. Women’s councils and associations have been set up at all levels and affirmative action has been promoted in local authorities. Work is in progress to draft a law on domestic violence. Attempts were also made to prepare a gender budget for integration into the MTEF but while some of the preparatory work was done, to date there has been little follow up within MINECOFIN. 3.82 In terms of effectively mainstreaming the Gender Policy into all sector strategies, it appears that gender has not been adequately reflected in the sector strategies (this is clearly stated in the latest APR). There are some gender relevant aspects across the sectors (education, health and governance) but these are not seen as being adequate. The main obstacle continues to be the lack of capacity within MIGEPROF and within individual sectors to meaningfully integrate gender issues into sector strategies, and no guidelines have been developed to assist in this (as was planned in the PRSP). Also, many key sectors developed their strategies late - after the initial momentum surrounding the PRSP – and after the big push on mainstreaming gender. 3.83 Most recently there appears to have been a loss of momentum around the gender strategy. MIGEPROF has been downsized and relocated within the Prime 26 The creation of separate agencies to carry specialist agendas is increasingly common in GoR with 5 plus in agriculture, 9 under commerce and several others. While there is a long tradition in more developed governmental systems of creating specialist agencies there is nevertheless a concern that agencies are being created by an impatient political regime to get around some of the obstacles of a weak and, at times, resistant bureaucracy instead of tackling the core problems of weak capacity across the government system as a whole.

48
Ministers Office, although technically still functioning as a ministry and technically a move to ensure that gender mainstreaming will be more successful in the future. While there have been some attitudinal changes, attempts to further mainstream gender have met with resistance in some ministries, especially at the technical level. Impact and Sustainability Priority Spending 3.84 Public spending in priority areas has increased significantly over the PRS period, although this is in part due to the gradual expansion of the number of priority programmes (see next chapter). Other priority needs are also now crowding in, such as energy, with some possible implication for core priority programmes. 3.85 Table 6 summarises priority spending trends as a share of the total recurrent budget. Table 13 in Annex 2 provides a more detailed breakdown of priority spending by sector/MDA for 2001-2005. Figure 6 shows the trend in priority spending (extrapolating back to before the PRSP) and in military expenditure drawn from the fifth PRGF review. Table 6: Priority Spending Trends 2002
Budget2002 Actual
2003 Budget
2003 Actual
2004 Budget
2004 Actual
2005 Budget
Priority recurrent exp % of total recurrent
37 43 39 40 42 49 52
Source: Purcell et al (2005) 3.86 The record since 2002 is that allocations to priority areas have increased by more than 0.1 percent of GDP per year as military spending has declined (as agreed under the PRGF). Only at the end of 2004 did this change because authorities needed to reallocate priority funds to address the acute electricity crisis. Because of the importance of energy to Rwanda’s future growth and development prospects, electricity was added as a priority expenditure in 2005. Some of the challenges surrounding priority spending are discussed below. 3.87 In terms of the relative shares of priority sectors, education and health have, in line with other PRSP countries, been the main gainers. In 2005, according to the joint GoR-donor review of budget support and public financial management27, actual expenditures in the social sectors represented 37.2 percent of the total recurrent budget, equivalent to 5.9 percent of GDP. Total education spending increased by 12 percent between 2004 and 2005 and on its own accounted for almost half (49 percent) of total priority expenditure in 2005.The increase was mainly allocated towards the implementation of the fee-free primary education policy. After education, another key PRSP sector, the health sector, received 14.4 percent of the 2005 budget with a significant share of it going towards the decentralisation of health services. In contrast, the first priority area of the PRSP – the agricultural sector – received only 2.2 percent of
27 Report of the Joint Budget Support and Public Financial Management Review July 6-21, 2005. Review conducted jointly by the GoR and the Budget Support Group for Rwanda.

49
recurrent spending in 2004,28 well below what can be considered as essential in a country facing such major agricultural challenges. Figure 6: Priority Spending and Military Spending (Percent of GDP)
Source: IMF Fifth PRGF Review, September 2005 3.88 Relatively little is known centrally about the flow of resources to service delivery agencies. The absence of a regular and comprehensive public expenditure review process compounds this problem greatly. Execution rates point to under-spending in some programmes and some reallocations within the total envelope for priority programmes (by as much as 10 percent of the initial budget envelope in 2004). Reallocations have been rationalised by MINECOFIN in terms of the difficulties faced by specific programmes in absorbing funds (CDF, gender for example) but little analysis appears to have been done of the likelihood that these programmes would utilise their full allocations later in the year. This points to a weakness in the way in which priority budget allocations are ‘protected’ and to fungibility in the internal decision-making process (see next chapter). (Purcell et al 2005) 3.89 Public Expenditure Tracking Surveys undertaken in 1999/2000 and 2004 give some insights into the effectiveness of resource allocation to sub-national levels, but the two surveys are far from comparable because of different methodologies and the significant institutional changes, particularly in and around decentralisation, that have taken place between the two survey years. The 2004 survey provides a fairly positive picture of the flow of funds, especially in education, although concerns were raised about funding for district hospitals from the provincial level, amongst others. 3.90 Recent work undertaken for MINALOC on decentralisation and service delivery finds that in most sectors the potentially positive effect of decentralisation on service delivery is significantly weakened by the lack of clear definition of roles and responsibilities at various levels. It also points to a very different service delivery record in different sectors on account of different approaches, levels of innovation, local leadership and community engagement (CRA 2005).
28 Notwithstanding the complex issues relating to the role of the public vs. the private sector in agriculture and the observed stagnation in agricultural spending, particularly on research and extension in Africa (NEPAD) 2.2% of total spending is still low by international standards.

50
Agricultural Transformation and Rural Development 3.91 Similar to other post conflict countries growth rates started off positively but have begun to slow down, mainly in response to poor rains and the slow pace of policy and institutional reforms across the sector. To fulfil its role as the engine of growth, the PRSP states that the agricultural sector should achieve between 5 and 8 percent annual growth. The record for the PRSP period is closer to 3.6 percent. Table 7 shows the decline in agricultural growth in 2003 and the continued decline in food crop production in 2004, largely due to adverse climatic conditions. Table 7: Annual Average Growth Rates by Sector 1982-92 1992-02 2001 2002 2003* 2004
2005 (est)
2006 (proj)
GDP growth
1.4 4.2 6.7 9.4 0.9 4.2 5.00 6.00
GDP per capita growth
-1.5 1.8 3.7 6.3
Exports 0.9 6.4 30.8 -6.8 Agriculture Food Crop
-4.1 0.8 -1.1
Services 4.7 7.9 Industry 7.1 6.9 * drought year. Source: GBS Evaluation based on PRSC Programme Document, Annex 4 1982-2002, APRs 2003 and 2004, MINECOFIN Annual Economic Report. 3.92 Some important progress has been made, however, most significantly in coffee, rice and pyrethrum production following intensive programmes of national and donor engagement. Coffee production, especially of speciality coffees, has grown dramatically since the beginning of the decade with total production increasing by 98.6 percent between 2001 and 2004 (although still well below pre-war levels). In 2004 earnings from coffee exports overtook earnings from tea exports for the first time. What was one of the poorest districts noted in the last DHS – Maraba – is predicted to show very significant progress in the forthcoming DHS and ECIV largely because of improvements in the processing and marketing of coffee.29 Rice production increased by 35 percent between 2003 and 2004 mainly due to an increase in the number of producers and expanded cultivated area, while the production of pyrethrum flowers increased by 25 percent between 2003 and 2004 with start up of a refinery for the processing of pyrethrum flowers. 3.93 Nevertheless, poor performance in agriculture has continued to impact on food security, due in part to higher prices. In 2003-4 food imports increased 22 percent in volume terms, while food items in the CPI increased by 16 percent. Analysis of the impact of rising food prices on the poor is not currently available but going on estimates of the share of total household expenditure spent on food products (ECIV1) the implication is that the impact is significant for both urban and rural poor. As noted earlier, fertiliser use amongst traditional and cash crop producers has remained more or less flat over the period, one of the reasons for weak productivity growth overall (Box 8). Poor performance in particular food crops such as beans, peas, bananas and cassava is linked to insufficient rains, seeds and outbreaks of disease (APR 2004 Table 5.1).
29 Maraba is the site of major USAID project supporting the coffee sector.

51
Box 8: Reasons for Low Fertilizer Use among Traditional Crop Farmers “First of all we have no banks here. But if I borrow from the bank or MFI to purchase fertilisers, I will be sure what I will have to re-pay after my harvest. The problem is that not even the MINAGRI minister can predict how much I will earn from my beans even if I can accurately estimate how many tonnes I will harvest. Don’t you see that this is a big risk?” – Venant, Prominent farmer & Businessman in Gikongoro. Food crop farmers (potatoes, beans, maize) in Butare reported that they believe fertilisers could help increase production and hence incomes but the risks of loss are very high and tend to be worse in cases of overproduction. This was reportedly because, unlike cash crops such as tea, rice, coffee and pyrethrum that have relatively clear markets, the marketing of food crops is not reliable. In fact, it was argued that whenever there is high production prices slump and the main people to benefit are Kigali residents and middlemen who buy food cheaply. Farmers, however, claim they cannot get a return on their investment. Some technical officials also agreed that the lack of clear market information systems for crops such as maize, beans and potatoes, and the fact that farmers for these crops have never been organised to have a collective voice, were severely affecting their commercialisation. It was also reported that even if credit lines were opened, farmers were likely to remain reluctant to take credit risks to invest in agro-inputs like fertilisers, when they are not sure of whether there will be a market and how much they are likely to get from sale of their produce. Labour Intensive Rural Public Works - HIMO 3.94 In terms of implementation progress, officials based in Kigali report that since 2003 some 10,000 jobs have been created with about equal numbers of men and women beneficiaries. While this is significant, it is well below the annual target needed to reach the goal of 322,000 directly induced jobs and 886,000 jobs overall. Figures from the Netherlands Embassy in relation to their project funding point to some 4.4 million man-days of work created over the period 2003-6, building, inter alia, 286 km of roads, 782 ha of terraces and protection of 205 ha of marshland. Further evidence of achievement and impact includes:
Creation of permanent jobs and livelihood sources in agriculture. In Murambi district of Umutara province, where the programme has so far reclaimed 55 ha of marshland, 1,200 poor households were allocated plots in which they each earned approximately FRw 360,000 per annum (US$ 640) from production and sale of rice. In addition, these farmers have been trained in irrigation techniques, sensitised on the importance of saving and organised into local associations (Box 9).
Empowerment through local associations in which beneficiaries are mobilised and supported. In Umutara province, 60 local associations have been created – and this has provided an institutional setting to enable the programme beneficiaries to access credit for inputs and marketing of their produce. In Gikongoro province, the association of HIMO beneficiaries in Mudasomwa district has already accessed credit from the Banque Populaire. HIMO officials in Kigali point to the creation of 1000 such associations in total .
The HIMO concept has been used by other development partners. The Netherlands supported rural development programme in Ruhengeri, implemented by a Care International/Helpage consortium, has adopted the HIMO approach in their infrastructure and environmental protection programme (construction of bridges, rehabilitation of rural feeder roads, tree planting and terracing of hills). There is also appreciation among other NGOs that the HIMO concept is a viable integrated approach in addressing poverty.

52
Perhaps the more appreciated result has been the planting of trees and rehabilitation of road infrastructures. The local people in Bugesera believe that although they have been treated harshly by the project (Box 9), the trees planted could protect them from drought.
3.95 There are nevertheless major shortcomings as indicated earlier which pose a risk to both the overall impact (in terms of scale) and sustainability of HIMO. Major risks include:
Inadequate funding. Of the $220 million requested from donors slightly less than 9 percent has been realised.
Institutional weaknesses have affected efficiency in the management of such a huge programme. The programme took a multi-sectoral approach, and sought to implement different programmes in different areas, yet institutional capacity has remained very weak and donor financing remains largely projectised and unintegrated with district development plans.
There are concerns for efficiency, quality and sustainability – HIMO works have been criticised as not adhering to standards of quality, and that using unskilled workers is less efficient in terms of time and supervision required, while GoR officials contend that the programme does follow international labour organisation (ILO) quality standards. There also concerns that the way the programme is designed makes it difficult to fit in with local government development programmes, and is seen as a discrete project with a short life span. In the Bugesera tree planting project, the implementing associations hired their own agronomists instead of working through the Local Government officials. Some stakeholders have recommended that the emphasis should be on HIMO as a concept across government and not just as a programme.
Box 9: HIMO - What is Working; What is Not? HIMO projects were expected to be implemented using the same approaches, but field visits reveal a marked difference between the implementation of two projects. Beneficiaries of the Kanyonyomba project responded that they were transparently selected; there was sufficient mobilization beforehand and they have been organized into local associations (60 associations cultivating 55 ha of land). Although local people were initially reluctant to engage in marshland reclamation because of the difficulties of the job, they were convinced through sensitization. Beneficiaries were trained in the basics of rice cultivation and irrigation technology by Rwandan rice farmers who had themselves been trained in Egypt. The beneficiaries worked on the plots and were paid for 60 days, and after the harvest, they were allocated the plots. To date, the Project employs 1600 people per day. With skills in irrigation, plots of land and about FRw120, 000 per season each, beneficiaries state a lot of satisfaction with the project. In contrast, in the Bugesera tree planting project, the approach was different and the project has been described by beneficiaries and local stakeholders in the sectors visited as a “disaster”. To begin with, there was no mobilization ahead of time, and the residents contend that the only communication they received from project officials was “we are going to plant these trees, whoever lets their livestock destroy them will pay very heavy fines”. Indeed, it was reported, the fines have been enforced religiously and many people’s livestock have been confiscated. The project was also tendered to associations (or enterprises) based in Kigali. The recruitment, supervision and remuneration of the workers was done through local leaders and the criteria followed were not known to the residents. Apart from the massive tree planting, which is appreciated and is expected to mitigate the persistent drought, the results with respect to employment and income generation are disappointing. In fact, local people termed the project HIMANO which loosely translated means ‘something that makes life difficult’. Main criticisms were: favoritism, whereby local leaders recruited their relatives and those able to pay to be

53
included; the allocation and verification of work done was ad hoc; on average, workers would work for about 3-5 days, contrary to the minimum 60 days reported by HIMO officials in Kigali, with the highest earnings per day rarely above FRw 100. Women were the most disadvantaged by low pay. Payments were also irregular – to date, some people have not been paid their wages of more than 2 months. This prompted beneficiaries to ask “what can one save from the Frw100? Is this the actual HIMO that we heard about?” Human Development 3.96 Table 8 below, and Table 13 and Table 14 in Annex 2, show that the education sector in particular has performed relatively well since the introduction of the PRSP. In health, sector reviews show that there have been improvements against most of the seven key objectives in the sector strategy plan, although less clear at the time of the evaluation is the relationship between these improvements and changes in health outcomes, especially for the poorest. 3.97 In education, a pro-poor policy of fee free primary education and capitation grants have been introduced, with the grant increased from FRw 300 to FRw 1000 in the 2005 budget. More teachers have been trained, new secondary schools and new primary classrooms have been constructed, curricula have been revised, textbooks distributed and school feeding programmes established. The results are evident in changes in net enrolments rates at primary level and the primary school completion rate. 3.98 In the health sector, expansion of the coverage of mutuelles de sante from 9 percent of the population in 2003 to 27 percent in 2004 represents an important change. Consideration is also being given to introducing a subsidy for the poorest who cannot afford current contribution levels. The number of doctors and nurses has also been increased, and salary and incentive structures revised to attract greater numbers to work in the most neglected rural areas. Rwanda has also achieved an impressive rate of vaccination against childhood diseases and implemented a programme of tuberculosis control through DOTS. Impregnated mosquito nets are being distributed to curb malaria and a large scale HIV AIDS awareness campaign has been put in place. Some drug subsidies have been introduced (for malaria and anti-retroviral drugs) and a broader pricing policy aimed at enhancing poor people’s access to drugs is currently being finalised. 3.99 There are significant exceptions to this picture, however, in areas that are central to the poverty reduction agenda. Maternal mortality and under-five mortality rates have not shown improvement over the PRSP period, while population growth remains a major challenge. Given that these indicators serve as an important proxy for the country’s socio-economic level and quality of life overall, the conclusion has to be that the PRSP has so far failed to deliver on significant quality of life improvements, and especially for the poor. Furthermore, while access issues have been squarely addressed in the education sector, the full equity and access implications of continued user-fees for basic health care have not been tackled head on. Doubts already exist about the feasibility of extending coverage of mutuelles to finance the basic health service needs of the poorest (Box 10). 3.100 It is almost impossible to assess impact in the housing and watsan sectors. The lateness of the sector strategies has meant that previous APRs have not been able to

54
assess the impact against indicators and targets. The watsan sector strategy does not include any indicators against the activities listed. There are only short and brief sections in the APRs on these sectors and have tended to list achievements, challenges/constraints and objectives for the following year. For example, in watsan in the most recent APR, the main achievement was the adoption of the Water and Sanitation Policy in 2004 and the elaboration of a new sector strategy. There is very brief information about promotion activities to encourage private sector participation in the water sector and that different projects in the sector had been completed or continued (although there is very little information on these). Impact information was not available in the Ministries but from what evidence is available, housing has performed particularly poorly. Table 8: Selected 'Outcome/Impact' Indicators
Indicator
2000 2001 2002 2003 2004
Population (millions) 7.9 8.2 Population Density (km2) 329 Annual Population Growth Rate 2.8 Proportion of population below the poverty line (income poverty) 60.3 Rural income poverty 65.7 Life Expectancy at birth 42 39.8 39.8 Maternal Mortality per 100,000 births 1071 1071 Fertility Rate 5.7 5.7 Infant Mortality per 1,000 107 107 Under 5 Mortality per1,000 Richest 20% Poorest 20%
203 198 120 225
Severe Under 5 Malnutrition (%) 24 24 HIV (15-49 Years) (%) 11.2 13.5 8 % of population enrolled in health mutuelles 7 27 Gross Primary Enrolment % 99.9 103.7 128.4 130.8 Net Primary Enrolment % 73.3 74.5 91.2 93.0 Completion rate % 24.2 29.6 38.1 44.9 Drop out rate % 14.2 16.6 15.2 Gross Secondary Enrolment rate % 10.2 12 12 13 Net Secondary enrolment rate % 6.0 Source: ESSP Reviews; DHS; MINISANTE; World Development Indicators. GBS Evaluation 2005 (draft). 3.101 While progress is evident, some of it represents a return to stability following the events of 1994. The coming years will be critical in terms of consolidating and accelerating these gains further. This raises a number of sustainability challenges. In the health sector there are major concerns about the sustainability of the financing situation in the face of major inflows through PEPfAR – a model of financing that is Washington led and only approved on an annual basis – and the Global Fund. Specific concerns are that the health sector ceiling is reached without addressing critical basic health services, that strengthening these services is essential for consolidating gains made through the vertical funds and that ownership is compromised. 3.102 In addition, the quality challenge in education has not been met but Government is planning to introduce a more ambitious nine year basic education policy which would only serve to exacerbate the access shock felt as a result of UPE. A critical challenge for PRS2 will be to balance new initiatives with the need for consolidation in the social sectors.

55
Box 10: Health Insurance for the Poor
In 2004 only 17.5 percent of Rwanda’s population accessed ‘modern’ health services in the event of illness. Principal reasons include (i) inability to pay user fees (official and unofficial), and (i) poor quality services that were not seen as justifying the expense. In Rwanda there are three different types of cost sharing mechanism in place: government health insurance schemes; private enterprise health insurance and community based health insurance or mutuelles. Currently 12 percent of the population is covered by one or more of these schemes. Mutuelles are seen as the most affordable and sustainable option for expanding health insurance to the majority of the population. Currently most participants in mutuelles are better off formal sector workers. Estimates are that, on average, these groups pay directly for less than half of the health services they consume. In contrast participation by the poor and very poor continues to be very low. Despite a rapid expansion of mutuelles since their introduction in 1999 the membership fee collected is slightly higher than the median monthly household income in target provinces, making it too expensive for a considerable segment of the rural population. GoR is looking to expand health insurance cover to the entire population from 2006 onwards and has included funds in the 2006 budget to subsidise premiums for the poorest groups, but major issues remain on the table:
The first relates to the charging of user fees in primary health care facilities. There seems little willingness to reconsider the user fee policy despite evidence from elsewhere that such fees can prevent equitable access to healthcare;
The second relates to the sustainability of the financing model. The ability of mutuelles to mobilise resources is key but schemes financed exclusively by the rural population are likely to mobilize only limited resources and therefore provide for a very limited range of services. How other essential services will be financed is not clear.
Source: DFID Brief Private Sector Development 3.103 In 2001, registered investments to Rwanda were worth USD 169 million with roughly half coming from foreign sources. In 2003 total registered investments had slumped to USD 61 million. Up to the beginning of December 2004, RIEPA records registered investments at USD 219 million, which are expected to create in the region of 8405 jobs once fully operational (Figure 7) This is clearly a major improvement and points to a gradually improving business climate. But it is significant that in 2004 almost 80 percent of registered investments were from local sources, with only 20 percent from FDI. In addition not all investments become operational. 3.104 Table 9 shows the variation year on year in investments being registered and becoming ‘live’. The figure for operational investments in 2004 is by far the highest but it is unclear yet whether this may be the beginning of a trend. Inter-country comparisons of FDI flows suggest that Rwanda still has a lot of ground to make up if it is to reach parity with its regional neighbours (Figure 14 in Annex 2).
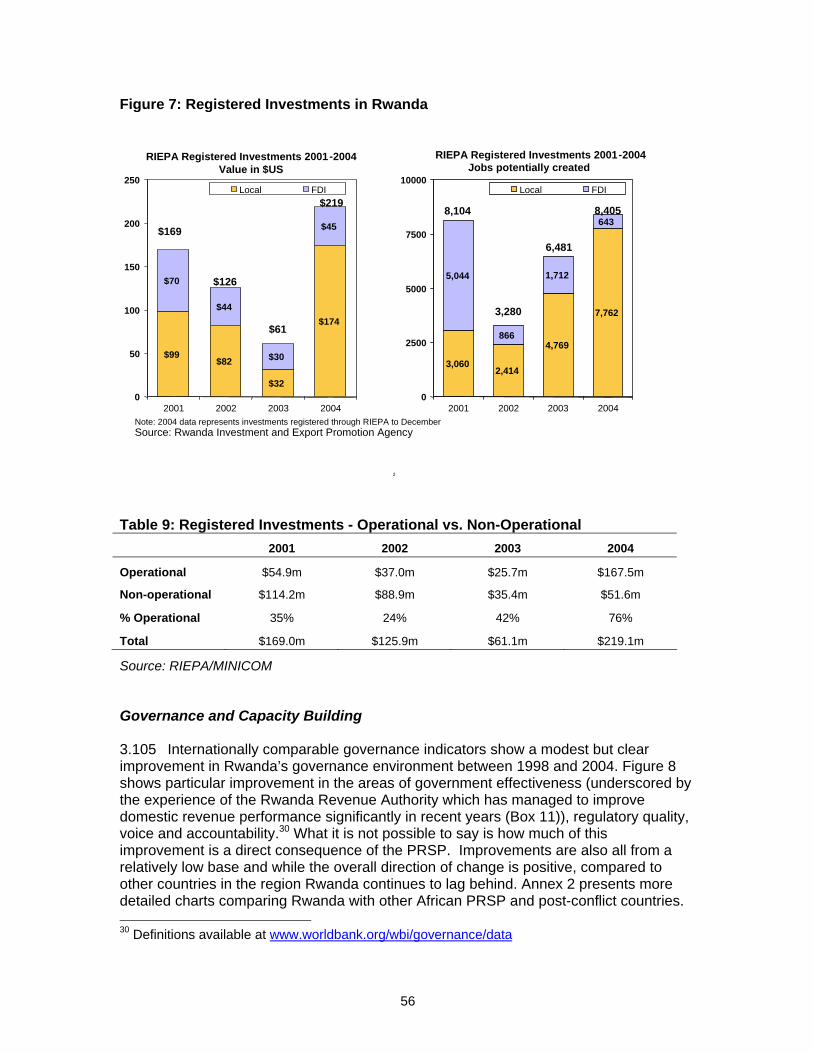
56
Figure 7: Registered Investments in Rwanda
Table 9: Registered Investments - Operational vs. Non-Operational
2001 2002 2003 2004
Operational $54.9m $37.0m $25.7m $167.5m
Non-operational $114.2m $88.9m $35.4m $51.6m
% Operational 35% 24% 42% 76%
Total $169.0m $125.9m $61.1m $219.1m
Source: RIEPA/MINICOM Governance and Capacity Building 3.105 Internationally comparable governance indicators show a modest but clear improvement in Rwanda’s governance environment between 1998 and 2004. Figure 8 shows particular improvement in the areas of government effectiveness (underscored by the experience of the Rwanda Revenue Authority which has managed to improve domestic revenue performance significantly in recent years (Box 11)), regulatory quality, voice and accountability.30 What it is not possible to say is how much of this improvement is a direct consequence of the PRSP. Improvements are also all from a relatively low base and while the overall direction of change is positive, compared to other countries in the region Rwanda continues to lag behind. Annex 2 presents more detailed charts comparing Rwanda with other African PRSP and post-conflict countries. 30 Definitions available at www.worldbank.org/wbi/governance/data
2
$99$82
$32
$174
$70
$44
$30
$45
0
50
100
150
200
250
2001 2002 2003 2004
Local FDI
RIEPA Registered Investments 2001-2004Value in $US
Note: 2004 data represents investments registered through RIEPA to December Source: Rwanda Investment and Export Promotion Agency
3,0602,414
4,769
7,762
5,044
866
1,712
643
0
2500
5000
7500
10000
2001 2002 2003 2004
Local FDI
$169
$126
$61
$219
8,104
3,280
6,481
8,405
RIEPA Registered Investments 2001 - 2004 Jobs potentially created

57
Figure 8: Progress with Governance 1998, 2002 and 2004
Box 11: Improved revenue performance - a sign of increasing government effectiveness
Strong performance in domestic revenue raising is a central plank of the improving macroeconomic situation in Rwanda, a sign of improved government effectiveness and a vital part of the country’s long term strategy of reducing its aid dependence. The latest performance figures for 2005 show total revenue performance for the third quarter of 2005 above target by 23 percent. The target was FRw 38.319 billions and total revenue collected was FRw 47.178 billions. Cumulatively, for the period from January to September 2005, total revenue collections amounted to FRw 131.8 billions against a target of FRw 114.8 billions. Compared with the same period in 2004 Q3 fiscal revenues were up by 36.4 percent, and by 12.7 percent for January-September. Q3 targets were exceeded for direct tax collection (largely through the work of the large taxpayers department), VAT and taxes on international trade, evidence that the risk of ‘moral hazard’ (for domestic revenues arising from increased aid flows may be overplayed. Nevertheless, there are those who feel that the push for increased tax collection may be hurting poor producers the most and argue that a careful assessment of how and where the tax burden is falling in terms of the income distribution is essential to ensure that a pro-poor growth strategy is not undermined, in the short to medium term, by an overly zealous domestic revenue mobilisation strategy. Source: RRA Performance Report for the Third Quarter 2005 3.106 More detailed information on progress with the governance dimensions of the PRSP is patchy. Military expenditure declined from 3.4 percent of GDP in 2000 to 2.4 percent in 2005 while RDRP progress reports indicate progress with demobilisation and the reintegration of former combatants and special groups. Nevertheless, similar to other post-conflict PRSPs while there are actions and strategies aimed at stabilising the country and reducing levels of militarization, they fall short of an integrated security

58
strategy that links some of the key drivers of the conflict with those underlying continued poverty in the country.
3.107 The work of the National Unity and Reconciliation Commission (NURC) has been significant, including delivering on the ingando (civic education camps) and a number of nationwide public opinion surveys on gacaca, democratisation and decentralisation. However there is no clear evidence of the impact of NURC on mainstreaming reconciliation into all government policies. For example the integration of civic education into the national curriculum has been a particular challenge and one that is ongoing. In outcome terms there is insufficient evidence to assess progress towards reconciliation, although given the complexity of the social and political transformation required it would not be realistic to expect or attempt to attribute significant improvements to the PRSP. 3.108 The human rights situation has improved considerably as compared to the genocide and immediate post-genocide period. The 2003 constitution and elections marked a new period of constitutional rule; however, in some domains respect for fundamental rights has not always been fully adhered to. Freedom of the press and the ability of civil society to organise and advocate remain limited. While the PRSP had included a reference to human rights in a narrow manner, concentrating on the National Human Rights Commission (NHRC), by 2005, the Commission had yet to achieve a reputation for professionalism and independence (e.g. it has never used its power to bring a case on human rights grounds to the courts). There have been institutional improvements across government associated with reforms made necessary by the 2003 constitution - highly significant has been the transformation of the judicial and prosecutorial system, with new structures and responsibilities, entrenching the separation of powers and the independence of the judiciary. It is also reported that the lowest courts are now able to deal with the case back-log resulting from the inefficiencies of the previous system as well as the delays caused by the implementation of the reform itself. Other achievements include the establishment of a new judicial national training centre, established at Nyanza as well as legal reforms to strengthen women’s rights. The reforms, however, were not primarily driven by a pro-poor objective. Whilst local level mediators (abunzis) have been introduced to render justice more accessible, there is limited evidence on their impacts – there are unpaid, untrained and with unclear relationship to the formal system. There is a shortage of legal assistance services to the poor and vulnerable groups, and further efforts are needed to help the police become accountable to local communities. 3.109 Gacaca, a PRSP priority programme vested with high political significance, has also made significant progress, though at a slower pace. Whereas the PRSP anticipated that Gacaca’s would begin in 2002, the process started with limited pilots and it is only in 2005 that the process was rolled out nationwide. The delay is in part explained by the need to prioritize the constitution and the elections in 2003. Donors are providing support through a basket fund though it is reported that this is still a very time intensive support mechanism. GoR aims to terminate gacaca trials by 2007, in line with PRSP commitments. Some commentators are, however, concerned about weaknesses in the process and fear that speed will come at the expense of quality of trials. 3.110 While progress in the formal justice system has been considerable, in the area of human resources and capacity development impact is alarmingly difficult to assess. APRs do not provide a clear synthesised assessment of improvements across all
59
sectors but rather concentrate on progress with the establishment of HIDA. There is no available outcome information relating specifically to HRD at this time. In civil service reform, later public service reform, key successes during the PRSP period include the start of the retrenchment process and the finalisation of a policy framework in 2004. However, delays in finalising some fundamental elements of the programme, such as pay reform, have created a worrying vacuum and detracted from fundamental improvements in public service performance to date. 3.111 The 2003 Constitution and parliamentary and presidential elections and the initial phases of decentralisation and the establishment of a credible justice system are amongst the most important governance achievements of the period. While some may argue that the larger progress on democratisation is in fact disconnected from the more technocratic project of the PRSP, the observation from around the world is that the development of a political culture of openness and accountability is a crucial part of creating and sustaining an enabling environment for growth and poverty reduction. There is a strong case for ensuring that these linkages also become the foundation of PRS2.

60
4. MAIN FINDINGS – PRSP PROCESS Overview 4.1 This Chapter presents evaluation findings relating to the main process dimensions of the PRSP enshrined to a significant extent in the underlying principles of the PRSP approach. Specifically the chapter covers the efficacy of the consultation and participation process, sector strategy processes, resource allocation (including priority spending and the MTEF); monitoring and evaluation and donor harmonisation and alignment. 4.2 The overall finding in relation to the PRSP process is that it is broadly satisfactory, reinforced by broad agreement amongst survey respondents that the PRSP principles have made a difference in Rwanda (Figure 9).31 Significant shortcomings also exist, however. These are discussed in more detail under each section. Figure 9: Stakeholder Views on Progress with the PRSP Principles in Rwanda
0 20 40 60 80
Country-ow ned& participatory
Comprehensive& Long Term
Results Oriented
Partnership
Sum of Responses
Strongly Agree
Agree
Disagree
Strongly Disagree
Don't know /Unsure
Source: Stakeholder Survey 31 Figure 9 shows summed responses to a series of underlying questions on the PRSP principles. The results show a fairly high level of agreement on country ownership (agree and strongly agree combined) and on the comprehensivity of the PRSP. In these two categories disagreement is mainly around the extent to which consultations have had a material impact on the policy framework in the PRS and on whether the strategy is sufficiently long-term. Less agreement overall is evident on questions relating to the effectiveness of development partnerships (where a significant number of respondents were unsure of whether progress had been made) and on the results focus of the PRS.

61
Consultation and Participation 4.3 Rwanda’s strong tradition of hierarchical and top-down government has had an obvious impact on how Government and civil society relate to one another (Box 12). From Government’s perspective there appears to be a fair amount of wariness about the idea of civil society acting as a counter-weight to state power, on the other hand in recent years there have been a series of slow, managed openings for civil society to engage directly with Government and a broad recognition of the potential role for NGOs in service delivery. This section evaluates the contribution of the consultative and participatory process to the preparation and operationalisation of the PRSP and the extent to which this process has taken on particular features because of the history and political traditions of Rwanda.
Box 12: Civil Society in Rwanda
The history of civil society in Rwanda is complex and reflects the ties and tensions in Rwandan society as a whole. Rwanda has a long and vibrant history of associational life. In the past, popular forums were mainly meant for social interaction, mutual assistance and dispute resolutions and tended to be linked to family gatherings. Producer and membership associations32, informal credit or rotational saving systems (tontines) and, perhaps most notably, the Church have an established history in Rwanda’s CS and are seen as mechanisms for building social cohesion and solidarity (ACORD, 2004). The Church also has a long tradition of being involved in service delivery (especially in health and education). Development NGOs have grown rapidly since the early 1980s, initially predominantly working in implementing development projects or delivering services. The genocide in 1994 had significant impacts on Rwanda’s CS. The social fabric of Rwanda was damaged at the same time as poverty and vulnerability increased. Some CSOs were seen as being instrumental in the genocide severely harmed the reputation of CS as a whole. Furthermore, the increased resources arriving in Rwanda from donors caused a wave of new, ‘brief-case’ NGOs to emerge raising questions about the representativeness of CSOs. PRSP Preparation 4.4 When work began on the I-PRSP in 2000 there was, therefore, already some recent history of direct consultation, and in fact the I-PRSP draws significantly on the national consultations undertaken by NURC in 1999/2000. Structured engagement with CSOs during the I-PRSP stage was very limited however. A draft of the I-PRSP was sent to a selection of NGOs (mainly INGOs and national umbrella organisations such as CCOAIB and Pro-Femme) and a one-day meeting held in September 2000. The process was rushed and CSOs were unable to provide a collective response to the draft. Many individual organisations had not been faced with such a high level policy document before and were ill-prepared to comment at the meeting. Language was a significant constraint with the consultation draft available only in English. Versions in French and Kinyarwanda were only made available in March 2001 once the full PRSP process had begun. 4.5 The participation plan prepared for the full PRSP attempted to build on past experiences and take the process of consultation with citizens even further. The National Poverty Reduction Programme (NPRP) in MINECOFIN in charge of the PRSP process 32 For example coffee and handicraft producers’ and women and youth membership associations.
62
commissioned international consultants to help plan, train and supervision the participation process. The resulting participation plan (developed into a Participatory Poverty Assessment (PPA)) involved a National Poverty Assessment and Policy Relevance Tests and the introduction of a mechanism for grass roots collective decision-making and action (the Butare pilot of Ubudehe) that would feed into longer term processes of decentralisation and financial devolution. Further consultations were planned using ‘Under the Tree Meetings’ – simple workshops held literally under the trees in villages to poll members of the community and CSO representatives on PRSP priorities - and a series of national ‘Validation Workshops’ intended to directly engage CSOs in discussing the PRSP policy framework. 4.6 The PPA was developed and implemented by an eleven person national PPA team with support from an ActionAid technical advisor. Academics from OSSEREA Rwanda Chapter based at Butare University conducted the Policy Relevance Tests. In addition a Consultative Task Force, including representatives of some national NGOs, was set up to advise the process. 4.7 Significant in the Rwandan context is the extent to which the participation plan focused on direct citizen participation over mechanisms to actively engage CSOs. The most innovative aspects were the Policy Relevance Tests, which created a participatory mechanism for clarifying and improving sectoral policies, and the attempt to combine a participatory consultative process with an approach to local level planning and collective action through ubudehe (progress with ubudehe is discussed in more detail below). 4.8 Initially there was some degree of cross-Ministry support to the PPA, as evident in both MINALOC and NURC having staffed trained in participatory techniques to carry out the PPA. Other Ministries did not show the same level of support however and were not directly engaged in the PPA. Many CSOs (both national and international) did not proactively support the PPA either, although this appears to be more the result of limited information about the PPA than any overt resistance to it. 4.9 Some critics of the PPA have since argued that the consultation process was devised and conducted by Government using their own structures as a way of controlling the process and reducing the role for civil society to play in the policy debate. The PPA did not, therefore, constitute true participation (Renard et al, 2003). However, advocates of the PPA vociferously argue against these claims and argue that it was the most innovative process in the first round PRSPs. The fact that 9000 cellules were engaged in problem solving and collective action “pushed the frontiers of participation” (Joseph 2005). 4.10 Based on the evidence available to the evaluation team the judgement is that by international standards the PPA process in Rwanda was extensive and well-oriented towards the grassroots and could be considered as one of the more innovative consultative processes amongst first phase of PRSPs.33 4.11 By contrast national consultations or ‘validation workshops’ organised to build consensus around the main policy directions of the PRSP were less inclusive. The main
33 OED’s Evaluation of the Poverty Reduction Strategy Initiative contrasts consultation processes across eight first phase PRSPs. Further reviews of the participatory process during PRSPs include McGee et al (2002) ……

63
shortcomings of these consultations identified during interviews with stakeholders and those present at the various evaluation workshops were:
They were poorly conceived. The main purpose of the meetings was unclear and it was unclear how, if at all, comments provided at the workshops would be used to improve or refine the PRSP draft.
The focus was too narrow – often sticking with the ‘safe’ social sectors and existing policies. Very little else was up for discussion.
They were too formal – relying too much on Q&A rather than group work and open exchange.
Government decided who was to be invited rather than allowing for an open forum or an agreed list of participants with CSOs themselves.
Meetings were often conducted in English, or with only English versions of related documents available.
4.12 Significantly, despite the Government’s focus on direct citizen participation there was in fact little attempt by Government to popularise and disseminate the PRSP once it was complete. French and Kinyarwanda versions of the document were available well behind the English version, and there was no attempt made to de-code the more difficult technical language for a popular audience. 4.13 Many of the more critical assessments of the national consultation process are reflective of widespread capacity weaknesses in Government and across civil society at the time of PRSP preparation. The PRSP was a new process all round. The NPRP in MINECOFIN was under considerable pressure to deliver because of the PRSP/HIPC timetable. The PRSP also dealt with some highly technical issues that CSOs at least were not used to engaging with. Many smaller, local CSOs felt alienated from a process that they viewed as largely technocratic. These organisations felt up against the power of MINECOFIN and did not know how they fitted into the process or how to critically engage with the Government. INGOs that were linked into international networks did try and make up for some of the capacity shortfalls in national organisations. But this caused its own problems with national organisations feeling crowded out by INGOs34. Operationalising the PRSP 4.14 Notwithstanding some of the criticisms of the consultation phase, by early 2003 several CSOs had started to organise themselves into sectoral interest areas to engage more closely with policy development. The creation by Government of the ‘cluster system’ provided CSOs (mainly INGOs and national umbrella organisations) with the opportunity to participate in the elaboration of some sector policies, although the clusters have worked unevenly and their different dynamics mean that in some instances NGOs have been largely absent from policy discussions (e.g. agriculture, social protection). 4.15 The general increase in ‘policy activity’ surrounding the PRSP has increased the number of opportunities – both invited and uninvited - for CSOs to engage directly in dialogue on poverty and related policies. Some notable cases are:
Pro-femme has been active in developing gender policies CCOAIB has been ‘invited’ by Government to engage in discussion on the
development of policies on a number of different issues 34 INGOs are also donors to many national CSOs contributing to this power imbalance.

64
LandNet, the Rwanda office of an Africa-wide initiative on land and hosted by RISD, has been actively engaged with MINITERRE on land issues, encouraging the Ministry to prepare a land policy before submitting a revised Land Law to Parliament. While this engagement pre-dates the PRSP more recently LandNet has pushed successfully (after involving the President and Cabinet directly) for widening the net of land registration to plots below one hectare and ensuring inheritance rights for women – both significant areas of PRSP framework.
CESTRA the trade union umbrella organisation has successfully engaged with the Secretary General of Privatisation on the protection of workers.
RMF, the Rwanda Microfinance Forum, has also been successful in lobbying for an alternative set of recommendations for the Micro-Finance Policy. Initially invited to a validation workshop RMF were able to get a draft of the policy in advance and make a case for an alternative approach.
While not a policy forum per se, since January 2005 CSOs have also been involved in the Development Partners Coordination Group (DPCG), attending the first annual DPCG retreat in Gisenyi.
4.16 The policy space for CSOs remains carefully managed by Government, however. The NGO unit within MINALOC retains a fairly tight reign on NGO registration. Recent speeches made by the Minister of Local Government make it very clear that the Government favours a civil society that sees itself as a partner in service delivery and the development process, rather than as any kind of check on Government.35 The emphasis is on NGO engagement that is constructive and value-adding and not directly oppositional. Figure 10 points to a split in opinions about how far Government-CSO collaboration has improved during the PRSP period. Figure 10: Survey Responses on Government CSO Collaboration
0 2 4 6 8 10 12
Govt-CSO collaboration hasimproved under PRSP1?
NGOs/CSOs are more focused onpoverty reduction as a result of the
PRSP process
Adequate mechanisms exist forparticipation in PRS monitoring &
reporting.
Number of responses
Strongly Agree
Agree
Disagree
Strongly Disagree
Don't know /unsure
35 “There are two debates on the role of civil society organisations in developing countries by international scholars. On one side civil society is a counter power to government and on the other civil society is seen as an effective partner in service delivery and the development process. Rwanda favours the latter approach” (Minister Protais Musoni Building a democratic and good governance culture: Rwanda’s experience and perspectives. June 2004 Kigali)

65
4.17 No written evidence was shared with the evaluation team on the involvement of Parliament in the PRSP process though interviews suggest that members of the (appointed) Transitional National Assembly were consulted on the PRSP draft. There does not seem to be any more formal linkage however between the PRS and the now fully established Parliament. While Parliament is involved in the budget process they do not see the MTEF or the outer year estimates when reviewing the annual budget. They also do not see the APR. And while questions to Ministers are posed in relation to the 2003 political programme it is not clear that the same is true of the PRSP. The Parliament is also still in a process of learning and consolidating its newly found autonomy, and therefore not surprisingly it is the executive that remains the dominant branch of government. Strengthening the engagement of Parliamentarians in holding government to account for its implementation of the PRS, and in communicating progress to constituencies is likely to be an important theme of PRS2. Ubudehe 4.18 Government’s preference for direct citizen engagement in the policy process is captured in the nationwide roll out ubudehe. Because of the focus given to ubudehe in the PRSP it is given separate attention in the evaluation. The findings presented here should be read in accordance with those presented under the governance and decentralisation section in the previous Chapter. 4.19 The key strength and innovation of the ubudehe programme, according to the Government, was the “direct link to the planning and budgeting processes of formal government structures” (MINACOFIN and MINALOC, 2001:2). In the PRSP, ubudehe was seen as a process to develop bottom-up budgeting and planning systems that articulate communities’ needs, building on local government structures of Community Development Committees. This method of collective planning and action was planned to become the “direct basis for decentralised planning and budgeting through the district level Medium Term Expenditure Framework” (ibid). 4.20 Ubudehe does feature to some extent in Government processes. Since 2004, ubudehe funds have come under the general coordination of the Common Development Fund (CDF) although capacity issues have led to problems in disbursing and using CDF funds (EURATE, 2005:13). There is also a defined role for District offices to manage ubudehe processes (technical advice, acting as conduit for funds and collating and submitting reports) and the 2004 APR refers to ubudehe as a planned activity for the Governance and Decentralisation sector. 4.21 However, beyond this, it appears that ubudehe remains largely independent of the main government activities at district level and is not meaningfully linked to the broader decentralisation programme.36 An independent evaluation in 2003 noted that
36 In terms of funding, the EU now funds ubudehe through a broader ‘EDF Decentralised Programme for Rural Poverty Reduction’ (EURATA Consortium, 2005) which includes objectives such as ‘developing an efficient transparent and accountable fiscal and financial management system at local government and grassroots level’ and ‘strengthening participatory local government planning for local ownership of the development process’ (p.8). However, this is not indicative of the full integration by Government of ubudehe into broader decentralisation structures and processes.

66
MINECOFIN and MINALOC were leading initiatives to integrate ubudehe into decentralised governance structures and in particular the planning and budgeting at District level (KPMG, 2003:18) but beyond the integration of ubudehe into the CDF, these initiatives were not evident and future plans for ubudehe appeared vague. The small Ubudehe Unit in MINALOC has expressed interest in moving into MINECOFIN so that it can play a more central role in integrating into decentralised planning and budgeting but this has not yet been decided. 4.22 It also appears that ubudehe is losing momentum at the national level. Initially, a team of 12 master trainers37 was set up to initiate the cascade system of training trainers. This system was highly effective. The number of trainers has now reduced at the national level as trainers are redeployed to other jobs. As a result, only 2 of the original 12 master trainers are remaining (KPMG, 2003:44). At the time of the evaluation it was not clear whether new master trainers had been trained to maintain capacity at the national level. 4.23 The involvement of CSOs in ubudehe also remains minimal. ActionAid continues to be very involved and has one full-time employee seconded to the ubudehe unit in MINALOC. But other INGOs and Kigali-based national NGOs have shown limited interest in linking into ubudehe activities. Although some argue that this could also be due to the bigger problem in Rwanda of organising and disseminating information, rather than direct hostility to ubudehe.38 4.24 There is some evidence that local level CSOs are involved in ubudehe activities and have either trained as facilitators or are members of committees. Although there are limited formal links between the different actors, it is thought that there remains the possibility of skills transfer. Evidence suggest, however, that it is unlikely that the links between CSO and ubudehe activities will be made unless concerted efforts are made to (a) strengthen the capacity of CSOs and the ubudehe unit to understand the potential of linking up and, (b) being able to gather and use information effectively to inform policy outcomes; something which has not yet been forthcoming. 4.25 Finally, ubudehe relies on one donor - the EU - for the majority of its funding. The EU entered into an agreement with the Government in 2002 to contribute €1 million to facilitate the implementation of ubudehe. There have been some delays to the disbursements of this funding. Trainers were trained in 2001 and started working with communities to develop collective action plans. However, the first tranche of EU funds were only received at the end of May 2002 and received by cellules by August/September 2002.The second tranche was received in February 2003. This caused obvious delays to implementation and may have contributed to the prolonged roll-out of the programme. There are also obvious sustainability issues for the ubudehe programme unless it is fully integrated into the core business of Government. 4.26 The potential nevertheless remains for local level planning and action on poverty issues, particularly as a response to a longstanding political tradition of top-down and
37 The Master Trainers were the PPA National Team mentioned in Section 3.2.1. 38 Despite attempts by the Government to disseminate information on ubudehe with the expressed intention of clarifying a term that is “vulnerable to interpretations which link it to images of rural people engaged in outdated actions” (MINECOFIN, 2003:3), the activities are not well known and are still open to misinterpretation.

67
hierarchical state-society relations. There are signs that ubudehe has increased the level of problem-solving capacity at the local level, while there are some very successful cases of small-scale collective action contributing to livelihood changes (Box 13). District Development Plans are also an effective level of planning for citizens and CSOs to engage with, but more needs to be done through the decentralisation process to ensure that the opportunities are available. In line with recommendations from the ubudehe technical advisor, the Government should continue to support the household level analysis and assistance for poor families while at the same time expanding ubudehe work to feed into sector level plans. This would, it is argued, dove-tail into CDF responsibility and contribute to District plans and budgets. Box 13: Ubudehe - Impact on Livelihoods There are some very successful cases of small collective action contributing to significant changes in livelihoods. For example, ubudehe funds in one cellule were used to build boats to open up trading opportunities with another district across the river. In another cellule the profit made from goat rearing was spent on fertilizer for small vegetable patches. The money raised from the sale of vegetables was then used to build a grain store. These processes have obviously contributed to building community capacity to plan and carry out collective actions and individuals are more confident to participate in other processes due to the knowledge gained through ubudehe. That said, the household level activities supported under ubudehe appear to be similar to participatory micro-credit schemes that have been introduced in other countries. This element of ubudehe also resembles the traditional tontine associations. The households receiving the funds understand their rotational character, meaning that the funds are repaid in order to benefit another household. It could be argued that the time and resources required to set up and implement this ubudehe process are not altogether necessary and a more straight forward micro-credit scheme would be easier to implement and monitor. According to its proponents, however, this argument ignores the other benefits that ubudehe can bring to communities, as mentioned above, such as building the capacity of communities to work together and engage in development processes Sector Strategy Processes 4.27 Judging the effectiveness of prioritisation and costing across all the priority areas is problematic given the limited amount of routine data available in most sectors. From an aggregate perspective prioritisation appears uneven with some confusion and inconsistency between the different types of priority programme across the various sectors, such as between those defined as priority areas, core programmes and/or exceptional expenditures. One example is gacaca which is a core programme in the PRSP but also an exceptional expenditure, while prisons, along with the police are classified as a priority (not core) while the feeding of prisoners is classified as an exceptional expenditure. While not described as priority or core programmes the governance commissions are classified as exceptional expenditures, along with some of the institutes of higher education (mainly because of expatriate staffing requirements in the post-genocide period). 4.28 Some of the priorities also seem of very different orders of magnitude, for example, small scale agriculture and livestock intensification is a core programme but of a rather different order to primary school textbooks, while adult literacy seems oddly prioritised as a core programme without an equivalent core focus on basic education.

68
The development of sector strategies is clearly a priority but not obviously a core programme. 4.29 Some of the confusion emanates from the multiple processes of prioritisation employed during the PRS preparation process, as well as the need to combine existing and new priorities (particularly those to which donors are most sensitive) and the lack of clear priorities on which to build from existing sector strategies. 4.30 The attempt to apply consistent criteria for the prioritisation of public expenditure (section 5.3 of the PRSP) was an important innovation in the Rwandan PRSP but appears to have been of only limited value-added as a tool for carrying forward a consistent prioritisation process throughout the strategy and in developing subsequent sector strategies, as later arguments will attest. Sector Strategies and Inter-Sectoral Working 4.31 Although detailed prioritisation processes have fallen short, the PRSP has undoubtedly helped to bring about tangible improvements in sector working through the development of various sector strategies and related policies. Sector strategy processes have further helped influence government in prioritising a poverty focus, particularly in education (UPE, capitation grants), water (affordable and sustainable water services in rural areas), and health (payment of premiums for mutelle de sante for the poorest groups). 4.32 Given the generalised weaknesses of the planning process prior to the PRSP, and the lack of sectoral policy frameworks or mechanisms for coordination at sector level, (education is the most important exception) almost all stakeholders interviewed agreed that developments in this area represented a key success for government and the PRSP. As noted by one government official “the PRSP started sector thinking in Rwanda.” It also brought prominence to the need to build coherence between planning and budgeting and to instituting realistic frameworks for monitoring and evaluation. The process nevertheless continues on a steep learning curve. 4.33 That said, the impact of ‘sector thinking’ on the quality of planning and budgeting is significantly tempered by uneven implementation progress within and across certain sectors. Policy development remains highly uneven, as does the quality of intra-sectoral prioritisation processes. Fundamental decisions about key intra-sectoral priorities are still to be made. Some sector strategies have only just come on stream towards the end of PRSP1 and several are still not fully operational. Government stakeholders tend to ascribe weaknesses in the strategy process to the rushed PRSP timetable (particularly initially), uneven donor support, and to weak initial conditions and capacities at Ministry level for preparing holistic sector plans. Other respondents, particularly outside of government, noted with some concern that ministry level annual action plans linked to the Government’s political programme of 2003 continue to hold more weight than sector strategies in the day to day work of government decision-makers. 4.34 Sector strategy processes vary widely, with some much more participatory and inclusive than others, and some much more detailed and action-oriented than others. Few are truly results oriented. All sector strategies make the conceptual link with the PRSP, but few develop it operationally. The link between policy and programme objectives and their expected contribution to poverty reduction is only weakly developed

69
and the link to affordable financing frameworks through sector MTEFs is still patchy. The Country Financial Accountability Assessment (CFAA) of June 2005 notes the continuing problem. “The enormous strides made with the introduction of the MTEF are mitigated by the lack of sound strategic plans in many sectors. Such plans are meaningless if they cannot be translated into realistic budgets...” Respondents point to persistent problems with prioritisation and costing at sector and sub-sector level and to the inadequacy of intra-sector discussions, particularly at decentralised levels, on policy and programming options. Resource Allocation and Mobilisation Priority and Non-Priority Spending 4.35 The prioritisation of expenditures as part of the PRSP has proven to be a crucial implementation tool for GoR. Priority expenditures provide the bridge between the budget and the strategy (PRSP and Vision 2020) and allow GoR to track its internal alignment with the broad goals of the PRSP. 4.36 Aggregate trends for priority sectors indicate satisfactory performance overall and a serious effort on the part of GoR to operationalise the broad priorities of the PRSP. However, a number of issues are worthy of consideration in the next phase.
In practice the definition of priority expenditure is a weak one. The PRSP itself stipulates fairly detailed criteria for identifying priority expenditures, including whether they are clearly additional to what the private sector or communities provide and whether they are in line with priorities expressed by communities. In practice these criteria appear not to be widely understood or appreciated at sector level – most priority programmes are only weakly linked to PRSP/MDG achievement.
In 2005 there were 24 priority areas in the GoR budget.39 Some of the ‘relaxation’ of the definition of ‘priority expenditure’ is undoubtedly linked to upward pressure from line ministries looking to protect future budget allocations, but funding remains below what is required to fully implement all priority programmes which further undermines the priority concept and creates a disincentive for non-priority programmes to relate to the poverty reduction agenda.
While budget allocations to priority sectors have increased, intra-sectoral allocations – at sub programme level – have not always been consistent with PRSP priorities. In 2004, for example, budget allocations increased both for health and education but were found to have increased more for tertiary than primary or secondary level services.40 Broad allocations to priority programmes
39 The selection appears increasingly arbitrary, most recently illustrated by the inclusion of the electricity sector as a priority area in 2005. Electricity is a clearly a priority for growth and future poverty reduction, but its inclusion in the 2005 budget was a response to a crisis rather than the consistent application of poverty reduction criteria across the whole of the government budget. 40 In education, teacher training, text books and education inspection did not receive adequate funding, especially in secondary education. In the health sector, basic health services and access to health services were under-funded while provinces received only 64 percent of the promised health budget. In contrast tertiary health received in the region of Rwf 1 billion more than budgeted (Joint Budget Support and PFM Review 2005).

70
are not, therefore a good indication of whether or not public spending is more or less ‘pro-poor’ (Box 14).
4.37 The recommendation is that a thorough review of what is meant by priority spending and how it relates to the full set of tax, spend and regulatory instruments available to government to tackle poverty should be part of the self-evaluation phase preceding preparation of PRS2. Box 14: Tanzania - From Priority Sectors to Outcomes A review of the Tanzanian MTEF in 2002-341 noted that although the MTEF was comprehensive of virtually all public resources, sector analysis was limited to priorities identified in the PRSP. Together, priority sectors accounted for some 60 percent of planned expenditure, and therefore a significant slice of government spending, however it meant in practice that priorities across a further 40 percent of public expenditure were not fully addressed through the MTEF. The study noted “Since these tend to be areas in which expenditures are being even more severely constrained, prioritisation between programmes and cutting back on non-essential expenditures are of equal relevance to ensuring a more effective and efficient use of resources as focusing on the PRSP priority areas”. The second Tanzania PRS - the National Strategy for Growth and Poverty Reduction – draws a similar conclusion arguing that in spite of the significance of the priority sector approach in PRSP1, “the resources in them were not sufficient to achieve the envisaged goals and targets over three years”. For this reason the NSGRP adopts an ‘outcomes-approach’ which counts on the contribution of all sectors to specific outcomes on growth, improved quality of life, good governance and equity. The approach encourages inter-sector collaboration and a more rigorous prioritisation across all of government spending in devising more efficient ways of achieving these outcomes. Medium Term Expenditure Framework 4.38 The key goal of an MTEF is to create a context of policy and resource predictability ensuring that flow-of-funds are timely to allow budgets to be executed efficiently and effectively. With its medium term outlook the MTEF is potentially a critical instrument for implementation of the PRSP through the government budget.42 4.39 The MTEF in Rwanda is regarded as something of a success story. The recent CFAA (2005) notes that the introduction of the MTEF represents a significant enhancement to Rwanda’s PFM. There are signs of improved budget predictability and a more rational approach to budget preparation and implementation. A government wide training programme in strategic planning since early 2000s (which includes MTEF training) also means that the MTEF is probably more widely understood in Rwanda than in many comparable PRSP countries. A review of the MTEF in 2003 also noted that because the MTEF was developed more or less hand in hand with the PRSP, this provided an opportunity to link PRSP priorities to spending projections more or less form the outset. 41 Bird, A. (2002) Undertaken as part of a multi-country study assessing the design and application of the medium term expenditure framework as a tool for poverty reduction in selected African countries. View the synthesis paper and individual country case studies at www.odi.org.uk/cape/publications. 42 Holmes, M. and Evans, A (2003) A Review of Experience in Implementing MTEFs in a PRSP Context: A Synthesis of Eight Country Studies. ODI/CAPE. May.

71
In practice major challenges remain. Interviews and documents reviewed for the evaluation confirm that many of the challenges noted in the 2003 are still on the table. Specifically in relation to the PRSP:
The lack of sufficiently elaborated sector plans has hindered full realisation of the benefits of the MTEF.43 It also means that costings underpinning the MTEF do not cover the full extent of the PRS agenda or its long term (beyond 3 years) resourcing implications.
The lack of budget unification continues to undermine optimal resource allocation (now not expected in full until 2008!). As a result linking budgets and expenditures to performance in both the MTEF and PRSP is a serious concern.44
Budget predictability has improved slightly but continues to be hampered by the uncertainty of the resource envelope. Domestic resource mobilisation has improved significantly, while some external flows continue to be problematic.45 The cash budget also does not sit comfortably with the MTEF. While no MTEF provides a guarantee of additional resources, the fact that ministry staffs responsible for budgets have not seen the supply of financial resources necessary to deliver on projected outputs has risked undermining the credibility of the process, including the value-added of the PRSP.46
The development of an MTEF is impossible if the civil service structure cannot respond to the needs of service delivery. The MTEF process itself is also capacity intensive. While capacity development has been a priority of government since 1998, and the process of rebuilding a devastated civil service is inevitably a long one, there are still many uncertainties about the public service reform programme that are at risk of undermining confidence in strategic government processes.
The MTEF is not currently presented to Parliament, nor does the presentation of the Annual Budget include the two outlying years of the MTEF. This would appear to drastically reduce its value as an instrument for building consensus (around policy priorities) and predictability. In addition discussions at Cabinet level tend to be limited to discussing the pre-prepared resource ceilings and budget guidelines rather than broader issues and priorities at the outset of the MTEF process. This may explain difficulties in enforcing ‘hard’ sector ceilings and the number of policy decisions that appear to be taken outside of the MTEF/PRSP framework.
4.40 GoR has made consistent efforts to implement an MTEF and link it to the PRSP. MTEFs now exist for most sectors and are being rolled out to districts as part of the ongoing decentralisation process from 2006. However the whole of government MTEF still needs work to make it the major strategic output of the annual budgetary cycle. Key 43 CFAA, Joint PFM Review, APR 2004 44 Indications that GoR might be planning to continue its National Investment Strategy process in the format of a separate 5 year national investment plan seems a retrograde step in the context of efforts to bring about increased budget and planning integration through the MTEF and PRSP. 45 The recent independent evaluation of PGBS finds that while the regularity of GBS in absolute terms has been erratic, compared with the disbursement record of projects it is substantially better. According to the latest Annual Economic Report for 2004 (MINECOFIN 2005) the implementation rate for the development budget in 2003 was 67 percent (an improvement over the previous average of 50 percent) but the rate of project disbursements is about one third to one half lower than that for GBS. 46 Review of MTEF 2003 and respondent interviews 2005

72
issues for the next phase include involving Cabinet earlier in MTEF discussions, systematising sector expenditure reviews across government and analysing expenditure priorities across all sectors, concerted efforts to integrate the recurrent and development budgets, and using the MTEF document as a basis for wider consultation with Parliament and other stakeholders on the government’s programme. Monitoring and Evaluation 4.41 The PRSP commits to monitoring of the strategy at two levels (a) indicators would measure and analyse the type of changes occurring in the population’s living conditions; and, (b) monitoring through sector strategies would include the resources allocated to different poverty reducing programmes and the results of these programmes in terms of outputs, quality of service delivery and outcomes. To guide the monitoring process the PRSP lists a core set of national targets closely linked to the MDGs (Annex 1) and some 50+ poverty monitoring indicators structured according to the main themes of the PRSP. 4.42 The institutional framework for PRSP and poverty monitoring was intended to build on existing structures of data collection and analysis across government, 47 with additional elements for assessing the impact of government programmes on living conditions. Significant is the attempt to clarify partnerships and divisions of responsibility among the Statistics Department, the Poverty Observatoire and the Budget Department/CEPEX (responsible for monitoring inputs and linking PRS and MTEF input/output monitoring), line ministries and local administrative structures. Notably, however, no roles in PRS monitoring are assigned specifically to civil society or the private sector. Also notably absent is any real focus on evaluation (as distinct from impact assessment). This may reflect of a post-war legacy that tends to shy away from detailed assessments of the effectiveness of past public actions, preferring instead to focus on current and future actions. 4.43 In the underlying logic model of the PRSP, monitoring and evaluation occupies a central place in terms of supporting a culture of learning and review that can adjust future policies and public actions to increase the relevance and impact on poverty, and as a means for DPs (primarily through the Annual Progress Report) to review progress and make objective judgements about future types and levels of support. In the case of Rwanda, there has definitely been some progress on at least some aspects of this agenda.
47 Exactly what existing structures - beyond the Poverty Observatoire and Statistics Dept. within MINECOFIN - is unclear. Thin et al (2003) suggest that such structures, to the extent that they existed across government were in fact unused to making sense of monitoring information relating to poverty and that their experience of assessing the efficacy of anti-poverty strategies was very limited.

73
Poverty Monitoring 4.44 The ECIV, PPA, DHS and CWIQ/QUIBB all contributed analytically to the preparation of the PRSP but their role in annual poverty monitoring has remained limited because of the inevitable elapsed times between each scheduled survey. The second DHS is due at the end of 2005, although signs are that this will probably not happen until early 2006. The ECIVII is due to be completed in October 2006 – training is currently underway. The most recent CWIQ was in 2003. A new Agricultural Survey is underway in 2005, designed to cover a sub-sample of the ECIVII, which provides a real opportunity to link changes in agricultural production to a more comprehensive assessment of living standards in rural areas. 4.45 Beyond data collection, however, the challenge is of linking data, analysis and strategy to tell a more detailed story of progress with the PRSP and poverty reduction. Routine MIS data has contributed relatively little over time, although there is a culture of reporting at all levels of government and there are signs of improvement in some sectors (education and health especially). Citizen Report Cards are underway to get a picture of service delivery changes and the perceptions of poor people. Public Expenditure Tracking Surveys have added value but the capacity to make good use of data in the implementation and management of PRSP programmes remains a major challenge. Institutional Framework 4.46 Although the PRSP set out clearly defined roles and responsibilities for the Poverty Observatoire, the Statistics Department and the Budget Department in practice these divisions have not added up to a fully coherent ‘whole’. The PO has tended to focus most of its efforts on basic information needs and data analysis rather than on the strategic coordination of PRSP monitoring across the government system. The Statistics Department has focused largely on the gathering of economic statistics while the Budget Department has concentrated on input monitoring (priority spending) through the MTEF and annual budget process, with limited attention to results. 4.47 In 2005 the situation has changed with the creation of a National Institute of Statistics representing a fusion of the former Statistics Department in MINECOFIN and the Bureau of Census. The PO in MINECOFIN has also undergone a reformulation to focus it more firmly on delivering a new framework for M&E developed during 2005 (Box 15) Box 15: A New Framework for Monitoring and Evaluation Experience to date has revealed problems arising from the lack of a clear and coherent framework for M&E across government. In response MINECOFIN, in consultation with others, has devised a new framework or ‘system’ for M&E intended to provide:
a clear evidence base for policy making an accountability framework in which agencies responsible for budgets can be scrutinised
for their use of funds a basis for harmonised reporting to donors and partners, and an instrument for disseminating information publicly and incentivising those involved in
delivering the PRSP to address priorities and targets. The starting point for the framework is a small number of clearly expressed ‘high-level’ objectives and targets in every sector, articulated in sector plans and based on the Vision, PRSP and MDGs. For each objective/target there should be two or three key performance indicators (KPIs) that measure whether progress is being made through the achievement of intermediate

74
objectives/outcomes. KPIs need to be relevant to the objective, a fair basis on which to assess institutional performance, precise and unambiguous and easy to collect new data on each year. Sector clusters are envisaged as key fora for dialoguing with partners about sector objectives and key performance indicators. Each sector is expected to complete a monitoring framework as part of ongoing sector review process with links made between inputs (share of national budget allocated to the sector and budget execution rates), outputs (goods and services provided) and KPIs (access and satisfaction with services and changes in wellbeing). Slightly behind schedule the proposed M&E Framework was discussed by Cabinet late in early November 2005 and is due for roll-out during early 2006, ahead of the next scheduled APR. Annual Progress Report (APR) 4.48 Conceptually the APR is intended to provide an overarching account of progress and challenges with PRSP implementation. It is meant to have both a backward and forward looking element that feeds into the annual planning and budgeting cycle across government. The more that line Ministries and DPs can align their own assessments of progress with the APR, the more streamlined and effective the process is expected to be. 4.49 The Rwanda APR started in 2002 with performance reviews in 4 priority sectors. By 2004 it covered all sectors, although the levels of review and reporting remain very uneven. The APR for 2002 mainly tracked progress with the evolution with sector strategy processes given the short elapsed time following endorsement of the PRSP. The 2003 APR was late and hence missed the beginning of the budget year largely because of a much more comprehensive participatory process (Box 16). The APR 2004 was on time, less participatory (although still inclusive across government) and included a review of macroeconomic policy and PFM for the first time. This was the first time in which the APR was completed in time for the annual budget process with the possibility that it becomes integrated with the Budget Framework Paper in 2006. 4.50 Interviews with stakeholders revealed a range of opinion on the value-added of the APR. Within MINECOFIN the view is that the PRSP stressed the importance of M&E across government really for the first time. In this context, as one official put it, “the APR is the strongest instrument available to us.” At sector level views diverge slightly. In education and health the view is that the APR has added value drawing attention, if nothing else, to the need to further improve M&E systems. However, MTEF/Budget and donor reporting demands continue to exist separately and continue to place additional burdens on the sectors. In other sectors, particularly agriculture, governance and PSD there is little evidence that the APR has added value to internal or external reporting. It appears that government departments and autonomous agencies in these sectors have yet to realise the importance of the process, while coordination of information gathering continues to be difficult in sectors with multiple Ministerial responsibilities (governance, rural). There are nevertheless some interesting initiatives to report, including efforts to stimulate grassroots monitoring of the PRSP under the aegis of the APR (Box 16).

75
Box 16: CSO Participation in the APR A number of CSOs have actively engaged in monitoring and reporting on the PRSP. At the central level, CSOs have contributed to last two Annual Progress Reports (APR). CSOs were not involved in the 2002 APR conducted in 2003 which lead to widespread criticisms from donors and CSOs. The Government changed the procedure in 2004 for the 2003 APR. A workshop, jointly organised by Trocaire and MINECOFIN, was held in February 2004 on the APR process. During the meeting a Civil Society Committee was formed. The Committee consulted with CSOs on how they wanted to engage in the process. CSOs were included in sector working groups responsible for drafting sections of the APR. There were also mechanisms for CSOs working at the grassroots level to feed information about the implementation of policies into specific sectors. This process severely delayed the production of the 2003 APR (from June to October 2004). It also resulted in, what Government referred to as ‘over-participation syndrome’. The result was that the consultation process was scaled down for the 2004 APR (conducted in 2005). A draft of the APR was sent to CSOs and 12 CSOs, representing the National CSO Platform and the INGO Network produced joint comments on the draft. A big achievement in this process was that both national and international CSOs worked together to produce the first formal and unified submission to Government. 4.51 As far as DPs are concerned the APR is improving, but it still falls short of expectations. Views at the evaluation workshop confirmed that it is not yet regarded as a credible progress report on poverty reduction outputs and outcomes. Amongst respondents to the survey the vast majority disagreed with the statement that the M&E framework in PRSP1 was clear and effective. Links with the budget remain weak, although plans to integrate the APR with the Budget Framework in 2006 are clearly a step forward. Meanwhile external demands for M&E continue to grow, for instance, the PRSC operational policy matrix places detailed conditionality on sector policy implementation requiring M&E systems, including feedback from beneficiaries through PETS and Citizen Report Cards. 4.52 Part of the challenge in developing a comprehensive APR is that, notwithstanding pressures from donors, the internal demand side for M&E is only now beginning to emerge. As noted by one respondent “there is very limited use of statistics and other forms of data in policy and planning”. What is required are efforts that bring the demand and supply sides together, with assistance to line Ministries to exploit relevant data to the full. A promising recent example is underway in MINALOC which is planning to carry out a pilot survey during 2005 using Citizen Report Cards and Community Score Cards to evaluate basic social services in selected provinces and districts in Rwanda. The pilot will concentrate on evaluating basic health and education services but with collect some information from other sectors where linkages exist such as water/sanitation, justice and administrative services (ibid). There is the potential for the Community Score Cards to be linked to the extensive ubudehe infrastructure as a way of being able to immediately target citizen groups at cellule level that have experience of participatory processes. It would also be an opportunity to strengthen the role of ubudehe in decentralised planning and budgeting.
76
Box 17: Grassroots engagement in PRSP monitoring In response to a finding in 2003 APR that there was a need for a greater flow of information between poor people and government service providers Health Unlimited, an INGO working in Rwanda, began the Irirwa Project – Giving Voice to Rural Women and Youth - in 2004. Linked to the idea of Citizen Report Cards the project is a response to a call from MINECOFIN that rural women and youth civil society organisations, in particular, be enabled to support government efforts in monitoring the implementation of the health priorities in the PRSP., Through regular meetings with policy makers and service providers, an interactive newsletter and community theatre local CSOs are enabled to contribute to national health policy discussions. CSOs provide feedback to District Health Management Teams (DHMTs) and Community Development Committees and contribute to policy discussions. The project aims to give CSOs, DHMTs and CDCs a clear understanding of the health content of the PRSP and to build CSO capacity to monitor health objectives in the PRSP. Source: Health Unlimited – Irirwa Project Donor Alignment and Harmonisation 4.53 The PRSP states that Government prefers to receive resources from international donors on the most flexible terms. Given the preferences of many donors to provide project support rather than budget support, however, the PRSP sets out three key principles for guiding the delivery of external assistance:
Projects should be conceived within a sector strategy and consistent with priorities of the sector;
Projects should have cost structures appropriate to the Rwandese economy. For instance, tendering procedures should not exclude local contractors by imposing unrealistic requirements;
Development partners should consult the Government’s Proposal Guideline Document for donor implementation of the PRSP (soon to be finalised) and the joint donor and Government document ‘Guidelines for Productive Aid Coordination in Rwanda’.
4.54 While the language and aspiration of these principles are relatively modest by current standards, the emphasis on alignment with sector strategies and building on country systems and guidelines are nevertheless firmly in accordance with post-Rome thinking on good practice aid principles. Since the finalisation of the PRSP both Government and the donor community in Rwanda have been active in moving ahead with a more far-reaching agenda on alignment and harmonisation which includes:
Establishment of a Development Partners Coordination Group (DPCG) in late 2002. Since January 2004 the DPCG has met monthly.
Establishment of a Budget Support Harmonisation Group in 2002 which meets quarterly and development of the Partnership Framework for Budget Support Harmonisation in late 2003 to push forward harmonisation specifically amongst budget support donors.
Development of ‘cluster system’ to support the evolution of sector strategies and provide a focal point for structured government-donor dialogue on sector-wide issues.
Creation in 2004 of a Harmonisation and Alignment in Rwanda of Projects and Programmes Group (HARPP) initiated through the DPCG and designed to build on the recommendations, principles and best practices from Monterrey, Rome,

77
and OECD/DAC etc. HARPP is expected to complement to the BSHG in taking forward the harmonisation agenda in Rwanda.
January 2005 MINECOFIN created an External Finance Unit charged with handling all elements of aid policy including the negotiation of individual aid programmes and the harmonisation and coordination process. There is limited evidence yet on how this is working.
September 2005 work began in preparing an Aid Policy Document setting out government’s policy on external finance, guide the aid management process and enhance the overall effectiveness of aid in achieving poverty reduction.
4.55 The overall impression is that substantial achievements have been made in alignment and harmonisation (A&H). Findings from the stakeholder survey show broad agreement that donors are aligning their assistance to PRSP priorities and that donor coordination has improved since the process began (Figure 11). Development Partners noted in their evaluation workshop that alignment between donor programmes and the overarching policy framework of the PRSP had improved over time. They also noted a range of coordination arrangements, especially the Partnership General Budget Support (PGBS) and the clusters for education and health, that have been instrumental in better aligning DP activities with government objectives. Several DPs noted a recent reinvigoration of sector/area specific clusters that had been dormant in earlier phases of the PRSP (rural development) and a general contribution of clusters to improved sector dialogue and, in selected sectors, to the coherence of technical assistance. Figure 11: Survey Responses on Donor Behaviour
0 2 4 6 8 10 12 14
Donorsrespectedcountry
ow nership
Donors arealigning theirassistance toPRSP priorities
Donorcoordination hasimproved since
the PRSPprocess began
Number of Respones
Strongly Agree
Agree
Disagree
Strongly Disagree
Don't know /Unsure
4.56 Other good practices in evidence in Rwanda include the sharing of key personnel among donor agencies, seconding personnel paid by one donor agency to another and the development of silent partnerships among donor agencies e.g. SIDA is a silent partner of DFID in supporting the education sector, while DFID and the Netherlands Embassy share an economist, DFID has seconded a rural development specialist to the World Bank country office (Box 18).
78
Box 18: Factors Contributing to Aid Harmonisation in Rwanda The sector is coherent and predominantly the responsibility of a single line ministry Strong GoR leadership within the sector The development of a strategic sector plan Budget support or a sector-wide approach A lead donor Clear links between policy and strategic frameworks and the MTEF/annual budget
process. Adequate time is allocated to making the cluster work
Amis et al, (2005) 4.57 Below the headlines, however, progress with aid effectiveness remains very uneven. Most of the problems with alignment and harmonisation arise at sector and sub-sector level where the level of policy detail and prioritisation on the part of government varies, which in turn affects opportunities for alignment, but also where individual donor preferences and practices tend to vary the most. Despite a move towards budget support overall (roughly 36 percent of all ODA in 2004 was the GBS) there is still a proliferation of donor projects at all levels (Box 19). There is also a shortage of aid management capacity within government to push for more streamlined ways of working. Clusters have improved opportunities for alignment but not all financing is linked to a sector cluster. For instance around 58 percent of aid going into health is from the Global Fund and PEPFAR, all of it is in project form and none of it is harmonized with other work going on in health. A recent Baseline Survey of Donor Alignment and Harmonisation in Rwanda48 commissioned as part of the Aid Policy process notes that in sectors that have progressed the furthest with harmonisation and alignment it is the development of the sector strategic plan that seems to be the most important factor rather than the existence of cluster activity itself, although the two are clearly related. Box 19: Project support is not meeting the needs of the Education Sector A 2005 report on how to improve the provision and management of external support to education is clear that the project approach is falling short of meeting the sectors needs. Large project implementation unit based projects have performed relatively poorly while there are too many small projects to manage. 18 projects are listed in the 2005-2007 MINEDUC Development Budget, with only two costing more than $10 million while the 48 projects listed in the CEPEX database show the same pattern. Many of these projects do not directly fund Education Sector Support Programme (ESSP) priorities and have high costs making them difficult to scale-up or sustain. Donor commitments tend to have short term horizons, requiring high management costs to maintain funding e.g. textbooks. If Rwanda is to meet its PRSP and Vision commitments for basic education an increased share of external finance to education will need to be provided in support of recurrent costs, requiring some budget support. In whatever form aid is ultimately given, it needs to be part of a strategy and expenditure programme to which both sides of the partnership are committed and which all funds are helping to finance. Source: Foster, M et al (2005) Improving the Provision and Management of External Support to Education. Consultancy Report to MINECOFIN and MINEDUC. 4.58 While progress with harmonisation and alignment in several areas has been positive major limitations on both the GoR and donor side continue to constrain the process:
Weaknesses in GoR’s internal alignment – between PRSP, sector plans, MTEFs, annual budgets, M&E and feedback loops.
48 Amis, P Jackson, P & Ahobamuteze, G. (2005) Baseline Survey of Donor Alignment and Harmonisation in Rwanda. Draft Report October 2005. IDD, University of Birmingham.

79
Continuing shortcomings in the APR process, its results focus and links with the budget and MTEF
Uneven practices of donor engagement at centralised and decentralised levels Limitations on donor country office capacities and the degree of decision making
power held at country level (noteworthy here is the perception of the limited decision making power of the monthly DPCG meetings).
Different donor assessments of the ‘traction’ of the PRSP and the extent of GoR progress in core reform areas such as PFM continue to mean different assessments of how far and how fast donor behaviours can be changed.

80
5. OVERALL ASSESSMENT The PRSP ‘logic model’ 5.1 The evidence presented so far has looked at the various dimensions of the PRSP – its priority areas and processes - in separate chapters and sections. This short Chapter brings together these assessments by returning to the ‘logic model’ presented as part of the evaluation framework. The logic model identifies what some of the most important linkages are underpinning the PRSP. Figure summarises the evaluation teams’ assessment of the robustness of these links based on the evidence available in late 2005. The main headlines are (bullet numbers are cross-referenced with 5.2 Figure 12):
Linkages between the PRSP, Rwanda’s national Vision and a clear set of measurable and monitorable long term goals such as the MDGs. Satisfactory in terms of links with the national vision but weak to moderate in terms of links with long-term MDGs.
Linkages between the needs assessment, poverty profile, participation of
other stakeholders, strategy and policy formulation. Moderate to satisfactory. Direct citizen consultations effective. Conflict sensitivity of PRSP satisfactory. Donor engagement widespread. PRSP provoked ‘sector thinking’ across government. However, parts of the governance and security agenda remain outside sector strategies and plans, and policy actions linked to poverty reduction appear insulated from the broader questions of equity and rights. NGO participation in PRSP preparation patchy and not well organised. PRSP generally weak on equity issues and insufficient treatment of the institutional requirements for long term poverty reduction.
Linkages between the PRSP policy framework, planning and budgeting and
the delivery of resources to priority areas and implementing agencies at central and decentralised levels (governmental and non-governmental, public and private). Moderate to satisfactory. Progress made in allocations to priority areas and flow of funds to decentralised levels, but priority sector approach increasingly limited as a tool for guiding pro-poor expenditures And implementation challenges, especially at local levels of service delivery, remain severe. Highly uneven progress between and within sectors in terms of meeting PRSP targets and goals.
Linkages between the delivery of resources and monitorable progress
towards PRSP goals and objectives, and feedback loops into the policy process. Weak/unsatisfactory. Despite increases in spending concerns remain about how much priority programme spending is targeted at pro-poor services (e.g. education, health). Links between available resources, better policies and improved service delivery overall continues to be weak. The APR process has helped focus attention on M&E but the APR still lacks traction as an internal and external reporting tool. Sector M&E remains weak and uneven. PRSP has

81
addressed some internal alignment challenges but several serious challenges persist.
Increased resource mobilisation and donor alignment and harmonisation
and the enhanced delivery of PRSP goals and objectives. Moderate to satisfactory. One third of all support now delivered as budget support. Total aid flows have remained fairly constant. Despite general alignment with sector strategies, donor projects and programmes continue to be fragmented in some sectors. Harmonisation efforts are progressing but major challenges ahead.
Improved living conditions, education and health outcomes, private sector
growth and government effectiveness. Relevant data on changes in poverty levels not available. Some progress in education outcomes, the record on health outcomes is less favourable. Coffee and rice sectors continue to grow with some evidence of increased rural employment at the margin. On balance, however, progress remains modest and needs to be accelerated if there is to be any realistic chance of reaching some or all of the MDGs by 2015. Consistent finding that PRS2 needs to focus more squarely on the broad-based growth agenda and related links to human development, equity and rights.
Figure 12: Strengths and weaknesses of the PRSP logic model in Rwanda
MDGs
Vision 2020
PRSP 1
Policy Planning Finance Monitoring
Rural transformationAgric growth
Human Development Good Governance
Results
Priority Sectors
Local Government
Needs/povertydata
Externalresource Flows/ DPDialogue
Economic Infrastructure
APR/M&E
Civil society/Parliamentaryengagement
AlignmentHarmoniz-
ationCivil Society
PrivateSector
1 & 2
6
3 & 4
51 & 2 = +++ good overall, links with MDGs weak
3 & 4 = + / - Allocations positive but links to better policies and improved service delivery still weak
5 = ++ improving
6 = +/ - moderate progress
Strengths & Weaknessesof PRSP Linkages

82
5.3 It is to be expected that the overall assessment is mixed. The PRSP is a major undertaking for any country but particularly a small post-conflict country such as Rwanda where the implementation challenges are immense given the low base facing ministries, departments and local authorities in 2000/2001. Given these challenges it is notable that respondents to the stakeholder survey remain unequivocal about the overall relevance and value added of the PRSP process in Rwanda, even if they are less sanguine about how much the PRSP has so far delivered in terms of change on the ground. Figure 13 gives aggregated results across 5 questions relating to the relevance of the PRSP concept for Rwanda, the extent to which the ensuing strategy was grounded in an understanding of Rwanda’s main development challenges and its value-added compared to previous strategies, planning frameworks and instruments for donor assistance. Figure 13: Survey Responses on the Relevance and Value Added of the PRS Process
0 20 40 60 80 100
Don 'tknow /Uns ure
S trong ly Dis ag ree
Dis agree
A g ree
S trong ly A g ree
Sum o f Res pons es
5.4 In terms of the most significant changes brought about by PRSP1 (Table 10), respondents clearly point to increased ownership of the policy framework for poverty reduction, the clarity and openness of the debate about the policy framework, transparency in the use of public resources and improved decision making processes. These are all important changes that reflect a combination of strong leadership and technical commitment by those responsible for PRSP1 roll-out. Table 10: The PRSP has brought about Significant Changes for the Better in Which Areas? Summed
Responses Ownership of the policy framework for poverty reduction 20 Clarity and openness of the debate about the policy framework 17 Transparency and accountability for the use of public expenditures 12 Improved decision making processes 11 Improved quality of public services 8 Improved targeting of public services 8 Improved business environment 6
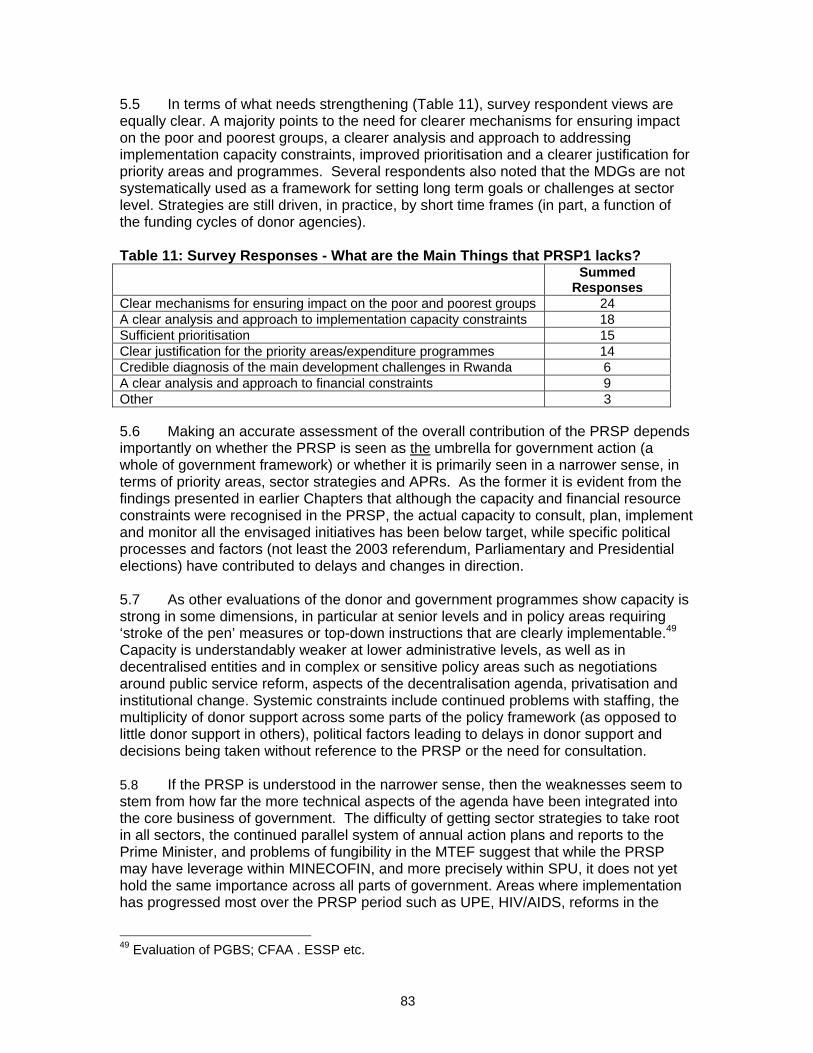
83
5.5 In terms of what needs strengthening (Table 11), survey respondent views are equally clear. A majority points to the need for clearer mechanisms for ensuring impact on the poor and poorest groups, a clearer analysis and approach to addressing implementation capacity constraints, improved prioritisation and a clearer justification for priority areas and programmes. Several respondents also noted that the MDGs are not systematically used as a framework for setting long term goals or challenges at sector level. Strategies are still driven, in practice, by short time frames (in part, a function of the funding cycles of donor agencies). Table 11: Survey Responses - What are the Main Things that PRSP1 lacks?
Summed Responses
Clear mechanisms for ensuring impact on the poor and poorest groups 24 A clear analysis and approach to implementation capacity constraints 18 Sufficient prioritisation 15 Clear justification for the priority areas/expenditure programmes 14 Credible diagnosis of the main development challenges in Rwanda 6 A clear analysis and approach to financial constraints 9 Other 3 5.6 Making an accurate assessment of the overall contribution of the PRSP depends importantly on whether the PRSP is seen as the umbrella for government action (a whole of government framework) or whether it is primarily seen in a narrower sense, in terms of priority areas, sector strategies and APRs. As the former it is evident from the findings presented in earlier Chapters that although the capacity and financial resource constraints were recognised in the PRSP, the actual capacity to consult, plan, implement and monitor all the envisaged initiatives has been below target, while specific political processes and factors (not least the 2003 referendum, Parliamentary and Presidential elections) have contributed to delays and changes in direction. 5.7 As other evaluations of the donor and government programmes show capacity is strong in some dimensions, in particular at senior levels and in policy areas requiring ‘stroke of the pen’ measures or top-down instructions that are clearly implementable.49 Capacity is understandably weaker at lower administrative levels, as well as in decentralised entities and in complex or sensitive policy areas such as negotiations around public service reform, aspects of the decentralisation agenda, privatisation and institutional change. Systemic constraints include continued problems with staffing, the multiplicity of donor support across some parts of the policy framework (as opposed to little donor support in others), political factors leading to delays in donor support and decisions being taken without reference to the PRSP or the need for consultation. 5.8 If the PRSP is understood in the narrower sense, then the weaknesses seem to stem from how far the more technical aspects of the agenda have been integrated into the core business of government. The difficulty of getting sector strategies to take root in all sectors, the continued parallel system of annual action plans and reports to the Prime Minister, and problems of fungibility in the MTEF suggest that while the PRSP may have leverage within MINECOFIN, and more precisely within SPU, it does not yet hold the same importance across all parts of government. Areas where implementation has progressed most over the PRSP period such as UPE, HIV/AIDS, reforms in the
49 Evaluation of PGBS; CFAA . ESSP etc.

84
justice sector, public financial management and decentralisation are all clearly linked to the PRSP but are not necessarily being driven by it. A key question for PRS2 is likely to be whether, and how, this more technical agenda of the PRSP can become more firmly embedded and integrated into the wider political vision of government.
85
6. ISSUES AND RECOMMENDATIONS FOR THE NEXT PHASE Second generation PRSs - what have we learned? 6.1 A number of reviews and evaluations of first phase PRS processes in and beyond Africa have touched on the possible lessons for the second generation of PRSs. Some of these are worth considering in framing issues and recommendations for Rwanda’s next phase PRS. Some of the more generic lessons include:
The need for greater customisation – as countries move beyond the restrictions of the HIPC timetable, greater emphasis should be placed on ensuring that domestic processes drive the PRS. This means bringing together processes that are specifically pro-poor with those that relate to broader policy questions to build a stronger integrative framework for tackling poverty reduction. Donors need to ensure that their funding and review procedures are supportive of national ownership (World Bank/OED 2004).
Politics matter – there is a clear need to take better account of the politics of poverty reduction and of domestic policy processes. This entails moving beyond support for a narrow process of civil society or citizen consultation and towards a more holistic approach to supporting government accountability to citizens, especially poor people and socially excluded groups through national institutions such as parliaments, the media and oversight bodies. This holistic approach needs to take account of the longer term drivers of change in a country and the political as well as policy role of the international community (Piron & Evans 2004; Driscoll and Evans 2005).
‘Pro-poor’ spending is often too narrowly or too loosely defined to be meaningful (Williamson et al 2003). A significant share of HIPC ‘savings’ have resulted in increased resources for social spending ministries but this has not necessarily made a significant impact on poverty in the short to medium term.50 A different balance of spending is often needed to address and promote growth in support of human development and sustainable poverty reduction (OECD 2003, Killick 2004).
A clearer focus on the MDGs. Work undertaken for the Millennium Project points to the importance of linking poverty reduction strategies to clear measurable and long term targets that are in turn linked to specific and costed interventions to achieve them. The MDGs provide such a set of targets and the World Summit Declaration adopted in September 2005 commits countries to adopt MDG based PRSPs by 2006. Whether seen primarily as a political tool for bridging the gap between donor and government priorities or as an instrumental tool for linking planning and budgeting processes, the MDGs together are an important framework for medium to long term planning.
Concerted efforts are needed to deliver on donor alignment and harmonisation commitments within a clearly defined partnership frameworks under the PRS.
50 Investing in health and education brings clear short run benefits but the more generalised impact on poverty takes some time be realised as a more healthy and educated workforce is established and productivity gains finally come on stream.
86
There must be renewed effort to move beyond the rhetoric and towards tangible improvements in aid delivery, involving moving more resources on budget, committing and disbursing them in predictable ways and reducing reporting burdens on governments (OECD/DAC 2003). Partnership frameworks need to stress not only mutual accountability but also pathways to building greater mutual trust between stakeholders (Driscoll & Evans 2005).
6.2 Most, if not all of these generic lessons resonate in the Rwandan context. Specific issues arising from the evaluation that are important in going forward are discussed below. Scope and Policy Content A more integrated and growth-oriented strategy 6.3 There is a fairly clear consensus within GoR and amongst most Development Partners that PRS2 should include a much stronger, multi-sectoral focus on growth, emphasising the role of the productive sectors, trade, especially export promotion, and infrastructure, especially energy, rural roads and water (Box 20). Box 20: Trade, Rural Development and Poverty Reduction in Rwanda Recent poverty analysis for the DTIS shows that, similar to neighbouring PRS countries, access to good roads, to markets, to credit and to electricity significantly reduce the probability of being poor, as does working in the non-farm sector. Relatively few of Rwanda’s farmers enjoy such access however. Transport costs are high, market access is weak and energy costs and interruptions are prohibitive for the majority of small scale producers. Using the coffee sector as an example, the study finds that reducing transport costs alone would have a significant impact on poverty amongst coffee farmers and a positive effect on the distribution of income in rural areas. Rising incomes linked to coffee would also have significant spill-over effects in terms of non-farm income and employment opportunities. But reducing transport costs is not only good for existing coffee farmers, together with improved extension services, access to electricity and education strongly influences the probability that others will engage in coffee farming. This is consistent with a range of studies on African economies and suggests that these basic elements should be at the core of the poverty reduction strategy. Source: Poverty Analysis for the Diagnostic Trade Integration Study 2005 6.4 The evaluation confirms the need for a stronger focus on both the productive sectors and on multi-sectoral actions necessary to support a conducive environment for poverty reducing growth. This means balancing measures aimed directly at stimulating growth with those intended to address the equity or distributional impact of growth. Getting the growth-equity balance right is likely to be particularly crucial given that many of the gains made in health and education in recent years remain fragile or significantly below target (especially in health). There are also outstanding questions regarding the levy of user fees for health services, the balance between tertiary and primary education spending and the government’s commitments in watsan and housing. Pushing ahead with new policy agendas for growth must therefore be done while seeking to consolidate and improve on past gains, particularly in the human development sectors. Bringing politics back in 6.5 Striking the right balance in PRS2 requires that all the key elements of the government’s programme are working in tandem with the PRS. This raises the additional

87
question of whether PRS will largely be treated largely as a policy subset focused around a selection of priority areas and largely driven by a technocratic agenda on poverty,51 or whether it will be seen as a whole of government framework bringing together the broader political programme – in particular the need to create a secure environment in which human rights are fully respected - with the poverty reduction agenda. The evaluation has indicated a number of ways in which tensions or lack of synergy has evolved between these two in recent years. 6.6 A more integrative ‘national development strategy’, would require early political engagement to bring together Vision2020, the MDGs, key growth and poverty reduction priorities with regional trade and security issues. The MDGs would provide the basis for a long term strategic planning and expenditure framework (Box 21) which would, in turn, frame medium term priorities to be operationalised through sector strategies and the MTEF. Such a ‘whole of government’ approach would not only look at the contribution of all sectors to growth and poverty reduction (similar to the Tanzanian approach) but it would also build coherence across a wider range of public policy tools – tax, spend and regulatory tools – in the fight against poverty (Box 22). The need to be absolutely clear about the institutional requirements for such an integrated strategy would ensure a more realistic and integrated approach to human resource development and public service reforms. Box 21: MDG Needs Assessment Approach Article 22 of the World Summit Declaration adopted in September commits developing countries to adopt MDG based PRSPs by 2006. The MDGs, coming out the millennium declaration are first and foremost a political instrument to hold focus the efforts of all partners on a set of key priority objectives. Because it has the force of international legitimacy, it serves as a common ground where different parties can come together on the basis of common commitments. Hence, it could serve to bridge some of the gaps that exist between donor and government priorities (as discussed in relation to PRSP vs. Vision 2020) and thus serve to promote alignment behind government policies. The MDG needs assessment seeks to be a practical planning and budgeting tool, working back from broad strategic objectives, to clear measurable targets, and finally to specific and costed interventions. It is intended to help bridge, what is currently perceived in most PRSP countries as the missing link between objectives, planning, and budgeting processes. The MDG needs assessment also seeks to provide a framework for linking the planning process to the implementation process. In order to address absorption and implementation capacity at the very beginning of the planning process a big part of the needs assessment involves an institutional capacity assessment that looks at different funding scenarios and sees what the government can be expected to do with extra funds, and then looks (a) at ways of complementing that capacity in the short run, and (b) at ways of building that capacity over time. The needs assessment claims not to see the MDGs in isolation, but as one key element of a broader agenda for change in the way ODA operates (including, Monterrey, Paris, Rome Declarations). In the Rwandan context it would be crucial to link this exercise to the Aid Policy Document, to make sure that not only the quantity but crucially the quality of aid is enhanced. Source: UNDP
51 As tried in Bolivia, where given the highly charged political context the decision was taken to focus PRS2 on a more limited set of priority areas for which their was already some social/political consensus.
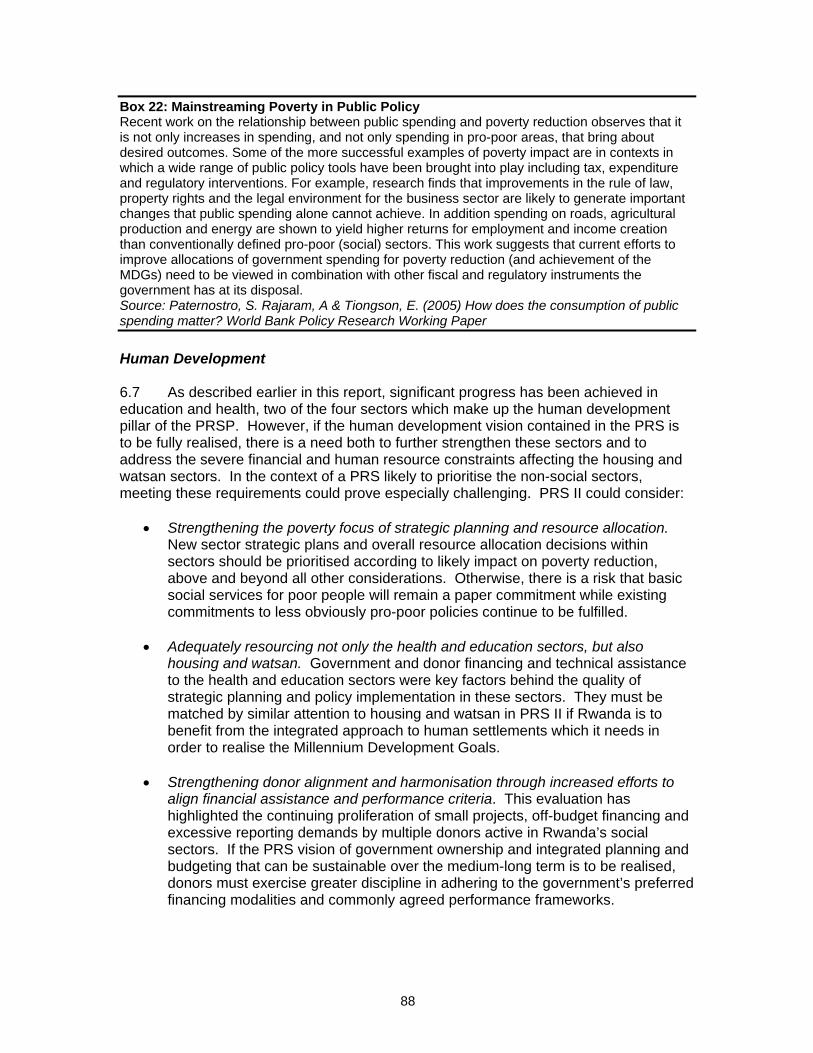
88
Box 22: Mainstreaming Poverty in Public Policy Recent work on the relationship between public spending and poverty reduction observes that it is not only increases in spending, and not only spending in pro-poor areas, that bring about desired outcomes. Some of the more successful examples of poverty impact are in contexts in which a wide range of public policy tools have been brought into play including tax, expenditure and regulatory interventions. For example, research finds that improvements in the rule of law, property rights and the legal environment for the business sector are likely to generate important changes that public spending alone cannot achieve. In addition spending on roads, agricultural production and energy are shown to yield higher returns for employment and income creation than conventionally defined pro-poor (social) sectors. This work suggests that current efforts to improve allocations of government spending for poverty reduction (and achievement of the MDGs) need to be viewed in combination with other fiscal and regulatory instruments the government has at its disposal. Source: Paternostro, S. Rajaram, A & Tiongson, E. (2005) How does the consumption of public spending matter? World Bank Policy Research Working Paper Human Development 6.7 As described earlier in this report, significant progress has been achieved in education and health, two of the four sectors which make up the human development pillar of the PRSP. However, if the human development vision contained in the PRS is to be fully realised, there is a need both to further strengthen these sectors and to address the severe financial and human resource constraints affecting the housing and watsan sectors. In the context of a PRS likely to prioritise the non-social sectors, meeting these requirements could prove especially challenging. PRS II could consider:
• Strengthening the poverty focus of strategic planning and resource allocation. New sector strategic plans and overall resource allocation decisions within sectors should be prioritised according to likely impact on poverty reduction, above and beyond all other considerations. Otherwise, there is a risk that basic social services for poor people will remain a paper commitment while existing commitments to less obviously pro-poor policies continue to be fulfilled.
• Adequately resourcing not only the health and education sectors, but also
housing and watsan. Government and donor financing and technical assistance to the health and education sectors were key factors behind the quality of strategic planning and policy implementation in these sectors. They must be matched by similar attention to housing and watsan in PRS II if Rwanda is to benefit from the integrated approach to human settlements which it needs in order to realise the Millennium Development Goals.
• Strengthening donor alignment and harmonisation through increased efforts to
align financial assistance and performance criteria. This evaluation has highlighted the continuing proliferation of small projects, off-budget financing and excessive reporting demands by multiple donors active in Rwanda’s social sectors. If the PRS vision of government ownership and integrated planning and budgeting that can be sustainable over the medium-long term is to be realised, donors must exercise greater discipline in adhering to the government’s preferred financing modalities and commonly agreed performance frameworks.

89
Scaling-up/Absorptive Capacity Challenges 6.8 Perhaps one of the most critical challenges for the next phase of the PRS relates to the extent to which Rwanda will be able to absorb major increases in aid flows in a push to achieve the MDGs. If such resources do become available, the challenges for Rwanda will be very real. Latest estimates from MINECOFIN and the IMF show that if grant financing were to increase substantially there are no guarantees that GoR would be able to spend it given current concerns about domestic demand effects (wage and price inflation, the latter hurting poor consumers the most). As in many other agricultural LICs, the ability to absorb large increases in aid rests on assumptions of rapid and sustained annual growth, and therefore a marked acceleration of reforms aimed at supporting agricultural production, private sector development and exports. To offset wage and price pressures Rwanda would have to invest heavily in measures to boost productivity and cost efficiency to help increase the supply of goods produced domestically. 6.9 A study of the case for aid by Foster et al (2003) argues strongly that Low Income Countries in Africa should be able to absorb more aid, but also offers a strong note of caution (Box 23). Box 23: The Case for More aid? On plausible assumptions, if Africa uses aid to increase public spending, the continent as a whole should be able to sustain the increased per capita spending levels from domestic revenues within 8-10 years if aid is doubled and within 12-15 years if it is tripled. Unfortunately, this reassuring conclusion needs to be modified in the case of several of the major recipients of increased aid. A combination of low domestic revenue, high public spending following the aid increase, and relatively rapid population growth, implies that it will be many years before revenue growth in countries like Tanzania and Ethiopia catches up with and begins to overhaul the annual increases required simply to maintain the higher per capita spending levels. The increased level of per capita spending could only be sustained if the higher aid levels are maintained for 20 years or more in the case of Ethiopia and Tanzania, with the absolute aid need continuing to grow for several years even though the percentage of spending financed from domestic revenue is falling. This creates a major challenge for donors- the MDGs are a long-term goal for the international development community, and require predictable long-term flows if they are to be met and then sustained. Source: Foster, M., Keith, A (2003) The Case for Increased Aid. Final Report to DFID.August. 6.10 Beyond the monetary impact of increased aid there are other very practical concerns about human resource constraints and the effectiveness of existing aid flows. Government institutions will have to be strengthened to cope with higher aid flows. While human resource constraints are not absolute, and aid can itself play a crucial part in releasing constraints, there is still a potentially significant burden on existing capacity in the short to medium term. Additional demands will be significantly less if aid flows come in the form of long term and predictable budgetary support. In fact given Rwanda’s severe capacity limitations it is hard to imagine how a significant increase in financing through projects could be contemplated. A review of absorptive and implementation capacity challenges is consequently critical as part of any exercise assessing resource needs for PRS2. 6.11 Evidence compiled in the context of preparation of the Aid Policy Document further suggests that while debates about the quantity of aid are important, debates about the quality of aid are equally significant. As noted in Chapter Two aid is equivalent

90
to roughly 69 percent of total government spending. Of this, 30 percent is in the form of budgetary support. The remaining 70 percent is spread across a wide range of sectors, with most sectors receiving well below 10 percent of total aid flows. In education alone there are some 48 projects in CEPEX’s reporting system, suggesting a fairly high degree of fragmentation. Although project financing is likely to continue there appears to be an opportunity in PRS2 to radically improve the overall impact of aid through more coordinated and streamlined working across aid modalities. Strategic Planning, Budgeting and M&E 6.12 GoR has made consistent efforts to implement an MTEF and link it to the PRSP. MTEFs now exist for most sectors and are being rolled out to districts as part of the ongoing decentralisation process from 2006. However the whole of government MTEF still needs become the major strategic output of the annual budgetary cycle. Key issues for the next phase include:
earlier political engagement in MTEF discussions, systematising sector expenditure reviews across government and analysing
expenditure priorities across all sectors, including a review of what is meant by priority spending and how it relates to the full set of public policy instruments available to government to tackle poverty.
concerted efforts to integrate the recurrent and development budgets, using the MTEF document as a basis for wider consultation with Parliament and
other stakeholders on the government’s programme, and some kind of longer term strategic expenditure framework to frame 3-5 year
sector strategies, the MTEF and the Government’s long term Vision and MDG priorities.
Governance and Politics Human resources development and capacity building 6.13 HRD remains a major priority for the next PRS, for building capacity for PRS preparation and to enable delivery of public sector priorities at both central and decentralised levels. Capacity building more generally needs more in-depth treatment than in PRSP1, including an assessment of whether HIDA is the appropriate mechanism to scale up human, organisational and institutional development across the government system. Progress on public service reform is also needed to deepen capacities below senior levels in government. As noted above, progress in this area is essential if PRS2 is to consider the case for a substantial increase in donor resources as well as making the most (in productivity terms) of first round investments in health and education sectors. Political Governance and Security 6.14 As detailed in earlier Chapters, important progress has been achieved in a number of governance sub-sectors. There is a need to consolidate these achievements in PRS2. Taking into account the legacy of Rwanda’s colonial and post-colonial rule and the genocide, the comparative review of governance indicators suggests that improvements are still needed in terms of voice and accountability, rule of law and political stability. These issues are directly important for grounding growth and poverty reduction efforts within Rwanda and for reassuring the international community that

91
Rwanda wishes to continue to progress with basic human rights and governance-aid partnership principles. The next PRS could consider:
Presenting a strategic vision for deepening the rule of law, democratisation, and the protection and promotion of civil and political rights (e.g. media, civil society, political space), rather than (as in PRSP1) focusing on institution-focused priorities (this might usefully arise out of another governance conference similar to 2001 but with the direct purpose of shaping PRS2).
Moving beyond the focus on specific institutional innovations towards consolidating a more pro-poor governance perspective. This would include paying attention to the accessibility of state services and governance institutions, strengthening accountability from the centre to the grass roots and bottom-up channels of communication and participation;
Either develop a governance-wide strategy or ensure that a number of governance sub-sector strategies are developed in a timely manner and communicate effectively to avoid duplication, with the possibility of higher level coordination, perhaps from the Prime Ministers Office;
Finding appropriate mechanisms for engagement with development partners on security issues – an area where sovereignty would seem to constrain transparent dialogue with donors but at the same time where lack of transparency and civilian accountability inevitably impact on aid allocations.
Institutionalising Parliamentary engagement 6.15 In order to help institutionalise PRSP processes into existing political and accountability structures, the next PRS could ensure more systematic engagement of Parliament, including:
Involving the relevant Chamber of Deputies and Senate Parliamentary Commissions in the sector-self evaluations and the determination of sector priorities and sector strategies;
Holding a plenary debate in the two houses on the PRSs (draft and before finalisation);
Inviting representation from across the political party spectrum to PRS preparation events;
Submitting APRs to the relevant Parliamentary Commissions to ensure feed back into the formal accountability structures;
Reviewing the extent to which PRS M&E and APRs could be streamlined with reporting on annual action plans coordinated by the Prime Minister’s Office

92
Building a Stronger Development Partnership Citizens and Civil Society 6.16 The precise road map for participation in PRS2 is currently under discussions by CSOs and Government. The experience of PRS1 points to a number of important considerations:
Direct citizen participation was adopted as the focus for the last consultation process for a number of reasons, including the limited capacity of CSOs to engage in policy processes, and the need to combine poverty reduction and reconciliation processes. These factors are no longer as relevant which opens the possibility for CSOs to play a greater role in the process. To make this happen GoR and CSOs need to create institutionalised mechanisms for engagement in policy processes (policy roundtables and fora). These mechanisms cannot be ad hoc and must allow for participatory processes to be organised and for information to be distributed effectively.
As well as new mechanisms, existing opportunities for CSOs to engage in policy processes need to be strengthened and/or opened. This includes at cluster level, in sector reviews and in budget working groups.
CSOs also need to create their own spaces and self-organise to coordinate responses and actions to become more effective in engaging with the Government. The Government is interested in having civil society speak with one voice. As Box 24 on Tanzania’ NPF shows, it is possible to effectively combine a coordinated CSO body while allowing individual organisations to continue pursuing their own organisational goals.
Greater efforts need to be made to popularise and disseminate the PRS, its main priorities and key deliverables. This could be a short non-technical version in Kinyrwanda. Engaging a broader section of society in PRS related issues is a way to strengthen implementation and provide a clearer basis for monitoring and evaluation. Tanzania’s experience is again illustrative (Box 24).
Government and Development Partners 6.17 Substantial achievements have already been made in building a coherent framework for donor-government collaboration around the PRS, but important challenges and gaps remain. There is a need for GoR to take a more forceful role in leading the alignment and coordination/harmonisation agenda both in providing overall leadership of policy formulation and in setting out clear ways in which it wishes to interact with donors and donor financing. The APD should provide a sold basis for moving this forward during PRS2. 6.18 More broadly there is a need to develop a clearer framework of mutual accountability (again possibly through the APD) in which not only GoR but also DPs agree to transparent and mutual consistent ways of working that can, in turn, form the basis of a much more trusting and effective aid partnership. The DPCG could take an active role in monitoring such a framework and on linking progress in Rwanda to commitments made in Paris on aid effectiveness.

93
Box 24: Lessons from Tanzania: Popularising the PRSP and the NGO Policy Forum (NPF) The NPF was created in 2002 by NGOs interested in the areas of debt and development. It has generated energy around advocacy activities and has been very successful in engaging with the Government. Some of the key features of the NPF that may be relevant for the Rwanda context are as follows:
NPF works to promote space at national level for the expression of concerns on policy issues;
The NPF is designed as a coordination mechanism not to work for the member but to organise their work. This assists members to view participation as a mean to attain their own organisational goals;
Local and international NGOs are both represented in the NPF; by design, however, the steering body has a majority of national NGOs at all times;
Over 80 members all commit to attending a monthly coordination meeting and participate in working groups.
Conditions for membership include legal statute, full transparency of accounts and a willingness to participate.
The NPF also worked to popularise the PRSP. Once PRSP1 was finalised, NPF produced a popular version of the PRSP called Tanzania without poverty: a plain-language guide to the PRSP which was distributed to people throughout Tanzania. The guide includes a history of policy making in Tanzania, PRSP policies and targets and a glossary on economic and policy terms. The popularised version is in English and Swahili and the NPF are planning to produce a child-friendly version. This popularised version contributed to raising public awareness of the PRSP across the country. In some areas the popular version was used by local government officials as the strategy document to be implemented. Source: Troacaire (2005); Curran (2005) 6.19 Several issues are likely to be on the table for PRS2 including:
the impact of the evolving decentralisation process in Rwanda and the implications for future donor financing (a working group of the DPCG could usefully look at the most effective ways to engage at decentralised levels);
the role of vertical funds (PEPfAR etc), where there are real concerns that the size of these funds will unbalance sector policies and budgeting processes;
and how to accommodate different aid modalities while looking to enhance and streamline GoR ways of working.52
52 Amis et al (2005)

94
REFERENCES
Amis, P., Jackson, P. Ahobamuteze (2005) Baseline Survey of Donor Alignment and Harmonisation in Rwanda. University of Birmingham, IDD. Booth, D eds (2003) Fighting Poverty in Africa: Are PRSPs Making a Difference? ODI, London Centre for Resource Analysis (2005) Decentralisation and Service Delivery in Rwanda – Achievements, Challenges and Future Prospects. MINALOC/WorldBank Driscoll, R. and Evans, A. (2005) Second Generation PRSPs: New Opportunities and Emerging Issues. Development Policy Review Vol 23, Issue 1.
Holmes, M. and Evans, A. (2003) A Review of Experience in Implementing MediumTerm Expenditure Frameworks in a PRSP Context: A Synthesis of Eight Country Studies. ODI /CAPE. May 2003.
Foster, M. Ndasuhutse,S. Virtue, J. (2005) Improving the Provision and Management of External Support to Education. MINECOFIN/ MINEDUC. Government of Rwanda (1999) Rwanda Vision 2020 Government of Rwanda (2002) Poverty Reduction Strategy Paper Government of Rwanda/World Bank (2005) Country Financial Accountability Assessment Government of Rwanda (2002, 2003, 2004) Poverty Reduction Strategy: Annual Progress Report IMF (2005) Fifth Review under the three year PRGF. IMF Country Report 05/333 Killick, T, Piron, LH, Katumaga, M (2005) The Implementation of the MOU between the Governments of Rwanda and the United Kingdom: Report of the Independent Monitors Piron, LH. with Evans, A. (2004) The Politics of the PRSP Approach. ODI Working Paper.
Mutebi, F, Stone, S, and Thin, N. (2003) Rwanda in Booth, D eds (2003) Fighting Poverty in Africa: Are PRSPs Making a Difference? ODI, London Purcell, D. Dom, C. Ahobamuteze,G. (2005) Joint Evaluation of GBS 1994-2004. Rwanda Country Report (DRAFT). Paternostro, S. Rajaram, A & Tiongson, E. (2005) How does the consumption of public spending matter? World Bank Policy Research Working Paper Sezikeye Bosco, I. (2005) Snapshot Study on the Decentralisation Process in Rwanda. Prepared for DFID. Short, J. (2003) Assessment of the MTEF in Rwanda. ODI. World Bank (2004) PRSC Pre-Appraisal Mission. Aid Memore.

95
World Bank (2005) Toward a Conflict Sensitive PRS: Lessons from a Retrospective Analysis. June, 2005. SDV/ESSD Report Williamson, T et al (2003) Is there a place for virtual poverty funds in pro-poor public spending reform? Lessons from Uganda’s PAF. Development Policy Review, Vol 21, no.4.

96
ANNEX 1
1. POVERTY MONITORING INDICATORS
Table 12: Vision 2020, PRSP1 and the MDGs Vision 2020 PRSP1 MDGs Poverty, economic growth Reduce the population living
below the poverty line from 60-30 percent by 2015. Achieve annual economic growth equivalent to 7-8 percent of GDP until 2020.
Reduce poverty from 60-30 percent by 2015 Achieve annual economic growth equivalent to 7-8 percent of GDP until 2020.
Halve the proportion of people with income less than USD1 between 1990 and 2015. Halve the proportion of people suffering from hunger by 2015.
Gender equality Achieve equal participation of women in tertiary training
Eliminate gender disparity in primary and secondary education by 2005 and at all levels no later than 2015
Population growth Reduce the population growth rate from 3.2 percent to 2.5 percent by 2010
Reduce the population growth rate from 3.2 to 2.5 percent in 2010
Fertility Rate Reduce the average number of children per family from 6 to 4 by 2010
Reduce TFR from 6 to 4 percent by 2010
Maternal mortality Reduce the MMR from 810/100,000 to 202/100,000 by 2015 Make reproductive health services available to all
Reduce MMR from 810/100,0000 to 202/100,000 by 2015.
Reduce by three quarters the MMR between 1990 and 2015
Infant and Child Mortality Reduce IMR from 107/1,000 to 35/1,000 by 2015
Reduce IMR from 107/1,000 to 35/1,000 by 2015
Reduce by two thirds the under-five mortality rate between 1990 and 2015
Literacy, basic education
Increase NPE from 72 percent to 100 percent by 2015
Increase NPE from 72 percent to 100 percent by 2015
Ensure children everywhere will be able to complete primary schooling by 2015
AIDS Lower the prevalence rate from 14 percent* to 5 percent by 2020
Halt and begin to reverse the spread of HIV/AIDs by 2015
Protection against soil erosion
Increase protected areas from 20 to 70 percent by 2020.
Mainstream the principles of sustainable development into country policies and programmes. Reverse the loss of environmental resources
* 2000 estimate. UNAIDS subsequently revised this downwards to 3.4-7 percent.

97
ANNEX 2 1. SELECTED BACKGROUND DATA & INDICATORS
Table 13: Priority Spending Trends Priority Sectors/ Programmes
2001 2002 2003 2004 2005
(RwF millions) Outturn Budget Outturn Budget Outturn Budget (Revised)
Outturn Budget Outturn*
Recurrent Internal Affairs 3,521 4,296 4,641 4,739 5,917 6,492 5,648.3 7,529.55 5,117.07 Agriculture 1,485 1,819 2,285 2,142 1,237 2,151 1,408.6 3,600.08
1,779.18
Commerce 437 773 777 768 604 1,068 912.3 1,395.32 964.54 Export promotion 2,988.6 2,190.5 5723,00 5,042.08 Education 25,045 11,966 12,576 12,878 16,083 20,417 22,188.2 26,050.14 19,715.34 Youth and Sports 830 556 556 421 472 379.2 381.5 279.9 214.35 Health 5,180 3,690 3,963 4,601 5,738 6,212.7 8,026.2 10,536.43 7,009.67 Transport and Communication Road Fund
692 2,764 4,196 3,313 2,654 5,137.9 3,991.1 1,875.88 5,873.0
2,238.47 1,887.,53
Gender 463 249 320 286 165 287 147.3 269.88 84.73 Public Service 85 448 420 501 293 503 220.9 2,225.81 1,614.72 Land and Resettlement 328 609 759 684 267 688 414.8 668.3 133.71 Local Government District Transfers
1,761 3,845 6,591 6,448 8,643 9,468.6 5,143.5 1,114 3,227.75
663.89 2,420.82
Electricity 14,000 11,756.3 HIMO 580 217.5 300 225 Transfers to Provinces 21,293 21,293 23,416 22,692 28,057 27,340.2 31,094.36 21,398.13 TIG 299.96 204.99 Development Export Promotion 4,870 1,687.7 1,074.90 988 Education (PRSC) 450 62.54 Health 1,000 14.23 Infrastructure 320.71 Electricity 7,017.60 4,610.18 Water (PRSC) 997 908.5 CDF 2,000 1,000 4,000 4,088 5,500 2,062.5 3,500 3,499.96 * Up to end September 05

98
Table 14: Education Sector Performance Key Performance Indicators53 Progress in
2001-02 (APR 2004)
Progress in 2002-03 (APR 2005)
Progress in 2003-04 (APR 2005)
Input Indicators Government spending on education as % of total public expenditure
Public expenditure on primary education as % of total public expenditure on education
Ratio of higher education to primary education unit costs
27 42
137
23.7 -
89
23.0 41.7
86
Output Indicators Pupil : teacher ratio (at primary) Non-salary recur spending as a % of recur spending for primary education Number of teachers in Primary Number of teachers in Tronc Commun Number of teachers in Upper Secondary
58.9 -
- - -
65.8 -
27,319 2,343 (e) 1,299
66.9 21.0
28,774 2,600 (e) 1,442
Outcome Indicators (primary education)
Gross enrolment rate (%) Net enrolment rate (%) NER Boys NER Girls Completion rate (%) Average repetition rate (%) Average drop out rate (%) Transition to second (%) Ratio of students to qualified teachers
103.7 74.5 - - 29.6 17.2 16.6 43.0 70.6
128.4 91.2 90.1 92.4 38.1 20.6 15.2 45 70.3
130.8 93.0 91.5 94.5 44.9 20 (e) 16 47 75.8
53 The Education Sector Strategic Plan 2005-2010 has detailed policy objectives and indicators in each of the five areas of focus: basic education; secondary education; higher education; science, technology and research; and planning and management.
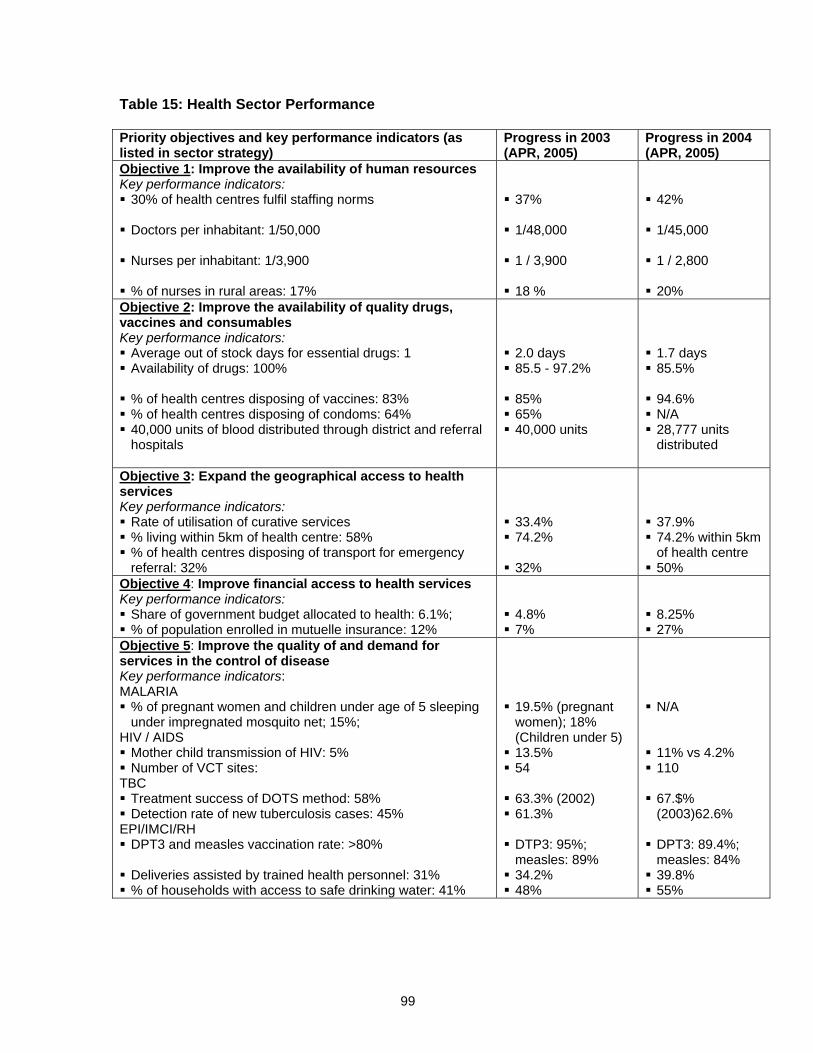
99
Table 15: Health Sector Performance Priority objectives and key performance indicators (as listed in sector strategy)
Progress in 2003 (APR, 2005)
Progress in 2004 (APR, 2005)
Objective 1: Improve the availability of human resources Key performance indicators: 30% of health centres fulfil staffing norms
Doctors per inhabitant: 1/50,000
Nurses per inhabitant: 1/3,900
% of nurses in rural areas: 17%
37%
1/48,000
1 / 3,900
18 %
42%
1/45,000
1 / 2,800
20%
Objective 2: Improve the availability of quality drugs, vaccines and consumables Key performance indicators: Average out of stock days for essential drugs: 1 Availability of drugs: 100%
% of health centres disposing of vaccines: 83% % of health centres disposing of condoms: 64% 40,000 units of blood distributed through district and referral hospitals
2.0 days 85.5 - 97.2%
85% 65% 40,000 units
1.7 days 85.5%
94.6% N/A 28,777 units distributed
Objective 3: Expand the geographical access to health services Key performance indicators: Rate of utilisation of curative services % living within 5km of health centre: 58% % of health centres disposing of transport for emergency referral: 32%
33.4% 74.2%
32%
37.9% 74.2% within 5km of health centre
50% Objective 4: Improve financial access to health services Key performance indicators: Share of government budget allocated to health: 6.1%; % of population enrolled in mutuelle insurance: 12%
4.8% 7%
8.25% 27%
Objective 5: Improve the quality of and demand for services in the control of disease Key performance indicators: MALARIA % of pregnant women and children under age of 5 sleeping under impregnated mosquito net; 15%;
HIV / AIDS Mother child transmission of HIV: 5% Number of VCT sites:
TBC Treatment success of DOTS method: 58% Detection rate of new tuberculosis cases: 45%
EPI/IMCI/RH DPT3 and measles vaccination rate: >80%
Deliveries assisted by trained health personnel: 31% % of households with access to safe drinking water: 41%
19.5% (pregnant women); 18% (Children under 5)
13.5% 54
63.3% (2002) 61.3%
DTP3: 95%; measles: 89%
34.2% 48%
N/A
11% vs 4.2% 110
67.$% (2003)62.6%
DPT3: 89.4%; measles: 84%
39.8% 55%
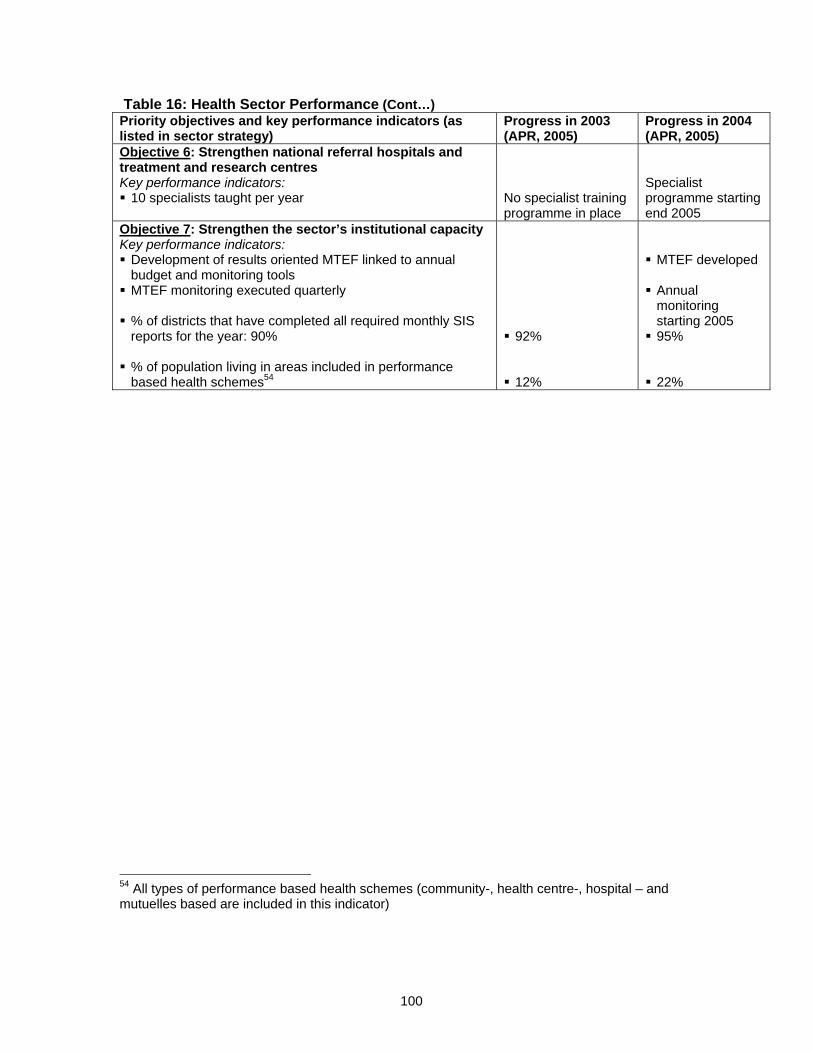
100
Table 16: Health Sector Performance (Cont…) Priority objectives and key performance indicators (as listed in sector strategy)
Progress in 2003 (APR, 2005)
Progress in 2004 (APR, 2005)
Objective 6: Strengthen national referral hospitals and treatment and research centres Key performance indicators: 10 specialists taught per year
No specialist training programme in place
Specialist programme starting end 2005
Objective 7: Strengthen the sector’s institutional capacity Key performance indicators: Development of results oriented MTEF linked to annual budget and monitoring tools
MTEF monitoring executed quarterly % of districts that have completed all required monthly SIS reports for the year: 90%
% of population living in areas included in performance based health schemes54
92%
12%
MTEF developed
Annual monitoring starting 2005
95% 22%
54 All types of performance based health schemes (community-, health centre-, hospital – and mutuelles based are included in this indicator)

101
Figure 14: FDI inflows, inter-country comparison
FDI to GDP (net inflows) %
0
2
4
6
8
10
12
1990
1991
1992
1993
1994
1995
1996
1997
1998
1999
2000
2001
BurundiGhanaMozambiqueRwandaSouth AfricaTanzaniaUgandaZambia

102
2. COMPARATIVE GOVERNANCE INDICATORS Voice, Accountability, Government Effectiveness, Rule of Law and Corruption The below charts depict the percentile rank on each governance indicator. Percentile rank indicates the percentage of countries worldwide that rate below the selected country (subject to margin of error). In the Charts, the year 1998 is depicted by the lower bar for each country and the statistically likely range of the governance indicator is shown as a thin black line. All information and data is taken from Kaufmann et al. (2005). Data, charts and comments on data quality are available at: http://www.worldbank.org/wbi/governance/govdata/. The figure below compares key indicators from the Kaufmann-Kraay-Mastruzzi data set for three years -1996 (lower bar), 1998 (middle bar) and 2004 (top bar). Results show a significant improvement in government effectiveness, regulatory quality and control of corruption over the period; a gradual improvement in voice and accountability from a very low base, but some fluctuation in indicators for political stability and rule of law.
When compared to other African PRSP and post-conflict countries Rwanda ranks relatively poorly on voice and accountability and the rule of law and relatively better in terms of government effectiveness and control of corruption.
103
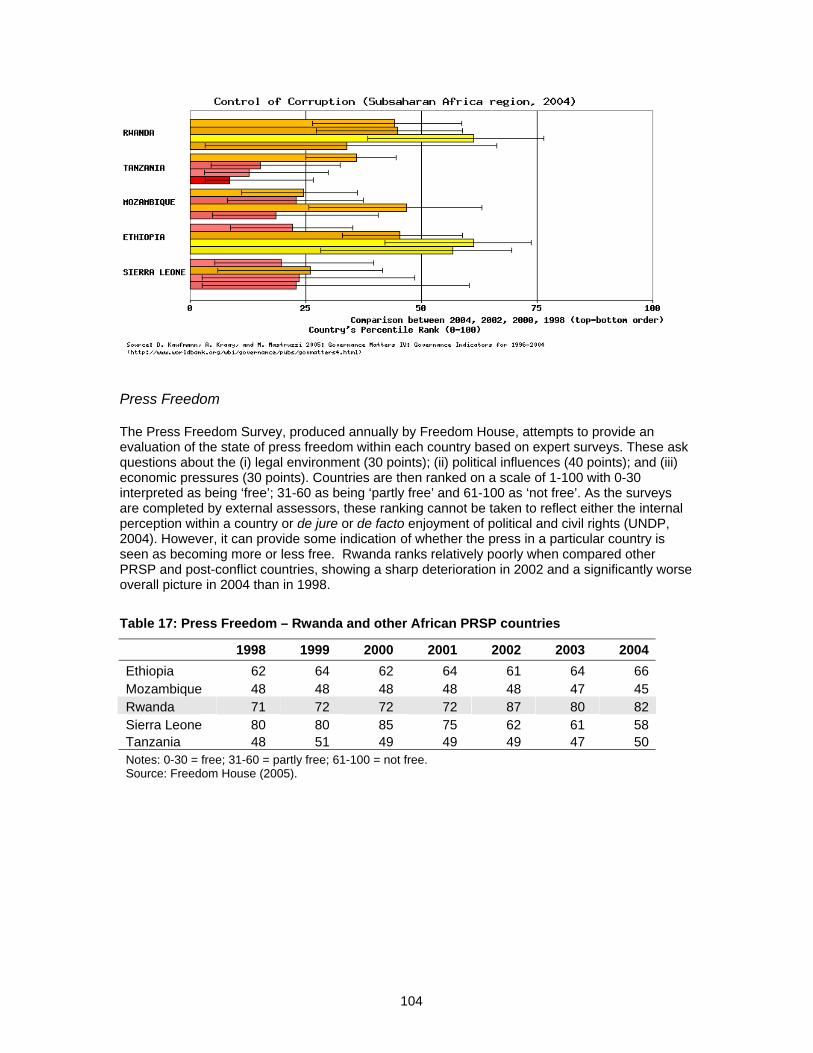
104
Press Freedom The Press Freedom Survey, produced annually by Freedom House, attempts to provide an evaluation of the state of press freedom within each country based on expert surveys. These ask questions about the (i) legal environment (30 points); (ii) political influences (40 points); and (iii) economic pressures (30 points). Countries are then ranked on a scale of 1-100 with 0-30 interpreted as being ‘free’; 31-60 as being ‘partly free’ and 61-100 as ‘not free’. As the surveys are completed by external assessors, these ranking cannot be taken to reflect either the internal perception within a country or de jure or de facto enjoyment of political and civil rights (UNDP, 2004). However, it can provide some indication of whether the press in a particular country is seen as becoming more or less free. Rwanda ranks relatively poorly when compared other PRSP and post-conflict countries, showing a sharp deterioration in 2002 and a significantly worse overall picture in 2004 than in 1998.
Table 17: Press Freedom – Rwanda and other African PRSP countries
1998 1999 2000 2001 2002 2003 2004 Ethiopia 62 64 62 64 61 64 66 Mozambique 48 48 48 48 48 47 45 Rwanda 71 72 72 72 87 80 82 Sierra Leone 80 80 85 75 62 61 58 Tanzania 48 51 49 49 49 47 50 Notes: 0-30 = free; 31-60 = partly free; 61-100 = not free. Source: Freedom House (2005).

105
ANNEX 3
1. SUMMARIES OF EVALUATION WORKSHOPS The aim of the workshop(s) was to build as comprehensive a picture as possible of the strengths and weaknesses of PRSP1 by drawing on the views and experience of a range of national and international stakeholders, and to identify key priorities, challenges and opportunities in taking forward PRSP2. 1. DEVELOPMENT PARTNERS WORKSHOP - NOVOTEL UMUBANO 9TH NOVEMBER 2005 Presentations The workshop was opened by the Minister of State for MINECOFIN, Mme. Monique Nsanzabaganwa. Alison Evans (the Team Leader for the Evaluation) then introduced the evaluation and the questions for discussion during the workshop. Participants were then asked to divide into four groups to discuss one of the following questions:
Do Development Partners regard the PRSP as an effective platform for donor alignment with national development priorities? How is this working in practice and what are some of the obstacles?
Has implementation effectiveness at sector and sub-sector levels improved? How much can be attributed to the PRSP? What are some of the constraints/obstacles?
Observations made during the group discussions were recorded for plenary discussion: Question 1: Do Development Partners regard the PRSP as an effective platform for donor alignment with national development priorities? Group 1
The PRSP1 was not sufficiently clear at indicating priorities across government (i.e. between sectors). [Question asked: would donors be able to function without PRSP1? – the answer was probably ‘yes’]
A common assessment framework would greatly assist prioritisation and help target outputs in poverty reduction.
The budget process has not always been sufficiently transparent to show where prioritisation is taking place.
Monitoring is sectorally based and is uneven across sectors. This makes it difficult to draw conclusions across national (PRSP) progress.
We would like the PRSP to function more as a primary reference for poverty reduction (for enhanced donor alignment as well as harmonisation across government).
Group 3:
The PRSP provides a policy framework, related to the Vision 2020 and sectoral priorities. It is however weaker in terms of setting sectoral priorities.
Donors use the PRSP to develop their strategies, such as the UNDAF for the UN system, which references the PRSP.
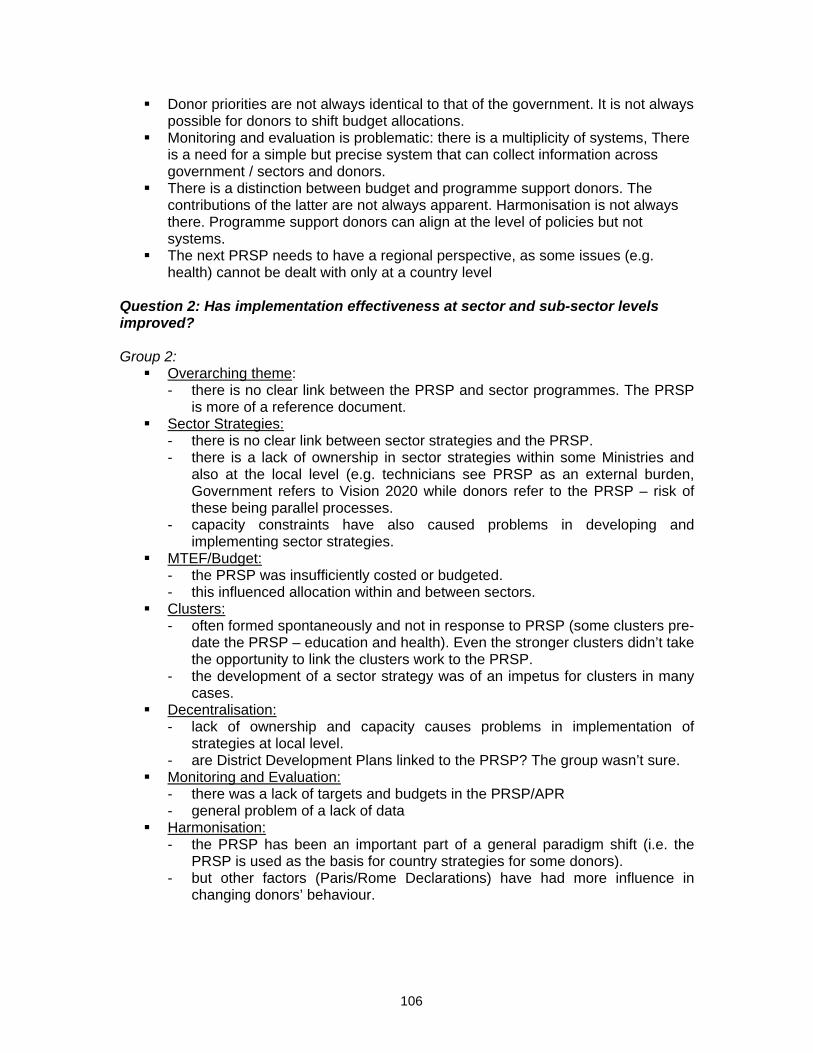
106
Donor priorities are not always identical to that of the government. It is not always possible for donors to shift budget allocations.
Monitoring and evaluation is problematic: there is a multiplicity of systems, There is a need for a simple but precise system that can collect information across government / sectors and donors.
There is a distinction between budget and programme support donors. The contributions of the latter are not always apparent. Harmonisation is not always there. Programme support donors can align at the level of policies but not systems.
The next PRSP needs to have a regional perspective, as some issues (e.g. health) cannot be dealt with only at a country level
Question 2: Has implementation effectiveness at sector and sub-sector levels improved? Group 2:
Overarching theme: - there is no clear link between the PRSP and sector programmes. The PRSP
is more of a reference document. Sector Strategies:
- there is no clear link between sector strategies and the PRSP. - there is a lack of ownership in sector strategies within some Ministries and
also at the local level (e.g. technicians see PRSP as an external burden, Government refers to Vision 2020 while donors refer to the PRSP – risk of these being parallel processes.
- capacity constraints have also caused problems in developing and implementing sector strategies.
MTEF/Budget: - the PRSP was insufficiently costed or budgeted. - this influenced allocation within and between sectors.
Clusters: - often formed spontaneously and not in response to PRSP (some clusters pre-
date the PRSP – education and health). Even the stronger clusters didn’t take the opportunity to link the clusters work to the PRSP.
- the development of a sector strategy was of an impetus for clusters in many cases.
Decentralisation: - lack of ownership and capacity causes problems in implementation of
strategies at local level. - are District Development Plans linked to the PRSP? The group wasn’t sure.
Monitoring and Evaluation: - there was a lack of targets and budgets in the PRSP/APR - general problem of a lack of data
Harmonisation: - the PRSP has been an important part of a general paradigm shift (i.e. the
PRSP is used as the basis for country strategies for some donors). - but other factors (Paris/Rome Declarations) have had more influence in
changing donors’ behaviour.
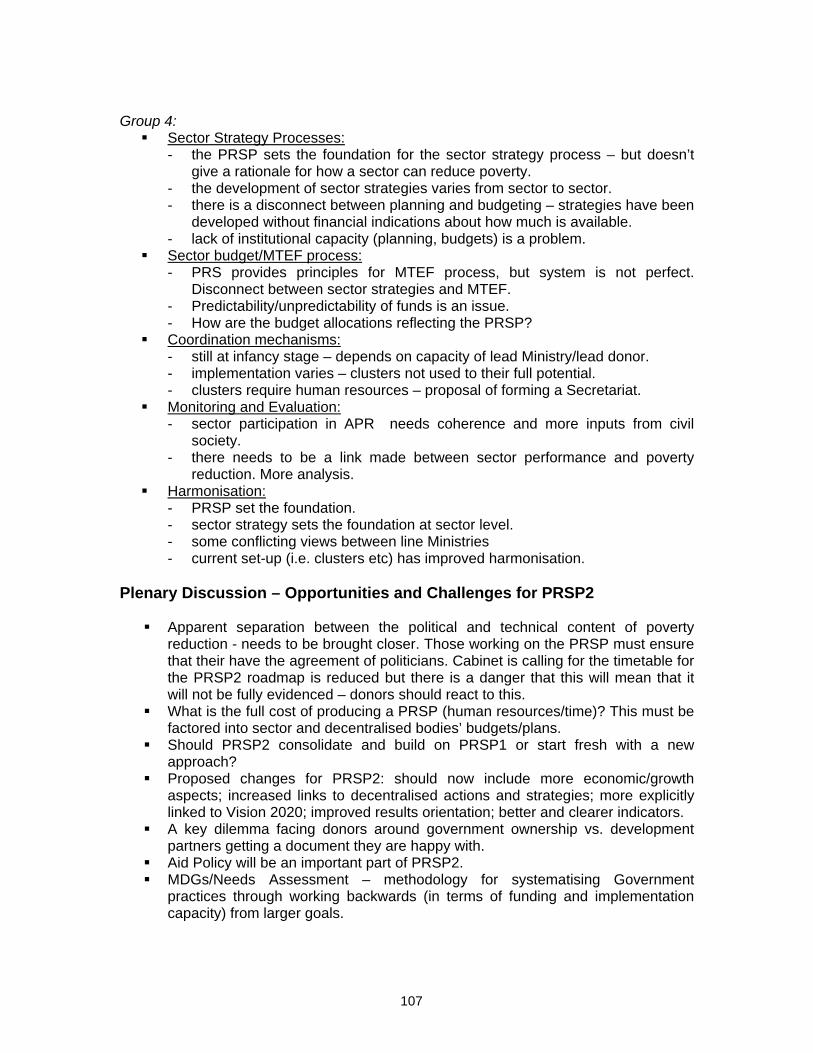
107
Group 4:
Sector Strategy Processes: - the PRSP sets the foundation for the sector strategy process – but doesn’t
give a rationale for how a sector can reduce poverty. - the development of sector strategies varies from sector to sector. - there is a disconnect between planning and budgeting – strategies have been
developed without financial indications about how much is available. - lack of institutional capacity (planning, budgets) is a problem.
Sector budget/MTEF process: - PRS provides principles for MTEF process, but system is not perfect.
Disconnect between sector strategies and MTEF. - Predictability/unpredictability of funds is an issue. - How are the budget allocations reflecting the PRSP?
Coordination mechanisms: - still at infancy stage – depends on capacity of lead Ministry/lead donor. - implementation varies – clusters not used to their full potential. - clusters require human resources – proposal of forming a Secretariat.
Monitoring and Evaluation: - sector participation in APR needs coherence and more inputs from civil
society. - there needs to be a link made between sector performance and poverty
reduction. More analysis. Harmonisation:
- PRSP set the foundation. - sector strategy sets the foundation at sector level. - some conflicting views between line Ministries - current set-up (i.e. clusters etc) has improved harmonisation.
Plenary Discussion – Opportunities and Challenges for PRSP2
Apparent separation between the political and technical content of poverty reduction - needs to be brought closer. Those working on the PRSP must ensure that their have the agreement of politicians. Cabinet is calling for the timetable for the PRSP2 roadmap is reduced but there is a danger that this will mean that it will not be fully evidenced – donors should react to this.
What is the full cost of producing a PRSP (human resources/time)? This must be factored into sector and decentralised bodies’ budgets/plans.
Should PRSP2 consolidate and build on PRSP1 or start fresh with a new approach?
Proposed changes for PRSP2: should now include more economic/growth aspects; increased links to decentralised actions and strategies; more explicitly linked to Vision 2020; improved results orientation; better and clearer indicators.
A key dilemma facing donors around government ownership vs. development partners getting a document they are happy with.
Aid Policy will be an important part of PRSP2. MDGs/Needs Assessment – methodology for systematising Government
practices through working backwards (in terms of funding and implementation capacity) from larger goals.
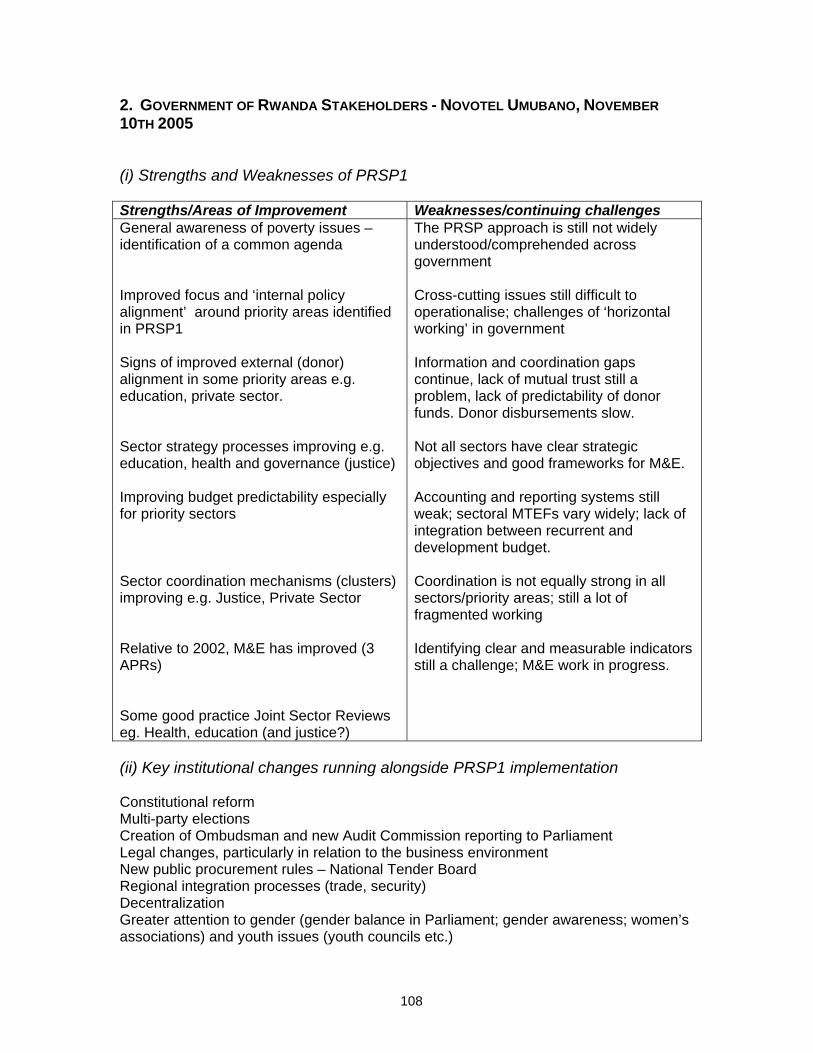
108
2. GOVERNMENT OF RWANDA STAKEHOLDERS - NOVOTEL UMUBANO, NOVEMBER 10TH 2005
(i) Strengths and Weaknesses of PRSP1 Strengths/Areas of Improvement Weaknesses/continuing challenges General awareness of poverty issues – identification of a common agenda Improved focus and ‘internal policy alignment’ around priority areas identified in PRSP1 Signs of improved external (donor) alignment in some priority areas e.g. education, private sector. Sector strategy processes improving e.g. education, health and governance (justice) Improving budget predictability especially for priority sectors Sector coordination mechanisms (clusters) improving e.g. Justice, Private Sector Relative to 2002, M&E has improved (3 APRs) Some good practice Joint Sector Reviews eg. Health, education (and justice?)
The PRSP approach is still not widely understood/comprehended across government Cross-cutting issues still difficult to operationalise; challenges of ‘horizontal working’ in government Information and coordination gaps continue, lack of mutual trust still a problem, lack of predictability of donor funds. Donor disbursements slow. Not all sectors have clear strategic objectives and good frameworks for M&E. Accounting and reporting systems still weak; sectoral MTEFs vary widely; lack of integration between recurrent and development budget. Coordination is not equally strong in all sectors/priority areas; still a lot of fragmented working Identifying clear and measurable indicators still a challenge; M&E work in progress.
(ii) Key institutional changes running alongside PRSP1 implementation Constitutional reform Multi-party elections Creation of Ombudsman and new Audit Commission reporting to Parliament Legal changes, particularly in relation to the business environment New public procurement rules – National Tender Board Regional integration processes (trade, security) Decentralization Greater attention to gender (gender balance in Parliament; gender awareness; women’s associations) and youth issues (youth councils etc.)

109
(III) ISSUES, CHALLENGES FOR PRSP2 PRSP1 provides the necessary institutional and policy framework for moving ahead with PRS2. PRS2 needs to be cast in the framework of decentralization and a clearer assignment of roles and responsibilities for policy, planning and service delivery. Priority Areas: stimulating economic development; agricultural transformation; infrastructure; human resources/capacity; gender; governance; justice (peace and security) and social protection. Challenges: capacity and institutional development; M&E; speed of donor response; increased resource mobilization. Closing issues: how far should PRSP2 seek to consolidate the gains of PRSP1 vs. identifying a new agenda; how to create a stronger more durable partnership with CSOs/development partners around PRSP2; how to secure early political engagement in PRS2 preparation? 3. ATELIER SOCIETE CIVILE - NOVOTEL UMUBANO, 9 NOVEMBRE 2005
Présentations L’atelier a été ouvert par Mme la Ministre d’Etat du MINECOFIN, qui a offert quatre messages :
Le PRSP2 (‘Economic Development and Poverty Reduction Strategy’) requiert un engagement de chaque rwandais
Le PDPRS a besoin d’une évaluation indépendante pour identifier les leçons du passé et améliorer notre travaille
Nous devons être responsable (‘accountable’) envers la population et les bailleurs de fonds
Nous allons dépendre plus des services offerts par les organisations de la société civile à la population ; nous vous considérons comme des partenaires importants dans ce processus
Une présentation PowerPoint par Mme Alison Evans, chef de l’equipe d’évaluation, a ensuite introduit les processus associés au PRSP, ainsi que le rôle que la société civile peut jouer (document ci-joint). Les participants ont été divisés en trois groupes pour débattre des questions suivantes : (i) participation et information et (ii) responsabilité.
110
Groupe 1 : Participation et échange d’information
Le PRSP est tombé du ciel. Une initiative venue de l’extérieur ou du gouvernement.
Les collectifs ont été associés à tout les processus : o Niveau préparatoire : CCOAIB, Pro-Femmes et d’autres on été associés au
comité national de pilotage o Niveau d’élaboration : l’information a été envoyée aux différents acteurs de la
société civile et les documents ont circulé. Des organisations de la société civile (OSC) ont été invitées et ont participé à des réunions d’échange et de validation et ont donné des observations
o N’veau d’élaboration des stratégies sectorielles / clusters: OSC absentes, sauf dans certains secteurs (santé, éducation, agriculture, macroéconomie)
o Niveau suivi et évaluation : réactions aux documents et rapport d’évaluation (annual progress report) par les OSC
Il y a un nombre de défis : o Manque de capacité technique d’analyse des documents o Manque d’esprit proactif (ne recherche pas d’info ; travaille dans l’isolement) o Apres les réunions, échanges d’info très limités o PRSP est un programme isolé des activités des OSC ; pas la peine
d’analyser les liens de causalités entre les deux o Document écrit uniquement en anglais, inaccessible pour les francophones et
kinyarwandaphones o Invitations aux réunions que ne laissent pas le temps aux OSC de s’organiser o Document volumineux et haute technicité o SC s’isole dans l’élaboration des politiques o SC qui ne comprend pas son rôle d’avocacy o SC qui ne s’est pas appropriée le processus ; affaire du gouvernement o Manque de coordination des activités de la société civile dans le processus :
idée de plateforme de la SC o Pression des bailleurs de fonds sur l’élaboration a limité la participation o Besoin de plus grande collaboration entre les ONGs internationales et
nationales Groupe 2 : Responsabilité
Accès à l’information : o membres de la SC ont en principe accès à l’info sur le PRSP mais d’une
façon différente selon les associations : soit • A travers les collectifs (CCOAIB avec projet de suivi sur les PRSP) • Suivant les démarches de certaines associations
o Documentation souvent disponible en langues étrangères et souvent distribuée à la veille des réunions
Participation : o Participation par les OSC aux réunions pas active car pas le temps
d’exploiter la documentation et pas de consultations antérieures o Invitations tardives o Rôle de la SC non clair / mal défini et difficulté de savoir qui inviter (SC,
organisation de développement, secteur privé ?)

111
o Relations avec le Parlement dont le progrès n’est pas communiqué / connu par la SC
Conclusion : la responsabilité de la société civile n’est pas toujours évidente, d’autant plus qu’elle n’est pas suffisamment informée sur le PRSP et son engagement pour sa réussite
Groupe 3 : Participation
Processus : o nouveau (relation état/société) o dirigé par les bailleurs de fonds (bailleurs/état) o question de capacité (état/OSC/bailleurs) o comment à la fois intervenir et mendier avec la même personne ? (‘how to
engage with the person you’re begging from’) Engagement significatif :
o Niveau national : des exemples positifs (RMF novembre 2005, landnet) o Niveau local : trop de jargon, appropriation limitée, le ‘monstre MINECOFIN’ o Jusqu’où s’étend le PRSP ? o Et même lors du dialogue politique / législatif, s’agit-il toujours du PRSP ?
En regardant vers le futur : o Auto-organisation (proactif, recognition, action collective) o Promouvoir les liens o Opportunité : plateforme ? o Organisation sectorielle pour une influence efficace
Discussion plénière (remarques complémentaires)
Il faut reconnaître que le gouvernement a fait des efforts pour engager la SC Les bailleurs de fonds ont de l’influence (DFID) et contraignent le gouvernement Le contenu du PRSP n’est pas toujours représentatif (par exemple questions des
handicapés) Il faut prendre en compte le contexte rwandais
Vers PRSP2:
Auto-organisation Proactif (‘ne pas attendre MINECOFIN’) Organisation par secteur Collaboration avec les organisations locales Documentation accessible Contraintes financières des OSC Consultation des OSC avec la population Danger de n’avoir qu’un rôle de validation ? Il faut aussi prendre son temps Comité mixte OSC/gouvernement ?

112
ANNEX 4
1. STAKEHOLDER SURVEY 1. Survey Questionnaire Instructions Please mark the appropriate response for each question with an X in the box e.g. [X]. I. Respondent Information Date: [ ] Name (Optional): [ ] Organization (Optional): [ ] 1. Please indicate which category of organisation you belong to: Central Government – Economy, Finance, Central Bank [ ] Central Government – Sector/Line Ministry, National Commission, Agency [ ] Local Government – Province, District, Cellule [ ] National Assembly, Senate [ ] Local NGO (policy, research, service delivery) [ ] Business Sector [ ] Academia [ ] Media [ ] Other civil society body [ ] International NGO [ ] Bilateral donor agency [ ] Multilateral donor agency [ [ 2. What has been the nature of your involvement in the PRSP process in Rwanda? Mark all that apply. Unaware of the PRSP process [ ] Aware, but not directly involved [ ] Participated in national level consultations at the design stage [ ] Participated in local level consultations at the design stage [ ] Participated in ubudehe [ ] Made direct contributions to strategy formulation [ ] Engaged in PRSP implementation [ ] Engaged in PRSP monitoring [ ]

113
3. How familiar are you with the PRSP1 document, its goals and priority areas? Not familiar [ ] Moderately familiar [ ] Familiar [ ] Very familiar/knowledgeable [ ] 4. What is your understanding of the primary role of the PRSP here in Rwanda? Mark all that apply. To access HIPC funding [ ] Better analysis and problem identification relating to poverty reduction [ ] A comprehensive planning tool to focus government on poverty [ ] A tool for integrating planning, budgeting and monitoring at all levels of government [ ] An instrument for mobilizing funding for poverty reduction at all levels [ ] A strategy tool to satisfy the external donor community Other [ ] II. The PRSP Process 5. The concept of a PRSP is a good model for addressing poverty reduction in Rwanda? Place a mark next the statement you agree with. Don’t know/unsure [ ] Strongly disagree [ ] Disagree [ ] Agree [ ] Strongly agree [ ] 6. PRSP1 is well grounded in an understanding of the development challenges facing Rwanda? Don’t know/unsure [ ] Strongly disagree [ ] Disagree [ ] Agree [ ] Strongly agree [ ] 7. The PRSP process has added value to the country’s response to these challenges compared to previous strategies, planning frameworks. Don’t know/unsure [ ] Strongly disagree [ ] Disagree [ ] Agree [ ] Strongly agree [ ] 8. The PRSP improves on past instruments for donor assistance? Don’t know/unsure [ ] Strongly disagree [ ] Disagree [ ] Agree [ ]

114
Strongly agree [ ] 9. The benefits and strengths of the PRSP process have so far been greater than the costs and weaknesses Don’t know/unsure [ ] Strongly disagree [ ] Disagree [ ] Agree [ ] Strongly agree [ ] III. PRSP Principles Country-owned and participatory 10. The process of preparing PRSP1 was driven by and managed by national stakeholders Don’t know/unsure [ ] Strongly disagree [ ] Disagree [ ] Agree [ ] Strongly agree [ ] 11. Your or your organisation was adequately consulted during the formulation of the PRSP Don’t know/unsure [ ] Strongly disagree [ ] Disagree [ ] Agree [ ] Strongly agree [ ] 12. The PRSP provided a useful forum for combining the viewpoints of different stakeholder groups Don’t know/unsure [ ] Strongly disagree [ ] Disagree [ ] Agree [ ] Strongly agree [ ] 13. The final PRSP document was relevantly modified to accommodate some of the viewpoints of your stakeholder group. Don’t know/unsure [ ] Strongly disagree [ ] Disagree [ ] Agree [ ] Strongly agree [ ]
115
14. Government has shown strong leadership of the PRSP process and continues to engage widely on implementation and monitoring Don’t know/unsure [ ] Strongly disagree [ ] Disagree [ ] Agree [ ] Strongly agree [ ] Comprehensive and Long Term 15. The PRSP document provides an adequate diagnosis of the causes of poverty (based on quantitative and qualitative sources) Don’t know/unsure [ ] Strongly disagree [ ] Disagree [ ] Agree [ ] Strongly agree [ ] 16. The strategies and priorities in the PRSP document proposed are in line with this diagnosis Don’t know/unsure [ ] Strongly disagree [ ] Disagree [ ] Agree [ ] Strongly agree [ ] 17. During strategy formulation policy alternatives were fully explored Don’t know/unsure [ ] Strongly disagree [ ] Disagree [ ] Agree [ ] Strongly agree [ ] 18. The strategies and priorities in the PRSP strike an adequate balance between promotion of growth and poverty alleviation (through investments in social sectors etc) Don’t know/unsure [ ] Strongly disagree [ ] Disagree [ ] Agree [ ] Strongly agree [ ] 19. The PRSP document provides an adequate road map for achieving long term development goals and targets (e.g. the MDGs) Don’t know/unsure [ ] Strongly disagree [ ] Disagree [ ] Agree [ ]
116
Strongly agree [ ] Results-oriented 20. The PRSP process (implementation, reporting & M&E) is focused on outcomes that benefit the poor Don’t know/unsure [ ] Strongly disagree [ ] Disagree [ ] Agree [ ] Strongly agree [ ] 21. The strategy includes realistic targets, indicators and action plans to guide implementation Don’t know/unsure [ ] Strongly disagree [ ] Disagree [ ] Agree [ ] Strongly agree [ ] 22. The framework for M&E in PRSP1 is clear and effective Don’t know/unsure [ ] Strongly disagree [ ] Disagree [ ] Agree [ ] Strongly agree [ ] 23. What are the main things that PRSP1 lacks? Mark all that apply. Sufficient prioritisation [ ] A clear analysis and approach to financial constraints [ ] A clear analysis and approach to implementation capacity constraints [ ] Credible diagnosis of the main development challenges in Rwanda [ ] Clear justification for the priority areas/expenditure programmes [ ] Clear mechanisms for ensuring impact on the poor and poorest groups [ ] Partnerships 24. Donors supported formulation of the PRSP1 in ways that did not undermine country ownership Don’t know/unsure [ ] Strongly disagree [ ] Disagree [ ] Agree [ ] Strongly agree [ ] 25. Donors are aligning their assistance to PRSP priorities Don’t know/unsure [ ]

117
Strongly disagree [ ] Disagree [ ] Agree [ ] Strongly agree [ ] 26. Donor coordination has improved since the PRSP process began Don’t know/unsure [ ] Strongly disagree [ ] Disagree [ ] Agree [ ] Strongly agree [ ] 27. Collaboration between government and civil society organisations has improved in the context of PRSP1? Don’t know/unsure [ ] Strongly disagree [ ] Disagree [ ] Agree [ ] Strongly agree [ ] 28. National and international civil society organisations have become more organised around poverty reduction goals as a result of the PRSP process Don’t know/unsure [ ] Strongly disagree [ ] Disagree [ ] Agree [ ] Strongly agree [ ] 29. Adequate mechanisms/structures currently exist to ensure wide participation in the monitoring of PRSP1 and preparations for PRSP2. Don’t know/unsure [ ] Strongly disagree [ ] Disagree [ ] Agree [ ] Strongly agree [ ] 30. The PRSP process has brought about significant changes for the better in which areas? Mark al that apply. Ownership of the policy framework for poverty reduction [ ] Clarity and openness of the debate about the policy framework [ ] Transparency and accountability for the use of public expenditures [ ] Improved decision-making processes [ ] Improved business environment [ ] Improved quality of public services [ ] Improved targeting of public services [ ]

118
2. SURVEY RESPONDENTS Table 18: Composition of Survey Respondents
Respondent Category Summed Responses
Government 6
NGO, INGO, academia, private sector
9
Bilateral/multilateral donor agency / UN
16
Table 19: Composition of Survey Respondents by stated involvement in the PRSP Process Summed Responses Unaware of the PRSP process 0 Aware not directly involved 8 Participated in national level consultations at the design stage 11 Participated in local level consultations at the design stage 4 Participated in ubudehe 3 Made direct contributions to strategy formulation
14
Engaged in PRSP implementation 17 Engaged in PRSP monitoring 18