Independent Equity Research - NSE - National Stock ... · Independent Equity Research ......
24
The West Coast Paper Mills Limited Independent Equity Research Enhancing investment decisions In-depth analysis of the fundamentals and valuation Business Prospects Financial Performance Corporate Governance Management Evaluation
Transcript of Independent Equity Research - NSE - National Stock ... · Independent Equity Research ......

The West Coast Paper Mills Limited
Independent Equity Research Enhancing investment decisions
In-depth analysis of the fundamentals and valuation
Business Prospects Financial Performance
Corporate Governance
Management Evaluation

Explanation of CRISIL Fundamental and Valuation (CFV) matrix The CFV Matrix (CRISIL Fundamental and Valuation Matrix) addresses the two important analysis of an investment making process – Analysis of Fundamentals (addressed through Fundamental Grade) and Analysis of Returns (Valuation Grade)
Fundamental Grade CRISIL’s Fundamental Grade represents an overall assessment of the fundamentals of the company graded in relation to other listed equity securities in India. The grade facilitates easy comparison of fundamentals between companies, irrespective of the size or the industry they operate in. The grading factors in the following:
Business Prospects: Business prospects factors in Industry prospects and company’s future financial performance Management Evaluation: Factors such as track record of the management, strategy are taken into consideration Corporate Governance: Assessment of adequacy of corporate governance structure and disclosure norms
The grade is assigned on a five-point scale from grade 5 (indicating Excellent fundamentals) to grade 1 (Poor fundamentals)
CRISIL Fundamental Grade Assessment 5/5 Excellent fundamentals 4/5 Superior fundamentals 3/5 Good fundamentals 2/5 Moderate fundamentals 1/5 Poor fundamentals
Valuation Grade CRISIL’s Valuation Grade represents an assessment of the potential value in the company stock for an equity investor over a 12 month period. The grade is assigned on a five-point scale from grade 5 (indicating strong upside from the current market price (CMP)) to grade 1 (strong downside from the CMP).
CRISIL Valuation Grade Assessment 5/5 Strong upside (>25% from CMP) 4/5 Upside (10-25% from CMP) 3/5 Align (+-10% from CMP) 2/5 Downside (negative 10-25% from CMP) 1/5 Strong downside (<-25% from CMP) Analyst Disclosure Each member of the team involved in the preparation of the grading report, hereby affirms that there exists no conflict of interest that can bias the grading recommendation of the company. Additional Disclosure This report has been sponsored by NSE - Investor Protection Fund Trust (NSEIPFT). Disclaimer: This Exchange-commissioned Report (Report) is based on data publicly available or from sources considered reliable. CRISIL Ltd. (CRISIL) does not represent that it is accurate or complete and hence, it should not be relied upon as such. The data / Report are subject to change without any prior notice. Opinions expressed herein are our current opinions as on the date of this Report. Nothing in this Report constitutes investment, legal, accounting or tax advice or any solicitation, whatsoever. The subscriber / user assumes the entire risk of any use made of this data / Report. CRISIL especially states that it has no financial liability, whatsoever, to the subscribers / users of this Report. This Report is for the personal information only of the authorized recipient in India only. This Report should not be reproduced or redistributed or communicated directly or indirectly in any form to any other person – especially outside India or published or copied in whole or in part, for any purpose.

CRISIL Equities 1
Reaping the benefits of expansion
Independent Research Report – The West Coast Paper Mills Ltd Reaping the benefits of expansion Industry: Paper
Date: July 30, 2010
The West Coast Paper Mills Ltd (West Coast) is a part of the S. K. Bangur Group, which is present in paper, power cables, chemicals, tea, coffee, rubber and information technology sectors. We assign West Coast a fundamental grade of 3/5, indicating that its fundamentals are ‘good’ relative to other listed securities. We assign a valuation grade of 3/5, indicating that the current market price of the stock is ‘aligned’ to its fair value. We have arrived at a one-year fair value of Rs 97 per share.
Paper demand poised for healthy growth CRISIL Research expects paper and paperboard demand to grow at 7.0% CAGR, from 7.9 mn tonnes to 10.4 mn tonnes between FY10 and FY14 due to healthy growth in industrial production and demand recovery in consumer goods. Demand for Writing & Printing (W&P) paper is expected to grow at 6.7% CAGR during the same period, driven by the government’s thrust on education and growth in overall economy. West Coast’s focus is on the high quality W&P paper segment (copier paper), which is expected to register higher growth of about 14-16%.
One of the largest integrated players post capacity expansion Post its capacity expansion in May 2010, the company has become the fifth largest paper manufacturer in India. Paper industry is highly fragmented with about 660 paper mills, but the top 30 players have close to 50% of the industry capacity. The larger players typically have higher realisations on account of better product mix, and enjoy better operating margins because of economies of scale and backward integration.
More efficient pulp line and change in product mix to improve profitability Apart from expanding capacities, the company has modernised its plant and changed the product mix, which is expected to increase margins by ~6pps. The company has (a) put a new pulp line, which is expected to decrease the wood requirement by ~10%; (b) improved its product mix to produce high quality W&P paper.
Key risks – Raw material and paper prices Volatility in international pulp and paper prices could impact margins. The cost of domestic wood has been increasing constantly on account of increase in royalty, procurement rates and freight charges. However, West Coast has partially mitigated this risk by focusing on its captive plantation scheme which is expected to increasingly assure wood availability at reasonable prices after 2-3 years.
Revenues to grow at a two-year CAGR of 37%, RoE to expand We expect revenues to grow at a two-year CAGR of 37% to Rs 11.7 bn in FY12, on account of increased capacity and production. EBITDA margins are expected to improve to 29.0% in FY11 from 18.5% in FY10 due to supernormal profits on account of firm pulp prices. In FY12, margins are expected to fall to 25.2% on account of expected reversal in pulp and paper prices. Net margins and RoE are expected to improve to 9.4% and 15.3% in FY12, respectively.
Valuations - no upside from current levels We have valued West Coast based on the price-to-earnings ratio (PER) method. We assign PER of 6x to FY12 EPS of Rs 15.5. Further, its 36% stake in Rama Newsprint and Paper Ltd (RNPL) has been valued at Rs 4 per share considering the current market price. Accordingly, we arrive at the fair value of Rs 97 per share. We initiate coverage on West Coast with a valuation grade of ‘3/5’, indicating that current market price is ‘aligned’ to our fair price estimate.
Key forecast (consolidated) Rs (mn) FY08 FY09 FY10 FY11E FY12E Operating income 5,900 6,231 6,295 10,186 11,731 EBITDA 1,152 1,254 1,163 2,952 2,956 Adj Net income 837 905 549 996 1,102 EPS-Rs 14.6 15.0 8.8 14.0 15.5 EPS growth (%) (6.9) 8.3 (41.9) 60.7 10.7 PE (x) 6.2 6.0 10.3 6.5 5.8 EV/EBITDA (x) 6.3 12.0 15.1 5.6 5.1 P/BV (x) 1.3 1.1 1.1 0.9 0.8 RoCE(%) 15.6 8.2 5.2 11.3 11.9 RoE(%) 26.4 20.0 10.6 16.3 15.3 Source: Company, CRISIL Equities estimate
CFV matrix
Fundamental grade of '3/5' indicates good fundamentals
Valuation grade of '3/5' indicates CMP is aligned
1
2
3
4
5
1 2 3 4 5
Valuation Grade
Fun
dam
ent
al G
rad
e
Poor Fundamentals
ExcellentFundamentals
Str
on
gD
ow
nsi
de
Str
on
gU
psi
de
Key stock statistics NSE Ticker WSTCSTPAPRFair value (Rs per share) 97Current market price (Closing price as on 30 July, 2010) 90Shares outstanding (Mn) 62.7Market cap (Rs Mn) 5,643Face value (Rs per share) 2Enterprise value (Rs Mn) 16,86052-week range (Rs) (H/L) 100/47P/E on EPS estimate (FY11E) 6.5Beta 1.40Free float (%) 48.2%Average daily volumes 220,656 Share price movement
0
50
100
150
200
Apr
-06
Jul-
06
Oct
-06
Jan-
07
Apr
-07
Jul-
07
Oct
-07
Jan-
08
Apr
-08
Jul-
08
Oct
-08
Jan-
09
Apr
-09
Jul-
09
Oct
-09
Jan-
10
Apr
-10
Jul-
10
West Coast Nifty -Indexed to 100 Analytical contact Sudhir Nair (Head, Equities) +91 22 3342 3526 Suresh Guruprasad +91 22 3342 3531 Suhel Kapur +91 22 3342 4149 Email: [email protected] +91 22 3342 3561
Th W t C t P

CRISIL Equities
The West Coast Paper Mills Limited
2
Business environment Parameter Paper Revenue contribution (FY10) 94% Revenue contribution (FY12) 96% Product offering W&P and industrial paper End market Banks, FMCG, cigarette, printing and other paper companies Exports as a % of revenues in FY10 3% Geographic presence Domestic Present in 24 states through a network of 88 dealers South and West zones contribute about 70-75% of sales Exports The company exports in small quantities to many countries across the globe Current market position 5th largest player in the domestic paper industry on FY11 capacity estimates 8th largest player in the domestic paper industry on FY10 production estimates Key competitors All major paper mills including Ballarpur Industries Ltd, ITC Ltd, Hindustan Paper
Corporation Ltd, Tamil Nadu Newsprint and Papers Ltd, Andhra Pradesh Paper Mills Ltd amongst others
Sales growth forecast (FY10-12) 37% Demand drivers Stable growth in end-user industries Margin drivers - New technologically advanced capacity leading to operating efficiencies - Change in product mix to produce more superior quality paper

CRISIL Equities
The West Coast Paper Mills Limited
3
Grading Rationale Paper demand poised for healthy growth CRISIL Research expects the overall paper and paperboard (excluding newsprint)
demand to grow at 7.0% CAGR, from 7.9 mn tonnes to 10.4 mn tonnes between FY10
and FY14. • Demand for paperboard is expected to grow at 7.2% CAGR due to healthy
growth in industrial production and demand recovery in consumer goods.
• Demand for W&P would grow at 6.7% CAGR, driven by the government’s thrust on education and growth in overall economy.
• West Coast’s focus is on the high quality W&P paper segment (copier paper),
which is expected to register higher growth of 14-16%.
Paper industry to have a steady growth ahead
7.2%6.3%
9.2%
15.9%
7.9%7.0%
0%
2%
4%
6%
8%
10%
12%
14%
16%
18%
Paperboard W & P -Uncoated paper
W & P - Coated paper
W & P -Branded copier
Specialty Paper and Paperboard
industryFY10-14 CAGR
Source: CRISIL Research
Paper industry has historically enjoyed steady growth on the back
of IIP growth
3
4
5
6
7
8
9
1,000
1,500
2,000
2,500
3,000
3,500
4,000
4,500
5,000
5,500
6,000
2002
-03
2003
-04
2004
-05
2005
-06
2006
-07
2007
-08
2008
-09
2009
-10
2010
-11
2011
-12
(%)('000 tonnes)
Writing and printing Paperboard
growth in W&P (RHS) growth in paperboard (RHS)
Source: CRISIL Research
West Coast is focusing on the high quality W&P segment, which is expected to register higher growth of 14-16%

CRISIL Equities
The West Coast Paper Mills Limited
4
West Coast: One of the largest integrated players in India Considering the recent capacity expansions and capacities commissioned in FY11 by major paper mills, West Coast is expected to be the fifth largest manufacturer of paper.
It is next only to Ballarpur Industries Limited (Ballarpur), ITC Limited (ITC), Tamil Nadu
Newsprint and Papers Limited (Tamil Nadu Newsprint) and Hindustan Paper Corporation Limited (Hindustan Paper).
Paper industry is highly fragmented with about 660 paper mills, but the large players have close to 60% of the industry capacity. The larger players typically have higher
realisations on account of better product mix, and enjoy better operating margins
because of economies of scale and backward integration. Also, the smaller players mainly cater to the lower-end of the paper segment.
West Coast has the fifth largest capacity in India
0
100
200
300
400
500
600
700
800
900
1,000
Bal
larp
ur
ITC
Tam
il N
adu
New
spri
nt*
Hin
dust
an P
aper
Wes
t Coa
st
And
hra
Pra
desh
Pap
er
J K
Pap
er
Cen
tury
Tex
tiles
Rai
nbow
Pap
ers
Ori
ent P
aper
Ses
hasa
yee
('000 MT)
Capacity
Note: Capacity numbers are FY11 estimates * Tamil Nadu Newsprint’s additional capacity of 155,000 tonnes is expected to come on stream during H2FY11
Source: CRISIL Research

CRISIL Equities
The West Coast Paper Mills Limited
5
Table 1: Peer comparison – key paper players
Ballarpur
ConsolidatedTamilNadu Newsprint
J K PaperWest Coast
Paper Andhra
Paper Sirpur Paper
Seshasayee Paper
Jun 2009 Mar 2009 Mar 2009 Mar 2009 Mar 2009 Mar 2009 Mar 2009Capacity MT 776,250a 245,000 240,000 180,000 174,000 138,300 115,000Production MT 637,876 254,903 254,816 173,682 177,748 92,298 119,779Capacity utilisation % 82% 104% 106% 96% 102% 67% 104%Operating Income Rs mn 28,638 11,287 12,683 6,231 6,573 3,445 5,612Paper realisation Rs/MT 57,083b 40,815 49,367 36,260 38,612 38,012 46,092Raw material imports as % of total raw material cost
% 48% 19% 35% 14% 21% 1% 43%
Power cost as % of operating income % 15% 26% 10% 12% 10% 24% 18%Operating margin % 22.8% 26.5% 17.0% 20.1% 18.9% 14.5% 14.7%RoCE % 8.0% 14.8% 12.3% 8.2% 5.6% 6.3% 10.0%GFA Turnover Times 0.5 0.6 0.9 1.3 0.6 0.6 1.0Debt equity ratio Times 1.7 1.2 1.7 2.5 1.3 1.5 1.9Working cycle Raw material cycle Days 96 232 55 111 73 64 91 Debtors Days 40 54 33 24 22 28 32 Creditors Days 132 221 42 200 129 118 144a – Capacity addition for Balarpur is taken on a pro rata basis; b - Refers to the standalone realisation of Balarpur Note: Creditor days includes project creditors Source: CRISIL Research
Recent capacity expansion adequate for growth over the next three years’ Over the past three years, West Coast has incured a capex of Rs 13.8 bn to expand its
capacity from 180,000 tpa to 315,000 tpa. With steady growth in the paper industry and
most players lacking in new capacities, we believe that the company would reach over 90% utilisation levels over the next two years. Apart from adding capacity, the company
has also changed its product mix towards attaining higher profitability.
Table 2: Details of West Coast’s recent capacity expansion Pre-Expansion Post-Expansion
Particulars Capacity
Allocation(tpa) % Capacity
Allocation(tpa) % W&P Paper 115,000 64% 250,000 79% Duplex Board 65,000 36% 22,000 7% Pulp Sheet - - 43,000 14% Total 180,000 100% 315,000 100% Source: Company, CRISIL Equities
Better quality product mix to increase realisations and margins The Indian paper industry is broadly classified into three segments – W&P, industrial
and newsprint. The W&P segment enjoys higher margins (20-25%) than industrial (10-
15%) and newsprint (8-12%). The product mix of West Coast comprises W&P and industrial paper. Post expansion, the product mix is highly biased towards W&P paper
which is expected to increase the company’s realisations and margins. Also, within the
W&P segment, the company will produce more copier paper which is a higher-margin product. The change in product mix is expected to increase margins by ~150bps.
West Coast’s focus on the W&P segment with specific attention on copier paper is expected to improve product-mix and margins

CRISIL Equities
The West Coast Paper Mills Limited
6
Trend in West Coast paper capacity
115
250 65
65
50%
55%
60%
65%
70%
75%
80%
85%
90%
-
50
100
150
200
250
300
350
FY10 FY11
In '000
W&P Industrial % W&P (RHS)
Source: Company reports
Commencement of new fibreline to improve operating efficiency As part of its expansion plan, West Coast has increased its pulping capacity from 300
tpd (tonnes per day) to 800 tpd. The new fibreline was commissioned in February 2010
and the old fibreline has been kept shut since then. The increase in pulping capacity will reduce the company’s reliance on pulp purchased locally and will, thus, result in a
decline in raw material cost from FY11 onwards.
The new advanced fibreline is also expected to increase unbleached pulp yield and reduce shrinkage loss, thereby reducing the raw material requirement by about 10%.
Besides, the consumption of utilities – steam, water and electricity per tonne of
production – is also expected to reduce with the technologically advanced new fibreline. This will further bolster the company’s margins by about 400-450 bps.
Captive plantations to provide raw material security Post expansion, the company’s raw material requirement is expected to increase from
3.8 lakh tonnes to about 9 lakh tonnes (assuming 100% capacity utilisation). As of today, West Coast is primarily dependent on private cultivators and procures wood
from within Karnataka as well as from Andhra Pradesh, Tamil Nadu, Pondicherry and
Maharashtra.
To ensure a consistent supply of wood, the company had initiated a Core Plantation
Scheme in FY09 within a radius of 250 km of Dandeli by partnering with local farmers to use waste/degraded land for hi-tech plantations of pulpwood. The initiative of captive
planatation by West Coast was the first of its kind in India. As of March 2010, West
Coast had an area of about 6,500 hectares covered under its Core Plantation Scheme. The company has plans to bring an additional 8,000 hectares of land under captive
plantation each year to reach about 40,000 hectares by 2014.
The company has replaced its old fibreline with a new technologically advanced one, which is expected to increase margins by 400-450 bps
Captive plantations to benefit the company in the long run

CRISIL Equities
The West Coast Paper Mills Limited
7
Wood supply from captive plantation would lead to raw material security for West
Coast. Based on the company’s plans to increase land under plantation, the company
is expected to meet about 4 lakh tonnes (45% of its wood requirement considering 100% capacity utilisation) from captive plantation. Reduction in transportation costs due
to plantation within a radius of 250 km from Dandeli will reduce the overall raw material
cost to the company, subsequently improving margins.
Financial flexibility to be strained in the medium term West Coast’s financial flexibility is expected to be strained in the medium term due to a
substantial increase in the company’s borrowings to fund its capital expenditure. The
company incurred capital expenditure of about Rs 13.8 bn for its plant expansion, of which about Rs 7.5 bn was funded through debt. West Coast availed its total debt
requirement for the expansion project in FY09. Consequently, its debt-equity increased
from 1.0 times in FY08 to 2.5 times in FY09 and continued to be high at 2.4 times in FY10 in the absence of debt repayment.
Though the company has availed ECB from IFC, ICICI and Barclays, its financial
flexibility is likely to be under strain in the next few years due to an increase in capital
costs because of high borrowings. Also, the company will be highly vulnerable to foreign exchange fluctuations due to ECB loans. However, with expanded capacities,
West Coast aims to increase the volume of paper exports. Foreign exchange earnings
from paper exports would provide a natural hedge for the company’s interest and loan repayments.
High gearing and capital costs to put pressure on the company’s financial flexibility

CRISIL Equities
The West Coast Paper Mills Limited
8
Key Risks
Margins susceptible to international price movements In India about 26% of paper production is dependent on imported pulp and imported wastepaper. Thus, domestic paper prices tend to mirror international price trends. An
integrated player like West Coast would not be highly impacted by variations in
international pulp and wastepaper prices as its dependence on the same is very low. However, a fall in international pulp and wastepaper prices would make non-integrated
players competitive. Conversely, a rise in international prices would be to West Coast’s
advantage.
Raw material prices and availability The cost of wood has been rising constantly on account of increase in royalty,
procurement rates and freight charges. While paper realisations in FY10 were low due to sluggish market conditions, wood prices continued their uptrend mainly driven by
high freight costs. Thus, increasing wood prices would remain a cause for concern for
West Coast.
Over FY11-13, West Coast’s wood requirement is expected to double (considering 90%+ capacity utilisation). Consequently, the risk of procuring adequate wood at
reasonable prices has increased further. To mitigate the risk of wood availability at
reasonable prices, West Coast is focussed on its captive plantation scheme. The company is targeting to achieve about 45% of its wood requirement from captive
plantations by FY14.

CRISIL Equities
The West Coast Paper Mills Limited
9
Financial Outlook
Increase in production and realisations to drive revenue growth West Coast’s revenues grew by just 1% in FY10, as the company had achieved almost 100% utilisation of the unexpanded capacity. While the company benefitted from an
increase in sales volume by about 3% and a reduction in excise duty, it was offset by a
fall in paper realisations by about 4% due to sluggish paper market conditions.
In early FY11, the company has expanded its capacity from 180,000 tpa to 315,000
tpa. It has altered its product mix to produce more W&P paper which commands a premium price over industrial paper. Also, in the W&P segment the company would be
producing more superior quality variants resulting in higher realisations. The company
also has the flexibility to produce pulp sheet in its new enhanced fibreline capacity and sell it in the domestic market.
Increased production to cater to a steadily growing market is expected to result in higher revenues for West Coast in FY11. The company is amongst the few larger paper
players who have or are putting up paper capacities. Revenues would also get a boost
from higher realisations due to a superior product mix. Also, firming paper prices in FY11 would benefit West Coast, who is an integrated player.
Accordingly, we expect revenues to register a CAGR of 37% over FY10-12.
Production to increase post expansion Revenues to grow at a CAGR of 37%
50%
60%
70%
80%
90%
100%
110%
120%
150
170
190
210
230
250
270
290
310
330
FY07 FY08 FY09 FY10 FY11E FY12E
Capacity ProductionSales Capacity utilisation (RHS)
(In '000)(In '000)
5.6 5.9 6.2 6.3
10.2
11.7
5% 5% 6%1%
62%
15%
0%
10%
20%
30%
40%
50%
60%
70%
-
2.0
4.0
6.0
8.0
10.0
12.0
14.0
FY07 FY08 FY09 FY10 FY11E FY12E
Operating income YoY Growth (RHS)
(Rs bn)
Source: Company, CRISIL Equities estimate Source: Company, CRISIL Equities estimate
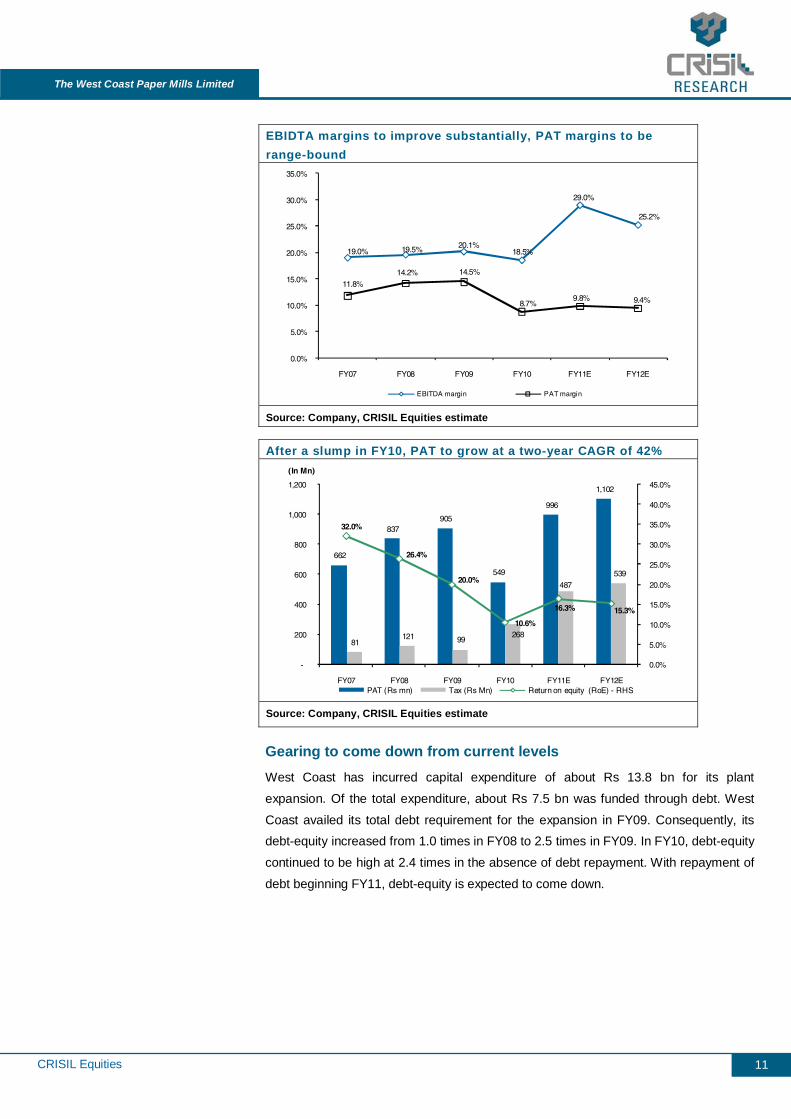
EBITDA margins to improve due to efficieny gains and product mix In FY11, we expect West Coast’s EBITDA margin to improve substantially from 18.5%
in FY10 to about 29.0% in FY11 because of efficiency gains and higher realisations. In FY12, paper prices are again expected to come down with the expectation of
international pulp and wastepaper prices correcting. Accordingly, margins are expected
to fall to about 25-26% and thereafter stabilise at 26-27%, higher than the earlier range of 18-20%, on account of efficiency gains and a change in product mix.
We expect revenues to register a robust growth of 37% over FY10-12 on the back of expanded capacity and production

CRISIL Equities
The West Coast Paper Mills Limited
10
FY11 will be a year of supernormal profits In FY11, prices of international pulp and wastepaper have almost doubled from FY10
levels and prices are expected to remain firm through the year. Consequently, domestic
players have increased paper prices to pass on the increase in costs to consumers. For an integrated player like West Coast, increase in realisations would directly add to
the bottom line as its dependence on imported pulp and wastepaper is very low for its
paper production. Thus, it stands to make supernormal profits in FY11 because paper prices are expected to be firm.
High pulp prices to benefit West Coast
-
100
200
300
400
500
600
700
800
900
1,000
Jul-
96
Jul-
97
Jul-
98
Jul-
99
Jul-
00
Jul-
01
Jul-
02
Jul-
03
Jul-
04
Jul-
05
Jul-
06
Jul-
07
Jul-
08
Jul-
09
Jul-
10
($/tonne)
Average Pulp prices
Source: CRISIL Research
In FY12, paper prices are again expected to fall with the expectation of international
pulp and wastepaper prices correcting.
Despite an increase in EBITDA margin, PAT margins are expected to remain
suppressed on account of higher interest and depreciation charges. West Coast capitalised a part of its plant and machinery in FY10 and the majority of it in FY11.
Consequently, depreciation charges for FY11 are expected to increase. Interest cost is
expected to increase as the company discontinues capitalising its interest cost. RoE, which declined to about 10.6% in FY10, is expected to increase to about 16.3% in
FY11 and 15.3% in FY12.
Increase in EBITDA margin will not translate directly into PAT margin on account of rise in depreciation and interest costs
CRISIL Equities
The West Coast Paper Mills Limited
11
EBIDTA margins to improve substantially, PAT margins to be range-bound
19.0% 19.5% 20.1%18.5%
29.0%
25.2%
11.8%14.2% 14.5%
8.7%9.8% 9.4%
0.0%
5.0%
10.0%
15.0%
20.0%
25.0%
30.0%
35.0%
FY07 FY08 FY09 FY10 FY11E FY12E
EBITDA margin PAT margin
Source: Company, CRISIL Equities estimate
After a slump in FY10, PAT to grow at a two-year CAGR of 42%
662
837 905
549
996
1,102
81 121 99
268
487 539
32.0%
26.4%
20.0%
10.6%
16.3% 15.3%
0.0%
5.0%
10.0%
15.0%
20.0%
25.0%
30.0%
35.0%
40.0%
45.0%
-
200
400
600
800
1,000
1,200
FY07 FY08 FY09 FY10 FY11E FY12EPAT (Rs mn) Tax (Rs Mn) Return on equity (RoE) - RHS
(In Mn)
Source: Company, CRISIL Equities estimate
Gearing to come down from current levels West Coast has incurred capital expenditure of about Rs 13.8 bn for its plant
expansion. Of the total expenditure, about Rs 7.5 bn was funded through debt. West
Coast availed its total debt requirement for the expansion in FY09. Consequently, its debt-equity increased from 1.0 times in FY08 to 2.5 times in FY09. In FY10, debt-equity
continued to be high at 2.4 times in the absence of debt repayment. With repayment of
debt beginning FY11, debt-equity is expected to come down.

CRISIL Equities
The West Coast Paper Mills Limited
12
Gearing to reduce as the company repays debt
0.7
1.0
2.5 2.4
1.7
1.2
-
0.5
1.0
1.5
2.0
2.5
3.0
FY07 FY08 FY09 FY10 FY11E FY12E
(times)
Source: Company, CRISIL Equities estimate
High interest coverage on account of external borrowing While West Coast has a high leverage, about 60% of its total debt is in the form of
ECBs and about 7% of total debt is interest-free loan under the sales tax deferral scheme. The ECBs attract interest rate of LIBOR +175 bps, where the company is
currently paying an interest of about 2.2%. Accordingly, the company has healthy
interest coverage of 3.4x in FY11E. Also, as per our estimates, the company can generate enough cash flow to bring the debt-equity ratio to less than 0.5 times over the
next four to five years.
Table 3: Debt break-up of West Coast Particulars of debt Rs mn % of total loan Interest rate Redeemable non-convertible debentures 650 5% 12.50% Working capital facilities from banks 262 2% 8% International Finance Corporation (IFC) 1,796 15% Libor+175bps Barclays Bank Plc. Mauritius 898 7% Libor+175bps ICICI Bank Ltd., Singapore - Led Syndicate 4,791 39% Libor+175bps Central Bank of India 1,000 8% 8% Loan from banks 2,050 17% 8% Interest-free loan under the sales tax deferral scheme 901 7% 0% Total 11,347 Source: Company, CRISIL Equities
Overall interest costs low, thanks to external borrowings

CRISIL Equities
The West Coast Paper Mills Limited
13
Management Evaluation
CRISIL's fundamental grading methodology includes a broad assessment of
management quality, apart from other key factors such as industry and business
prospects, and financial performance. Overall, we feel that the management has strong domain expertise and will drive the company’s growth in the near future.
Strong management with good experience and domain expertise West Coast is the flagship company of the S. K. Bangur Group. The promoter has many years of experience in the paper, power cables, chemicals, tea, coffee, rubber
and information technology sectors in India. Mr S. K. Bangur is the Chairman and
Managing Director of the company. He has served as President of the Indian Paper Manufacturers Association, an apex body of large and integrated paper mills from 2001
to 2003. Currently, he is a committee member of the Federation of Indian Chamber of
Commerce & Industry, Indian Chamber of Commerce and Bharat Chamber of Commerce.
Capacity expansion puts West Coast in the top five league West Coast’s management was successful in enhancing paper manufacturing
capacities from 180,000 tpa to 315,000 tpa in 2010. Expansion activities were undertaken with a vision - to intensify the development activities towards fibre resource
management, quality improvement, upgradation of technology to achieve energy
efficiency and be environmental friendly. Although the expansion plan looked ambitious, West Coast’s management was successful in commissioning environment-
affable capacities, which will put the company in the league of top five players like
Ballarpur Industries (950,000 tpa), Tamil Nadu Newsprint and Papers (400,000 tpa), JK Paper (240,000 tpa) and Andhra Pradesh Paper Mills (241,000 tpa).
Strong second line of management Based on our interactions with the company, we believe that the second line is highly experienced. The second line of management has more than 10-15 years of
experience in their respective fields. Moreover, key managerial personnel have been in
the company on an average for more than five years.
Experienced promoters with vast industry experience

CRISIL Equities
The West Coast Paper Mills Limited
14
Corporate Governance
CRISIL’s fundamental grading methodology includes a broad assessment of corporate governance and management quality, apart from other key factors such as industry and
business prospects, and financial performance. In this context, CRISIL Research
analyses shareholding structure, board composition, typical board processes, disclosure standards and related-party transactions. Any qualifications by regulators or
auditors also serve as useful inputs while assessing a company’s corporate
governance.
Overall, corporate governance at West Coast presents good practices supported by a strong and fairly independent board. Further, the current board has a good experience
in the industry. We feel that the company's corporate governance practices are
adequate and meet the minimum required levels.
Board composition West Coast’s board comprises 10 members – 3 promoter directors, 6 independent
directors and 1 executive director. The board is in accordance with the stipulated SEBI listing guidelines. Given the background of directors, we believe that the board in place
at West Coast is fairly diversified.
Board’s processes The company has various committees – audit, remuneration and investors’ grievance -
in place to support corporate governance practices. The company's disclosures are
sufficient to analyse various business aspects of the company. CRISIL Equities assesses from its interactions with independent directors of the company that the
quality of agenda papers and the level of debate of discussions at the board meetings
are good.
The company’s quality of disclosure can be considered good, judged by the level of information and details furnished in annual reports, website and other publicly available
data. We feel that the independent directors are well aware of the business and are
fairly engaged in all the major decisions reflecting well on the company's corporate governance practices. The audit committee is chaired by an independent director, Mr.
Krishna Kumar Karwa, and it meets at timely and regular intervals.
West Coast’s corporate governance practices are adequate and meet the minimum required standards

CRISIL Equities
The West Coast Paper Mills Limited
15
Valuation Grade: 3/5
We have valued West Coast using the price-to-earnings ratio (PER) method. We
initiate coverage on West Coast with a fair value of Rs 97 per share and valuation grade of ‘3/5’. This grade indicates that the current market price is ‘aligned’ to our fair
price estimate.
Between April 2003 and March 2008, West Coast has traded at an average one-year rolling forward PER of 5.6x. Since then, due to concerns on ambitious capacity
expansion plans, PER has compressed to an average of 4.2x in FY09, wherein debt-to-
equity increased from 1x in FY08 to 2.5x in FY09. One-year rolling forward PER band
0
40
80
120
160
Apr
-03
Apr
-04
Apr
-05
Apr
-06
Apr
-07
Apr
-08
Apr
-09
Apr
-10
(Rs)
WCPML 3 5 7
Source: CRISIL Equities estimate Note- WCPML: West Coast Paper Mills Ltd.
However, post commissioning of new capacities in May 2010, the stock price witnessed a significant jump and increase in PER. Currently, the stock is trading at a PER of 6.8x.
Due to an expected improvement in revenues and PAT from FY11 onwards, we believe
the expansion in PER is not temporary. Therefore, we have assigned a PER of 6x to FY12 EPS of Rs 15.5 and arrived at a value of Rs 93 per share.
In September 2003, West Coast acquired a 33.9% stake in Rama Newsprint and Papers Ltd (Rama Newsprint) from ICICI for Rs 393.8 mn. Currently, West Coast holds
36.3% stake in Rama Newsprint. Based on Rama Newsprint’s current market value
and holding a company discount of 25%, West Coast’s stake comes to Rs 283 mn, translating to Rs 4.0 per West Coast’s outstanding share. Therefore, our fair value
estimate for West Coast is Rs 97 per share.
We assign a fair value of Rs 97 per share to West Coast and initiate coverage with a valuation grade of ‘3/5’

CRISIL Equities
The West Coast Paper Mills Limited
16
One-year rolling forward PER compared to Ballarpur One-year rolling forward EV/EBITDA compared to
Ballarpur
2
6
10
14
18
22
Apr-06 Nov-06 Jun-07 Jan-08 Aug-08 Mar-09 Oct-09 May-10
PE
(X
)
West Coast Ballarpur
0
2
4
6
8
10
12
14
Apr-04 Apr-05 Apr-06 Apr-07 Apr-08 Apr-09 Apr-10
EV
/EB
ITD
A (
X)
West Coast Ballarpur
Source: CRISIL Equities Source: CRISIL Equities Table 4: Peer comparison
Market Cap (Rs mn)
P/E P/B EV/EBITDA ROE
FY10 FY11 FY12 FY10 FY11 FY12 FY10 FY11 FY12 FY10 FY11 FY12WEST COAST 5,676 10.3 6.5 5.8 1.1 0.9 0.8 15.1 5.6 5.1 10.6 16.3 15.3BALLARPUR 21,718 10.9 11.4 6.4 1.0 1.1 0.9 7.9 7.5 5.8 10.3 9.1 15.5ORIENT 10,367 6.6 5.9 5.0 1.3 1.2 1.0 4.5 5.4 3.6 22.1 20.0 20.0JK PAPER 4,224 4.6 - - 0.9 - - 3.8 - - - - -ANDHRA PAPER 4,602 6.7 - - 0.9 - - 5.0 - - 11.8 - -SESHASAYEE 2,239 5.6 - - 1.0 - - 4.0 - - 19.1 - -TAMILNADU
NEWSPRINT 8,686 6.9 - - 1.3 - - 4.0 - - 16.5 - -
Note: – Not Available Source: Industry estimates, CRISIL Equities estimates

CRISIL Equities
The West Coast Paper Mills Limited
17
Company Overview
The West Coast Paper Mills Ltd (West Coast) is a part of the S. K. Bangur Group,
which is present in paper, power cables, chemicals, tea, coffee, rubber and information technology sectors. West Coast was promoted in 1955 by Shree Digvijay Cement
Company Ltd (originally a S. K. Bangur Group company, which was taken over by the
Aditya Birla Group). In 1959, the company began commercial production of paper with a manufacturing capacity of 18,000 tpa. It was the first paper company in India to use
100% hardwood as raw material instead of bamboo. It is also the first company to
initiate a captive plantation project to meet its wood requirement. The company acquired 33.9% equity of Rama Newsprint & Papers in 2003 and currently holds
around 36.3% stake in the company. Also, other S. K. Bangur Group companies hold a
17.6% stake in Rama Newsprint taking the total group stake in the company to 54.0%. Rama Newsprint is a large player in the newsprint segment and has been
manufacturing W&P paper since FY08.
Business Overview West Coast is one of the large players in the domestic paper industry. Its product
portfolio consists of paper, optic fibre cables and wind power with paper contributing
about 94% of sales in FY10. W&P paper dominates the company’s paper portfolio, accounting for nearly 64% of
paper production (pre-expansion). In May 2010, the company has expanded capacity
from 180,000 tpa to 315,000 tpa. Post expansion, the product mix is going to be highly biased towards W&P paper (about 79%) resulting in higher realisations and margins.
West Coast also manufactures optical fibre cables for the telecom industry. It owns six
windmills with a combined installed capacity of 1.75 MW. However, the total share of these businesses to total revenues is low at 6% as of FY10 and is expected to go down
further because of expanded paper capacities.
Table 5: Segment-wise break up Particulars Units FY08 FY09 FY10 Sales Paper 000 tonnes 170.2 170.7 175.2 Optic fibre cable 000 Kms 22.8 16.8 17.8 Wind power 000 Kwh 2,042.6 1,424.3 1,785.1 Sales revenue Paper Rs mn 5,965 6,189 6,118 Optic fibre cable Rs mn 557 434 381 Wind power Rs mn 5 4 5 Gross sales Rs mn 6,527 6,627 6,504
Source: Company, CRISIL Equities

CRISIL Equities
The West Coast Paper Mills Limited
18
Annexure: Financials
Income Statement (Rs Mn) FY08 FY09 FY10 FY11E FY12E Net sales 5,836 6,193 6,245 10,106 11,639 Operating Income 5,900 6,231 6,295 10,186 11,731 EBITDA 1,152 1,254 1,163 2,952 2,956 Depreciation 204 210 238 888 867 Interest 78 79 122 602 472 Other Income 88 41 13 21 24 PBT 957 1,004 817 1,483 1,641 PAT 837 905 549 996 1,102 No. of shares (In Mn) 57.0 60.0 63.0 71.0 71.0 Earnings per share (EPS) 14.6 15.0 8.8 14.0 15.5 Balance Sheet (Rs Mn) FY08 FY09 FY10 FY11E FY12E Equity capital (FV - Rs 2) 115 121 125 142 142 Reserves and surplus 3,905 4,907 5,238 6,687 7,456 Debt 4,062 12,387 12,997 11,347 9,347 Current Liabilities and Provisions 1,374 2,062 2,099 2,959 3,589 Deferred Tax Liability/(Asset) 416 400 665 885 1,129 Capital Employed 9,871 19,877 21,124 22,020 21,664 Net Fixed Assets 2,213 2,068 8,056 14,668 14,102 Capital WIP 3,099 11,200 7,469 119 119 Investments 550 460 467 467 467 Loans and advances 589 1,433 1,833 2,033 2,233 Inventory 1,127 1,437 1,791 2,898 3,337 Receivables 429 434 342 554 638 Cash & Bank Balance 1,863 2,844 1,166 1,281 768 Applications of Funds 9,871 19,877 21,124 22,020 21,664
Source: Company, CRISIL Equities estimate

CRISIL Equities
The West Coast Paper Mills Limited
19
Cash Flow (Rs Mn) FY08 FY09 FY10 FY11E FY12E Pre-tax profit 957 1,004 817 1,483 1,641 Total tax paid (110) (115) (3) (267) (295) Depreciation 204 210 238 888 867 Change in working capital 317 (470) (626) (659) (93) Cash flow from operating activities 1,369 630 426 1,445 2,119 Capital expenditure (3,200) (8,167) (2,494) (150) (300) Investments and others (90) 90 (7) - - Cash flow from investing activities (3,290) (8,077) (2,501) (150) (300) Equity raised/(repaid) 1,052 135 115 750 - Debt raised/(repaid) 2,321 8,325 611 (1,650) (2,000) Dividend (incl. tax) (201) (147) (211) (280) (333) Others (incl extraordinaries) 10 115 (117) - - Cash flow from financing activities 3,182 8,428 397 (1,180) (2,333) Change in cash position 1,261 981 (1,678) 115 (513) Opening Cash 602 1,863 2,844 1,166 1,281 Closing Cash 1,863 2,844 1,166 1,281 768 Ratios FY08 FY09 FY10 FY11E FY12E Growth ratios Sales growth (%) 5.5 5.6 1.0 61.8 15.2 EBITDA growth (%) 8.6 8.8 (7.2) 153.8 0.1 EPS growth (%) (6.9) 8.3 (41.9) 60.7 10.7 Profitability Ratios EBITDA Margin (%) 19.5 20.1 18.5 29.0 25.2 PAT Margin (%) 14.2 14.5 8.7 9.8 9.4 Return on Capital Employed (RoCE) (%) 15.6 8.2 5.2 11.3 11.9 Return on equity (RoE) (%) 26.4 20.0 10.6 16.3 15.3 Dividend and Earnings Dividend per share (Rs) 3.5 2.4 3.4 3.4 4.0 Dividend payout ratio (%) 25.4 16.3 38.7 24.1 25.8 Dividend yield (%) 3.9 2.7 3.7 3.7 4.4 Earnings Per Share (Rs) 14.6 15.0 8.8 14.0 15.5 Efficiency ratios Asset Turnover (Sales/GFA) 1.2x 1.3x 0.8x 0.7x 0.7x Asset Turnover (Sales/NFA) 2.7x 2.9x 1.2x 0.9x 0.8x Sales/Working Capital 6.3x 6.2x 4.1x 4.6x 4.6x Financial stability Debt-equity 1.0 2.5 2.4 1.7 1.2 Interest Coverage 12.1 13.1 7.6 3.4 4.4 Current Ratio 3.0 3.0 2.4 2.3 1.9 Valuation Multiples Price-earnings 6.2x 6.0x 10.3x 6.5x 5.8x Price-book 1.3x 1.1x 1.1x 0.9x 0.8x EV/EBITDA 6.3x 12.0x 15.1x 5.6x 5.1x
Source: Company, CRISIL Equities estimate

CRISIL Equities
The West Coast Paper Mills Limited
20
Shareholding pattern (In %)- June 2010 Share price movement chart
Promoter, 52
Institutions, 6
Bodies Corporate, 15
Individuals, 26Others, 1
0
50
100
150
200
Apr
-06
Jul-
06
Oct
-06
Jan-
07
Apr
-07
Jul-
07
Oct
-07
Jan-
08
Apr
-08
Jul-
08
Oct
-08
Jan-
09
Apr
-09
Jul-
09
Oct
-09
Jan-
10
Apr
-10
Jul-
10
West Coast Nifty
Source: NSE Source: NSE -Indexed to 100
Segment-wise Break Up of Revenues – FY10 Production to increase post expansion
Paper94%
Optic fibre cable6%
Wind power0%
50%
60%
70%
80%
90%
100%
110%
120%
150
170
190
210
230
250
270
290
310
330
FY07 FY08 FY09 FY10 FY11E FY12E
Capacity ProductionSales Capacity utilisation (RHS)
(In '000)(In '000)
Source: Company, CRISIL Equities Source: Company, CRISIL Equities estimate
Revenues to grow at a CAGR of 37% EBIDTA margins to improve substantially, PAT margins to be range-bound
5.6 5.9 6.2 6.3
10.2
11.7
5% 5% 6%1%
62%
15%
0%
10%
20%
30%
40%
50%
60%
70%
-
2.0
4.0
6.0
8.0
10.0
12.0
14.0
FY07 FY08 FY09 FY10 FY11E FY12E
Operating income YoY Growth (RHS)
(Rs bn)
19.0% 19.5% 20.1%18.5%
29.0%
25.2%
11.8%
14.2% 14.5%
8.7%9.8% 9.4%
0.0%
5.0%
10.0%
15.0%
20.0%
25.0%
30.0%
35.0%
FY07 FY08 FY09 FY10 FY11E FY12E
EBITDA margin PAT margin
Source: Company, CRISIL Equities estimate Source: Company, CRISIL Equities estimate

CRISIL Independent Equity Research Team Mukesh Agarwal [email protected] +91 (22) 3342 3035 Director Tarun Bhatia [email protected] +91 (22) 3342 3226 Director- Capital Markets Analytical Contacts Chetan Majithia [email protected] +91 (22) 3342 4148 Sudhir Nair [email protected] +91 (22) 3342 3526 Sector Contacts Nagarajan Narasimhan [email protected] +91 (22) 3342 3536 Ajay D'Souza [email protected] +91 (22) 3342 3567 Manoj Mohta [email protected] +91 (22) 3342 3554 Sachin Mathur [email protected] +91 (22) 3342 3541 Sridhar C [email protected] +91 (22) 3342 3546 Business Development Contacts Vinaya Dongre [email protected] +91 99 202 25174 Sagar Sawarkar [email protected] +91 98 216 38322 CRISIL’s Equity Offerings The Equity Group at CRISIL Research provides a wide range of services including:
Independent Equity Research IPO Grading White Labelled Research Valuation on companies for use of Institutional Investors, Asset Managers, Corporate
Other Services by the Research group include
CRISINFAC Industry research on over 60 industries and Economic Analysis Customised Research on Market sizing, Demand modelling and Entry strategies Customised research content for Information Memorandum and Offer documents

For further details or more information, please contact: Client Servicing CRISIL Research CRISIL House Central Avenue Hiranandani Business Park Powai, Mumbai - 400 076, India. Phone +91 (22) 3342 3561/ 62 Fax +91 (22) 3342 3501 E-mail: [email protected] E-mail: [email protected] www.ier.co.in
About CRISIL Limited CRISIL is India's leading Ratings, Research, Risk and Policy Advisory Company About CRISIL Research CRISIL Research is India's largest independent, integrated research house. We leverage our unique, integrated research platform and capabilities spanning the entire economy-industry-company spectrum to deliver superior perspectives and insights to over 600 domestic and global clients, through a range of subscription products and customised solutions.
Mumbai CRISIL House Central Avenue Hiranandani Business Park Powai, Mumbai - 400 076, India. Phone +91 (22) 3342 8026/29/35 Fax +91 (22) 3342 8088
New Delhi The Mira G-1 (FF),1st Floor, Plot No. 1&2 Ishwar Nagar, Near Okhla Crossing New Delhi -110 065, India. Phone +91 (11) 4250 5100, 2693 0117-21 Fax +91 (11) 2684 2212/ 13
Bangaluru W-101, Sunrise Chambers 22, Ulsoor Road Bengaluru - 560 042, India. Phone +91 (80) 4117 0622 Fax +91 (80) 2559 4801
Kolkata ‘Horizon’, Block ‘B’, 4th floor 57 Chowringhee Road Kolkata - 700 071, India. Phone +91 (33) 2283 0595 Fax +91 (33) 2283 0597
Chennai Mezzanine Floor, Thappar House 43 / 44, Montieth Road Egmore Chennai - 600 008, India. Phone +91 (44) 2854 6205/06, 2854 6093 Fax +91 (44) 2854 7531