Incumbent Response to Entry by Low-Cost Carriers in the · PDF fileIncumbent Response to Entry...
30
Incumbent Response to Entry by Low-Cost Carriers in the U.S. Airline Industry * Kerry M. Tan † June 2011 Abstract This paper studies the price response of incumbents to entry by low-cost carriers in the U.S. airline industry. Previous theoretical papers suggest that entry leads to two opposing eects on incumbent price. Airlines might respond to competition by lowering prices to compete harder for existing customers or they might increase prices to exploit their brand- loyal customers. This paper tests which eect is more prominent in the airline industry. Based on a sample of four low-cost carrier entrants, I nd that legacy carrier incumbents respond dierently than low-cost carrier incumbents to new low-cost carrier entry. Legacy carriers decrease their mean airfare, 10th percentile airfare, and 90th percentile airfare before and after entry by a low-cost carrier. However, low-cost carriers do not signicantly alter their pricing strategy. The diering incumbent responses can be attributed to the nding that low-cost carrier entrants tend to match the price set by rival low-cost carriers in the quarter of entry and tend to enter with a lower price than that of legacy carrier incumbents. This paper also extends the ndings of previous studies on the eect of competition and price dispersion. Namely, entry does not aect the dispersion in short-run prices set by incumbent carriers, which contrasts with the key long-run result in Gerardi and Shapiro (2009) and Borenstein and Rose (1994). * I would like to thank Matt Lewis for his guidance and helpful advice. I would also like to thank Jim Peck, Huanxing Yang, Nancy Rose, Adam Shapiro, David Mills, Bill Dupor, Michael Sinkey, and participants of the Rising Stars: Airlines session at the 2011 International Industrial Organization Conference for their suggestions and comments. † Department of Economics, The Ohio State University, [email protected] 1
Transcript of Incumbent Response to Entry by Low-Cost Carriers in the · PDF fileIncumbent Response to Entry...

Incumbent Response to Entry by
Low-Cost Carriers in the U.S. Airline Industry∗
Kerry M. Tan†
June 2011
Abstract
This paper studies the price response of incumbents to entry by low-cost carriers in theU.S. airline industry. Previous theoretical papers suggest that entry leads to two opposingeUects on incumbent price. Airlines might respond to competition by lowering prices tocompete harder for existing customers or they might increase prices to exploit their brand-loyal customers. This paper tests which eUect is more prominent in the airline industry.Based on a sample of four low-cost carrier entrants, I Vnd that legacy carrier incumbentsrespond diUerently than low-cost carrier incumbents to new low-cost carrier entry. Legacycarriers decrease their mean airfare, 10th percentile airfare, and 90th percentile airfare beforeand after entry by a low-cost carrier. However, low-cost carriers do not signiVcantly altertheir pricing strategy. The diUering incumbent responses can be attributed to the Vndingthat low-cost carrier entrants tend to match the price set by rival low-cost carriers in thequarter of entry and tend to enter with a lower price than that of legacy carrier incumbents.This paper also extends the Vndings of previous studies on the eUect of competition andprice dispersion. Namely, entry does not aUect the dispersion in short-run prices set byincumbent carriers, which contrasts with the key long-run result in Gerardi and Shapiro(2009) and Borenstein and Rose (1994).
∗I would like to thank Matt Lewis for his guidance and helpful advice. I would also like to thank Jim Peck, Huanxing Yang, Nancy Rose,Adam Shapiro, David Mills, Bill Dupor, Michael Sinkey, and participants of the Rising Stars: Airlines session at the 2011 International IndustrialOrganization Conference for their suggestions and comments.†Department of Economics, The Ohio State University, [email protected]
1

1 Introduction
When a Vrm enters a market consisting of a brand-loyal segment and a price-sensitive seg-
ment, there are two eUects on the incumbents’ pricing strategy: the competitive eUect and the
displacement eUect. Once the entrant enters, the incumbent would continue to decrease prices
in order to keep customers because the incumbent Vrm’s individual demand curve decreases and
becomes more elastic due to an increase in the number of substitutes. Klemperer (1987) and
PerloU and Salop (1985) refer to this as the competitive eUect. On the other hand, Rosenthal
(1980) and Hollander (1987) provide the theoretical foundation for the displacement eUect, in
which entry can actually cause incumbents to increase their prices due to the existence of the
two market segments. If entrants are known to cater toward price-sensitive consumers, then
incumbents may be best served by increasing prices. In eUect, these incumbents will focus their
attention on their brand-loyal consumers, who will continue purchasing from them even if an
entrant oUers lower prices. This strategy will maximize proVts whenever the increase in price
dominates the eUect of the quantity decrease. Since both eUects can occur simultaneously, the
net eUect on prices depends on which eUect is more prominent.
The growth of several low-cost carriers over the past decade allows for the ability to study
whether the competitive eUect or the displacement eUect is more important in the airline indus-
try. This paper focuses on two types of airlines:1 legacy carriers and low-cost carriers. Legacy
carriers are airlines that operate a hub-and-spoke network2 and were founded prior to the in-
dustry’s deregulation in 1978, while low-cost carriers implement a point-to-point network3 and
emerged after deregulation. The purpose of this paper is to study the price response of both
legacy carrier and low-cost carrier incumbents when a low-cost carrier enters a new route.
The key result of the paper is that legacy carrier incumbents react diUerently than low-cost
carrier incumbents to entry by low-cost carriers. First, legacy carrier incumbents signiVcantly
decrease average one-way airfares the quarter before and the quarter after actual entry by a low-
cost carrier. Moreover, low-cost carrier incumbents do not seem to signiVcantly respond to entry
by a rival low-cost carrier. Second, I study how the incumbents’ distribution of prices changes
due to entry by a low-cost carrier. The 10th percentile prices decrease by about the same amount
as the 90th percentile prices so that no signiVcant change occurs to the overall price distribution
of the airfares. As such, there is no statistically signiVcant change to price dispersion. Prices
1I use the terms “airlines" and “carriers" interchangeably throughout the paper.2A hub-and-spoke network concentrates passengers from several satellite airports (spokes) at a major airport
(hub) en route to their Vnal destination airport.3A point-to-point network provides more direct service with fewer connections than a hub-and-spoke network.
2
decrease all along the distribution of prices almost equally so that price dispersion does not
change. Finally, low-cost carrier entrants are likely to enter with an average price that is around
the average price of low-cost carrier incumbents and less than that of legacy carrier incumbents.
Hence, one reason why low-cost carrier incumbents do not signiVcantly respond to entry by
a rival low-cost carrier is because the entrant tends to match the price of the low-cost carrier
incumbent. Meanwhile, there is downward pressure on legacy carrier incumbents’ prices since
the entrant sets a price that is likely to be lower than their price. Although both the story based
on the competitive eUect and the displacement eUect seem to be plausible in the airline industry,
the results support the claim that the competitive eUect dominates the displacement eUect.
Three papers closely relate to this present work. Goolsbee and Syverson (2009) examine the
eUect of potential competition by Southwest Airlines on rivals’ pricing strategies. They Vnd
that carriers decrease their prices when they face potential competition with Southwest Airlines,
suggesting that incumbents decrease their prices when entry is merely threatened. They estimate
a two-way Vxed eUects model, incorporating time dummies to estimate the eUects of potential
competition on prices. In eUect, they conduct an event study by examining the incumbents’
prices before, during, and after Southwest Airlines enters both airports of a route. I expand
upon their work by modifying their estimation strategy so that I can examine the eUect of actual
competition4 when entry actually occurs by not only Southwest Airlines but also other low-cost
carriers.
Gerardi and Shapiro (2009) investigate how an airline’s ability to price discriminate on a given
route is aUected by competition. They Vnd that price dispersion decreases with competition, in
stark contrast to Borenstein and Rose (1994). Both my paper and these previous papers studies
how a Vrm responds to competition. However, the previous literature is interested in estimating
the eUect of competition on price dispersion in the airline industry as a whole, whereas this paper
examines how price dispersion changes upon entry by a low-cost carrier. Naturally, endogeneity
problems arise with these types of studies. I try to minimize the endogeneity problem by looking
at entry as opposed to a smooth measure of competition, such as the route-level HerVndahl-
4It is important to note the diUerences between the diUerent types of competition in the airline industry. Supposethat Southwest Airlines operates at the San Diego International Airport (SAN) and the San Francisco InternationalAirport (SFO). Suppose further that Southwest Airlines services the SAN-SFO route. Actual competition exists whentwo airlines service the same route at the same time. United Airlines is said to actually compete with SouthwestAirlines if United also services the SAN-SFO route at the same time as Southwest Airlines. Now suppose thatSouthwest Airlines also operates at the Los Angeles International Airport (LAX), but does not service the SAN-LAXroute. Potential competition exists when a Vrm operates at two airports but does not service the route linking bothairports that is served by another airline. United Airlines potentially competes with Southwest Airlines if Unitedservices the SAN-LAX route at the same time that Southwest Airlines operates at both airports but does not servicethe SAN-LAX route.
3

Hirschman Index. Moreover, the previous literature assumes that the eUect of competition is the
same for all airlines, while I allow the eUect of entry on price dispersion to vary across diUerent
airlines. I am interested in how the incumbents respond to entry by each low-cost carrier.
One of the key results of this paper is that an increase in competition does not lead to a sig-
niVcant change in the incumbent’s price dispersion, which diUers from the Vndings from both
Gerardi and Shapiro (2009) and Borenstein and Rose (1994). This can be attributed to the diUering
identiVcation strategy in this paper from the two previous studies, which regress measures for
price dispersion on several control variables, including various proxies for competition. Their
key Vndings stem from the sign and strength of the estimated coeXcient for the competition
variables. In eUect, they are estimating the long-run eUect of competition on rival’s price distri-
bution. The major diUerence in the analysis of this study to the previous literature is that this
paper uses entry as opposed to the route-level HerVndahl-Hirschman Index to identify competi-
tor’s response to competition. I analyze the pricing behavior right around entry by performing
an event study that captures the short-run eUect of competition on price dispersion. By inves-
tigating how the Gini coeXcient and the tails of the price distribution change around the entry
period, this paper is able to shed new light on the eUect of competition on the price distribution
of rival Vrms.
The paper is structured in the following manner. Section 2 presents background information
on the airline industry and the potential entry eUects of low-cost carriers. Section 3 describes
the data used for this study. Section 4 provides the empirical analysis. I explain the empirical
strategy used to estimate the entry eUects and discuss the results. Concluding remarks are made
in section 5.
2 Industry Background and Potential EUect of Entry
The competitive structure of the U.S. airline industry has gone through several changes since
deregulation in 1978. Airlines have since experienced more Wexibility in their route network
and pricing strategies. It is easier to enter routes that were once heavily regulated by the Civil
Aeronautics Board. As a result, there has been an inWux of entry in the past two decades by low-
cost carriers. These airlines include AirTran Airways, JetBlue Airways, Southwest Airlines, and
Spirit Airlines. Low-cost carriers are able to charge low prices due to their eXcient cost structure,
beneVtting from the implementation of a point-to-point network, usage of non-unionized labor,
and operation of the same type of aircraft.5 This is in stark contrast to legacy carriers, which
5For example, Southwest Airlines exclusively uses Boeing 737 jets.
4

were founded and operated prior to deregulation. They implement a hub-and-spoke network,
use mostly unionized labor, and operate with a variety of diUerent aircrafts. The major legacy
carriers include American Airlines, Continental Airlines, Delta Air Lines, Northwest Airlines,
United Airlines, and US Airways. Legacy carriers get their name because they were founded and
operated prior to deregulation.
Low-cost carriers have gained market share in the airline industry, particularly in the past
decade. In 1997, low-cost carriers Wew over 37 million passengers total and accounted for 21.4%
of the market share of all passengers Wying domestically. In 2007, the number of passengers
Wying with low-cost carriers increased to over 75 million passengers, resulting in a 36.2% market
share of all domestic travel. This growth can be partly attributed to the expansion of the low-cost
carriers’ route network. Among the top 1000 most traveled routes, there were 494 instances of
entry from 1993:Q1 to 2007:Q4 by low-cost carriers, with AirTran Airways entering 224 routes,
JetBlue Airways entering 68 routes, Southwest Airlines entering 150 routes, and Spirit Airlines
entering 52 routes. Each route consists of a particular one-way airport-pair. For example, two
routes were considered to be entered when Southwest Airlines started Wying from Orlando In-
ternational Airport to Philadelphia International Airport and vice versa in 2004:Q2. This paper
examines four currently operating low-cost carriers (AirTran Airways, JetBlue Airways, South-
west Airlines, and Spirit Airlines), who have grown substantially over the past two decades and
who remain signiVcant players in the airline industry today. I only examine the entry eUects of
low-cost carriers; I do not study the entry eUect of legacy carriers because the data indicates that
these carriers did not enter a signiVcant number of routes in this time period.
Previous research has studied the eUect of brand loyalty on the demand for Wying. Borenstein
(1989) and Gilbert (1996) describe how airlines employ marketing schemes in the form of frequent
Wier programs in order to create and strengthen consumers’ brand loyalty for that particular
airline. Consumers enroll in an airline’s frequent Wier program and accumulate credit each time
they Wy with that particular airline. Members can redeem their credit for free Wights, upgrades,
or other rewards from that airline. Brand-loyal consumer eUectively experience a switching
cost upon enrollment in a particular carrier’s frequent Wier program. Kim, Shi, and Srinivasan
(2001) explore how these marketing programs can create two market segments: brand-loyal
consumers and price-sensitive consumers.6 Brand-loyal consumers tend to be members of a
particular airline’s frequent Wier program and become disposed to purchasing more Wights on
that airline. Price-sensitive consumers simply look to Wy with the airline charging the lowest
6Kim, Shi, and Srinivasan refer to the brand-loyal consumers and price-sensitive consumers as the heavy-usersegment and the light-user segment, respectively.
5
price for a given route. Borenstein (1989) explains how consumers are inclined to participate in a
particular airline’s frequent Wier program when they live in that airline’s hub city. For example,
Delta Air Lines uses HartsVeld-Jackson Atlanta International Airport as a hub. Consumers in
Atlanta are more likely to not only Wy with Delta but also enroll in Delta’s frequent Wier program
in order to beneVt from the wide selection of markets serviced out of Atlanta. This ultimately
serves to hook passengers to that particular airline, who can exploit their brand-loyal segment
by increasing prices without the fear of losing a signiVcant amount of their market base. In other
words, members of an airline’s frequent Wier program will continue to purchase from that carrier
even if they were charged a higher price because these consumers want to obtain an award after
purchasing a certain amount of trips from that airline. Therefore, brand loyalty serves as a
switching cost for consumers.
There is empirical evidence for the displacement eUect in industries which parallel the airline
industry. Using data on the pharmaceutical industry, Grabowski and Vernon (1992) found that
entry by generic drugs induced Vrms selling branded prescription drugs to target consumers with
inelastic demand, leaving generic drugs to focus on consumers with more elastic demand. This
led to an increase in the price of branded drugs, exemplifying the case when the displacement
eUect is more prominent than the competitive eUect. The airline industry can be considered
analogous to the prescription drug market in the sense that brand loyalty is prevalent in both
industries with incumbent carriers similar to branded prescription drugs and low-cost carrier
entrants akin to generic drugs.
I ask whether incumbent airlines segmented the market in a similar fashion once a low-cost
carrier entered a route. The displacement eUect dominates if incumbent airlines focus solely
on brand-loyal consumers, resulting in an increase of the incumbent’s price. Incumbents can
focus on the brand-loyal segment of the market and allow entrants to service the price sensitive
market segment. However, entry by low-cost carriers could lead to stronger competition for price
sensitive consumers, leading to a decrease in the incumbent’s price. Furthermore, the decrease
in price at the low end of the price distribution could lead incumbents to also decrease prices
at the high end of the distribution in order to prevent brand-loyal consumers from becoming
more price sensitive. If there was a substantial diUerence between full fares and discount fares,
then brand-loyal consumers would substitute between competing carriers. This paper sets out
to investigate whether competition for price sensitive consumers induces price competition for
brand-loyal consumers as well.
The competitive eUect also seems to be a credible story behind how incumbents respond
to entry by low-cost carriers. Morrison (2001) and Vowles (2001) both document evidence that
6
incumbents decrease price when Southwest Airlines enters a new market – the so-called South-
west EUect. This supports the claim that the competitive eUect could dominate the displacement
eUect. However, given the nature of the airline industry, it is plausible that the displacement ef-
fect dominates as in the pharmaceutical industry. Therefore, it could be argued that incumbents
would increase their price in response to entry by a low-cost carrier. This paper serves to em-
pirically test whether the competitive eUect story or the displacement eUect story characterizes
the entry eUect of low-cost carriers in the U.S. airline industry.
3 Data
The data used for this paper was collected from the Airline Origin and Destination Survey
(DB1B), which is published quarterly by the Bureau of Transportation Statistics. It is a ten per-
cent sample of airline tickets from carriers Wying domestic routes. From this database, I collect
information on the origin, destination, non-stop distance between endpoints, ticketing carrier,
market fare,7 and number of passengers paying a particular market fare. The market fare is the
one-way price paid by a passenger for a speciVc origin-destination route on a particular carrier.
The average price, P̄ , for a speciVc route serviced by a particular airline is thus deVned by the
following equation: P̄ =∑
i pi∗ni
N, where pi represents each particular market fare paid by pas-
sengers on the route, ni represents the amount of people who paid that particular market fare,
and N is the total number of people Wying on that route.
I eliminate all observations where the market fare is less than $10 or the distance was equal
to zero. Observations with an unidentiVed ticketing carrier were dropped. Only observations
related to nonstop Wights were kept. Observations pertaining to carriers who have less than 1%
of the traXc on a given route were eliminated. Finally, the sample was restricted to the 1000
routes with the highest number of passengers from 1993:Q1 to 2007:Q4. The dataset contains in-
formation on 2.67 trillion passengers over the 15 year time period, which corresponds to roughly
45 million passengers per quarter.8
In order to be identiVed as an instance of actual entry, the entrant must have not operated
on the route for twelve quarters prior to the quarter of entry and remain on the route for two
quarters after entry. The entrant must also service at least 100 passengers in the quarter of entry.
Two robustness checks on the identiVcation of entry were performed. There are some cases in
7Market fare is calculated by the Bureau of Transportation Statistics as the itinerary yield multiplied by thenumber of miles Wown.
8This paper focuses on the eUect of six legacy carriers and four low-cost carriers. The total number of passengersserviced by these ten carriers represents 81.9% of the sample.
7

which two or more low-cost carriers entered a particular route within the sample period. One
concern would be that the incumbents would respond to the Vrst entrant, but not necessarily to
the second entrant. The Vrst robustness check isolates the Vrst-entrant response by identifying
entry only if there was no low-cost carrier servicing the route prior to entry. Another concern
may arise if incumbents attempt a predatory pricing scheme in order to deter entry.9 Since my
identiVcation rule is that the entrant must remain on the route for only two subsequent quarters
after entry, the price response would capture the initial price decrease and subsequent price
increase consistent with a predatory pricing scheme. The second robustness check rules out
predatory pricing eUects by requiring that the entrant must continue to operate on the route for
at least eight quarters after entry. The results for each robustness check remain qualitatively
consistent with the main results of this paper.
There are three carrier classiVcations in the DB1B: reporting carrier, operating carrier, and
ticketing carrier. Reporting carrier refers to the carrier who submits the information to the Bu-
reau of Transportation Statistics. Operating carrier refers to the carrier who conducted the actual
service of air transportation. Ticketing carrier refers to the carrier who issued the passenger the
ticket for the Wight. In most cases, the three are the same. However, there are cases in which
the three are diUerent. For instance, a regional airline could operate the Wight under a code-
share agreement with the ticketing carrier. The scope of this paper focuses on how the entry
by a low-cost carrier aUects the incumbents’ prices. The brand name competition is based at
the ticketing-level rather than at the operating-level. Moreover, the consumer’s decision on a
reservation is based on the ticketing carrier. In other words, consumers often ignore who the op-
erating carrier is or the fact that the Wight is a codeshare Wight with another carrier. At the time
that the reservation is made, passengers base their purchase on who they purchase the ticket
from. For these reasons, I use the ticketing carrier classiVcation here.
4 Empirical Analysis
In order to take a preliminary look at incumbent response to entry by low-cost carriers, I
analyze the average prices set by incumbents and the entrant in the quarter of actual entry. I
report the frequency and percentage that an entrant enters with an average price higher than,
equal to, or lower than that set by the incumbents. In order to do this, I create a price window
of $20 around the average price set by each incumbent.10 Price matching occurs if the entrant’s
9See Elzinga and Mills (2005) for details on the Spirit Airlines v. Northwest Airlines predatory pricing case.10The average price in the sample is $170.35 so the $20 price window accounts for roughly a 10% cushion in
prices.
8

average price is within the incumbent’s $20 price window in the quarter of entry. In order for the
entrant to have been determined to set a price higher (lower) than the incumbent’s price, the en-
trant’s average price must be at least $20 greater than (less than) the incumbent’s price. In order
to check the robustness of the results, price windows of $10, $15, $25, and $30 were calculated.
The results are qualitatively similar. The quantitative diUerences between price windows stem
from the fact that the percentage of price matching increases as the size of the window increases.
Table 2 in the Appendix summarizes the results using a $20 price window.
Low-cost carrier entrants tend to set an average price that is lower than the legacy carrier
incumbents’ average price in the quarter of entry. For example, Southwest Airlines enters at an
average price that is lower than American Airlines’s price on 44 of 76 (57.9%) instances of entry.
In other words, Southwest Airlines is likely to undercut American Airlines’s average price in the
quarter that they enter that route, conditional on the fact that American Airlines is an incumbent
carrier. It is very rare for a low-cost carrier to set a price that is higher than that of a legacy carrier
incumbent. In fact, Southwest Airlines sets a price that is at least $20 higher than the average
price set by United Airlines on only 7 of 110 (6.4%) of the routes that Southwest Airlines entered
and United Airlines is an incumbent. The results suggest that legacy carrier incumbents may face
downward pressure on their prices since they are being undercut by low-cost carrier entrants.
Low-cost carrier entrants tend to price match the average price set by low-cost carrier in-
cumbents. On 19 of 35 (54.3%) of the routes in which Southwest Airlines enters and AirTran
Airways is an incumbent, Southwest Airlines ends up setting an average price that is within $20
of AirTran’s price. The results for the other low-cost entrants suggests that they are more likely
to price match rival low-cost carriers than incumbent legacy carriers, whose prices tend to be
more expensive than low-cost carriers. Therefore, low-cost carrier incumbents might not need to
change their prices since there is weak price competition from the entering low-cost carrier. The
diUering responses by legacy carrier incumbents and low-cost carrier incumbents foreshadow
the results presented in this section of the paper.
I study three diUerent responses to entry in order to give a more complete analysis on the
entry eUect of low-cost carriers. First, I examine how incumbents change their mean airfare
before and after actual entry by a low-cost carrier. Second, I investigate how the incumbents’
price distribution of airfares is aUected by that entry. In particular, I look at how the tails of the
distribution (10th percentile airfare and 90th percentile airfare) change before and after entry. I
also examine the entry eUect on the incumbent’s Gini coeXcient, which serves as a proxy for
price dispersion. The Gini coeXcient is commonly used11 as the measure for fare inequality
11Borenstein and Rose (1994), Hayes and Ross (1998), and Gerardi and Shapiro (2009) all use the Gini coeXcient
9

to reWect the fact that diUerent passengers end up paying diUerent prices for the same Wight
serviced by a particular carrier. The Gini coeXcient is constructed to be between zero and one,
where inequality increases as the Gini coeXcient increases. In other words, a Gini coeXcient of
zero represents perfect equality, whereas a Gini coeXcient of one signiVes perfect inequality. In
the context of the airline industry, a Gini coeXcient of zero means that everyone pays the same
price for a speciVc route serviced by a particular carrier, whereas an increase in the carrier’s Gini
coeXcient shows that there is more price dispersion on a particular route. Finally, I investigate
whether low-cost carrier entrants set their price below, at, or above the incumbents’ prices when
they enter a new route.
4.1 Estimation Strategy
Following the estimation strategy in Goolsbee and Syverson (2008), I use a two-way Vxed
eUects model to identify the entry eUects on incumbents’ prices. Four dependent variables were
used, including the logged mean airfare (lnprice), the logged 10th percentile price (lnp10), the
logged 90th percentile price (lnp90), and the log-odds ratio of the Gini coeXcient (loddGini)12.
Following Gerardi and Shapiro (2009), the log-odds ratio of the Gini coeXcient is used to account
for the fact that the Gini coeXcient is bounded between zero and one. I control for the carrier’s
market share on the route, the arithmetic mean of the market share for a carrier at the two end-
points, the HerVndahl Index of the route, the arithmetic mean of the HerVndahl Index at the
two endpoints, and the geometric mean of metropolitan statistical area (MSA) population of the
two endpoints. The market share variables are both based on the number of passengers. MSA
population data were obtained from Local Area BEARFACTS published by the Bureau of Eco-
nomic Analysis. I also include carrier-route Vxed eUects and carrier-year-quarter Vxed eUects.
I cluster the standard errors by route-carrier to account for correlation between a route-carrier
combination over time. Table 1 in the Appendix provides summary statistics.
The basic speciVcation is as follows:
yijt = γij + µt +12∑
τ=−12
βτentryj,t0+τ +Xijtα + εijt, (1)
where yijt is either lnpriceijt, lnp10ijt, lnp90ijt, or loddGiniijt for carrier i on route j in time t,
γij is the carrier-route Vxed eUects, µt is the year-quarter Vxed eUects, entryj,t0+τ are the time
in their estimation strategy.12The log-odds ratio of the Gini coeXcient (G) is deVned as loddGini = ln
[G
(1−G)
].
10

dummies that specify the lag/forward of the low-cost carrier actually entering a route, and Xijt
are the control variables explained above.
The two-way Vxed eUects model contains 25 time dummies that account for 12 quarters
before actual entry to 12 quarters after actual entry, including the actual quarter of entry.13 The
estimates of the time lags/forwards of entry show the relative sizes of logged one-way average
airfare in the dummy period versus its average value in the excluded period (the thirteenth
to sixteenth quarters before entry). Table 3 summarizes the results of the time dummies for
each low-cost carrier entrant in the case where all incumbent carriers (legacy carriers, low-cost
carriers, and other carriers14) are accounted for. Column 3 depicts the results of all incumbent
carriers to entry by Southwest Airlines. Since the dummies are mutually exclusive, an incumbent
sets a price that is 12.24% lower,15 on average, in the time period immediately after actual entry
(t0 + 1) relative to the excluded period (the thirteenth to sixteenth quarters before entry). In
other words, the estimates are not additive.
In order to track the price changes by incumbents in response to entry by a particular carrier,
I create price paths based on the coeXcients of the time dummies in the two-way Vxed eUects
model. The price data is based only on incumbents’ prices so we can interpret the results as
the incumbents’ pricing response to entry by a particular carrier. I transform the estimates
in order to interpret the coeXcients as relative percent change in price.16 The term “relative"
can be interpreted as being relative to prices in the excluded time period. Entry occurs at time
period 0 with negative time values signifying the quarter before actual entry and positive time
values signifying the quarter after actual entry. The solid line is the transformation of the point
estimates from the model with the dotted lines representing the 95% conVdence interval. If prices
are constant throughout (no change in prices by incumbents), then this can be considered as the
incumbents not responding to entry by any sort of price changes. If prices are less than zero
and statistically signiVcant before actual entry, then this provides evidence for preemptive price
cutting.
13It is important to maintain “clean" windows so particular care was exhibited to ensure that no other carrierentered that route within the 25 quarter window. This reduced the number of entered markets in the sample, butwould ensure consistent and accurate regression estimates.
14Not all carriers are characterized as either a legacy carrier or a low-cost carrier. For example, ATA Airlines isa charter airline yet was an incumbent when Southwest Airlines entered the Los Angeles International Airport toPhiladelphia International Airport route in 2004:Q2.
15The percent change relative to the excluded period is found by exp(-0.1306) - 1 = -0.1224.16The point on the Vgure associated with the relative price change by all incumbents a quarter after Southwest
Airlines enters would be -0.1224, instead of the actual regression estimate of -0.1306.
11

4.2 Incumbent Price Response to Entry: Mean Airfare
Incumbent airlines can potentially respond to entry by low-cost carriers in either one of two
ways. The incumbent could decrease their prices before entry occurs in order to enforce the
brand loyalty of their consumers, while increasing their attractiveness to price-sensitive con-
sumers. Prices could continue to drop even after entry occurs as the incumbent responds to the
decrease in their respective demand due to an inWux of substitutes. In other words, the compet-
itive eUect could lead to a strengthening of price competition between the incumbents and the
entrant. Conversely, entry could induce incumbents to actually increase prices so that they could
exploit the switching costs inherent in the brand-loyal market segment. This so-called displace-
ment eUect can occur when the eUect of an increase in prices can more than oUset the eUect of
a decrease in quantity so that proVts ultimately increase. I check to see which of these stories
holds true in the airline industry by examining how the incumbents’ mean airfare changes before
and after actual entry by a low-cost carrier.
Figure 1 illustrates the price paths for all incumbents (legacy carrier, low-cost carriers, and
other carriers) in response to entry by either AirTran Airways (Figure 1(a)), JetBlue Airways (Fig-
ure 1(b)), Southwest Airlines (Figure 1(c)), and Spirit Airlines (Figure 1(d)). These price paths es-
sentially graph out the time dummies from the regression results summarized in Table 3. Again,
these estimates can be interpreted as the percentage price change relative to the excluded period
(the thirteenth to sixteenth period before entry). Following the literature on the Southwest Ef-
fect, I focus my analysis on the price response in the quarter before to the quarter after actual
entry occurs. Morrison (2001) and Vowles (2001) both examine price changes the quarter before
and the quarter after actual entry by Southwest Airlines. They Vnd that incumbents signiVcantly
decrease their prices before and after entry by Southwest Airlines. I broaden their analysis to
examine the type of price eUect induced by entry by other low-cost carriers.
Each price path in Figure 1 shows the percentage price change relative to the excluded period
(the thirteenth to sixteenth period before actual entry) for the twelve quarters before entry to
the twelve quarters after entry. According to Figure 1(c), incumbents do not signiVcantly change
their average prices until Southwest Airlines actually enters the route. Moreover, incumbents’
mean airfare steeply decreases in the quarter of entry and the Vrst quarter after entry. In fact,
the solid line shows that incumbents’ prices decrease 12.24% on average in the quarter following
entry by Southwest Airlines. Based on the 95% conVdence intervals (the dotted lines), Figure
1(c) shows that this decrease is statistically signiVcant. This key result corroborates the previous
Vndings in the literature. Namely, incumbents decrease their prices in response to entry by
Southwest Airlines. However, I want to determine whether this eUect is induced by other low-
12

cost carrier entrants.
(a) Entrant: AirTran Airways (b) Entrant: JetBlue Airways
(c) Entrant: Southwest Airlines (d) Entrant: Spirit Airlines
Figure 1: Incumbent Response to Entry: Mean Airfare
Further examination of the other price paths in Figure 1 shows that incumbents tend to
decrease their mean airfares the quarter before entry, the quarter of entry, and the quarter after
entry. It appears as though each of these low-cost carriers exemplify the competitive eUect
as incumbent prices are decreasing in response to entry. Southwest Airlines had the largest
average entry eUect, with the aforementioned result of inducing incumbents to decrease prices
by 12.24%, on average, the quarter after actual entry. Other low-cost carriers had similar, yet
weaker eUects. AirTran Airways induced a decrease of 10.81%, while incumbents also reacted to
entry by JetBlue Airways and Spirit Airlines, but only by a modest amount of 5.57% and 5.36%,
respectively. Nevertheless, each low-cost carrier induced incumbents to decrease their prices
before and after actual entry. Therefore, incumbents face downward pressure on their prices,
which provides evidence that the competitive eUect dominates the displacement eUect.
The results from Table 2 in the Appendix suggest that it is worthwhile to examine the varia-
tions in the entry response of legacy carrier and low-cost carrier incumbents. Figure 2 shows the
relative price response of legacy carrier incumbents to entry by low-cost carrier, whereas Figure
3 shows the price response of low-cost carrier incumbents. Figures 2 and 3 correspond with the
regression results in Table 4 and 5, respectively. In both cases, the dependent variable is logged
mean airfare, thus, the interpretation of the price paths is the same as in Figure 1.
13

(a) Entrant: AirTran Airways (b) Entrant: JetBlue Airways
(c) Entrant: Southwest Airlines (d) Entrant: Spirit Airlines
Figure 2: Legacy Carrier Incumbent Response to Entry: Mean Airfare
(a) Entrant: AirTran Airways (b) Entrant: JetBlue Airways
(c) Entrant: Southwest Airlines (d) Entrant: Spirit Airlines
Figure 3: Low-Cost Carrier Incumbent Response to Entry: Mean Airfare
Based on the price paths in Figure 2, legacy carriers respond to entry by low-cost carriers
by dramatically decreasing their average airfares. In fact, there is a more pronounced price drop
than the eUect shown in Figure 1, which considers all incumbents servicing the entered route
14
when the entrant actually enters. It is important to note that the analysis is based on examin-
ing the price response one quarter before to one quarter after actual entry. Again, these price
decreases are relative to the prices in the excluded period, which consists of the thirteenth to
sixteenth quarter before entry. Southwest Airlines induces incumbents to decrease their average
prices by 13.09%. However, AirTran Airways induces an even stronger eUect than that of South-
west as incumbents cut their mean airfare by an average of 13.31% the quarter after AirTran
Airways actually enters a route. Entry by JetBlue Airways and Spirit Airlines invokes legacy
carrier incumbents to decrease their prices by 7.07% and 7.98%, respectively. All of these ef-
fects are larger than their respective eUect implied by Figure 1. Furthermore, these relative price
changes are all signiVcant at the 5% level. This sharp price drop is evidence that the competitive
eUect describes the response of legacy carriers to entry by low-cost carriers.
The existing literature focuses on the strong entry eUect of Southwest Airlines. Over the
past decade, other low-cost airlines have entered the industry and are currently major carriers
in the industry. JetBlue Airways and AirTran Airways demonstrate how other low-cost carriers
can mirror the entry eUects exhibited with Southwest Airlines. The upshot is that the Southwest
EUect can no longer be considered as a special case relevant to one particular airline, particularly
as it pertains to legacy carrier incumbents. Rather, the entry eUect pertains to low-cost carriers
in general.
Figure 3 shows that low-cost carrier incumbents do not signiVcantly alter their mean airfare
when either a low-cost carrier enters the route. These price paths are in stark contrast with
Figure 2, where it was shown that legacy carrier incumbents signiVcantly decrease their mean
price. Therefore, legacy carrier incumbents (Figure 2) react diUerently than low-cost carrier
incumbents (Figure 3) in their response to entry by a low-cost carrier.
The diUering response by legacy carriers and low-cost carriers can be rationalized by the
frequency of price matching by low-cost carrier entrants. Recall that Table 2 shows that low-cost
carrier entrants are likely to undercut legacy carrier incumbents, yet match the price of low-cost
carrier incumbents. The competitive eUect story predicts that incumbents would decrease their
price after entry occurs in response to an increase in price competition from the entrant, whereas
the displacement story would induce a price increase by the incumbent. The results support the
claim that the competitive eUect story applies to legacy carrier incumbents; however, low-cost
carrier incumbents are not susceptible to either eUect.
15

4.3 Incumbent Price Response to Entry: 10th Percentile Airfare, 90th
Percentile Airfare, and Gini CoeXcient
DiUerent passengers who Wy on the same Wight may pay markedly diUerent fares. As such,
it is possible that entry by a low-cost carrier could aUect the price distribution of airfares set by
incumbent carriers. Borenstein and Rose (1994) show that price dispersion increases as routes
become more competitive. The intuition is that entry can induce incumbents to decrease their
discount price (i.e. the 10th percentile airfare) to attract price-sensitive consumers, while keep-
ing their full-fare price (i.e. the 90th percentile airfare) high, resulting in an increase in price
dispersion. Gerardi and Shapiro (2009) conclude that price dispersion actually decreases when
there is more competition in the route. The intuition here is that an increase in competition
erodes the incumbent carriers’ market power, which mitigates the ability for these airlines to
eUectively price discriminate. Therefore, price dispersion is smaller in markets that are more
competitive. In this section, I discuss the eUect of entry by low-cost carriers on the incumbents’
price distribution of airfares.
The price paths in this section are constructed based on regression results using either the
logged 10th percentile airfare, logged 90th percentile airfare, or the log-odds ratio of the Gini
coeXcient as the dependent variable. As in Gerardi and Shapiro (2009), the 10th percentile
airfare is intended to control for the eUect on discount tickets, whereas the 90th percentile airfare
proxies for full-fare prices. These two dependent variables eUectively account for changes at the
tails of the price distribution. The Gini coeXcient measures the price dispersion of a carrier’s
prices on a speciVc route in a particular time period, and is between zero and one. Since the Gini
coeXcient emphasizes the middle of the price distribution, a full analysis of the entry eUect on
incumbents’ price distribution involves analyzing the eUects on the tails as well.17
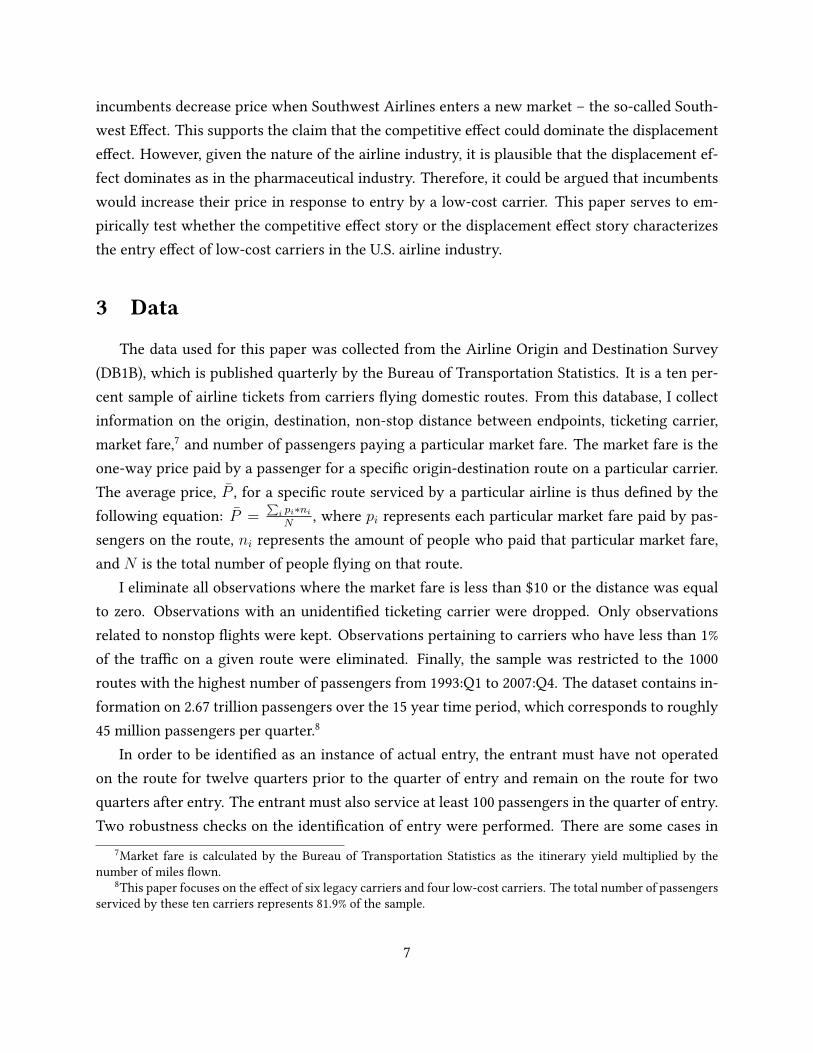
Figure 4 shows that legacy carrier incumbents slash their 10th percentile prices immediately
before and immediately after entry. In the quarter after Southwest Airlines actually enters a
route, legacy carrier incumbents decreased their 10th percentile prices by 11.56%, on average,
relative to the excluded period (the thirteenth to sixteenth quarter before entry). Other low-cost
entrants induced similar eUects, with legacy carrier incumbents dropping prices by an average of
8.09%, 7.49%, and 7.69% when AirTran Airways, JetBlue Airways, and Spirit Airlines entered the
route, respectively. These results suggest that legacy carrier incumbents signiVcantly decrease
their discount prices in response to entry by a low-cost carrier.
17See Gerardi and Shapiro (2009) for a more in-depth discussion on the pros and cons of the Gini coeXcient.
16
(a) Entrant: AirTran Airways (b) Entrant: JetBlue Airways
(c) Entrant: Southwest Airlines (d) Entrant: Spirit Airlines
Figure 4: Legacy Carrier Incumbent Response to Entry: 10th Percentile Airfare
(a) Entrant: AirTran Airways (b) Entrant: JetBlue Airways
(c) Entrant: Southwest Airlines (d) Entrant: Spirit Airlines
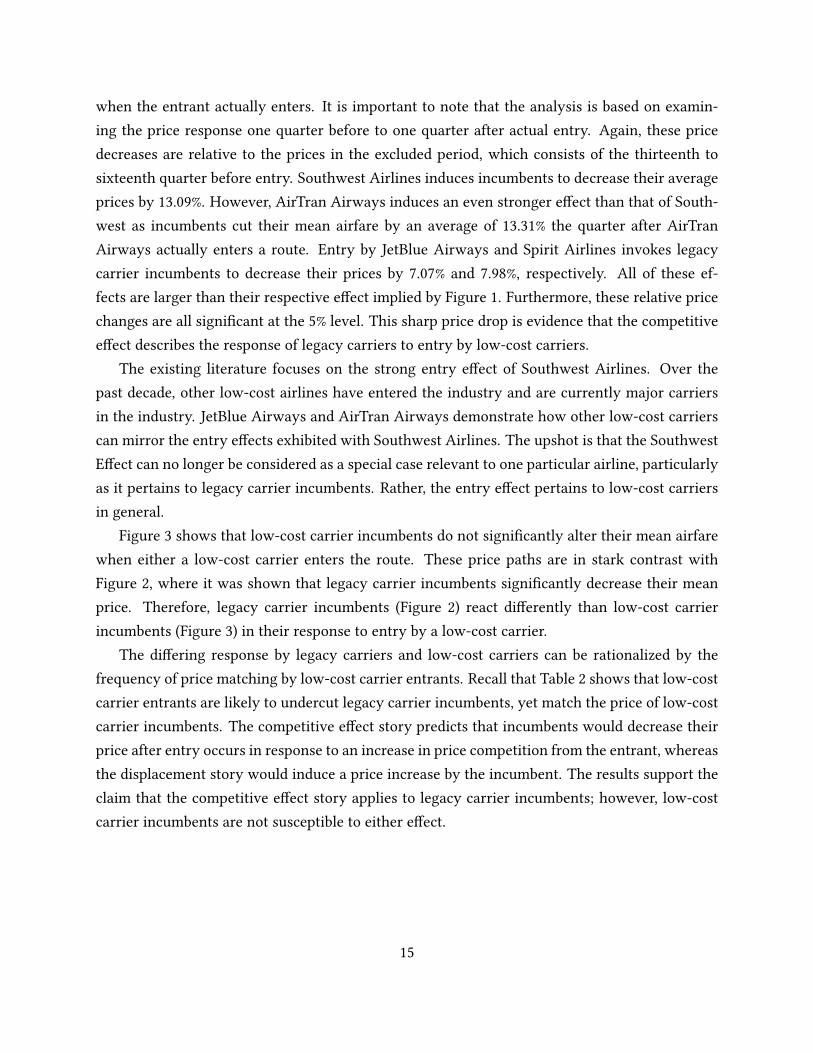
Figure 5: Low-Cost Carrier Incumbent Response to Entry: 10th Percentile Airfare
The analysis from Section 4.2 shows that the response by legacy carrier incumbents diUers
from that of low-cost carrier incumbents, as far as changes to mean airfare is concerned. Figure 5
shows that the low-cost carriers do not signiVcantly alter their 10th percentile prices in response
17
to entry by a rival low-cost carrier. Just as with mean airfares, the results for 10th percentile
airfares show a stark contrast in the response by low-cost carriers from that of legacy carriers to
entry by a low-cost carrier.
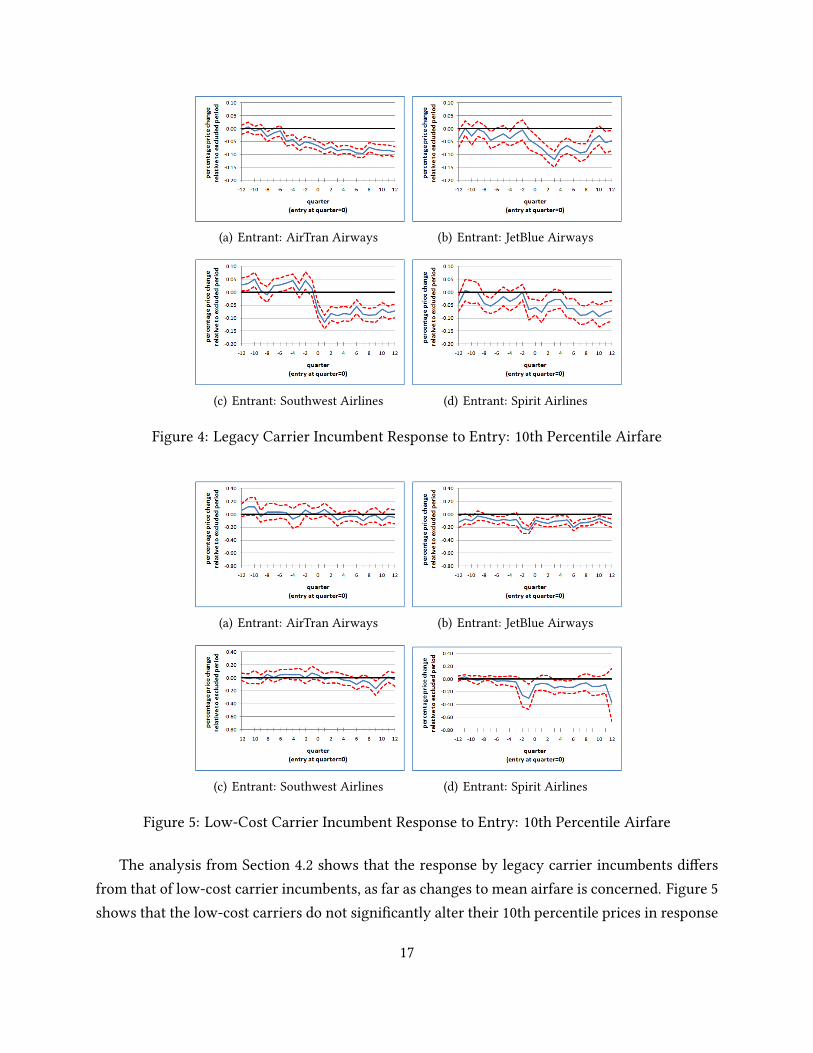
The displacement eUect implies that incumbents’ prices should increase in response to entry.
Particular attention should be made to the eUect on 90th percentile prices as the displacement
eUect predicts that since the incumbent is focused on their brand-loyal market segment, they can
proVtably increase their full fare price. These consumers will still purchase from the incumbent
since they would face a switching cost if they purchase from another carrier. If the 90th percentile
prices increase, then the displacement eUect story is conVrmed.
(a) Entrant: AirTran Airways (b) Entrant: JetBlue Airways
(c) Entrant: Southwest Airlines (d) Entrant: Spirit Airlines
Figure 6: Legacy Carrier Incumbent Response to Entry: 90th Percentile Airfare
Figure 6 indicates the displacement eUect does not characterize airline fare competition well,
particularly as it pertains to legacy carriers. Legacy carrier incumbents decrease their full fare
prices on average. This eUect is large for all the entrants. Southwest Airlines induces legacy
carrier incumbents to decrease their 90th percentile prices by 14.86%, which is actually a stronger
eUect than that of the 10th percentile prices. Legacy carriers also signiVcantly decrease their
prices in response to the other low-cost carrier entrants. Legacy carriers decreased their 90th
percentile price by 14.68% and 14.05% in the quarter after actual entry by AirTran Airways and
Spirit Airlines, respectively. Interestingly, these eUects are of larger magnitudes than that on the
10th percentile prices. Full fare prices charged by legacy carriers decreased by 3.35%, on average,
18
in response to entry by JetBlue Airways. Although this is not as strong as their eUect on 10th
percentile prices, entry by JetBlue Airways still put downward pressure on the incumbents’ full
fare prices. Therefore, the displacement story does not hold for legacy carrier incumbents.
(a) Entrant: AirTran Airways (b) Entrant: JetBlue Airways
(c) Entrant: Southwest Airlines (d) Entrant: Spirit Airlines
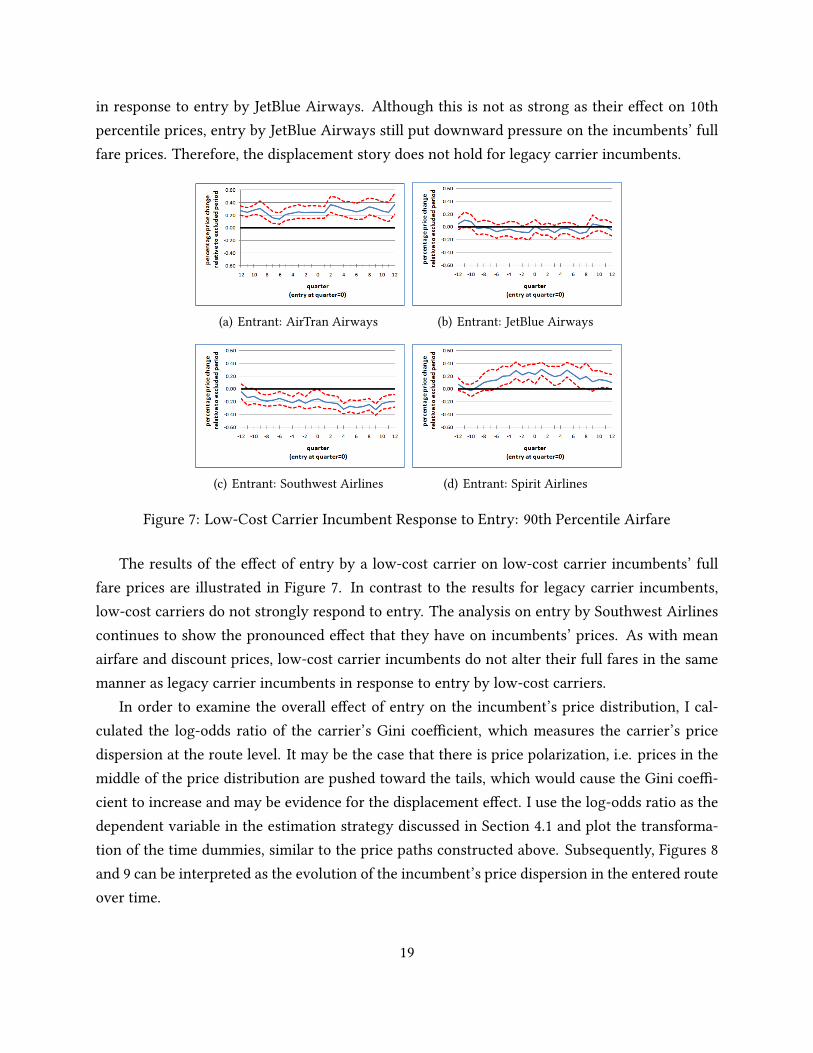
Figure 7: Low-Cost Carrier Incumbent Response to Entry: 90th Percentile Airfare
The results of the eUect of entry by a low-cost carrier on low-cost carrier incumbents’ full
fare prices are illustrated in Figure 7. In contrast to the results for legacy carrier incumbents,
low-cost carriers do not strongly respond to entry. The analysis on entry by Southwest Airlines
continues to show the pronounced eUect that they have on incumbents’ prices. As with mean
airfare and discount prices, low-cost carrier incumbents do not alter their full fares in the same
manner as legacy carrier incumbents in response to entry by low-cost carriers.
In order to examine the overall eUect of entry on the incumbent’s price distribution, I cal-
culated the log-odds ratio of the carrier’s Gini coeXcient, which measures the carrier’s price
dispersion at the route level. It may be the case that there is price polarization, i.e. prices in the
middle of the price distribution are pushed toward the tails, which would cause the Gini coeX-
cient to increase and may be evidence for the displacement eUect. I use the log-odds ratio as the
dependent variable in the estimation strategy discussed in Section 4.1 and plot the transforma-
tion of the time dummies, similar to the price paths constructed above. Subsequently, Figures 8
and 9 can be interpreted as the evolution of the incumbent’s price dispersion in the entered route
over time.
19

(a) Entrant: AirTran Airways (b) Entrant: JetBlue Airways
(c) Entrant: Southwest Airlines (d) Entrant: Spirit Airlines
Figure 8: Legacy Carrier Incumbent Response to Entry: Gini CoeXcient
(a) Entrant: AirTran Airways (b) Entrant: JetBlue Airways
(c) Entrant: Southwest Airlines (d) Entrant: Spirit Airlines
Figure 9: Low-Cost Carrier Incumbent Response to Entry: Gini CoeXcient
Figures 8 and 9 show that the Gini coeXcient for the prices set by legacy carriers and low-
cost carriers, respectively, do not signiVcantly respond to entry by a low-cost carrier. Again,
the percentage change in the Gini coeXcient is relative to the excluded period (the thirteenth
20

to sixteenth period before entry). Recall that legacy carrier incumbents decrease both their 10th
percentile and 90th percentile prices, on average, in response to entry by a low-cost carrier. Al-
though the 90th percentile prices decrease more than the 10th percentile prices, the total eUect
on the Gini is negligible. In other words, the Gini coeXcient for legacy carriers does not sig-
niVcantly change immediately before and after entry because both tails of the price distribution
decrease. The mean average airfare decreases as well, indicating downward pressure on the en-
tire price distribution. On the other hand, low-cost carriers do not signiVcantly respond to entry
by a rival low-cost carrier. Generally speaking, there is no eUect on the mean airfare, 10th per-
centile airfare, or the 90th percentile airfare. Consequently, there is no signiVcant eUect on price
dispersion by low-cost carrier incumbents.
Under the displacement story, prices should increase in response to entry. Incumbents focus
on their brand-loyal market segment and therefore increase prices to those consumers so that the
increase in price oUsets the eUect of the decrease in quantity. Under the right demand conditions,
this would lead to increased proVts. Therefore, we would expect that there would be an increase
in price dispersion as full fare prices should increase with little to no eUect on discount fares.
As seen in Figures 8 and 9, the Gini coeXcient does not change, which is contrary to what we
would expect from the displacement story. On the other hand, the competitive eUect implies
that prices should decrease as incumbents are focused on strengthening the brand loyalty of
their consumers before entry occurs and face downward pressure on prices as price competition
increases after entry occurs. The competitive eUect is supported by the fact that legacy carrier
incumbents’ prices decrease all along their distribution of prices, resulting in an insigniVcant
change of the Gini coeXcient.
I run the two-way Vxed eUects regression model using the interquartile range, which cal-
culates the diUerence between the third and Vrst quartiles (i.e. the middle 50th percentile), as
the dependent variable. This serves as a robustness check for the Gini coeXcient since the in-
terquartile range would provide further information about the shape of the price distribution.
The results support the analysis on the Gini coeXcient.18
These results diUer from the key Vndings in Borenstein and Rose (1994) and Gerardi and
Shapiro (2009). Borenstein and Rose (1994) Vnd that price dispersion increases when there is
more competition. This would occur if entry induces incumbents respond to entry by decreasing
their 10th percentile prices, while keeping their 90th percentile prices high, suggesting that the
path for the Gini coeXcient should be signiVcantly positive around the time of entry. However,
Gerardi and Shapiro (2009) Vnd that an increase in competition would lead to a decrease in price
18Regression results are available upon request.
21

dispersion. My results would have corroborated their Vnding if the path for the Gini coeXcient
was negative around the time of entry, suggesting that an increase in competition due to the en-
try by a low-cost carrier would induce a higher degree of price equality. My results support the
claim that competition has no eUect on price dispersion since the Gini coeXcient does not sig-
niVcantly change due to entry by a low-cost carrier, which contrasts with the previous Vndings
in the literature.
Both Borenstein and Rose (1994) and Gerardi and Shapiro (2009) determine the eUect of com-
petition on price dispersion by estimating regression models consisting of a transformation of
the Gini coeXcient19 as the dependent variable, while the independent variables include a proxy
for competition. These papers are interested in the estimated sign and signiVcance of the com-
petition variables on price dispersion. Their results suggest a signiVcant, yet contrasting eUect.
Gerardi and Shapiro attribute their diUering results to the fact that they use panel data, while
Borenstein and Rose use cross-sectional data. They argue that the results in Borenstein and Rose
paper suUer from omitted-variable bias, which they Vx by including route-carrier Vxed eUects.
The identiVcation strategy used in this paper is diUerent than the strategy used by Borenstein
and Rose (1994) and Gerardi and Shapiro (2009), which could explain for the salient result. My
approach is similar to an event study, in which I identify individual events of entry and estimate
the short-run eUect of entry on incumbents’ prices. I examine how incumbents react diUerently
to diUerent low-cost carrier entrants around the time of actual entry. I also analyze how the
incumbent response diUers depending on whether the incumbent is a low-cost carrier and legacy
carrier. However, Borenstein and Rose (1994) and Gerardi and Shapiro (2009) focus on a more
long-run price eUect. They are interested in a more general industry-wide eUect of competition
on incumbent prices. According to Borenstein and Rose (1994), competition is aUected by a
change in the HerVndahl Index or the total number of Wights on the route, whereas Gerardi
and Shapiro identify a change in competition by a change in the HerVndahl Index or the total
number of carriers servicing the route. The results in this paper show that price dispersion does
not signiVcantly change when competition increases, speciVcally when a low-cost carrier enters
a new route.19Borenstein and Rose (1994) use logged Gini coeXcient as their dependent variable, while Gerardi and Shapiro
(2009) use the log-odds ratio of the Gini coeXcient.
22

5 Conclusion
This paper studies the incumbent response to entry by low-cost carriers. Legacy carrier
incumbents tend to decrease their average airfare, discount fares, and full fare price before and
after entry by a low-cost carrier. However, low-cost carriers do not signiVcantly alter their
prices in response to entry by a rival low-cost carrier. In both cases, the Gini coeXcient does not
signiVcantly change, implying that entry does not aUect the incumbent’s price dispersion. This
paper extends upon the work by Goolsbee and Syverson (2008) by going further to identify how
incumbents respond to entry by not only Southwest Airlines, but also other prominent low-cost
carriers. The key punch line to the paper is that although the strongest entry response occurs
when Southwest Airlines enters a new route, legacy carrier incumbents tend to respond in a
similar, yet weaker fashion to other low-cost carriers.
The results suggest that there is no short-run eUect of competition on price dispersion. Entry
by a low-cost carrier induces legacy carrier incumbents to decrease their 10th percentile, 90th
percentile, and mean airfares. Since legacy carrier incumbents decrease prices all along the price
distribution, then there was no net change to the overall dispersion of prices. Low-cost carrier
incumbents do not alter their price dispersion as they do not signiVcantly respond to entry by
a rival low-cost carrier. These Vndings extend the results in Borenstein and Rose (1994) and
Gerardi and Shapiro (2009), who focus on the long-run eUect of competition on price dispersion
in the industry as a whole.
Legacy carrier incumbents react diUerently to entry by low-cost carriers than low-cost car-
rier incumbents. Low-cost carrier entrants tend to undercut legacy carrier incumbents, while
matching the prices of low-cost carrier incumbents. Legacy carriers decrease their prices in re-
sponse to the low prices set by a low-cost carrier entrant. This downward pressure on prices was
not experienced by low-cost carrier incumbents due to the weak price competition that ensued
between rival low-cost carriers. This paper sheds light on a previously unknown phenomena:
the strategic interaction between low-cost carrier entrants and rival low-cost carrier incumbents.
23

References
Boguslaski, Charles, Harumi Ito, and Darin Lee (2004), “Entry Patterns in the Southwest Airlines
Route System", Review of Industrial Organization 25, 317-350.
Borenstein, Severin (1989), “Hubs and High Fares: Dominance and Market Power in the U.S.
Airline Industry", The RAND Journal of Economics 20(3), 344-365.Borenstein, Severin (1991), “The Dominant-Firm Advantage in Multiproduct Industries: Evidence
from the U.S. Airlines", The Quarterly Journal of Economics 106(4), 1237- 1266.
Borenstein, Severin (1992), “The Evolution of U.S. Airline Competition", The Journal of EconomicPerspectives 6(2), 45-73.
Borenstein, Severin and Nancy Rose (1994), “Competition and Price Dispersion in the U.S. Airline
Industry", Journal of Political Economy 102(4), 653-683.
Brander, James and Anming Zhang (1990), “Market Conduct in the Airline Industry: An
Empirical Investigation", The RAND Journal of Economics 21(4), 567-583.Brueckner, Jan, Nichola Dyer, and Pablo Spiller (1992), “Fare Determination in Airline Hub-and-
Spoke Networks", The RAND Journal of Economics 23(3), 309-333.Cornia, Marco, Kristopher Gerardi, and Adam Shapiro (2011), “Price Discrimination and Business-
Cycle Risk", working paper.
Elzinga, Kenneth and David Mills (2005), “Predatory Pricing in the Airline Industry: Spirit
Airlines v. Northwest Airlines", in John Kwoka, Jr. and Lawrence White (eds.), TheAntitrust Revolution, 5th ed., Oxford University Press.
Evans, William and Ioannis Kessides (1993), “Localized Market Power in the U.S. Airline
Industry", The Review of Economics and Statistics 75(1), 66-75.Gerardi, Kristopher and Adam Shapiro (2009), “Does Competition Reduce Price Dispersion? New
Evidence from the Airline Industry", Journal of Political Economy 117(1), 1-37.
Gilbert, David (1996). “Relationship Marketing and Airline Loyalty Schemes", TourismManagement 17(8), 575-582.
Goolsbee, Austan and Chad Syverson (2008), “How Do Incumbents Respond to the Threat of
Entry? Evidence from the Major Airlines", The Quarterly Journal of Economics 123(4), 1611-1633.
Grabowski, Henry and John Vernon (1992), “Brand Loyalty, Entry, and Price Competition in
Pharmaceuticals after the 1984 Drug Act", Journal of Law and Economics 35(2), 331- 350.
Hayes, Kathy and Leola Ross (1998), “Is Airline Price Dispersion the Result of Careful Planning
or Competitive Forces?", Review of Industrial Organization 13, 523-541.
Hendricks, Ken, Michele Piccione, and Guofu Tan (1997), “Entry and Exit in Hub-Spoke
24

Networks". The RAND Journal of Economics 28(2), 291-303.Hollander, Abraham (1987), “On Price-Increasing Entry", Economica 54(215), 317-324.Kim, Byung-Do, Mengze Shi, and Kannan Srinivasan (2001), “Reward Programs and Tacit
Collusion", Marketing Science 20(2), 99-120.Klemperer, Paul (1987), “Markets with Consumer Switching Costs", The Quarterly Journal of
Economics 102(2), 375-394.Morrison, Steven (2001), “Actual, Adjacent, and Potential Competition: Estimating the Full EUect
of Southwest Airlines, Journal of Transport Economics and Policy 35(2), 239-256.
PerloU, JeUrey and Steven Salop (1985), "Equilibrium with Product DiUerentiation", The Reviewof Economic Studies 52(1), 107-120.
Rosenthal, Robert (1980), “A Model in which an Increase in the Number of Sellers Leads to a
Higher Price", Econometrica 48(6), 1575-1579.Villa-Boas, J. Miguel (2004), “Consumer Learning, Brand Loyalty, and Competition", Marketing
Science 23(1), 134-145.Vowles, Timothy (2000), “The EUect of Low Fair Air Carriers on Airfares in the US", Journal of
Transport Geography 8, 121-128.
Vowles, Timothy (2001), “The Southwest EUect In Multi-Airport Regions", Journal of AirTransport Management 7, 251-258.
Whinston, Michael and Scott Collins (1992), “Entry and Competitive Structure in Deregulated
Airline Markets: An Event Study Analysis of People Express", The Review of Economics andStatistics 23(4), 445-462.
Windle, Robert and Martin Dresner (1999), “Competitive Responses to Low Cost Carrier Entry",
Transportation Research Part E 35, 59-75.
25

Appendix
Table 1: Summary Statistics
Variable DeVnition Mean(Std. Dev.)
priceijt Average one-way market fare for carrier i 170.35on route j in time period t (72.68)
giniijt Gini coeXcient of carrier i’s prices 0.249on route j in time period t (0.089)
distancej One-way distance (in miles) between the endpoints of route j 1196.28(663.10)
passengersijt Number of passengers for carrier i 1014.65on route j in time period t (1641.07)
mktshrrouteijt Market share for carrier i on route j in time period t 0.223(0.275)
HERFroutejt HerVndahl Index for route j in time period t 0.484(0.189)
mktshraptijt Arithmetic mean of carrier i’s market share 0.157at endpoints on route j in time period t (0.128)
HERFaptjt Arithmetic mean of HerVndahl Indexes 0.247at endpoints on route j in time period t (0.079)
popjt Geometric mean of population (in millions) of origin and 4.04destination airports’ MSA on route j in time period t (2.43)
Routes Number of routes in the sample 1000N Number of observations 263,272
26

Table2:
Frequencyof
PriceMatchingby
Entrant
(windo
w=incumbent
price±
20)
Entrant’sprice>
incumbent’sprice
Incumbent
American
Con
tinental
Delta
Northwest
United
USAirways
AirTran
JetBlue
Southw
est
Spirit
Entrant
AirTran
10(8.1%)
8(8.1%)
4(2.0%)
8(8.2%)
7(6.4%)
10(6.4%)
n/a
–10
(25.0%
)0(0.0%)
JetBlue
1(2.3%)
3(9.4%)
5(8.1%)
4(22.2%
)4(11.1%
)3(6.8%)
2(11.8%
)n/a
2(100.0%)
0(0.0%)
Southw
est
6(7.9%)
4(5.2%)
5(3.9%
)4(5.7%)
2(2.2%)
6(5.0%)
2(5.7%)
0(0.0%)
n/a
4(50.0%
)Sp
irit
0(0.0%)
0(0.0%)
1(2.2%)
0(0.0%)
0(0.0%)
1(2.5%)
0(0.0%)
–1(6.3%)
n/a
Entrant’sprice
=incumbent’sprice
Incumbent
American
Con
tinental
Delta
Northwest
United
USAirways
AirTran
JetBlue
Southw
est
Spirit
Entrant
AirTran
36(29.3%
)34
(34.3%
)60
(29.3%
)45
(46.4%
)28
(25.5%
)53
(33.8%
)n/a
–25
(62.5%
)6(75.0%
)JetBlue
20(46.5%
)14
(43.8%
)24
(38.7%
)4(22.2%
)8(22.2%
)12
(27.3%
)9(52.9%
)n/a
0(0.0%)
4(100.0%)
Southw
est
26(34.2%
)25
(32.5%
)48
(37.5%
)35
(50.0%
)23
(25.8%
)49
(40.8%
)19
(54.3%
)2(50.0%
)n/a
4(50.0%
)Sp
irit
5(16.7%
)6(24.0%
)11
(23.9%
)1(4.0%)
1(3.3%)
8(20%
)2(33.3%
)–
5(31.3%
)n/a
Entrant’sprice<
incumbent’sprice
Incumbent
American
Con
tinental
Delta
Northwest
United
USAirways
AirTran
JetBlue
Southw
est
Spirit
Entrant
AirTran
77(62.6%
)57
(57.6%
)141(68.8%
)44
(45.4%
)75
(68.2%
)94
(59.9%
)n/a
–5(12.5%
)2(25.0%
)JetBlue
22(51.2%
)15
(46.9%
)33
(53.2%
)10
(55.6%
)24
(66.7%
)29
(65.9%
)6(35.3%
)n/a
0(0.0%)
0(0.0%)
Southw
est
44(57.9%
)48
(62.3%
)75
(58.6%
)31
(44.3%
)64
(71.9%
)65
(54.2%
)14
(40.0%
)2(50.0%
)n/a
0(0.0%)
Spirit
25(83.3%
)19
(76.0%
)34
(73.9%
)24
(96.0%
)29
(96.7%
)31
(77.5%
)4(66.7%
)–
10(62.5%
)n/a
27

Table 3: Incumbent Price Response to Actual Entry(Dependent Variable: lnprice; N=263,270)
(1) (2) (3) (4)Entrant: AirTran Airways JetBlue Airways Southwest Airlines Spirit AirlinesIncumbent: All Carriers All Carriers All Carriers All Carrierst0 − 12 0.0139 0.0040 0.0236* 0.0159
(0.0072) (0.0137) (0.0100) (0.0148)t0 − 11 0.0194* 0.0080 0.0183 0.0097
(0.0076) (0.0135) (0.0107) (0.0162)t0 − 10 0.0105 -0.0242 0.0367* 0.0191
(0.0073) (0.0132) (0.0103) (0.0186)t0 − 9 0.0107 -0.0408* 0.0044 -0.0059
(0.0080) (0.0181) (0.0108) (0.0167)t0 − 8 -0.0155* -0.0209 -0.0019 -0.0246
(0.0076) (0.0152) (0.0110) (0.0191)t0 − 7 -0.0132 -0.0278* 0.0059 -0.0395*
(0.0083) (0.0134) (0.0100) (0.0167)t0 − 6 -0.0302* -0.0481* 0.0326* -0.0275
(0.0089) (0.0171) (0.0103) (0.0186)t0 − 5 -0.0320* -0.0492* 0.0274* -0.0021
(0.0089) (0.0149) (0.0104) (0.0168)t0 − 4 -0.0067 -0.0603* 0.0337* -0.0056
(0.0088) (0.0181) (0.0105) (0.0156)t0 − 3 -0.0237* -0.0126 0.0246* 0.0101
(0.0090) (0.0152) (0.0110) (0.0156)t0 − 2 -0.0224* -0.0048 0.0262* -0.0210
(0.0087) (0.0157) (0.0122) (0.0157)t0 − 1 -0.0362* -0.0406* -0.0017 -0.0433*
(0.0092) (0.0200) (0.0109) (0.0161)t0 -0.0691* -0.0447* -0.0820* -0.0365*
(0.0088) (0.0153) (0.0112) (0.0200)t0 + 1 -0.1143* -0.0573* -0.1306* -0.0551*
(0.0102) (0.0155) (0.0120) (0.0224)t0 + 2 -0.1274* -0.1044* -0.1137* -0.0344
(0.0103) (0.0168) (0.0119) (0.0224)t0 + 3 -0.1330* -0.0980* -0.1198* -0.0408*
(0.0095) (0.0157) (0.0130) (0.0204)t0 + 4 -0.1131* -0.0676* -0.1230* -0.0466*
(0.0095) (0.0165) (0.0121) (0.0182)t0 + 5 -0.1093* -0.0619* -0.1369* -0.0600*
(0.0095) (0.0177) (0.0120) (0.0203)t0 + 6 -0.1184* -0.0871* -0.1057* -0.0591*
(0.0094) (0.0170) (0.0115) (0.0191)t0 + 7 -0.1145* -0.0914* -0.1131* -0.0364
(0.0094) (0.0152) (0.0118) (0.0247)t0 + 8 -0.0872* -0.0858* -0.1184* -0.0577*
(0.0098) (0.0146) (0.0122) (0.0196)t0 + 9 -0.0897* -0.0136 -0.1086* -0.0653*
(0.0093) (0.0205) (0.0125) (0.0212)t0 + 10 -0.0887* -0.0121 -0.0883* -0.0782*
(0.0101) (0.0205) (0.0118) (0.0200)t0 + 11 -0.0776* -0.0564* -0.1026* -0.0717*
(0.0098) (0.0223) (0.0123) (0.0223)t0 + 12 -0.0663* -0.0570* -0.0800* -0.0467*
(0.0105) (0.0239) (0.0120) (0.0214)
Note: The variables shown are the lagged/forward time dummies, where t0 is quarter of entry. Fixed eUects, competition variables, and marketvariables suppressed. Standard errors are in parentheses. * denotes signiVcance at 5% level.
28

Table 4: Incumbent Price Response to Actual Entry(Dependent Variable: lnprice; N=263,270)
(1) (2) (3) (4)Entrant: AirTran Airways JetBlue Airways Southwest Airlines Spirit AirlinesIncumbent: Legacy Carriers Legacy Carriers Legacy Carriers Legacy Carrierst0 − 12 0.0069 0.0003 0.0225 0.0123
(0.0085) (0.0152) (0.0123) (0.0173)t0 − 11 0.0080 -0.0013 0.0154 0.0117
(0.0088) (0.0149) (0.0130) (0.0195)t0 − 10 -0.0021 -0.0290 0.0346* 0.0183
(0.0086) (0.0160) (0.0123) (0.0196)t0 − 9 0.0006 -0.0281 -0.0027 -0.0025
(0.0096) (0.0166) (0.0129) (0.0192)t0 − 8 -0.0310* -0.0144 -0.0062 -0.0449*
(0.0087) (0.0147) (0.0130) (0.0154)t0 − 7 -0.0360* -0.0276 0.0004 -0.0556*
(0.0095) (0.0155) (0.0117) (0.0165)t0 − 6 -0.0479* -0.0523* 0.0294* -0.0417*
(0.0103) (0.0161) (0.0122) (0.0189)t0 − 5 -0.0478* -0.0620* 0.0250* -0.0032
(0.0103) (0.0175) (0.0123) (0.0169)t0 − 4 -0.0276* -0.0552* 0.0396* -0.0100
(0.0095) (0.0166) (0.0123) (0.0170)t0 − 3 -0.0440* -0.0138 0.0241 0.0017
(0.0104) (0.0174) (0.0131) (0.0173)t0 − 2 -0.0489* -0.0065 0.0324* -0.0247
(0.0093) (0.0184) (0.0147) (0.0181)t0 − 1 -0.0644* -0.0295 -0.0033 -0.0504*
(0.0102) (0.0209) (0.0125) (0.0179)t0 -0.0916* -0.0511* -0.0925* -0.0652*
(0.0096) (0.0173) (0.0130) (0.0202)t0 + 1 -0.1428* -0.0734* -0.1403* -0.0831*
(0.0103) (0.0166) (0.0139) (0.0248)t0 + 2 -0.1474* -0.1183* -0.1188* -0.0674*
(0.0109) (0.0188) (0.0139) (0.0226)t0 + 3 -0.1564* -0.1163* -0.1227* -0.0612*
(0.0103) (0.0171) (0.0151) (0.0229)t0 + 4 -0.1368* -0.0789* -0.1185* -0.0660*
(0.0102) (0.0181) (0.0142) (0.0201)t0 + 5 -0.1309* -0.0674* -0.1253* -0.0856*
(0.0103) (0.0193) (0.0136) (0.0226)t0 + 6 -0.1401* -0.0848* -0.0974* -0.0862*
(0.0101) (0.0182) (0.0132) (0.0206)t0 + 7 -0.1405* -0.0852* -0.1086* -0.0718*
(0.0099) (0.0170) (0.0139) (0.0218)t0 + 8 -0.1170* -0.0859* -0.1170* -0.0865*
(0.0102) (0.0167) (0.0138) (0.0209)t0 + 9 -0.1124* -0.0236 -0.0999* -0.0859*
(0.0100) (0.0240) (0.0146) (0.0231)t0 + 10 -0.1090* -0.0149 -0.0928* -0.0963*
(0.0110) (0.0242) (0.0136) (0.0219)t0 + 11 -0.1014* -0.0613* -0.1104* -0.0942*
(0.0104) (0.0259) (0.0144) (0.0247)t0 + 12 -0.0913* -0.0571* -0.0823* -0.0694*
(0.0106) (0.0283) (0.0140) (0.0238)
Note: The variables shown are the lagged/forward time dummies, where t0 is quarter of entry. Fixed eUects, competition variables, and marketvariables suppressed. Standard errors are in parentheses. * denotes signiVcance at 5% level.
29

Table 5: Incumbent Price Response to Actual Entry(Dependent Variable: lnprice; N=263,270)
(1) (2) (3) (4)Entrant: AirTran Airways JetBlue Airways Southwest Airlines Spirit AirlinesIncumbent: Low-Cost Carriers Low-Cost Carriers Low-Cost Carriers Low-Cost Carrierst0 − 12 0.1307* -0.0110 -0.0148 0.0511*
(0.0132) (0.0400) (0.0429) (0.0203)t0 − 11 0.1263* 0.0457 -0.0950 0.0236*
(0.0167) (0.0452) (0.0572) (0.0116)t0 − 10 0.1370* -0.0067 -0.0648 -0.0058
(0.0219) (0.0395) (0.0566) (0.0267)t0 − 9 0.0895* -0.0422 -0.1020* 0.0047
(0.0249) (0.0449) (0.0410) (0.0324)t0 − 8 0.0659* -0.0296 -0.1083* 0.0631*
(0.0305) (0.0438) (0.0427) (0.0306)t0 − 7 0.0704* -0.0592 -0.1203* 0.0434
(0.0252) (0.0405) (0.0436) (0.0398)t0 − 6 0.0543* -0.1188* -0.0890 0.0341
(0.0215) (0.0475) (0.0456) (0.0456)t0 − 5 0.0686* -0.0922* -0.1023* 0.0691
(0.0286) (0.0395) (0.0467) (0.0454)t0 − 4 0.0777* -0.0827 -0.1242* 0.0767
(0.0292) (0.0516) (0.0490) (0.0419)t0 − 3 0.1177* -0.0981 -0.0968 0.1004*
(0.0257) (0.0573) (0.0499) (0.0376)t0 − 2 0.0943* -0.1449* -0.1387* 0.0684
(0.0234) (0.0460) (0.0490) (0.0359)t0 − 1 0.0609* -0.1445* -0.0776 0.0441
(0.0233) (0.0471) (0.0631) (0.0438)t0 0.1069* -0.0516 -0.0571 0.0580
(0.0233) (0.0425) (0.0599) (0.0455)t0 + 1 0.1162* -0.1139* -0.1040 0.0763*
(0.0232) (0.0333) (0.0545) (0.0297)t0 + 2 0.1134* -0.1070* -0.0982* 0.0365
(0.0254) (0.0374) (0.0497) (0.0311)t0 + 3 0.0832* -0.1225* -0.1270* 0.0293
(0.0360) (0.0485) (0.0551) (0.0431)t0 + 4 0.1153* -0.0741* -0.2183* 0.0452
(0.0310) (0.0373) (0.0446) (0.0306)t0 + 5 0.0825* -0.0709* -0.1957* 0.0829*
(0.0309) (0.0352) (0.0454) (0.0319)t0 + 6 0.0654* -0.0870* -0.2146* 0.0640
(0.0307) (0.0348) (0.0575) (0.0369)t0 + 7 0.0564 -0.1541* -0.1840* 0.0505
(0.0351) (0.0385) (0.0500) (0.0433)t0 + 8 0.0881* -0.1190* -0.1881* 0.0857
(0.0359) (0.0342) (0.0464) (0.0453)t0 + 9 0.1224* 0.0010 -0.2821* 0.0058
(0.0343) (0.0436) (0.0467) (0.0340)t0 + 10 0.0847* 0.0073 -0.1791* 0.0056
(0.0322) (0.0307) (0.0474) (0.0418)t0 + 11 0.0912* -0.0221 -0.1488* 0.0382
(0.0304) (0.0350) (0.0468) (0.0416)t0 + 12 0.1506* -0.1140* -0.1580* 0.0129
(0.0370) (0.0440) (0.0469) (0.0452)
Note: The variables shown are the lagged/forward time dummies, where t0 is quarter of entry. Fixed eUects, competition variables, and marketvariables suppressed. Standard errors are in parentheses. * denotes signiVcance at 5% level.
30