Incremental Grid-like Layout Using Soft and Hard...
12
Incremental Grid-like Layout Using Soft and Hard Constraints Steve Kieffer, Tim Dwyer, Kim Marriott, and Michael Wybrow Caulfield School of Information Technology, Monash University, Caulfield, Victoria 3145, Australia, National ICT Australia, Victoria Laboratory, {Steve.Kieffer,Tim.Dwyer,Kim.Marriott,Michael.Wybrow}@monash.edu Abstract. We explore various techniques to incorporate grid-like layout conventions into a force-directed, constraint-based graph layout frame- work. In doing so we are able to provide high-quality layout—with pre- dominantly axis-aligned edges—that is more flexible than previous grid- like layout methods and which can capture layout conventions in nota- tions such as SBGN (Systems Biology Graphical Notation). Furthermore, the layout is easily able to respect user-defined constraints and adapt to interaction in online systems and diagram editors such as Dunnart. Keywords: constraint-based layout, grid layout, interaction, diagram editors 1 Introduction Force-directed layout remains the most popular approach to automatic layout of undirected graphs. By and large these metheds untangle the graph to show underlying structure and symmetries with a layout style that is organic in ap- pearance [2]. Constrained graph layout methods extend force-directed layout to take into account user-specified constraints on node positions such as alignment, hierarchical containment and non-overlap [5]. These methods have proven a good basis for semi-automated graph layout in tools such as Dunnart [7] that allow the user to interactively guide the layout by moving nodes or adding constraints. However, when undirected graphs (and other kinds of diagrams) are drawn by hand it is common for a more grid-like layout style to be used. Grid-based layout is widely used by graphic designers and it is common in hand-drawn biological networks and metro-map layouts. Previous research has shown that grid-based layouts are more memorable than unaligned placements [13]. Virtually all diagram creation tools provide some kind of snap-to-grid feature. In this paper we investigate how to modify constrained force-directed graph layout methods [5] to create more orthogonal and grid-like layouts with a par- ticular focus on interactive applications such as Dunnart. In Figure 1 we show undirected graphs arranged with our various layout approaches compared with traditional force-directed layout.
Transcript of Incremental Grid-like Layout Using Soft and Hard...

Incremental Grid-like LayoutUsing Soft and Hard Constraints
Steve Kieffer, Tim Dwyer, Kim Marriott, and Michael Wybrow
Caulfield School of Information Technology,Monash University, Caulfield, Victoria 3145, Australia,
National ICT Australia, Victoria Laboratory,{Steve.Kieffer,Tim.Dwyer,Kim.Marriott,Michael.Wybrow}@monash.edu
Abstract. We explore various techniques to incorporate grid-like layoutconventions into a force-directed, constraint-based graph layout frame-work. In doing so we are able to provide high-quality layout—with pre-dominantly axis-aligned edges—that is more flexible than previous grid-like layout methods and which can capture layout conventions in nota-tions such as SBGN (Systems Biology Graphical Notation). Furthermore,the layout is easily able to respect user-defined constraints and adapt tointeraction in online systems and diagram editors such as Dunnart.
Keywords: constraint-based layout, grid layout, interaction, diagrameditors
1 Introduction
Force-directed layout remains the most popular approach to automatic layoutof undirected graphs. By and large these metheds untangle the graph to showunderlying structure and symmetries with a layout style that is organic in ap-pearance [2]. Constrained graph layout methods extend force-directed layout totake into account user-specified constraints on node positions such as alignment,hierarchical containment and non-overlap [5]. These methods have proven a goodbasis for semi-automated graph layout in tools such as Dunnart [7] that allowthe user to interactively guide the layout by moving nodes or adding constraints.
However, when undirected graphs (and other kinds of diagrams) are drawnby hand it is common for a more grid-like layout style to be used. Grid-basedlayout is widely used by graphic designers and it is common in hand-drawnbiological networks and metro-map layouts. Previous research has shown thatgrid-based layouts are more memorable than unaligned placements [13]. Virtuallyall diagram creation tools provide some kind of snap-to-grid feature.
In this paper we investigate how to modify constrained force-directed graphlayout methods [5] to create more orthogonal and grid-like layouts with a par-ticular focus on interactive applications such as Dunnart. In Figure 1 we showundirected graphs arranged with our various layout approaches compared withtraditional force-directed layout.

triosephosphat/Ptranslocator
(TPT3_3-PGA)
P
D-fructose 1,6-bisphosphate
oxaloacetate
CO2
ADP
malate
ATP
phosphoenolpyruvate
2-phospho-D-glycerate
oxaloacetate
2.7.2.3
ADP
P
ATP
ADP
NADH
ATP
P
D-glyceraldehyde3-phosphate
ATP
NADPH
triosephosphat/Ptranslocator(TPT1_GAP)
P
AMP
P
NADP+
malate
D-fructose 1,6-bisphosphate
ATP
D-glucose 6-phosphate
P
NADP+
2.7.9.1
P
NADP+
D-glucose 1-phosphate
AMP
D-glyceraldehyde3-phosphate
2.7.2.3
OAA/malatetransporter
2.7.1.90
4.2.1.11
2.7.1.40
5.3.1.1
malate/glutamatetransporter
1.1.1.39
5.4.2.1
4.1.1.49
1.2.1.12
5.4.2.2
4.1.1.31
4.1.2.13
4.2.1.11
pyruvatetransporter
2.7.9.1
5.3.1.1
5.3.1.9
1.2.1.9
G1Ptransporter
3.1.3.11
1.1.1.40
phosphoenolpyruvat/phosphattransporter
4.1.2.13
1.2.1.13
2.7.1.11
G6Ptransporter
3.1.3.11
triosephosphat/Ptranslocator(TPT2_DHAP)
2.7.1.11
ADP
P
malate
NADPH
D-fructose 6-phosphate
5.4.2.2
ADP
D-glucose 1-phosphate
NAD+
P
P
PP
ATP
pyruvate
P
ATP
2.7.1.40
P
NADH
3-phospho-D-glycerate
2-phospho-D-glycerate
1,3-bisphospho-D-glycerate
P
pyruvate
1,3-bisphospho-D-glycerate
P
P
1.1.1.37
phosphoenolpyruvate
ATP
NAD+
NADH
dihydroxyacetonephosphatedihydroxyacetone
phosphate
CO2
ADP
3-phospho-D-glycerate
ATP
5.4.2.1
D-glucose 6-phosphate
ADP
CO2
PP
NAD+
malate
CO2
P
PP
5.3.1.9
L-glutamate
dihydroxyacetonephosphate
P
oxaloacetate
L-glutamate
D-fructose 6-phosphate
P
PP
NADPH
pyruvate
(a) Force-Directed
triosephosphat/Ptranslocator
(TPT3_3-PGA)
P
D-fructose 1,6-bisphosphate
oxaloacetate
CO2
ADP
malate
ATP
phosphoenolpyruvate
2-phospho-D-glycerate
oxaloacetate
2.7.2.3
ADP
P
ATP
ADP
NADH
ATP
P
D-glyceraldehyde3-phosphate
ATP
NADPH
triosephosphat/Ptranslocator(TPT1_GAP)
P
AMP
P
NADP+
malate
D-fructose 1,6-bisphosphate
ATP
D-glucose 6-phosphate
P
NADP+
2.7.9.1
P
NADP+
D-glucose 1-phosphate
AMP
D-glyceraldehyde3-phosphate
2.7.2.3
OAA/malatetransporter
2.7.1.90
4.2.1.11
2.7.1.40
5.3.1.1
malate/glutamatetransporter
1.1.1.39
5.4.2.1
4.1.1.49
1.2.1.12
5.4.2.2
4.1.1.31
4.1.2.13
4.2.1.11
pyruvatetransporter
2.7.9.1
5.3.1.1
5.3.1.9
1.2.1.9
G1Ptransporter
3.1.3.11
1.1.1.40
phosphoenolpyruvat/phosphattransporter
4.1.2.13
1.2.1.13
2.7.1.11
G6Ptransporter
3.1.3.11
triosephosphat/Ptranslocator(TPT2_DHAP)
2.7.1.11
ADP
P
malate
NADPH
D-fructose 6-phosphate
5.4.2.2
ADP
D-glucose 1-phosphate
NAD+
P
P
PP
ATP
pyruvate
P
ATP
2.7.1.40
P
NADH
3-phospho-D-glycerate
2-phospho-D-glycerate
1,3-bisphospho-D-glycerate
P
pyruvate
1,3-bisphospho-D-glycerate
P
P
1.1.1.37
phosphoenolpyruvateATP
NAD+
NADH
dihydroxyacetonephosphate
dihydroxyacetonephosphate
CO2
ADP
3-phospho-D-glycerate
ATP
5.4.2.1
D-glucose 6-phosphate
ADP
CO2
PP
NAD+
malate
CO2
P
P P
5.3.1.9
L-glutamate
dihydroxyacetonephosphate
P
oxaloacetate
L-glutamate
D-fructose 6-phosphate
P
PP
NADPH
pyruvate
(b) Grid-Snap
triosephosphat/Ptranslocator
(TPT3_3-PGA)
P
D-fructose 1,6-bisphosphate
oxaloacetate
CO2
ADP
malate
ATP
phosphoenolpyruvate
2-phospho-D-glycerate
oxaloacetate
2.7.2.3
ADP
P
ATP
ADP
NADH
ATP
P
D-glyceraldehyde3-phosphate
ATP
NADPH
triosephosphat/Ptranslocator(TPT1_GAP)
P
AMP
P
NADP+
malate
D-fructose 1,6-bisphosphate
ATP
D-glucose 6-phosphate
P
NADP+
2.7.9.1
P
NADP+
D-glucose 1-phosphate
AMP
D-glyceraldehyde3-phosphate
2.7.2.3
OAA/malatetransporter
2.7.1.90
4.2.1.11
2.7.1.40
5.3.1.1
malate/glutamatetransporter
1.1.1.39
5.4.2.1
4.1.1.49
1.2.1.12
5.4.2.2
4.1.1.31
4.1.2.13
4.2.1.11
pyruvatetransporter
2.7.9.1
5.3.1.1
5.3.1.9
1.2.1.9
G1Ptransporter
3.1.3.11
1.1.1.40
phosphoenolpyruvat/phosphattransporter
4.1.2.13
1.2.1.13
2.7.1.11
G6Ptransporter
3.1.3.11
triosephosphat/Ptranslocator(TPT2_DHAP)
2.7.1.11
ADP
P
malate
NADPH
D-fructose 6-phosphate
5.4.2.2
ADP
D-glucose 1-phosphate
NAD+
P
P
PP
ATP
pyruvate
P
ATP
2.7.1.40
P
NADH
3-phospho-D-glycerate
2-phospho-D-glycerate
1,3-bisphospho-D-glycerate
P
pyruvate
1,3-bisphospho-D-glycerate
P
P
1.1.1.37
phosphoenolpyruvate
ATP
NAD+
NADH
dihydroxyacetonephosphatedihydroxyacetone
phosphate
CO2
ADP
3-phospho-D-glycerate
ATP
5.4.2.1
D-glucose 6-phosphate
ADP
CO2
PP
NAD+
malate
CO2
P
PP
5.3.1.9
L-glutamate
dihydroxyacetonephosphate
P
oxaloacetate
L-glutamate
D-fructose 6-phosphate
P
PP
NADPH
pyruvate
(c) Node-Snap
triosephosphat/Ptranslocator
(TPT3_3-PGA)
P
D-fructose 1,6-bisphosphate
oxaloacetate
CO2
ADP
malate
ATP
phosphoenolpyruvate
2-phospho-D-glycerate
oxaloacetate
2.7.2.3
ADP
P
ATP
ADP
NADH
ATP
P
D-glyceraldehyde3-phosphate
ATP
NADPH
triosephosphat/Ptranslocator(TPT1_GAP)
P
AMP
P
NADP+
malate
D-fructose 1,6-bisphosphate
ATP
D-glucose 6-phosphate
P
NADP+
2.7.9.1
P
NADP+
D-glucose 1-phosphate
AMP
D-glyceraldehyde3-phosphate
2.7.2.3
OAA/malatetransporter
2.7.1.90
4.2.1.11
2.7.1.40
5.3.1.1
malate/glutamatetransporter
1.1.1.39
5.4.2.1
4.1.1.49
1.2.1.12
5.4.2.2
4.1.1.31
4.1.2.13
4.2.1.11
pyruvatetransporter
2.7.9.1
5.3.1.1
5.3.1.9
1.2.1.9
G1Ptransporter
3.1.3.11
1.1.1.40
phosphoenolpyruvat/phosphattransporter
4.1.2.13
1.2.1.13
2.7.1.11
G6Ptransporter
3.1.3.11
triosephosphat/Ptranslocator(TPT2_DHAP)
2.7.1.11
ADP
P
malate
NADPH
D-fructose 6-phosphate
5.4.2.2
ADP
D-glucose 1-phosphate
NAD+
P
P
PP
ATP
pyruvate
P
ATP
2.7.1.40
P
NADH
3-phospho-D-glycerate
2-phospho-D-glycerate
1,3-bisphospho-D-glycerate
P
pyruvate
1,3-bisphospho-D-glycerate
P
P
1.1.1.37
phosphoenolpyruvateATP
NAD+
NADH
dihydroxyacetonephosphate
dihydroxyacetonephosphate
CO2
ADP
3-phospho-D-glycerate
ATP
5.4.2.1
D-glucose 6-phosphate
ADP
CO2
PP
NAD+
malate
CO2
P
P P
5.3.1.9
L-glutamate
dihydroxyacetonephosphate
P
oxaloacetate
L-glutamate
D-fructose 6-phosphate
P
PP
NADPH
pyruvate
(d) Node-Snap+Grid-Snap
triosephosphat/Ptranslocator
(TPT3_3-PGA)
P
D-fructose 1,6-bisphosphate
oxaloacetate
CO2
ADP
malate
ATP
phosphoenolpyruvate
2-phospho-D-glycerate
oxaloacetate
2.7.2.3
ADP
P
ATP
ADP
NADH
ATP
P
D-glyceraldehyde3-phosphate
ATP
NADPH
triosephosphat/Ptranslocator(TPT1_GAP)
P
AMP
P
NADP+
malate
D-fructose 1,6-bisphosphate
ATP
D-glucose 6-phosphate
P
NADP+
2.7.9.1
P
NADP+
D-glucose 1-phosphate
AMP
D-glyceraldehyde3-phosphate
2.7.2.3
OAA/malatetransporter
2.7.1.90
4.2.1.11
2.7.1.40
5.3.1.1
malate/glutamatetransporter
1.1.1.39
5.4.2.1
4.1.1.49
1.2.1.12
5.4.2.2
4.1.1.31
4.1.2.13
4.2.1.11
pyruvatetransporter
2.7.9.1
5.3.1.1
5.3.1.9
1.2.1.9
G1Ptransporter
3.1.3.11
1.1.1.40
phosphoenolpyruvat/phosphattransporter
4.1.2.13
1.2.1.13
2.7.1.11
G6Ptransporter
3.1.3.11
triosephosphat/Ptranslocator(TPT2_DHAP)
2.7.1.11
ADP
P
malate
NADPH
D-fructose 6-phosphate
5.4.2.2
ADP
D-glucose 1-phosphate
NAD+
P
P
PP
ATP
pyruvate
P
ATP
2.7.1.40
P
NADH
3-phospho-D-glycerate
2-phospho-D-glycerate
1,3-bisphospho-D-glycerate
P
pyruvate
1,3-bisphospho-D-glycerate
P
P
1.1.1.37
phosphoenolpyruvate
ATP
NAD+
NADH
dihydroxyacetonephosphate
dihydroxyacetonephosphate
CO2
ADP
3-phospho-D-glycerate
ATP
5.4.2.1
D-glucose 6-phosphate
ADP
CO2
PP
NAD+
malate
CO2
P
P
P 5.3.1.9
L-glutamate
dihydroxyacetonephosphate
P
oxaloacetate
L-glutamate
D-fructose 6-phosphate
P
PP
NADPHpyruvate
(e) ACA
triosephosphat/Ptranslocator
(TPT3_3-PGA)
P
D-fructose 1,6-bisphosphate
oxaloacetate
CO2
ADP
malate
ATP
phosphoenolpyruvate
2-phospho-D-glycerate
oxaloacetate
2.7.2.3
ADP
P
ATP
ADP
NADH
ATP
P
D-glyceraldehyde3-phosphate
ATP
NADPH
triosephosphat/Ptranslocator(TPT1_GAP)
P
AMP
P
NADP+
malate
D-fructose 1,6-bisphosphate
ATP
D-glucose 6-phosphate
P
NADP+
2.7.9.1
P
NADP+
D-glucose 1-phosphate
AMP
D-glyceraldehyde3-phosphate
2.7.2.3
OAA/malatetransporter
2.7.1.90
4.2.1.11
2.7.1.40
5.3.1.1
malate/glutamatetransporter
1.1.1.39
5.4.2.1
4.1.1.49
1.2.1.12
5.4.2.2
4.1.1.31
4.1.2.13
4.2.1.11
pyruvatetransporter 2.7.9.1
5.3.1.1
5.3.1.9
1.2.1.9
G1Ptransporter
3.1.3.11
1.1.1.40
phosphoenolpyruvat/phosphattransporter
4.1.2.13
1.2.1.13
2.7.1.11
G6Ptransporter
3.1.3.11
triosephosphat/Ptranslocator(TPT2_DHAP)
2.7.1.11
ADP
P
malate
NADPH
D-fructose 6-phosphate
5.4.2.2
ADP
D-glucose 1-phosphate
NAD+
P
P
PP
ATP
pyruvate
P
ATP
2.7.1.40
P
NADH
3-phospho-D-glycerate
2-phospho-D-glycerate
1,3-bisphospho-D-glycerate
P
pyruvate
1,3-bisphospho-D-glycerate
P
P
1.1.1.37
phosphoenolpyruvate
ATP
NAD+
NADH
dihydroxyacetonephosphatedihydroxyacetone
phosphate
CO2
ADP
3-phospho-D-glycerate
ATP
5.4.2.1
D-glucose 6-phosphate
ADP
CO2
PP
NAD+
malate
CO2
P
P
P
5.3.1.9
L-glutamate
dihydroxyacetonephosphate
P
oxaloacetate
L-glutamate
D-fructose 6-phosphate
P
PP
NADPHpyruvate
(f) ACA + Grid-Snap
Fig. 1: Different combinations of our automatic layout techniques for grid-like layout compared with standard force-directed layout. The layout is foran SBGN (Systems Biology Graphical Notation) diagram of the Glycolysis-Gluconeogenesis pathway obtained from MetaCrop [14]. In SBGN diagrams,process nodes represent individual chemical reactions which typically form linksin long metabolic pathways, and are often connected to several degree-1 nodesrepresenting “currency molecules” like ATP and ADP, while precisely two oftheir neighbours are degree-2 nodes representing principal metabolites. It is con-ventional that the edges connecting main chemicals and process nodes be axis-aligned in long chains, but not the leaf edges. We achieve this by tailoring thecost functions discussed in §4.
2

Before proceeding, it is worth defining what we mean by a grid-like layout.It is commonly used to mean some combination of the following properties:
1. nodes are positioned at points on a fairly coarse grid;2. edges are simple horizontal or vertical lines or in some cases 45◦ diagonals;3. nodes of the same kind are horizontally or vertically aligned;4. edges are orthogonal, i.e., any bends are 90◦.
and thus is more general than the notion of a grid layout. In this paper we areprimarily interested in producing layouts with properties (1) and (2), though ourmethods could also achieve (3). We do not consider edges with orthogonal bends,though this could be an extension or achieved through a routing post-process (asimple example of this is provided in the Appendix).
The standard approach to extending force-directed methods to handle newaesthetic criteria is to add extra “forces” which push nodes in order to satisfyparticular aesthetics. One of the most commonly used functions is stress [9].Our first contribution (§3) is to develop penalty terms that can be added tothe stress function to reward placement on points in a grid (Property 1) andto reward horizontal or vertical node alignment and/or horizontal or verticaledges (Property 2 or 3). We call these the Grid-Snap and Node-Snap methodsrespectively.
However, additional terms can make the goal function rich in local minimathat impede convergence to a more aesthetically pleasing global minimum. Also,such “soft” constraints cannot guarantee satisfaction and so layouts in whichnodes are nearly-but-not-quite aligned can occur. For this reason we investigatea second approach based on constrained graph layout in which hard alignmentconstraints are automatically added to the layout so as to ensure horizontal orvertical node alignment and thus horizontal or vertical edges (Property 2 or 3).This adaptive constrained alignment (ACA) method (§4) is the most innovativecontribution of our paper.
In §6 we provide an empirical investigation of the speed of these approachesand the quality of layout with respect to various features encoding what we feelare the aesthetic criteria important in grid-like network layout.
While the above approaches can be used in once-off network layout, ouroriginal motivation was for interactive-layout applications. In §5 we discuss aninteraction model based on the above for the use of grid-like layout in interactivesemi-automatic layout tools such as Dunnart.
Related Work: Our research is related to proposals for automatic grid-likelayout of biological networks [1, 12, 10]. These arrange biological networks withgrid coordinates for nodes in addition to various layout constraints. In particu-lar Barsky et al. [1] consider alignment constraints between biologically similarnodes and Kojima et al. [10] perform layout subject to rectangular containersaround functionally significant groups of nodes (e.g., metabolites inside the nu-cleus of a cell). In general they use fairly straight-forward simulated annealing orsimple incremental local-search strategies. Such methods work to a degree butare slow and may never reach a particularly aesthetically appealing minimum.
3

Another application where grid-like layout is an important aesthetic is au-tomatic Metro-map layout. Stott et al. [16] use a simple local-search (“hill-climbing”) technique to obtain layout on grid points subject to a number ofconstraints, such as octilinear edge orientation. Wang and Chi [18] seek similarlayout aesthetics but using continuous non-linear optimization subject to octilin-earity and planarity constraints. This work, like ours, is based on a quasi-newtonoptimization method, but it is very specific to metro-map layout and it is not atall clear how these techniques could be adapted to general-purpose interactivediagramming applications.
Another family of algorithms that compute grid-like layout are so-called or-thogonal graph drawing methods. There have been some efforts to make theseincremental, for example Brandes et al. [3] can produce an orthogonal drawingof a graph that respects the topology for a given set of initial node positions.Being based on the “Kandinski” orthogonal layout pipeline, extending such amethod with user-defined constraints such as alignment or hierarchical contain-ment would require non-trivial engineering of each stage in the pipeline. Thereis also a body of theoretical work considering the computability and geometricproperties of layout with grid-constraints for various classes of graphs, e.g. [4].Though interesting in its own right, such work is usually not intended for prac-tical application, which is the primary concern of this paper.
There are several examples of the application of soft-constraints to layout.Sugiyama and Misue [17] augment the standard force-model with “magnetic”edge-alignment forces. Ryall et al. [15] explored the use of various force-basedconstraints in the context of an interactive diagramming editor. It is the limita-tions of such soft constraints (discussed below) which prompt the developmentof the techniques described in §4.
2 Aesthetic criteria
Throughout this paper we assume that we have a graph G = (V,E,w, h) con-sisting of a set of nodes V , a set of edges E ⊆ V × V and wv, hv are the widthand height of node v ∈ V . We wish to find a straight-line 2D drawing for G.This is specified by a pair (x, y) where (xv, yv) is the centre point of each v ∈ V .
We quantify grid-like layout quality through the following metrics. In subse-quent sections we use these to develop soft and hard constraints that directly orindirectly aim to optimise them. We also use these metrics in our evaluation §6.
Embedding quality We measure this using the P-stress function [8], a variantof stress [9] that does not penalise unconnected nodes being more than theirdesired distance apart. It measures the separation between each pair of nodesu, v ∈ V in the drawing and their ideal distance duv proportional to the graphtheoretic path between them:∑
u<v∈V
wuv((duv − d(u, v))+
)2+
∑(u,v)∈E
wp((d(u, v)− dL)+
)2where d(u, v) is the Euclidean distance between u and v, (z)+ = z if z ≥ 0 otherwise
0, dL is an ideal edge length, wp = 1dL
, and wuv = 1d2uv
.
4
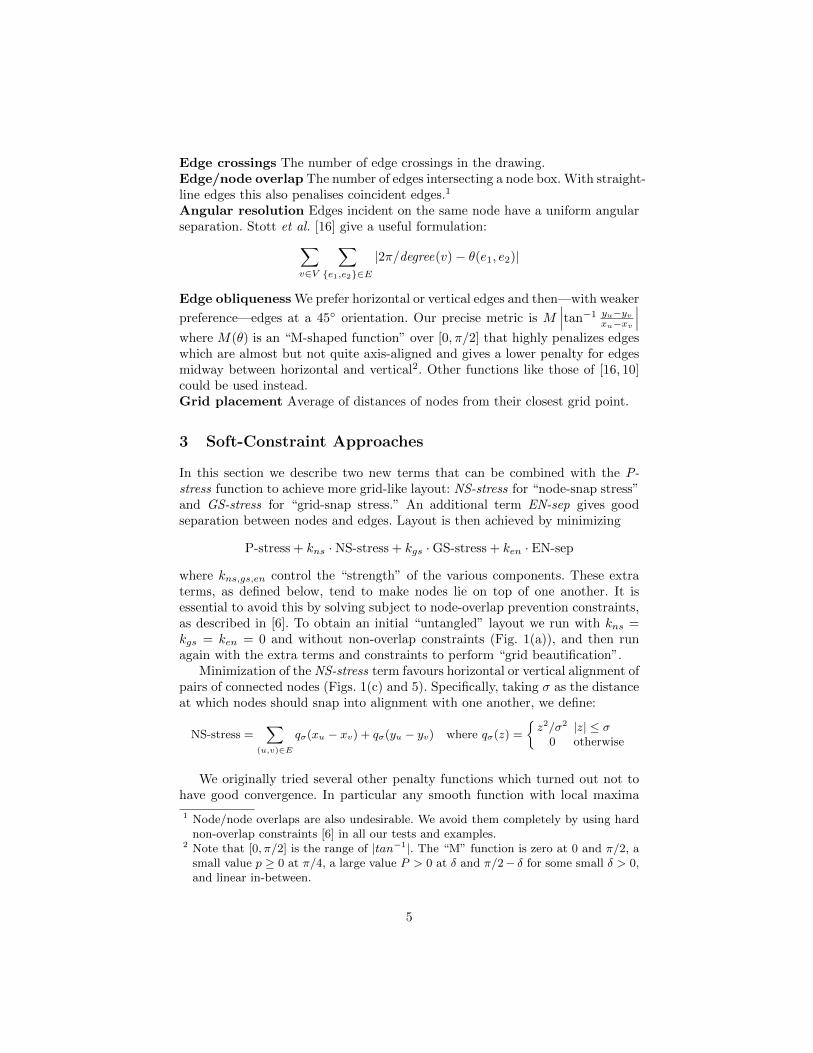
Edge crossings The number of edge crossings in the drawing.Edge/node overlap The number of edges intersecting a node box. With straight-line edges this also penalises coincident edges.1
Angular resolution Edges incident on the same node have a uniform angularseparation. Stott et al. [16] give a useful formulation:∑
v∈V
∑{e1,e2}∈E
|2π/degree(v)− θ(e1, e2)|
Edge obliqueness We prefer horizontal or vertical edges and then—with weaker
preference—edges at a 45◦ orientation. Our precise metric is M∣∣∣tan−1 yu−yv
xu−xv
∣∣∣where M(θ) is an “M-shaped function” over [0, π/2] that highly penalizes edgeswhich are almost but not quite axis-aligned and gives a lower penalty for edgesmidway between horizontal and vertical2. Other functions like those of [16, 10]could be used instead.Grid placement Average of distances of nodes from their closest grid point.
3 Soft-Constraint Approaches
In this section we describe two new terms that can be combined with the P-stress function to achieve more grid-like layout: NS-stress for “node-snap stress”and GS-stress for “grid-snap stress.” An additional term EN-sep gives goodseparation between nodes and edges. Layout is then achieved by minimizing
P-stress + kns ·NS-stress + kgs ·GS-stress + ken · EN-sep
where kns,gs,en control the “strength” of the various components. These extraterms, as defined below, tend to make nodes lie on top of one another. It isessential to avoid this by solving subject to node-overlap prevention constraints,as described in [6]. To obtain an initial “untangled” layout we run with kns =kgs = ken = 0 and without non-overlap constraints (Fig. 1(a)), and then runagain with the extra terms and constraints to perform “grid beautification”.
Minimization of the NS-stress term favours horizontal or vertical alignment ofpairs of connected nodes (Figs. 1(c) and 5). Specifically, taking σ as the distanceat which nodes should snap into alignment with one another, we define:
NS-stress =∑
(u,v)∈E
qσ(xu − xv) + qσ(yu − yv) where qσ(z) =
{z2/σ2 |z| ≤ σ
0 otherwise
We originally tried several other penalty functions which turned out not tohave good convergence. In particular any smooth function with local maxima
1 Node/node overlaps are also undesirable. We avoid them completely by using hardnon-overlap constraints [6] in all our tests and examples.
2 Note that [0, π/2] is the range of |tan−1|. The “M” function is zero at 0 and π/2, asmall value p ≥ 0 at π/4, a large value P > 0 at δ and π/2− δ for some small δ > 0,and linear in-between.
5

at ±σ must be concave-down somewhere over the interval [−σ, σ], and whiledifferentiability may seem intuitively desirable for quadratic optimization it is infact trumped by downward concavity, which plays havoc with standard step-sizecalculations on which our gradient-projection algorithm is based. Thus, obviouschoices like an inverted quartic (1+(z2−σ2)2)−1 or a sum of inverted quadratics(1+(z+σ)2)−1 +(1+(z−σ)2)−1 proved unsuitable in place of qσ(z). We reviewthe step size, gradient, and Hessian formulae for our snap-stress functions in theappendix.
We designed our GS-stress function likewise to make the lines of a virtualgrid exert a similar attractive force on nodes once within the snap distance σ:
GS-stress =∑u∈V
qσ(xu − au) + qσ(yu − bu)
where (au, bu) is the closest grid point to (xu, yu) (with ties broken by favouringthe point closer to the origin), see Fig. 1(b). The grid is defined to be the set ofall points (nτ,mτ), where n and m are integers, and τ is the “grid size”. WithGS-stress active it is important to set some other parameters proportional to τ .First, we take σ = τ/2. Next, we modify the non-overlap constraints to allowno more than one node centre to be in the vicinity of any one grid point byincreasing the minimum separation distance allowed between adjacent nodes toτ . Finally, we found that setting the ideal edge length equal to τ for initial force-directed layout, before activating GS-stress, helped to put nodes in positionscompatible with the grid.
Our third term EN-sep is also a quadratic function based on qσ(z) thatseparates nodes and nearby axis-aligned edges to avoid node/edge overlaps andcoincident edges:
EN-sep =∑
e∈EV ∪EH
∑u∈V
qσ((σ − d(u, e))+
),
where EV and EH are the sets of vertically and horizontally aligned edges,respectively, and the distance d(u, e) between a node u and an edge e is definedas the length of the normal from u to e if that exists, or +∞ if it does not. Hereagain we took σ = τ/2.
In our experiments we refer to various combinations of these terms and constraints:Node-Snap: NS-stress, EN-sep, non-overlap constraints, kgs = 0Grid-Snap: GS-stress, EN-sep, ideal edge lengths equal to grid size, non-overlap,constraints with separations tailored to grid size, kns = 0.Node-Snap+Grid-Snap: achieves extra alignment by adding NS-stress to theabove Grid-Snap recipe (i.e. kns 6= 0)
4 Adaptive Constrained Alignment
Another way to customize constrained force-directed layout is by adding hardconstraints, and in this section we describe how to make force-directed layoutsmore grid-like simply by adding alignment and separation constraints (Fig. 1(e)).
6

The algorithm, which we call Adaptive Constrained Alignment or ACA, is agreedy algorithm which repeatedly chooses an edge inG and aligns it horizontallyor vertically (see adapt const align procedure of Figure 2). It adapts to userspecified constraints by not adding alignments that violate these. The algorithmhalts when the heuristic can no longer find any acceptable alignment to apply.Since each edge is aligned at most once, there are at most |E| iterations.
We tried the algorithm with three different heuristics for choosing potentialalignments, which we discuss below.
Node overlaps and edge/node overlaps can be prevented with hard non-overlap constraints and the EN-sep soft constraint discussed in Section 3, appliedeither before or after the ACA process. However, coincident edges can be acciden-tally created and then enforced as we apply alignments if we do not take careto maintain the orthogonal ordering of nodes. If for example two edges (u, v)and (v, w) sharing a common endpoint v are both horizontally aligned, thenwe must maintain either the ordering xu < xv < xw or the opposite orderingxw < xv < xu.
Therefore we define the notion of a separated alignment, written SA(u, v,D)where u, v ∈ V and D ∈ {N,S,W,E} is a compass direction. Applying a sepa-rated alignment means applying two constraints to the force-directed layout—one alignment and one separation—as follows:
SA(u, v,N) ≡ xu = xv and yv + β(u, v) ≤ yu, SA(u, v,S) ≡ SA(v, u,N),SA(u, v,W) ≡ yu = yv and xv + α(u, v) ≤ xu, SA(u, v,E) ≡ SA(v, u,W),
where α(u, v) = (wu + wv)/2 and β(u, v) = (hu + hv)/2. (Thus for exampleSA(u, v,N) can be read as, “the ray from u through v points north,” where wethink of v as lying north of u when its y-coordinate is smaller.)
proc adapt const align(G,C,H)(x, y)← cfdl(G,C)SA← H(G,C, x, y)while SA ! = NULLC.append(SA)(x, y)← cfdl(G,C)SA← H(G,C, x, y)
return (x, y, C)
proc chooseSA(G,C, x, y,K)S ← NULLcost ←∞for each (u, v) ∈ E and dir. D
if not creates coincidence(C, x, y, u, v,D)if K(u, v,D) < costS ← SA(u, v,D)cost ← K(u, v,D)
return S
Fig. 2: Adaptive constrained alignment algorithm. G is the given graph, C theset of user-defined constraints, H the alignment choice heuristic, and cfdl theconstrained force-directed layout procedure.
Alignment Choice Heuristics We describe two kinds of alignment choiceheuristics: generic, which can be applied to any graph, and convention-based,which are intended for use with layouts that must conform to special conventions,for example SBGN diagrams [11]. All of our heuristics are designed according totwo principles:
7
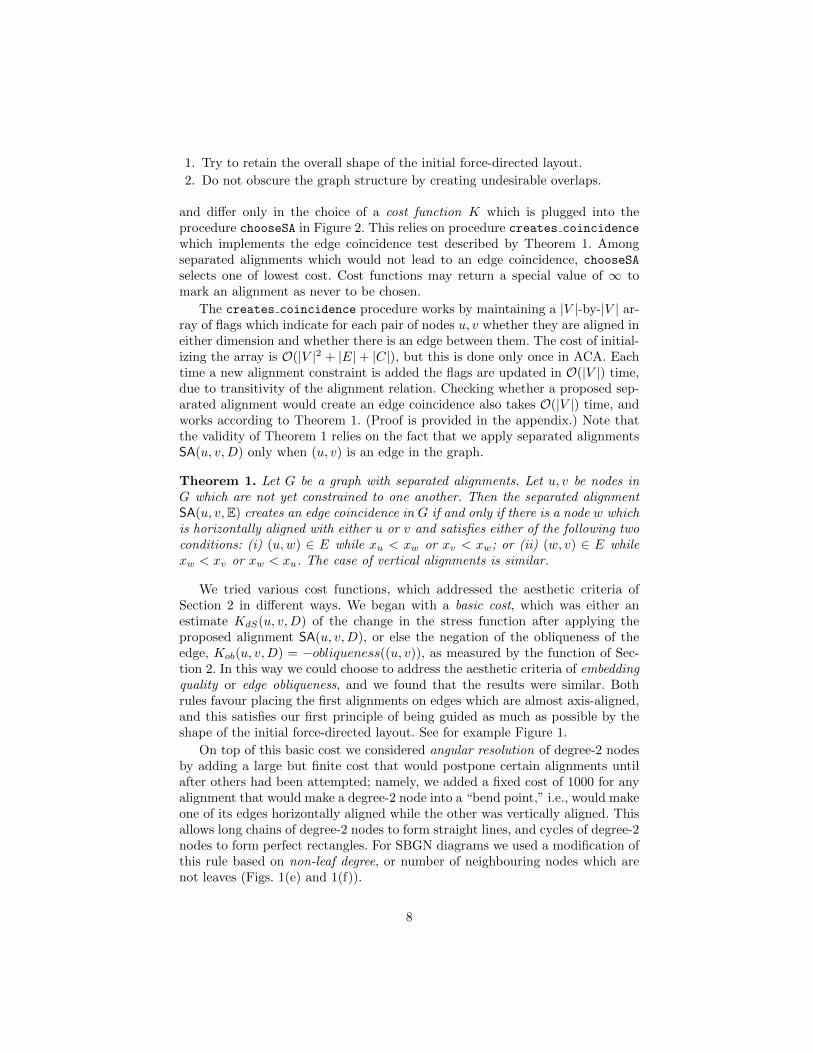
1. Try to retain the overall shape of the initial force-directed layout.
2. Do not obscure the graph structure by creating undesirable overlaps.
and differ only in the choice of a cost function K which is plugged into theprocedure chooseSA in Figure 2. This relies on procedure creates coincidence
which implements the edge coincidence test described by Theorem 1. Amongseparated alignments which would not lead to an edge coincidence, chooseSAselects one of lowest cost. Cost functions may return a special value of ∞ tomark an alignment as never to be chosen.
The creates coincidence procedure works by maintaining a |V |-by-|V | ar-ray of flags which indicate for each pair of nodes u, v whether they are aligned ineither dimension and whether there is an edge between them. The cost of initial-izing the array is O(|V |2 + |E|+ |C|), but this is done only once in ACA. Eachtime a new alignment constraint is added the flags are updated in O(|V |) time,due to transitivity of the alignment relation. Checking whether a proposed sep-arated alignment would create an edge coincidence also takes O(|V |) time, andworks according to Theorem 1. (Proof is provided in the appendix.) Note thatthe validity of Theorem 1 relies on the fact that we apply separated alignmentsSA(u, v,D) only when (u, v) is an edge in the graph.
Theorem 1. Let G be a graph with separated alignments. Let u, v be nodes inG which are not yet constrained to one another. Then the separated alignmentSA(u, v,E) creates an edge coincidence in G if and only if there is a node w whichis horizontally aligned with either u or v and satisfies either of the following twoconditions: (i) (u,w) ∈ E while xu < xw or xv < xw; or (ii) (w, v) ∈ E whilexw < xv or xw < xu. The case of vertical alignments is similar.
We tried various cost functions, which addressed the aesthetic criteria ofSection 2 in different ways. We began with a basic cost, which was either anestimate KdS(u, v,D) of the change in the stress function after applying theproposed alignment SA(u, v,D), or else the negation of the obliqueness of theedge, Kob(u, v,D) = −obliqueness((u, v)), as measured by the function of Sec-tion 2. In this way we could choose to address the aesthetic criteria of embeddingquality or edge obliqueness, and we found that the results were similar. Bothrules favour placing the first alignments on edges which are almost axis-aligned,and this satisfies our first principle of being guided as much as possible by theshape of the initial force-directed layout. See for example Figure 1.
On top of this basic cost we considered angular resolution of degree-2 nodesby adding a large but finite cost that would postpone certain alignments untilafter others had been attempted; namely, we added a fixed cost of 1000 for anyalignment that would make a degree-2 node into a “bend point,” i.e., would makeone of its edges horizontally aligned while the other was vertically aligned. Thisallows long chains of degree-2 nodes to form straight lines, and cycles of degree-2nodes to form perfect rectangles. For SBGN diagrams we used a modification ofthis rule based on non-leaf degree, or number of neighbouring nodes which arenot leaves (Figs. 1(e) and 1(f)).
8

Fig. 3: Interacting with Node-Snap. The user is dragging node a steadily to theright. When the horizontal distance between a and b is less than the averagewidth of these two nodes, the NS-stress function causes b to align with a. As theuser continues dragging, the now aligned node b will follow until either a quickjerk of node a breaks the alignment, or else edges attached to b pull it back tothe left, overcoming its attraction to a. To the user, the impression is that thealignment persisted until it was “torn” by the underlying forces in the system.
Respecting user-defined constraints Layout constraints can easily wind upin conflict with one another if not chosen carefully. In Dunnart such conflicts aredetected during the projection operation described in [5], an active set methodwhich iteratively determines the most violated constraint c and satisfies it byminimal disturbance of the node positions. When it is impossible to satisfy cwithout violating one of the constraints that is already in the active set, c issimply marked unsatisfiable, and the operation carries on without it.
For ACA it is important that user-defined constraints are never marked un-satisfiable in deference to an alignment imposed by the process; therefore weterm the former definite constraints and the latter tentative constraints. We em-ploy a modified projection operation which always chooses to mark one or moretentative constraint as unsatisfiable if they are involved in a conflict.
For conflicts involving more than one tentative constraint, we use Lagrangemultipliers to choose which one to reject. These are computed as a part of theprojection process. Since alignment constraints are equalities (not inequalities)the sign of their Lagrange multiplier does not matter, and a constraint whoseLagrange multiplier is maximal in absolute value is one whose rejection shouldpermit the greatest decrease in the stress function. Therefore we choose this one.
ACA does not snap nodes to grid-points: if desired this can be achieved onceACA has added the alignment constraints by activating Grid-Snap.
5 Interaction
One benefit of the approaches described above is that they are immediately ap-plicable for use in interactive tools where the underlying graph, the prerequisiteconstraint system, or ideal positions for nodes can all change dynamically. We
9

implemented Node-Snap, Grid-Snap and Adaptive Constrained Alignment forinteractive use in the Dunnart diagram editor.3 In Dunnart, automatic layoutruns continuously in a background worker thread, allowing the layout to adaptimmediately to user-specified changes to positions or constraints.
For example, Figure 3 illustrates user interaction with Node-Snap. As the userdrags a node around the canvas, it may snap into alignment with an adjacentnode. Slowly dragging a node aligned with other nodes will move them togetherand keep them in alignment, while quickly dragging a node will instead cause itto be torn from any alignments.
When we tried Node-Snap interactively in Dunnart we found that nodestended to stick together in clumps if the σ parameter of NS-stress was largerthan their average size in either dimension. We solved this problem by replacingthe snap-stress term by∑
(u,v)∈E
qα(u,v)(xu − xv) + qβ(u,v)(yu − yv)
where α, β are as on page 7.
In Dunnart, a dragged object is always pinned to the mouse cursor. In thecase of Grid-Snap, the dragged node is unpinned and will immediately snapto a grid point on mouse-up. Other nodes, however, will snap-to or tear-awayfrom grid points in response to changing dynamics in the layout system. Duringdragging we also turn off non-overlap constraints and reapply them on mouse-up. This prevents nodes being unexpectedly pushed out of place as a result ofthe expanded non-overlap region (§3). Additionally, since GS-stress holds nodesin place, we allow the user to quickly drag a node to temporarily overcome thegrid forces and allow the layout to untangle with standard force-directed layout.Once it converges we automatically reapply GS-stress.
6 Evaluation
To evaluate the various techniques we applied each to 252 graphs from the“AT&T Graphs” corpus (ftp://ftp.research.att.com/dist/drawdag/ug.gz)with between 10 and 244 nodes. We excluded graphs with fewer than 10 nodesand two outlier graphs: one with 1103 nodes and one with 0 edges. We recordedrunning times of each stage in the automated batch process and the various aes-thetic metrics described in §2, using a MacBook Pro with a 2.3GHz Intel CoreI7 CPU. Details of collected data etc. are given in the Appendix.
We found that ACA was the slowest approach, often taking up to 10 times aslong as the other methods, on average around 5 seconds for graphs with around100 nodes, while the other approaches took around a second. ACA was alsosensitive to the density of edges. Of the soft constraint approaches, Grid-Snap
3 A video demonstrating interactive use of the approaches described in this paper isavailable at http://www.dunnart.org.
10

0
5
10
15
20
ACA FD ACA+GS GS NS+GS NS
Fig. 4: Edge obliqueness (see §2) re-sults. The hard-constraint approachACA is better than either of thesoft constraint approaches Grid-Snap (GS) and Node-Snap (NS).The combination of ACA and GSgives the best result.
5.3.1.1
4.1.1.39
2.7.1.19
1.2.1.13
4.1.2.13
P
D-ribulose 5-phosphate
NADP+
ATP
NADPH
D-xylulose 5-phosphate
3.1.3.37
sedoheptulose 1,7-bisphosphate
3-phospho-D-glycerate
ADP
ADP
D-sedoheptulose7-phosphate
D-ribose 5-phosphate
dihydroxyacetonephosphate
D-ribulose 1,5-bisphosphate
P
CO2
3.1.3.11
1,3-bisphospho-D-glycerate
D-glyceraldehyde3-phosphate
D-fructose 6-phosphate
D-xylulose 5-phosphate
D-fructose 1,6-bisphosphate
D-glyceraldehyde3-phosphate
dihydroxyacetonephosphate
ATP
P
D-erythrose 4-phosphate
2.2.1.1
D-glyceraldehyde3-phosphate
2.2.1.15.1.3.1
4.1.2.13
5.3.1.6
2.7.2.3
5.3.1.1
4.1.1.39
2.7.1.19
1.2.1.13
4.1.2.13
P
D-ribulose 5-phosphate
NADP+
ATP
NADPH
D-xylulose 5-phosphate
3.1.3.37
sedoheptulose 1,7-bisphosphate
3-phospho-D-glycerate
ADP
ADP
D-sedoheptulose7-phosphate
D-ribose 5-phosphate
dihydroxyacetonephosphate
D-ribulose 1,5-bisphosphate
P
CO2
3.1.3.11
1,3-bisphospho-D-glycerate
D-glyceraldehyde3-phosphate
D-fructose 6-phosphate
D-xylulose 5-phosphate
D-fructose 1,6-bisphosphate
D-glyceraldehyde3-phosphate
dihydroxyacetonephosphate
ATP
P
D-erythrose 4-phosphate
2.2.1.1
D-glyceraldehyde3-phosphate
2.2.1.1
5.1.3.1
4.1.2.13
5.3.1.6
2.7.2.3
Fig. 5: Layout of a SBGN diagram ofCalvin Cycle pathway shows how ACA(right) gives a more pleasing rectangu-lar layout than Node-Snap (left).
(being very local) added very little time over the unconstrained force-directedapproach.
The Edge Obliqueness (see §2) results are shown in Fig. 4 as this is arguablythe metric that is most indicative of grid-like layout. Another desirable propertyof grid-like layout, as noted in §4 is that longer paths in the graph also be aligned.ACA does a good job of aligning such paths, as is visible in Fig. 1 and 5.
7 Conclusion
We have explored how to incorporate grid-like layout conventions into a force-directed, constraint-based graph layout framework. We give two soft approaches(Node-Snap, Grid-Snap) based on adding terms to the goal function, and anadaptive constraint based approach (ACA) in which hard alignment constraintsare added greedily. We find the ACA approach is slower but gives more grid-likelayout and so is the method of choice for once-off layout, at least for mediumsized graphs.
We have also discussed how the approaches can be integrated into interactivediagramming tools like Dunnart. For interactive use both ACA and Grid-Snapprovide good initial layouts, while Node-Snap helps the user create further align-ments by hand.
Future work is to improve the speed of ACA by adding more than one align-ment constraint at a time and also to use Lagrange multipliers to improve theadaptivity of ACA. One idea is to automatically reject any alignment whose La-grange multiplier exceeds a predetermined threshold on each iteration of ACA.With this extension, running ACA continuously during interaction would allowus to achieve the behaviour illustrated in Fig. 3 through hard rather than softconstraints. Another issue with all the techniques described is the many fiddly
11
parameters, weights and thresholds. We intend to further investigate principledways to automatically set these.
References
1. Barsky, A., Gardy, J.L., Hancock, R.E., Munzner, T.: Cerebral: a cytoscape pluginfor layout of and interaction with biological networks using subcellular localizationannotation. Bioinformatics 23(8), 1040–1042 (2007)
2. Battista, G.D., Eades, P., Tamassia, R., Tollis, I.G.: Graph drawing: algorithmsfor the visualization of graphs. Prentice Hall PTR (1998)
3. Brandes, U., Eiglsperger, M., Kaufmann, M., Wagner, D.: Sketch-driven orthogonalgraph drawing. In: Graph Drawing. pp. 1–11. Springer (2002)
4. Chrobak, M., Payne, T.H.: A linear-time algorithm for drawing a planar graph ona grid. Information Processing Letters 54(4), 241–246 (1995)
5. Dwyer, T., Koren, Y., Marriott, K.: Ipsep-cola: An incremental procedure for sep-aration constraint layout of graphs. Visualization and Computer Graphics, IEEETransactions on 12(5), 821–828 (2006)
6. Dwyer, T., Marriott, K., Stuckey, P.J.: Fast node overlap removal. In: Graph Draw-ing. pp. 153–164. Springer (2006)
7. Dwyer, T., Marriott, K., Wybrow, M.: Dunnart: A constraint-based network dia-gram authoring tool. In: Graph Drawing. pp. 420–431. Springer (2009)
8. Dwyer, T., Marriott, K., Wybrow, M.: Topology preserving constrained graphlayout. In: Graph Drawing, pp. 230–241. Springer Berlin Heidelberg (2009)
9. Gansner, E.R., Koren, Y., North, S.: Graph drawing by stress majorization. In:Graph Drawing. pp. 239–250. Springer (2005)
10. Kojima, K., Nagasaki, M., Jeong, E., Kato, M., Miyano, S.: An efficient grid lay-out algorithm for biological networks utilizing various biological attributes. BMCBioinformatics 8(1), 76 (2007)
11. Le Novere, N., et al.: The Systems Biology Graphical Notation. Nature Biotech-nology 27, 735–741 (2009)
12. Li, W., Kurata, H.: A grid layout algorithm for automatic drawing of biochemicalnetworks. Bioinformatics 21(9), 2036–2042 (2005)
13. Marriott, K., Purchase, H., Wybrow, M., Goncu, C.: Memorability of visual fea-tures in network diagrams. Visualization and Computer Graphics, IEEE Transac-tions on 18(12), 2477–2485 (2012)
14. MetaCrop: http://pgrc-35.ipk-gatersleben.de/pls/htmldb_pgrc/f?p=269:
111:
15. Ryall, K., Marks, J., Shieber, S.: An interactive constraint-based system for draw-ing graphs. In: Proceedings of the 10th annual ACM symposium on User interfacesoftware and technology. pp. 97–104. ACM (1997)
16. Stott, J., Rodgers, P., Martinez-Ovando, J.C., Walker, S.G.: Automatic metromap layout using multicriteria optimization. Visualization and Computer Graph-ics, IEEE Transactions on 17(1), 101–114 (2011)
17. Sugiyama, K., Misue, K.: Graph drawing by the magnetic spring model. Journalof Visual Languages and Computing 6(3), 217–231 (1995)
18. Wang, Y.S., Chi, M.T.: Focus+context metro maps. Visualization and ComputerGraphics, IEEE Transactions on 17(12), 2528–2535 (2011)
12


![On Open Problems in Biological Network Visualizationusers.monash.edu/~mwybrow/papers/albrecht-gd-2009.pdf · for the visual analysis of biological networks (e.g., CellDesigner [11],](https://static.fdocuments.net/doc/165x107/5f0828487e708231d4209f8d/on-open-problems-in-biological-network-mwybrowpapersalbrecht-gd-2009pdf-for.jpg)