
Increasing the strength of QoE data with objective and ... · PDF fileIncreasing the strength...
17
Increasing the strength of QoE data with objective and quantified subjective measures Peter Brooks Bjørn Hestnes [email protected] [email protected]
Transcript of Increasing the strength of QoE data with objective and ... · PDF fileIncreasing the strength...

Increasing the strength of QoE data with objective and quantified subjective measures
Peter Brooks
Bjørn Hestnes

Users…

The book of “Human history”
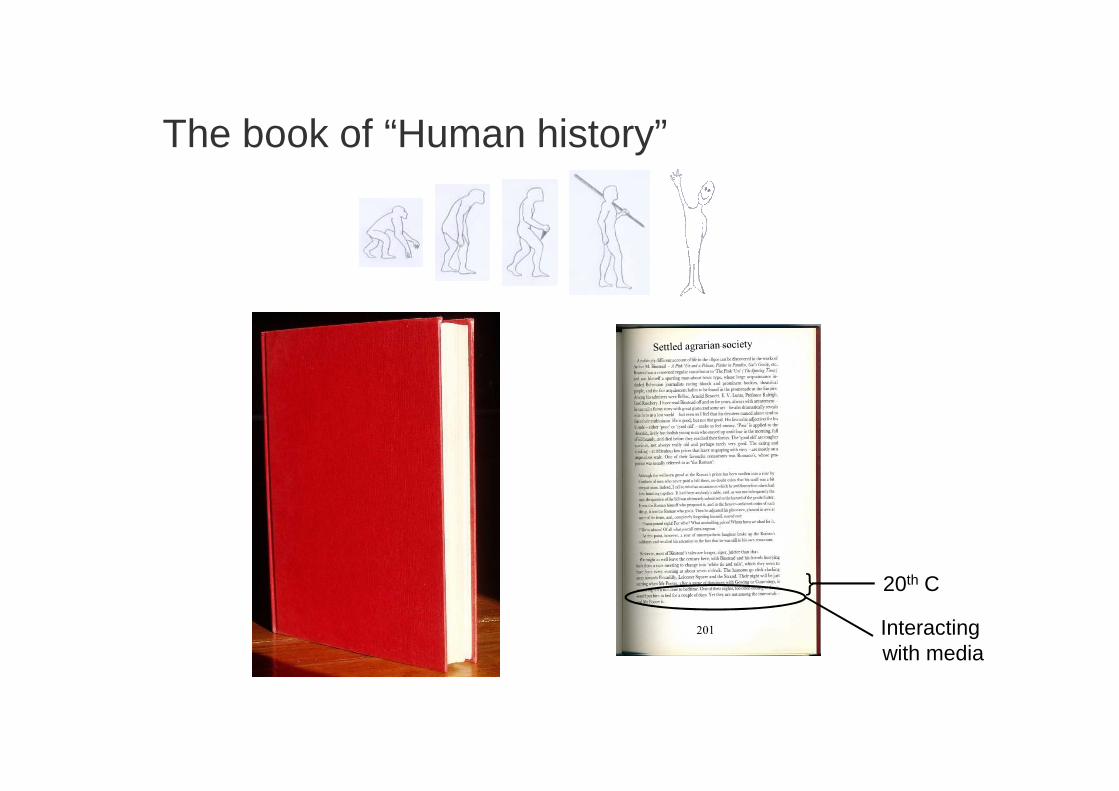
The book of “Human history”
} 20th C20th C
Interacting with mediaInteracting with media

Users…
• Limited attention
– Restricted sensory and working memory
– Automatically selective
– Perceptual blindness
– Easily disturbed
• Unconscious social responses
• Limited attention
– Restricted sensory and working memory
– Automatically selective
– Perceptual blindness
– Easily disturbed
• Unconscious social responses

Social responses are unconscious
Ba, Ba ?
Ga, Ga ?
Da, Da ?
McGurk & McDonald (1976)

QoS changes may not be perceived but still affect behaviour
• Reeves & Nass (1996)
– 170 ms audio-video asynchrony not noticed
BUT
– Ratings of speaker more negativeLive News
• Wilson & Sasse (2000)
– Change in frame-rate from 5 - 25 fps not noticed
BUT
– Physiological measure of stress greater with 5 fps
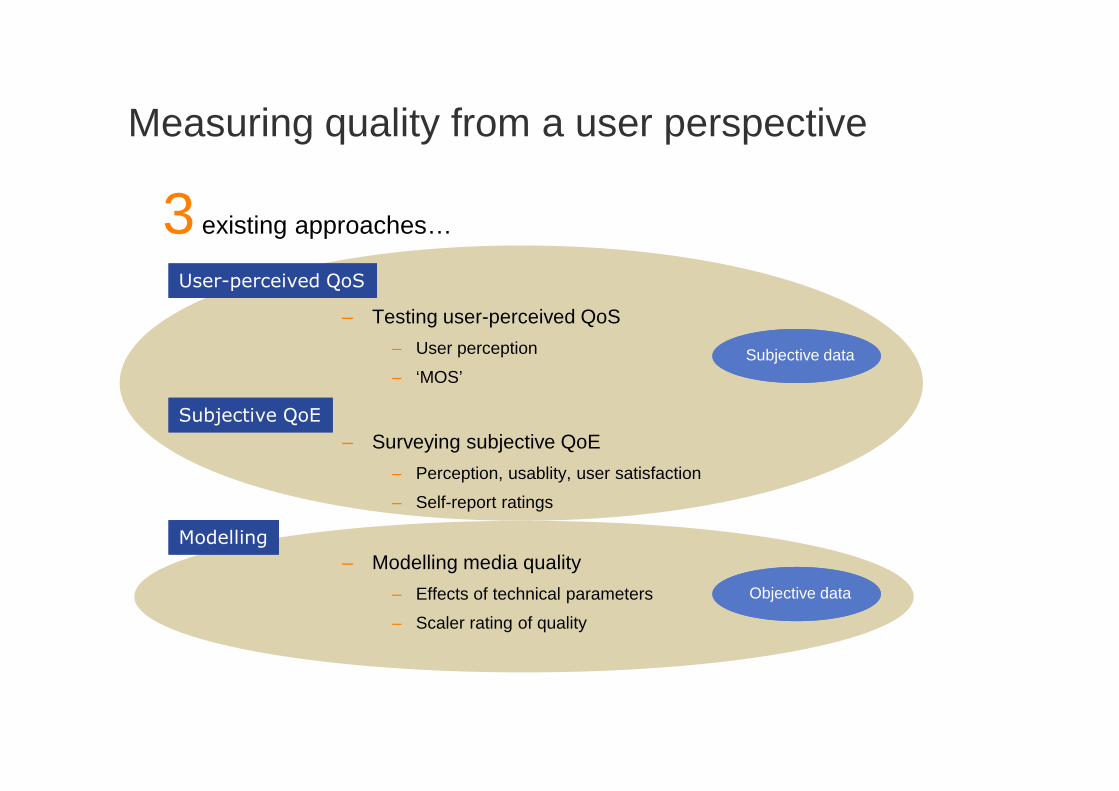
Measuring quality from a user perspective
3 existing approaches…
– Testing user-perceived QoS
– User perception
– ‘MOS’Subjective data
User-perceived QoS
– Surveying subjective QoE
– Perception, usablity, user satisfaction
– Self-report ratings
– Modelling media quality
– Effects of technical parameters
– Scaler rating of quality
Objective data
Subjective QoE
Modelling

Objective measures of QoE
• Are not dependent on test participant opinion
• Are dependent on
– Actual usageProcess of communication
User performance
– Types of
– Users
– Tasks
– Communication situations
User performance
Outcomes of communication
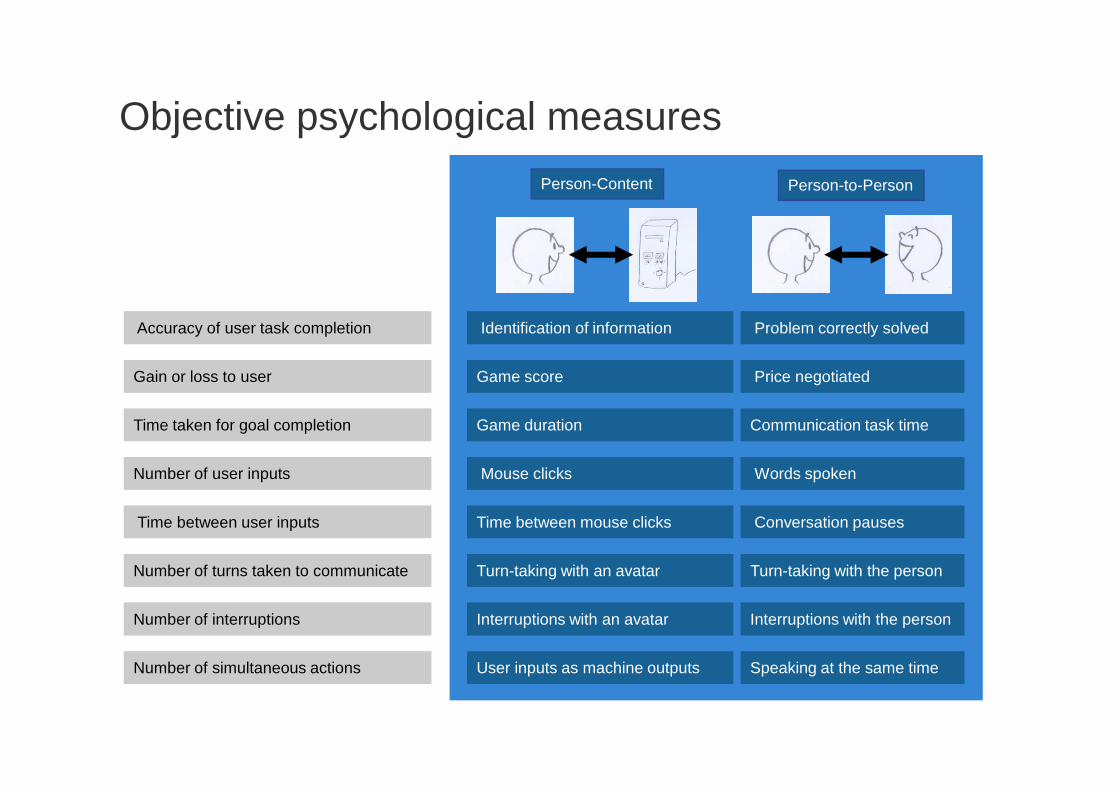
Objective psychological measures
Person-to-PersonPerson-Content
Identification of informationIdentification of informationAccuracy of user task completionAccuracy of user task completion Problem correctly solvedProblem correctly solved
Game scoreGame scoreGain or loss to userGain or loss to user Price negotiatedPrice negotiated
Game durationGame durationTime taken for goal completionTime taken for goal completion Communication task timeCommunication task time
Mouse clicksMouse clicksNumber of user inputsNumber of user inputs Words spokenWords spoken
Time between mouse clicksTime between mouse clicksTime between user inputsTime between user inputs Conversation pausesConversation pauses
Turn-taking with an avatarTurn-taking with an avatarNumber of turns taken to communicateNumber of turns taken to communicate Turn-taking with the personTurn-taking with the person
Interruptions with an avatarInterruptions with an avatarNumber of interruptionsNumber of interruptions Interruptions with the personInterruptions with the person
User inputs as machine outputsUser inputs as machine outputsNumber of simultaneous actionsNumber of simultaneous actions Speaking at the same timeSpeaking at the same time

Example effects of speech-only communication
Communication process
Turn-taking
Number of words
Interruptions
� Less turn taking than with video communication
�Less interruptions than with video communication
� Less words used than with video communicationNumber of words � Less words used than with video communication
Time
Accuracy
� Dialogues may be shorter than with video communication
� 8k mono as good as CD stereo
Communication outcome
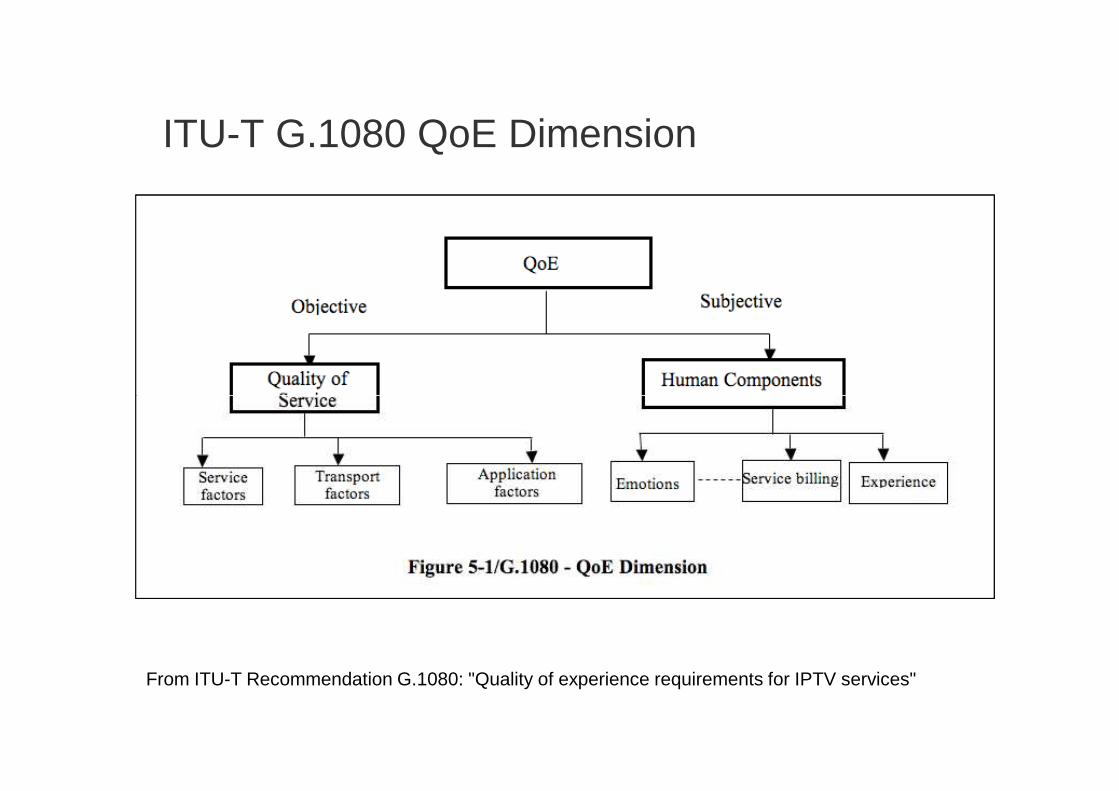
ITU-T G.1080 QoE Dimension
From ITU-T Recommendation G.1080: "Quality of experience requirements for IPTV services"

Subjective measures of QoE
• Should be dependent on actual usage
Process of communication
User opinion
Outcomes of communication
• More than perception of media quality and usability; for example…
– Social presence
– Partner perception
• Should be quantitative

Quantitative subjective measure
Excellent
Good
10Extremely high
Qualitative scales Quantitative scale
5 Excellent
4 Good
e.g., ITU-R BS.1534-1
Poor
Bad
Fair
0Extremely low
2 Poor
1 Bad
3 Fair
e.g., ITU-T P.800ITU-T P.910

Subjective psychological measures
Person-to-PersonPerson-Content
Visual accuracyVisual accuracyEffectivenessEffectiveness Goal achievementGoal achievement
Overall satisfaction with contentOverall satisfaction with contentSatisfactionSatisfaction Communication satisfactionCommunication satisfaction
Effort to watch mobile TVEffort to watch mobile TVEfficiencyEfficiency Talking effortTalking effort
Website engagementWebsite engagementEnjoymentEnjoyment Fun with a gameFun with a game
Reality of avatarReality of avatarSocial presenceSocial presence Personal contactPersonal contact
Intelligence of avatarIntelligence of avatarPartner perceptionPartner perception TrustworthinessTrustworthiness

Individual and global QoE measures
• QoE is multivariate
• What are the best ways to present QoE data?
Summary statementsSome examples
Scales
“Task effectiveness with service X is better than with service Y”
“QoE is ‘Good’ but not ‘Very good”
“Service X is unusable”
“The average QoE for service X and service Y is…”
“The QoE of service X varies across particular types of users by amount Y”
QoE0 10
-5 +5QoE
Extremely good
Very good
Poor
Extremely poor
Good
Moderate
Very poor
Very usable
Just usable
Unusable
Sufficiently usable

In conclusion…
• QoE measures with higher validity and better communicability
– Expand from user perception to user experience
– Direct measures of users
• Objective
• Quantitative subjective
• Widespread misunderstandings for the nature of user measures?
ITU-T P.10/G.100“The overall acceptability of an application or service, as perceived subjectively by the end user”×√


![[MS-QoE]: Quality of Experience Monitoring Server ProtocolMS-QoE].pdf · 2 / 175 [MS-QoE] - v20190618 Quality of Experience Monitoring Server Protocol Copyright © 2019 Microsoft](https://static.fdocuments.net/doc/165x107/5e79f473f94cc12161753c5f/ms-qoe-quality-of-experience-monitoring-server-protocol-ms-qoepdf-2-175.jpg)