
Increased Throughput in Method 8270 Analysis
3
Increased Throughput in Method 8270 Analysis by William D. Goodman and Frank DeLorenzo Method 8270 is a GC-MS method cre- ated by the U.S. EPA Office of Solid Waste for the analysis of semivolatile organics by gas chromatography-mass spectrometry. This is a common and dif- ficult method performed in nearly all commercial environmental laborato- ries in the U.S. and in many other parts of the world. Following the creation of the EPA in 1970, the U.S. commercial laboratory industry experienced rapid growth throughout the 1980’s. The 1990’s through the present have brought an unsettled period of consolidation and adjustment. This period of decreasing profit margins has magnified the impor- tance of quick and efficient production. Method 8270 specifies that mass spectrometer tuning and calibration check samples must verify the integ- rity of the system every 12 hours. These samples severely limit the pro- duction of each particular GC-MS system. Once the calibration check is completed, the instrument can run an unlimited number of samples in the next 12-hour clock. This results in the need for an analytical method with a short injection-to-injection time, maximizing the ratio of billable samples to nonbillable quality con- trol samples. The approach taken in this work was to use a standard 5% diphenyl/95% dimethyl polysiloxane column (Elite-5 MS 30 m × 0.25 mm × 0.250 μm, PerkinElmer Life and Analytical Sciences [Shelton, CT]), while reducing the nonproductive time between sample injections to increase the number of samples analyzed per hour. The novel GC oven design utilized has allowed this new approach to increase ana- lytical throughput. Experimental The GC-MS system used was the Clarus ® 600 GC-MS (PerkinElmer Life and Analytical Sciences). The GC has several options that were utilized to reduce the cycle time. The first is solvent prerinse; the auto- sampler performs all rinsing (solvent and sample) needed prior to injec- tion, while the previous run is being acquired. This permits the autosam- pler to collect the final sample ali- quot when the instrument becomes ready, injecting almost immediately. Secondly, the equilibration time for the GC oven was eliminated as a program step in favor of the opti- Table 1 GC experimental conditions GC conditions Total GC run time 15.5 min Injection-to-injection time 20.0 min Oven Rate Temp. (°C) Hold Initial — 37 1 1 27 265 0 2 6 287 0 3 30 320 2.11 Injector PSS Injector temperature Rate Temp. (°C) Hold Initial — 120 0 1 999 320 5 2 999 120 999 Column phase 0.250 μm Elite-5 MS Column length 30 m Column diameter 0.250 mm Split 50.0 mL/min Syringe 5 μL Injection volume 1 μL Instrument timed events Time (min) Value (mL/min) Split flow –0.51 0 Split flow 1.00 50 Split flow 5.00 20 Reprinted from American Laboratory January 2007
Transcript of Increased Throughput in Method 8270 Analysis
Increased Throughput in Method 8270 Analysis
by William D. Goodman and Frank DeLorenzo
Method 8270 is a GC-MS method cre-ated by the U.S. EPA Office of Solid Waste for the analysis of semivolatile organics by gas chromatography-mass spectrometry. This is a common and dif-ficult method performed in nearly all commercial environmental laborato-ries in the U.S. and in many other parts of the world. Following the creation of the EPA in 1970, the U.S. commercial laboratory industry experienced rapid growth throughout the 1980’s. The 1990’s through the present have brought an unsettled period of consolidation and adjustment. This period of decreasing profit margins has magnified the impor-tance of quick and efficient production.
Method 8270 specifies that mass spectrometer tuning and calibration check samples must verify the integ-rity of the system every 12 hours.
These samples severely limit the pro-duction of each particular GC-MS system. Once the calibration check is completed, the instrument can run an unlimited number of samples in the next 12-hour clock. This results in the need for an analytical method with a short injection-to-injection time, maximizing the ratio of billable samples to nonbillable quality con-trol samples.
The approach taken in this work was to use a standard 5% diphenyl/95% dimethyl po ly s i loxane co lumn (Elite-5 MS 30 m × 0.25 mm × 0.250 μm, PerkinElmer Life and Analytical Sciences [Shelton, CT]), while reducing the nonproductive time between sample injections to increase the number of samples analyzed per hour. The novel GC
oven design utilized has allowed this new approach to increase ana-lytical throughput.
ExperimentalThe GC-MS system used was the Clarus® 600 GC-MS (PerkinElmer Life and Analytical Sciences). The GC has several options that were utilized to reduce the cycle time. The first is solvent prerinse; the auto-sampler performs all rinsing (solvent and sample) needed prior to injec-tion, while the previous run is being acquired. This permits the autosam-pler to collect the final sample ali-quot when the instrument becomes ready, injecting almost immediately. Secondly, the equilibration time for the GC oven was eliminated as a program step in favor of the opti-
Table 1 GC experimental conditionsGC conditionsTotal GC run time 15.5 minInjection-to-injection time 20.0 minOven Rate Temp. (°C) HoldInitial — 37 11 27 265 02 6 287 03 30 320 2.11Injector PSS
Injector temperature Rate Temp. (°C) HoldInitial — 120 01 999 320 52 999 120 999Column phase 0.250 μm Elite-5 MS Column length 30 mColumn diameter 0.250 mmSplit 50.0 mL/minSyringe 5 μLInjection volume 1 μL
Instrument timed events Time (min) Value (mL/min) Split flow –0.51 0 Split flow 1.00 50 Split flow 5.00 20
Reprinted from American Laboratory January 2007
mized timing set by the Clarus 600 firmware. Lastly, the system offers SOFTCooling™, which enables pro-grammed cooling of the GC oven to reduce column bleed effects during ballistic cooling. Ballistic cooling was chosen in the interest of produc-ing the fastest injection-to-injection time possible.
A temperature-programmed injec-tion was utilized to allow for a more controlled expansion of the solvent within the injection port and better containment of the sample within the glass liner. The programmable split/splitless (PSS) injector used a 2-mm-i.d. injector port liner, packed with a thin plug of deactivated glass wool. Glass wool was used to mini-mize mass discrimination and ensure complete transfer of the heavier polycyclic aromatic hydrocarbons (PAH). Table 1 lists all of the gas chromatographic conditions used to collect these data.
Two Clarus 600 mass spectrometers were used in this study: a 600 D air-cooled oil diffusion pump and a 600 T 255-L/sec turbomolecular pump. Table 2 lists all of the mass spectrometer con-ditions used to collect these data. The ion source and transfer line of the MS were heated to prevent condensation and contamination. The photomulti-plier tube (PMT) was adjusted to the midpoint in its range; the adjustment can be modified to meet differing needs of 8270 analysis. If low-level sensitiv-ity is needed, the PMT voltage should be adjusted to a level where the high-
est concentration standard is just below the level of detector saturation. This will provide the highest signal possible for low-level standards while maintain-ing maximum linear dynamic range. If accurate estimations of components with concentrations above the calibration range are important, setting the PMT to a low level where sensitivity is just enough to measure the low stan-dard will allow high standards to remain well within a linear por-tion of its range.
The mass spectrometer was set to acquire data in full-scan mode.
This can be modified to achieve low-level detection limits. Single ion mon-itoring (SIM) and single ion monitor-ing combined with full ion scanning (SIFI) functions can be added to the MS method, but were not needed for this routine analysis.
Calibration standards were diluted in methylene chloride from the 8270 Mega-Mix (Restek, Bellefonte, PA). The curves analyzed here were from 5 to 100 ppm, with internal standards at 25 ppm.
ResultsFollowing the guidelines of Method 8 2 7 0 , e a c h 1 2 - h o u r a n a l y s i s
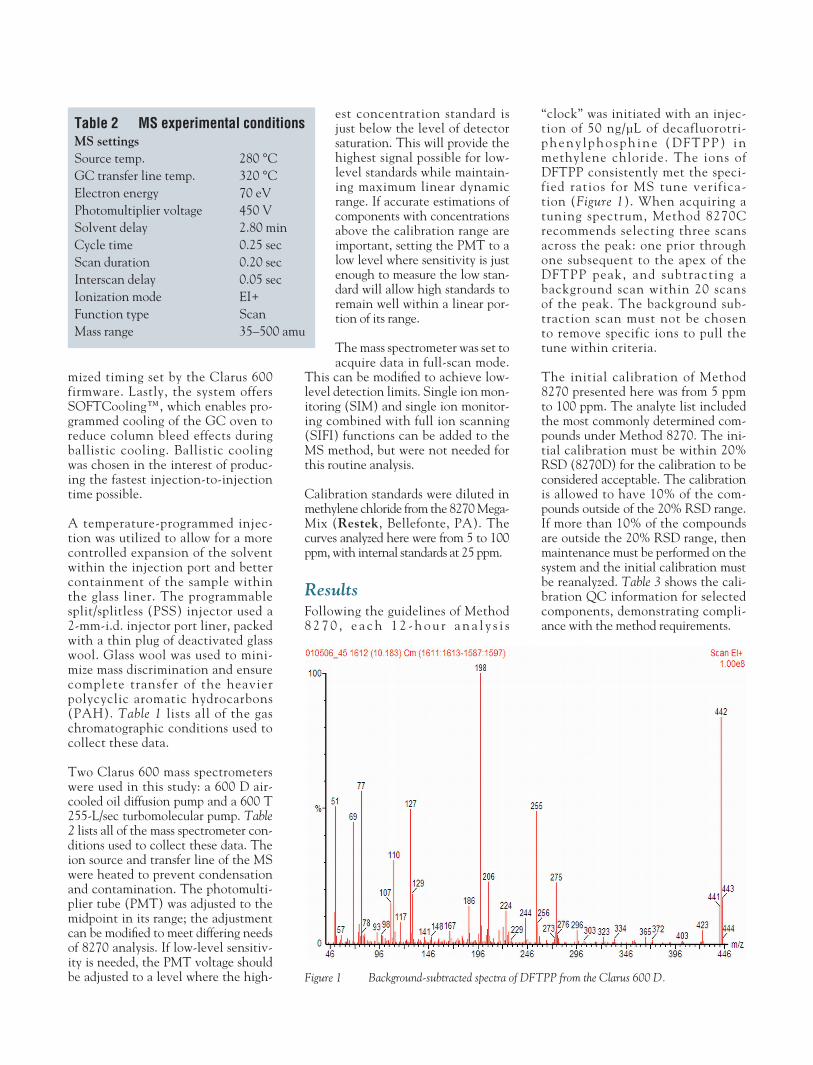
“clock” was initiated with an injec-tion of 50 ng/μL of decafluorotri-pheny lphosph ine (DFTPP) in methylene chloride. The ions of DFTPP consistently met the speci-fied ratios for MS tune verifica-tion (Figure 1). When acquiring a tuning spectrum, Method 8270C recommends selecting three scans across the peak: one prior through one subsequent to the apex of the DFTPP peak, and subtracting a background scan within 20 scans of the peak. The background sub-traction scan must not be chosen to remove specific ions to pull the tune within criteria.
The initial calibration of Method 8270 presented here was from 5 ppm to 100 ppm. The analyte list included the most commonly determined com-pounds under Method 8270. The ini-tial calibration must be within 20% RSD (8270D) for the calibration to be considered acceptable. The calibration is allowed to have 10% of the com-pounds outside of the 20% RSD range. If more than 10% of the compounds are outside the 20% RSD range, then maintenance must be performed on the system and the initial calibration must be reanalyzed. Table 3 shows the cali-bration QC information for selected components, demonstrating compli-ance with the method requirements.
Table 2 MS experimental conditionsMS settingsSource temp. 280 °CGC transfer line temp. 320 °CElectron energy 70 eVPhotomultiplier voltage 450 VSolvent delay 2.80 minCycle time 0.25 secScan duration 0.20 secInterscan delay 0.05 secIonization mode EI+Function type ScanMass range 35–500 amu
Figure 1 Background-subtracted spectra of DFTPP from the Clarus 600 D.
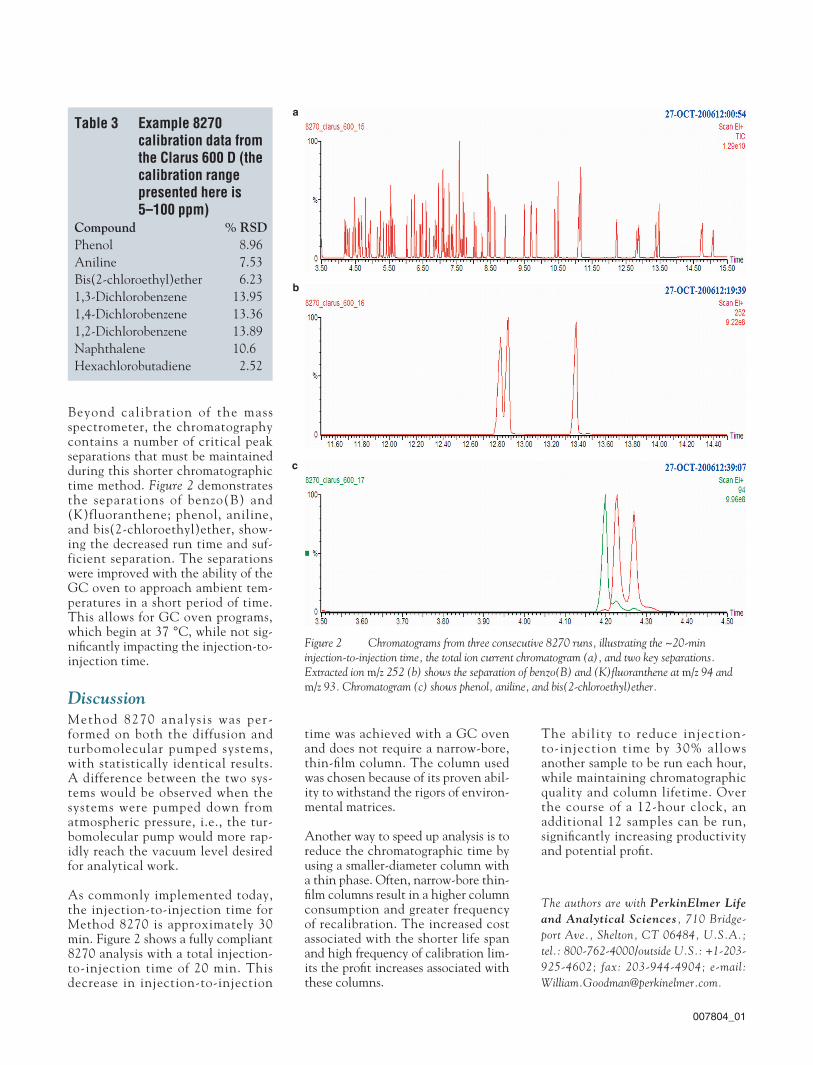
Beyond calibration of the mass spectrometer, the chromatography contains a number of critical peak separations that must be maintained during this shorter chromatographic time method. Figure 2 demonstrates the separations of benzo(B) and (K)fluoranthene; phenol, aniline, and bis(2-chloroethyl)ether, show-ing the decreased run time and suf-ficient separation. The separations were improved with the ability of the GC oven to approach ambient tem-peratures in a short period of time. This allows for GC oven programs, which begin at 37 °C, while not sig-nificantly impacting the injection-to-injection time.
DiscussionMethod 8270 analys is was per-formed on both the diffusion and turbomolecular pumped systems, with statistically identical results. A difference between the two sys-tems would be observed when the systems were pumped down from atmospheric pressure, i.e., the tur-bomolecular pump would more rap-idly reach the vacuum level desired for analytical work.
As commonly implemented today, the injection-to-injection time for Method 8270 is approximately 30 min. Figure 2 shows a fully compliant 8270 analysis with a total injection-to-injection time of 20 min. This decrease in injection-to-injection
time was achieved with a GC oven and does not require a narrow-bore, thin-film column. The column used was chosen because of its proven abil-ity to withstand the rigors of environ-mental matrices.
Another way to speed up analysis is to reduce the chromatographic time by using a smaller-diameter column with a thin phase. Often, narrow-bore thin-film columns result in a higher column consumption and greater frequency of recalibration. The increased cost associated with the shorter life span and high frequency of calibration lim-its the profit increases associated with these columns.
The ability to reduce injection-to-injection time by 30% allows another sample to be run each hour, while maintaining chromatographic quality and column lifetime. Over the course of a 12-hour clock, an additional 12 samples can be run, significantly increasing productivity and potential profit.
The authors are with PerkinElmer Life and Analytical Sciences, 710 Bridge-port Ave., Shelton, CT 06484, U.S.A.; tel.: 800-762-4000/outside U.S.: +1-203-925-4602; fax: 203-944-4904; e-mail: [email protected].
Table 3 Example 8270 calibration data from the Clarus 600 D (the calibration range presented here is 5–100 ppm)Compound % RSDPhenol 8.96Aniline 7.53Bis(2-chloroethyl)ether 6.231,3-Dichlorobenzene 13.951,4-Dichlorobenzene 13.361,2-Dichlorobenzene 13.89Naphthalene 10.6Hexachlorobutadiene 2.52
Figure 2 Chromatograms from three consecutive 8270 runs, illustrating the ~20-min injection-to-injection time, the total ion current chromatogram (a), and two key separations. Extracted ion m/z 252 (b) shows the separation of benzo(B) and (K)fluoranthene at m/z 94 and m/z 93. Chromatogram (c) shows phenol, aniline, and bis(2-chloroethyl)ether.
a
b
c
007804_01


![Methods for Increased Sample Throughput with Dirty … Liner MoC[2].pdf · Methods for Increased Sample Throughput with Dirty Samples Alan D Broske, Limian Zhao, and William H. Wilson](https://static.fdocuments.net/doc/165x107/5d51ec8388c993c9398ba709/methods-for-increased-sample-throughput-with-dirty-liner-moc2pdf-methods.jpg)


