Increased mitophagy in the skeletal muscle of spinal and ... · Increased mitophagy in the skeletal...
42
Borgia et al., Re-Resubmitted 1 Increased mitophagy in the skeletal muscle of spinal and bulbar muscular atrophy patients Doriana Borgia 1 , Adriana Malena 1 , Marco Spinazzi 2 , Maria Andrea Desbats 3 , Leonardo Salviati 3 , Aaron P. Russell 4 , Giovanni Miotto 5,6 , Laura Tosatto 7 , Elena Pegoraro 1 , Gianni Sorarù 1 , Maria Pennuto 7* , Lodovica Vergani 1* 1 Department of Neurosciences, University of Padova, Padova, Italy 2 VIB Center for the Biology of Disease, KU Leuven Center for Human Genetics, Leuven, Belgium 3 Clinical Genetics Unit, Department of Woman and Child Health, University of Padova, Padova, Italy, and IRP Città della Speranza, Padova, Italy 4 Institute for Physical Activity and Nutrition, School of Exercise and Nutrition Sciences, Deakin University, Burwood, Australia 5 Department of Molecular Medicine, University of Padova, Italy. 6 Proteomic Center of Padova University, VIMM and Padova University Hospital, Padova, Italy 7 Dulbecco Telethon Institute, Centre for Integrative Biology, University of Trento, Trento, Italy *Corresponding authors: Lodovica Vergani, PhD Centro Biomedico Pietro D’Abano-via Orus 2, 35129 Padova, Italy phone +39 049 8216162 fax +39 049 8216163 e-mail: [email protected] Maria Pennuto, PhD Dulbecco Telethon Institute Lab of Neurodegenerative Diseases, Centre for Integrative Biology (CIBIO), University of Trento, Via Sommarive 9, 38123 Trento, Italy Phone +39 0461 285215 Fax: +39 0461 283937 email: [email protected] © The Author 2017. Published by Oxford University Press. This is an Open Access article distributed under the terms of the Creative Commons Attribution License (http://creativecommons.org/licenses/by/4.0/), which permits unrestricted reuse, distribution, and reproduction in any medium, provided the original work is properly cited. HMG Advance Access published January 13, 2017 by guest on January 15, 2017 http://hmg.oxfordjournals.org/ Downloaded from
-
Upload
nguyenphuc -
Category
Documents
-
view
221 -
download
0
Transcript of Increased mitophagy in the skeletal muscle of spinal and ... · Increased mitophagy in the skeletal...
Borgia et al., Re-Resubmitted
1
Increased mitophagy in the skeletal muscle of spinal and bulbar muscular
atrophy patients
Doriana Borgia1, Adriana Malena1, Marco Spinazzi2, Maria Andrea Desbats3, Leonardo Salviati3, Aaron P. Russell4,
Giovanni Miotto5,6
, Laura Tosatto7, Elena Pegoraro
1, Gianni Sorarù
1, Maria Pennuto
7*, Lodovica Vergani
1*
1Department of Neurosciences, University of Padova, Padova, Italy
2 VIB Center for the Biology of Disease, KU Leuven Center for Human Genetics, Leuven, Belgium
3Clinical Genetics Unit, Department of Woman and Child Health, University of Padova, Padova, Italy, and IRP Città
della Speranza, Padova, Italy
4Institute for Physical Activity and Nutrition, School of Exercise and Nutrition Sciences, Deakin University, Burwood,
Australia
5 Department of Molecular Medicine, University of Padova, Italy.
6 Proteomic Center of Padova University, VIMM and Padova University Hospital, Padova, Italy
7Dulbecco Telethon Institute, Centre for Integrative Biology, University of Trento, Trento, Italy
*Corresponding authors:
Lodovica Vergani, PhD
Centro Biomedico Pietro D’Abano-via Orus 2, 35129 Padova, Italy
phone +39 049 8216162
fax +39 049 8216163
e-mail: [email protected]
Maria Pennuto, PhD
Dulbecco Telethon Institute Lab of Neurodegenerative Diseases,
Centre for Integrative Biology (CIBIO), University of Trento,
Via Sommarive 9, 38123 Trento, Italy
Phone +39 0461 285215
Fax: +39 0461 283937
email: [email protected]
© The Author 2017. Published by Oxford University Press.
This is an Open Access article distributed under the terms of the Creative Commons Attribution License (http://creativecommons.org/licenses/by/4.0/), which permits unrestricted reuse, distribution, and reproduction in any medium, provided the
original work is properly cited.
HMG Advance Access published January 13, 2017 by guest on January 15, 2017
http://hmg.oxfordjournals.org/
Dow
nloaded from
Borgia et al., Re-Resubmitted
2
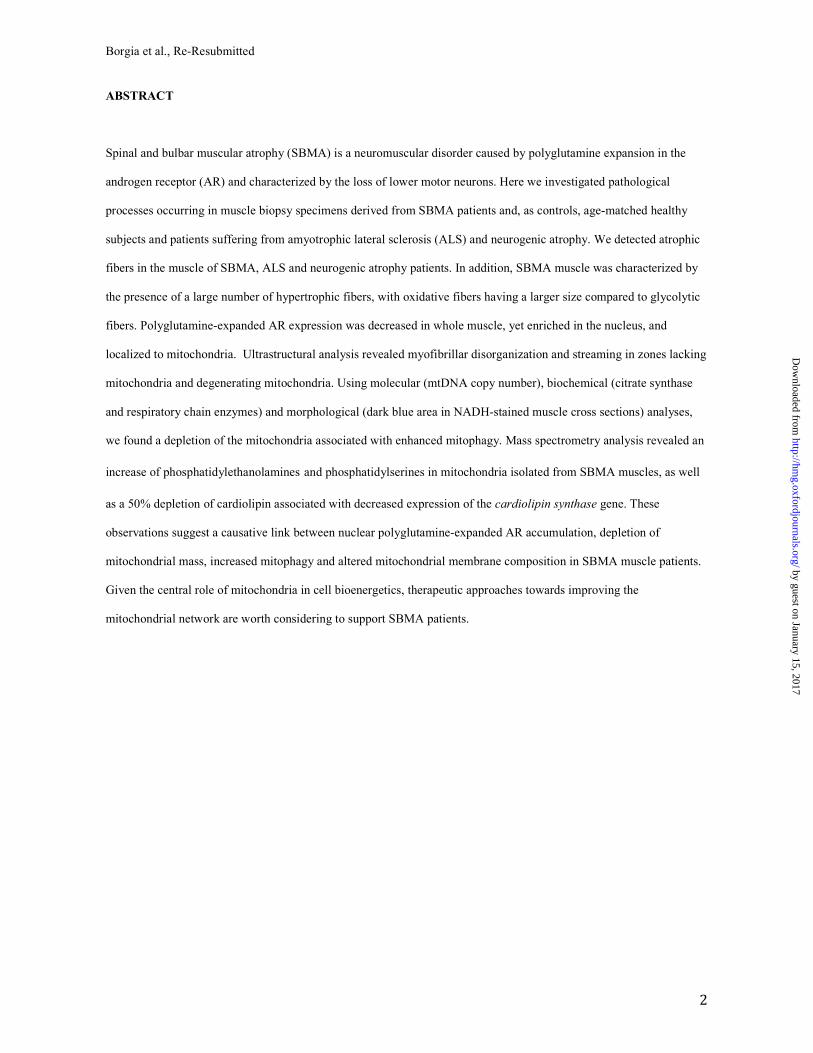
ABSTRACT
Spinal and bulbar muscular atrophy (SBMA) is a neuromuscular disorder caused by polyglutamine expansion in the
androgen receptor (AR) and characterized by the loss of lower motor neurons. Here we investigated pathological
processes occurring in muscle biopsy specimens derived from SBMA patients and, as controls, age-matched healthy
subjects and patients suffering from amyotrophic lateral sclerosis (ALS) and neurogenic atrophy. We detected atrophic
fibers in the muscle of SBMA, ALS and neurogenic atrophy patients. In addition, SBMA muscle was characterized by
the presence of a large number of hypertrophic fibers, with oxidative fibers having a larger size compared to glycolytic
fibers. Polyglutamine-expanded AR expression was decreased in whole muscle, yet enriched in the nucleus, and
localized to mitochondria. Ultrastructural analysis revealed myofibrillar disorganization and streaming in zones lacking
mitochondria and degenerating mitochondria. Using molecular (mtDNA copy number), biochemical (citrate synthase
and respiratory chain enzymes) and morphological (dark blue area in NADH-stained muscle cross sections) analyses,
we found a depletion of the mitochondria associated with enhanced mitophagy. Mass spectrometry analysis revealed an
increase of phosphatidylethanolamines and phosphatidylserines in mitochondria isolated from SBMA muscles, as well
as a 50% depletion of cardiolipin associated with decreased expression of the cardiolipin synthase gene. These
observations suggest a causative link between nuclear polyglutamine-expanded AR accumulation, depletion of
mitochondrial mass, increased mitophagy and altered mitochondrial membrane composition in SBMA muscle patients.
Given the central role of mitochondria in cell bioenergetics, therapeutic approaches towards improving the
mitochondrial network are worth considering to support SBMA patients.
by guest on January 15, 2017http://hm
g.oxfordjournals.org/D
ownloaded from
Borgia et al., Re-Resubmitted
3
Introduction
Spinal and bulbar muscular atrophy (SBMA), also named Kennedy’s disease, is a neuromuscular disorder
characterized by the late-onset and progressive loss of motor neurons from the brainstem and spinal cord, together with
skeletal muscle weakness, fasciculations, and atrophy (1). In addition to neuromuscular symptoms, SBMA patients
develop endocrine and non-neuronal symptoms (2). SBMA is linked to CAG expansions in the exon 1 of the gene
coding for the androgen receptor (AR) (3). In healthy subjects, this polyglutamine-encoding CAG trinucleotide tandem
repeat has a length of no more than 36 repeats, and expansions over 38 cause disease. SBMA belongs to the family of
polyglutamine diseases, which also includes Huntington’s disease (HD), dentatorubral-pallidoluysian atrophy
(DRPLA), and spinocerebellar ataxia (SCA) type 1, 2, 3, 6, 7, and 17 (reviewed by 4). SBMA is a sex-specific disease
with full manifestations restricted to males. The sex specificity of SBMA is due to the higher serum levels of androgens
in males compared to females (5), and is also observed in transgenic and knock-in mice expressing the polyglutamine-
expanded AR (5-8). Moreover, a strikingly androgen-dependent phenotype manifests in transgenic flies expressing the
polyglutamine-expanded AR, which develop signs of neurodegeneration only if fed a food containing androgens (9-11).
Consistent with the androgen-dependent nature of SBMA, surgical and pharmacological castration of transgenic mice
reduced disease manifestations, whereas treatment of female transgenic mice with androgens induced
neurodegeneration (6, 7, 12). Although treatment of SBMA patients with anti-androgens exerts some beneficial effects
in clinical trials (13, 14), the applicability of this approach is limited by intrinsic side-effects.
Emerging evidence supports a key role for skeletal muscle in SBMA pathogenesis (15). Expression of
polyglutamine-expanded AR in muscle is necessary and sufficient to cause disease. Indeed, the expression of
polyglutamine-expanded AR in all tissues, except for skeletal muscle, prevented disease manifestations in transgenic
mice (16). Moreover, knock-down of polyglutamine-expanded AR in peripheral tissues, including skeletal muscle,
ameliorated the phenotype of SBMA mice (17). On the other hand, overexpression of non-expanded AR solely in
muscle resulted in a phenotype reminiscent of SBMA (18). Analysis of muscle pathology in SBMA patients revealed
the presence of neurogenic atrophy, such as angulated atrophic fibers and fiber-type grouping, and signs of myopathy,
including fiber splitting, increased presence of central nuclei, and degeneration of fibers (19, 20). In addition, SBMA
muscles are characterized by the presence of hypertrophic fibers (20), a feature that is observed also in the skeletal
muscle of transgenic SBMA mice at late stage of disease (21). In SBMA knock-in mice, muscles composed of both
glycolytic and oxidative fibers, such as the quadriceps, are more severely affected then muscles mainly composed of
oxidative fibers. Muscles composed of glycolytic and oxidative fibers undergo a metabolic switch towards an oxidative
phosphorylation, a metabolic alteration that precedes denervation and is likely to result from intrinsic pathogenic
processes occurring in these muscles (22). These metabolic alterations in knock-in SBMA mice were associated with
by guest on January 15, 2017http://hm
g.oxfordjournals.org/D
ownloaded from
Borgia et al., Re-Resubmitted
4
mitochondrial abnormalities, induction of protein turnover, activation of mechanistic target of rapamycin (mTOR)
signaling, and induction of autophagy at late stages of disease. While analysis of skeletal muscle in animal models of
SBMA has been extensively reported, analysis of muscle pathology in SBMA patients is missing. Using skeletal muscle
biopsies derived from SBMA patients, we investigated pathological processes underlying muscle weakness and wasting
in SBMA patients. We found that polyglutamine-expanded AR accumulated in the nucleus and mitochondria of mature
myotubes. Moreover, SBMA muscles were characterized by a reduction in mitochondrial mass, aberrant mitochondrial
morphology, degenerating mitochondria with either a dense matrix or dilated-hypodense matrix and swelling, decreased
mtDNA and citrate synthase activity, and enhanced autophagy and mitophagy. Finally, SBMA muscle mitochondria
presented with altered mitochondrial membrane lipid composition and downregulation of cardiolipin synthase
expression.
by guest on January 15, 2017http://hm
g.oxfordjournals.org/D
ownloaded from
Borgia et al., Re-Resubmitted
5
Results
Increased atrophy and hypertrophy indexes in the quadriceps muscle of SBMA patients
To investigate in detail pathological processes occurring in the muscle of SBMA patients, we collected biopsy
specimens from the quadriceps femoris of SBMA patients with 41 to 49 CAG repeats and age- and gender-matched
control subjects (Supplementary Material, Table S1). Using hematoxylin & eosin (H&E) analysis, we detected signs
of neurogenic atrophy together with myopathic changes, such as fiber splitting and increased internal nuclei (Figs. 1A
and Supplementary Material, S1), as others and we have previously described in SBMA patients (19, 20) and mice
(21, 22). In addition, we detected several hypertrophic fibers, as previously reported (20). Here we sought to analyze in
detail both the atrophic and hypertrophic fibers present in SBMA muscle. Male muscle fiber size ranges between 40 and
80 µm, and the size of atrophic and hypertrophic fibers is < 40 µm and > 80 µm, respectively (23). We measured the
fiber atrophy and hypertrophy indexes in the muscle of SBMA patients as described in the Material and Methods
section (Fig. 1B). As controls, we compared the muscle pathology of SBMA patients with that of patients suffering
from either amyotrophic lateral sclerosis (ALS) or other neurogenic diseases. We found that the atrophy index was
significantly (p < 0.001) increased by > 6-fold in the muscle of SBMA, ALS, and neurogenic patients compared to
control subjects. On the other hand, the hypertrophy index was significantly (p < 0.001) increased by 29-fold in SBMA
patients, whereas it was slightly and not significantly increased by < 3-fold in both ALS and neurogenic patients,
indicating that a high hypertrophy index is a feature of the muscle pathology of SBMA patients. Glycolytic fibers are
more severely affected than oxidative fibers in muscles composed of mixed fibers, such as quadriceps, in knock-in
SBMA mice (22). Using NADH staining, we measured the hypertrophy index of oxidative and glycolytic fibers in the
quadriceps muscle of SBMA patients and control subjects (Fig. 1C-D and Supplementary Material, S2). The
hypertrophy index of glycolytic and oxidative fibers was increased by 22-fold and 57-fold, respectively, indicating that
hypertrophy of the oxidative fibers exceeds that of glycolytic fibers in the muscles of SBMA patients. These results
indicate that the presence of hypertrophic fibers is a key feature of SBMA muscle, with oxidative fibers having a higher
hypertrophy index compared to glycolytic fibers.
Aberrant accumulation of polyglutamine-expanded AR in the nucleus and mitochondria of SBMA muscle
Next, we analyzed AR expression levels in the muscle of SBMA patients and control subjects (Fig. 2A-B). AR
levels were significantly reduced by 65% in the quadriceps muscle of SBMA patients, despite no significant changes in
the AR transcript levels (Fig. 2C). We have previously shown that polyglutamine-expanded AR is enriched in the
nucleus of cultured myotubes derived from the muscle of SBMA patients (24), and it localizes to mitochondria (25).
Therefore, we analyzed the accumulation of AR in the cytosolic, nuclear and mitochondrial fractions of SBMA muscle
by guest on January 15, 2017http://hm
g.oxfordjournals.org/D
ownloaded from
Borgia et al., Re-Resubmitted
6
tissues and age-matched control samples. As positive control, we verified the enrichment of the nuclear marker, poly
(ADP-ribose) polymerase (PARP), in the nuclear fraction (Supplementary Material, Fig. S3). To assess
mitochondrial fraction purity we verified that our mitochondrial fraction did not contain β-Tubulin and was
enriched with the mitochondrial import receptor subunit TOM20 (Supplementary Material, Fig. S4).
Importantly, accumulation of polyglutamine-expanded AR was decreased by 66% in the cytosolic fraction and
increased by 2-fold in the nuclear fraction compared to normal AR (Fig. 2A-B). Moreover, AR signal localized to
mitochondria was decreased by 52% in SBMA muscles compared to control muscles. These results indicate that
accumulation of total polyglutamine-expanded AR is decreased in the cytosol and mitochondria, but enriched in the
nucleus in the muscle of SBMA patients.
Reduced number and altered morphology of mitochondria in the muscles of SBMA patients
To investigate whether mitochondrial morphology and localization was altered in the muscle of SBMA
patients, we performed transmission electron microscopy (TEM) on quadriceps femoris. Ultrastructural examination of
muscle tissues from control individuals (Fig. 3A) and SBMA patients (Fig. 3B-F) revealed myofibrillar disorganization
and streaming in zones lacking mitochondria (Fig. 3B) and degenerating mitochondria with either a dense matrix (Fig.
3C-D) or dilated-hypodense matrix (Fig. 3E) and swelling (Fig. 3F). Next, we assessed mitochondrial abundance by
molecular, biochemical and morphological analyses on SBMA and control muscles. Using real-time PCR, we found
that mitochondrial DNA (mtDNA) copy number was significantly reduced by 40% in the muscle of SBMA patients
compared to control subjects (Fig. 4A). Using NADH staining, we noticed the presence of moth-eaten fibers with
oxidative enzyme activity progressively reduced from the periphery to the centre of the fibers, suggesting alterations in
the mitochondrial distribution and activity in SBMA oxidative fibers (Fig. 1C, 4B-C and Supplementary Material,
S2). Mitochondrial mass was also assessed by measuring the percentage of dark blue (NADH-positive) area for field
using ImageJ software (see Materials and Methods). This analysis demonstrated a 48% reduction in mitochondrial
amount in SBMA muscle compared to controls (Fig. 4B-C). The activity of the mitochondrial matrix enzyme, citrate
synthase (CS), was decreased by 35% in SBMA muscle (Fig. 4D). The enzymatic activity of respiratory chain
complexes (OXPHOS) II, III, and IV was also significantly decreased by 24-40% in SBMA muscle (Fig. 4E).
However, OXPHOS rates normalized to CS (Supplementary Material, Fig. S5A), and supercomplex expression and
assembly (Supplementary Material, Fig. S5B) were normal in SBMA muscle. Altogether, these ultrastructural and
biochemical analyses revealed altered mitochondrial distribution and reduced mitochondrial mass in SBMA muscle.
We then asked whether the reduction of mitochondrial amount in SBMA muscle was associated with altered
expression of genes involved in mitochondrial biogenesis and function, such as peroxisome proliferator-activated
by guest on January 15, 2017http://hm
g.oxfordjournals.org/D
ownloaded from
Borgia et al., Re-Resubmitted
7
receptor γ coactivator 1 alpha (PGC1α, PPARGC1α) and PGC-1β (PPARGC1β), which control muscle metabolism and
mitochondrial biogenesis, mitochondrial transcription factor A (TFAM), which regulates mitochondrial gene
transcription and mitochondrial genome replication, estrogen-related receptor α (ERRα), which regulates the expression
of nuclear genes involved in mitochondrial homeostasis and biogenesis, nuclear respiratory factor 1 (NRF1), a
transcription factor that induces the expression of metabolic nuclear genes required for mitochondrial respiration, DNA
transcription and replication and that has recently been linked to SBMA pathogenesis (26), cytochrome C oxidase
subunit 4 (COX4), Mn superoxide dismutase (MnSOD), a mitochondrial enzyme that protects mitochondria from
oxidative damage, and mitofusin 1 and 2 (MFN1 and 2), which are involved in mitochondrial fusion (Supplementary
Material, Fig. S6). In SBMA muscles all these genes were expressed similarly to control muscles. These data
indicated that polyglutamine-expanded AR alters mitochondrial homeostasis without affecting the expression of genes
related to mitochondrial biogenesis and function in skeletal muscle.
Increased autophagy and mitophagy in the muscle of SBMA patients
Reduction in the number of mitochondria can result from increased degradation, a process known as
mitophagy, which normally occurs in cells to dispose damaged or superfluous mitochondria through selective
autophagy (27-29). Mitophagy is a two-step process characterized by the induction of general autophagy followed by
priming of the damaged mitochondria for mitophagic recognition and elimination (30). To determine whether
mitophagy is induced in SBMA muscle, we first asked whether autophagy is enhanced in the muscle of SBMA patients.
Ultrastructural examination of muscle tissues revealed the presence of autophagic vacuoles in SBMA muscle (Fig. 5A).
Next, we analyzed the expression of autophagy markers, including the lipidated form of microtubule-associated protein
1A/1B-light chain 3 (LC3) II, which accumulates upon autophagosome formation, sequestosome 1 (SQSTM1, p62),
which accumulates upon inhibition of autophagy flux, and Beclin-1 and lysosomal-associated membrane protein
1 (LAMP-1), which have previously been shown to be upregulated in the muscle of SBMA knock-in mice (22, 31, 32).
We found that the expression levels of LC3II, Beclin-1, and LAMP1, but not p62, were significantly increased in the
muscle of SBMA patients, indicating enhanced autophagy (Fig. 5B). To further corroborate the autophagic changes
observed in SBMA muscle, we performed immunohistochemical analysis via confocal microscopy in muscle
cryosections using an antibody against LC3 to mark autophagosomes. The LC3-positive puncta were quantified and
expressed as puncta/myofiber (Fig. 5C). The accumulation of autophagic puncta was increased by 3-fold in SBMA
muscles compared to control specimens. Notably, the LC3-positive puncta localized to the center of the fiber, which
corresponds to the area with decreased NADH staining (Fig. 4C and Supplementary Material, S2). These
observations indicate that autophagy is induced in the muscle of SBMA patients.
by guest on January 15, 2017http://hm
g.oxfordjournals.org/D
ownloaded from
Borgia et al., Re-Resubmitted
8
Next, we assessed whether mitophagy is enhanced in the muscle of SBMA patients. To address this question,
we isolated the mitochondrial fraction from SBMA and control muscles. We then analyzed the mitochondrial
enrichment of proteins that prime damaged mitochondria and allow the recruitment of the autophagosome for
mitophagy, such as BCL2/Adenovirus E1B 19kDa Interacting Protein 3 (BNIP3), PTEN-induced putative kinase 1
(PINK1), and the E3 ubiquitin-protein ligase parkin (PARK2) (29, 33, 34). BNIP3 and PINK1, but not PARK2, were
increased by 3- and 4-fold, respectively, in isolated SBMA muscle mitochondria compared to controls (Fig. 6A). To
test whether other E3 ubiquin ligases involved in mitophagy, such as MUL1 (35) and Gp78 (36), are induced in SBMA
muscle, we measured the trascript levels of these factors by real-time PCR (Supplementary Material, Fig. S7).
However, we did not find any increase in the expression of these genes in SBMA muscles compared to control
specimens. Mitochondria degraded through mitophagy are polyubiquitinated (37). The amount of ubiquitinated proteins
was augmented in the mitochondria isolated from SBMA muscles (Fig. 6B). By confocal microscopy analysis of
quadriceps muscle cryosections, we found that the LC3-positive puncta colocalized with ATPase-positive-
mitochondria, and double-positive vesicles were increased by 4.5-fold in SBMA muscle (Fig. 7A-B). Interestingly, we
noticed that some SBMA muscle fibers had central regions rich in autophagic vacuoles (LC3-positive), but devoid of
mitochondria, suggesting a mitophagic process that leads to removal of mitochondria. These areas overlapped with the
NADH-negative central area of oxidative fibers (Fig. 4C and Supplementary Material, Fig. S2) and the myofibrillar
disorganization and streaming in zones lacking mitochondria observed by TEM (Fig. 3B). Selective mitophagy is also
controlled by mitochondrial dynamics (37). Mitochondrial fission facilitates mitophagy and is operated by specific
mitochondria-associated proteins, such as dynamin-related protein 1 (Drp1) and mitochondrial fission 1 protein (hFis1)
(27, 38). Both Drp1 and hFis1 were significantly increased by 1.6-fold and 1.7-fold, respectively, in SBMA
mitochondria, suggesting augmented fission events, in line with increased mitophagy (Fig. 7C). Taken together, these
observations show that mitophagy is induced in the muscle of SBMA patients.
Lipid composition of mitochondria is altered in the muscle of SBMA patients
Mitophagy can result from defects in membrane lipid biosynthetic pathways (39). We have recently shown that
muscles, such as quadriceps, are characterized by major lipid alterations in SBMA knock-in mice (22). To determine
whether the lipid composition of mitochondria in the muscle of SBMA patients is altered, we performed untargeted
lipidomic analysis by mass spectrometry on mitochondria isolated from the quadriceps muscles of SBMA patients and
control subjects (Fig. 8A). In SBMA mitochondria, the peculiar structural phospholipid of the inner mitochondrial
membrane, cardiolipin (CL), was decreased by 52%, whereas the levels of phosphatidylethanolamine (PE) and PE-
precursor-phosphatidylserine (PS) were increased by 1.5-fold and 2-fold, respectively, compared to control muscles. To
by guest on January 15, 2017http://hm
g.oxfordjournals.org/D
ownloaded from

Borgia et al., Re-Resubmitted
9
function optimally, immature CL must have its fatty acids remodeled into a mature form (40). We found that 97% of
total CL species are represented by molecules having acyl moieties combinations between 3(C18:2)/1(C18:3) and
1(C18:2)/3(C18:1), including tetralinoleoyl cardiolipin (4(C18:2)) which alone accounts for 50% of the total CL (Fig.
8B). In mammals, tetralinoleoyl CL is the most abundant molecular species of CL in highly oxidative tissues, such as
skeletal muscle (41). In SBMA muscle mitochondria the ratio between the single CL molecular species to total CL was
similar to control, indicating a homogeneous reduction of all the CL molecular species. These data suggested defects in
synthesis rather than processing of CL to the mature forms. CL is synthesized by cardiolipin synthase (CRLS1), a key
enzyme involved in the de novo biosynthesis of immature CL (40). We hypothesized that the decreased synthesis in
cardiolipin was due to reduced expression of CRLS1. By real-time PCR, we found that the transcript levels of CRLS1
were decreased by 51% in SBMA muscles compared to control muscles (Fig. 8C). In conclusion, these observations
show major morphological and biochemical mitochondrial alterations in the muscle of SBMA patients associated with
reduced CL synthesis. Because CL plays a critical role in mitochondrial homeostasis (Fig. 9), our results suggest a
causative link between alterations in CL levels, mitochondrial dysfunction and muscle atrophy in SBMA.
by guest on January 15, 2017http://hm
g.oxfordjournals.org/D
ownloaded from
Borgia et al., Re-Resubmitted
10
Discussion
Analysis of muscle biopsy specimens revealed that SBMA patients have both neurogenic atrophy and
myopathic changes, as previously reported (2, 19, 20). In addition, SBMA muscle was characterized by the presence of
hypertrophic fibers, which are not often detected in the muscle of patients suffering from ALS and denervative diseases,
indicating that the presence of a large number of hypertrophic fibers is a feature of SBMA skeletal muscle pathology.
Hypertrophic fibers can be detected also at late stage of disease in mice overexpressing polyglutamine-expanded AR
(21). On the other hand, such hypertrophic fibers are absent in the muscles of knock-in SBMA mice (22). Interestingly,
the size of oxidative hypertrophic fibers was bigger than that of glycolytic fibers, indicating that the hypertrophy of the
oxidative fibers exceeds that of glycolytic fibers. We have previously shown that in SBMA patients and knock-in mice
muscles composed of both glycolytic and oxidative fibers undergo a metabolic switch towards oxidative
phosphorylation (22). Moreover, glycolytic fibers were more severely affected than oxidative fibers, and this was
associated with impaired glycolysis (22). It is possible that glycolytic fibers are particularly sensitive in SBMA, and that
a compensatory mechanism leads to hypertrophy of oxidative fibers.
Expression of polyglutamine-expanded AR in muscle is key to neurodegeneration (16, 17, 21). Here, we
analyzed for the first time polyglutamine-expanded AR accumulation and subcellular localization in the intact muscle
of SBMA patients. We found a significant reduction of polyglutamine-expanded AR in total lysates of SBMA muscles
compared to control muscles. This reduction in mutant AR accumulation was not associated with reduced AR gene
transcription, suggesting additional mechanisms responsible for reduced AR accumulation, such as increased
degradation. Polyglutamine-expanded AR is mainly degraded by the ubiquitin proteasome system (UPS) and
autophagic processes (11, 42-46). Basal autophagy is increased in animal models of SBMA (22, 31, 32), and in the
muscle of SBMA patients, as shown here. These data suggest that activation of the autophagic/lysosomal pathway may
result in increased AR turnover and could be a tissue-specific protective strategy to cope with the expression of mutant
AR. Despite the levels of total AR being decreased in SBMA muscle, its accumulation in the nuclear fraction was
increased compared to control specimens. Nuclear localization of polyglutamine-expanded proteins plays a critical role
in the neurodegenerative process. Huntingtin predominantly localizes to the cytosol, but it translocates to the nucleus
upon polyglutamine expansion (47). Moreover, deposition of polyglutamine-expanded proteins in forms of nuclear
inclusions has been observed in SBMA, as well as HD, DRPLA, and several types of SCAs (48). Importantly, nuclear
localization of proteins linked to polyglutamine diseases is a prerequisite to toxicity (10, 42, 49-51). Consistent with
these observations, accumulation of polyglutamine-expanded AR was increased in the nucleus of differentiated SBMA
myotubes, but not in proliferating SBMA myoblasts, suggesting that the process of muscle differentiation is associated
by guest on January 15, 2017http://hm
g.oxfordjournals.org/D
ownloaded from
Borgia et al., Re-Resubmitted
11
with an abnormal nuclear accumulation of the disease protein (24). AR nuclear translocation occurs upon androgen
binding and is mediated by importin-α and β, which move the cargo import complex through the nuclear pore complex
into the nucleus (52). Abnormalities in the nuclear pore complex have recently been described in ALS (53, 54), and
these defects may contribute to the abnormal subcellular localization of specific proteins linked to motor neuron
diseases, such as fused in sarcoma (FUS), TAR DNA-binding protein 43 (TDP-43), and AR. Further analysis is
required to address why polyglutamine-expanded AR accumulates in the nucleus, whether it results from increased
transport to or reduced export from the nucleus, and whether the nuclear pore complex is dysfunctional in SBMA
muscle. Another important aspect consequent to the aberrant nuclear accumulation of polyglutamine-expanded AR is
that nuclear AR works as a transcription factor activated by androgens. Several genes regulated by AR and whose
expression is altered in SBMA muscle code for mitochondrial proteins (22, 55), raising the possibility that an increased
accumulation of mutant AR in the nucleus may cause mitochondrial abnormalities by altering the expression of nuclear
genes encoding mitochondrial proteins.
Expression of polyglutamine-expanded AR alters mitochondrial homeostasis (reviewed by 56). Mitochondrial
abnormalities, including reduced number, mass, and membrane potential, were previously reported in cell and animal
models of SBMA (22, 25). However, a detailed characterization of mitochondria in intact muscle tissues derived from
SBMA patients was still missing. Here, we describe for the first time mitochondrial abnormalities detected in muscle
biopsy specimens derived from SBMA patients. We found reduced number and altered morphology and distribution of
mitochondria in SBMA muscle. Polyglutamine-expanded AR may alter mitochondrial homeostasis through an indirect
effect, by modifying the expression of nuclear genes encoding mitochondrial proteins, such as genes involved in
glycolysis (22, 55). On the other hand, polyglutamine-expanded AR may alter mitochondrial homeostasis and function
through a direct effect. Indeed, polyglutamine-expanded AR has been detected in the mitochondrial fraction in motor
neuron-derived cells (25), myoblast cells (57), and quadriceps muscle of SBMA patients, as reported here. Interestingly,
normal and polyglutamine-expanded AR have been shown to interact with COXVb (58). Polyglutamine-expanded AR
may affect mtDNA. Multiple mtDNA deletions were detected in a SBMA patient (59), and mtDNA was reported to be
decreased in leucocytes derived from SBMA patients, which negatively correlated with the length of the AR pathogenic
polyglutamine tract (60). However, mtDNA was also decreased in female carriers, which are usually non-symptomatic.
Here, we report for the first time that mtDNA is decreased in the muscle of SBMA patients. Possibly, this decrease
reflects the reduction in the number of mitochondria observed in the muscle of SBMA patients, which is consistent with
previous observations in cell models of SBMA (25).
Emerging evidence indicates that autophagy is aberrant in SBMA with tissue-specific changes in autophagy
flux and activation. Autophagy flux is blocked in the motor neurons of mice overexpressing polyglutamine-expanded
by guest on January 15, 2017http://hm
g.oxfordjournals.org/D
ownloaded from
Borgia et al., Re-Resubmitted
12
AR (61). On the other hand, autophagy is induced specifically in the muscle of SBMA knock-in and transgenic mice
(22, 32, 61), and SBMA patients, as shown here. The observations that reduced autophagic activity by either Beclin-1
haploinsufficiency or a high-fat diet in SBMA knock-in mice increased skeletal muscle fiber size and significantly
extended lifespan suggest that excessive autophagy activation in SBMA muscle is detrimental (22, 46). Extending these
findings, we describe for the first time to our knowledge that a selective type of autophagy, namely mitophagy, is
induced in SBMA muscle. Mitophagy specifically removes mitochondria, a process that occurs even under nutrient-rich
conditions and that is mechanistically distinct from basal autophagy (29, 38). Mitophagy leads to clearance of damaged
mitochondria. In this model, fission events produce two functionally distinct mitochondria, one with high mitochondrial
membrane potential (∆Ψm), and the other with reduced ∆Ψm. The depolarized mitochondria are eliminated by
mitophagy (62). The overall process is also controlled by mitochondrial dynamics, as it is associated with mitochondrial
fragmentation (63). Consistent with this notion, we found augmented expression of fission proteins, such as Drp1 and
hFis1, in mitochondria isolated from SBMA muscle, indicating increased mitochondrial fragmentation, a mechanism to
segregate dysfunctional or damaged components of the mitochondrial network. Mitophagy is mainly mediated by two
pathways, the PINK1/PARK2 and BNIP3/NIX systems (64). In the PINK1-PARK2 pathway mitophagy is usually
triggered by an accumulation of PINK1 on the outer mitochondrial membrane (OMM) of dysfunctional mitochondria,
where it phosphorylates and activates the E3 ubiquitin ligase PARK2 (37, 38). PARK2 then ubiquitinates mitochondrial
proteins of the OMM, leading to recruitment of autophagy receptors, such as p62, which recognize the ubiquitinated
mitochondria and recruit them to the autophagosome by binding to the lipidated form of LC3. Recently, an alternative
pathway for PINK1-mediated mitophagy has been described, which is independent of p62. PINK1 has been shown to
directly recruit the autophagy receptors, NDP52 and optineurin, to induce mitophagy in a process that is amplified by
PARK2 (65). We found increased association of PINK1 with enhanced ubiquitination of mitochondria isolated from
SBMA muscles, indicating that mitophagy is activated in the muscle of SBMA patients. However, we did not observe
enhanced recruitment of PARK2 to SBMA mitochondria. Other E3 ubiquitin ligases may regulate mitophagy in SBMA
muscle. MUL1 (35) and Gp78 (36) have been described as distinct cellular E3 ubiquitin ligases that eliminate damaged
mitochondria, acting in parallel to the PINK1-PARK2 pathway. Although the expression of MUL1 and Gp78 did not
change in SBMA muscles compared to control specimens, it is possible that these E3 ubiquin ligases play a role in
mitophagy in SBMA muscle. Alternatively, PINK1 can exert functions on SBMA mitochondria other than mediating
mitophagy. Further studies are required to clarify the mechanism leading to PINK1 enrichment on SBMA mitochondria
and to establish which E3 ubiquitin ligases are responsible for increased mitophagy in SBMA muscle. The BNIP3/NIX
system works by directly binding LC3 and docking the nascent autophagosome to the mitochondria with enriched
BNIP3 or NIX (64). In muscle, mitochondrial priming is mediated prevalently by the mitophagic protein BNIP3, and to
by guest on January 15, 2017http://hm
g.oxfordjournals.org/D
ownloaded from
Borgia et al., Re-Resubmitted
13
a minor extent by the PINK1-PARK2 signaling pathway (66). Additionally, BNIP3 recruitment, mediated by forkhead
box O transcription factors (FOXO), is sufficient to induce mitophagy (67, 68). As observed in the present study,
SBMA muscle mitochondria had 3-fold-increase in the levels of BNIP3, supporting a role for this mitophagy pathway
in SBMA muscle.
Here, we show that autophagy and mitophagy are activated in SBMA muscle, supporting the idea that
mitochondrial dysfunction and mitophagy activation are key processes occurring in the muscle of SBMA patients.
Mitophagy has been involved in several neurodegenerative diseases, such as Parkinson’s disease and Alzheimer’s
disease. Moreover, mitophagy has recently been shown to occur in neuroblastoma cells expressing ALS-linked mutant
TDP-43 (69). Pathological conditions associated with the loss of muscle mass and force are often characterized by
alterations in the mitochondrial network, function and mitophagy (37). Optineurin and valosin-containing protein
(VCP) are necessary for mitochondrial clearance in response to depolarization, a function that is disrupted by mutations
that cause ALS and multisystem proteinopathy (70, 71). Mitochondrial dysfunction and autophagy defects are detected
in diseases with a primary muscle component, such as Ullrich Congenital Muscular Dystrophy (UCMD), Bethlem
Myopathy (BM), and Congenital Myosclerosis, which are caused by mutations in the genes encoding the extracellular
matrix protein collagen VI (72). Congenital muscular dystrophy with mitochondrial structural abnormalities (CMDmt)
is caused by loss of function mutations in the gene coding for choline kinase β, a key enzyme in the de novo synthesis
of phosphatidylcholine (PC).This is characterized by the presence of enlarged mitochondria that localize at the
periphery of muscle fibers, with central areas devoid of mitochondria (39, 73). Muscles of either CMDmt patients, or
mice carrying loss of function mutations of choline kinase β, show decreased levels of PC, increased ROS production,
decreased complex III activity, increased mitochondrial polyubiquitination and association of PINK1/Parkin, p62, LC3,
and decreased mtDNA, suggesting increased mitophagy. Importantly, several of these abnormalities were also present
in SBMA muscle. Therefore, maintenance of a functional mitochondrial network is particularly important for skeletal
muscle, a post-mitotic tissue that cannot dilute damaged or dysfunctional mitochondria through cellular division, but
that is yet able to activate the mitochondria quality control pathway. In physiological conditions, muscle has a highly
interconnected mitochondrial network and the entire mitochondrial compartment works as a single dynamic unit to
maximize ATP synthesis, which is necessary to support the high ATP demand during contraction (74). Indeed, a highly
fused mitochondrial network is important for proper mitochondrial calcium buffering and for the optimal production of
ATP, with a higher cristae density and an ideal organization of electron transfer chain components in supercomplexes
(75, 76). Mitochondrial fusion is advantageous under conditions of high energy demand and optimizes mitochondrial
function in stress conditions, as frequently occurs in skeletal muscle (76). Under stress conditions, such as upon
expression of polyglutamine-expanded AR, dysfunctional mitochondria are separated from the mitochondrial network
by guest on January 15, 2017http://hm
g.oxfordjournals.org/D
ownloaded from
Borgia et al., Re-Resubmitted
14
and removed via mitophagy, and the occurrence of normal mitochondrial biogenesis may not be sufficient to
compensate for this increase in mitochondrial disposal. The question remains as to whether mitophagy is an adaptive
process to remove dysfunctional mitochondria and reduce muscle damage, or maladaptive, leading to excessive
mitochondrial clearance and unbalanced bioenergetics.
The muscle phenotype of SBMA and CMDmt patients suggests that alterations of the biosynthetic pathways of
phospholipids in mitochondria are critical for mitochondrial and skeletal muscle homeostasis and may lead to
mitophagy. Mitochondrial membranes have a very well defined lipid composition, with a high content of phospholipids
and a low content of sterols and sphingolipids. Most of the mitochondrial lipids are synthesized in the endoplasmic
reticulum and then transported to the mitochondria, where they are redistributed between the outer and inner
mitochondrial membranes. An exception is represented by the diglycerophospholipid CL, which is synthesized in
mitochondria from endoplasmic reticulum-derived phosphatidic acid, and is then enriched in the inner mitochondrial
membrane (IMM) (77). Among phospholipids CL has a peculiar and unique structure composed of two phosphatidyl
residues linked by a glycerol moiety (78). CL is involved in numerous distinct mitochondrial activities, it plays
important roles in mitochondrial functions, and maintenance of normal CL levels is key to mitochondrial function and
stability (Fig. 9). CL controls mitochondrial cristae architecture and the stabilization of physical properties of
mitochondrial membranes, and it regulates the stability and function of mitochondrial proteins, including the electron
transport chain complexes (79, 80). CL binds to and optimizes the activity of complexes III, IV, and V, and it regulates
mitochondrial dynamics, protein import and apoptosis. Loss of CL decreases the stability and function of complexes III
and IV (81), and it results in mitochondrial depolarization and altered mitochondrial function (82). CL also participates
in the structural organization and stabilization of the respiratory chain complexes into supercomplexes (83-85).
Moreover, redistribution of CL to the OMM has been shown to serve as a signal for mitophagy (86). Cytochrome c-
catalyzed peroxidation of CL and its externalization occurs during apoptosis initiation (80). There after, CL translocates
to the outer leaflet of the OMM, where it interacts with and activates several apoptotic proteins (87). In SBMA muscle,
we found decreased levels of all the different CL species. The decrease in CL levels were coupled with increased levels
of PE and PS. PE has previously been shown to compensate for some defects concerning mitochondrial morphology
due to the loss of CL in yeast (88). However, CL and PE have distinct effects on the stability and assembly of
respiratory complexes, and therefore the increase in PE levels may not be sufficient to compensate for the loss of CL in
SBMA muscle (89). Moreover, alterations in CL abundance are associated with pathological states, including aging
(90) and diabetes (91). SBMA is an age-related disease often associated with diabetes. Our observations link altered
mitochondrial lipid metabolism, perturbation of CL levels, and mitochondrial dysfunction to skeletal muscle atrophy in
by guest on January 15, 2017http://hm
g.oxfordjournals.org/D
ownloaded from
Borgia et al., Re-Resubmitted
15
SBMA. Further investigation is needed to establish whether there is a causative link between muscle hypertrophy,
mitochondrial abnormalities, mitophagy, and CL loss in SBMA muscle.
In eukaryotic mitochondria, CL is synthesized by CRLS1, a key enzyme involved in the biosynthesis of
immature CL. It catalyzes the irreversible condensation reaction in which the phosphatidyl group of cytidine
diphosphate diacylglycerol (CDP-DAG) is linked to phosphatidylglycerol (PG) (77). After biosynthesis, immature CL
undergoes deacylation and remodeling, to generate the different molecular species with diverse fatty acid composition.
In SBMA muscle, CRLS1 expression was decreased by 52%, which may explain why CL is reduced. CRLS1 is
regulated by androgens (92, 93), raising the possibility that AR directly regulates its expression. In models of chronic
denervation, CL levels are decreased in muscle (94, 95) in association with an upregulation of both biosynthesis
enzymes CRLS1 and CTP:PA-cytidylyltransferase-1 (95). This compensatory response during chronic muscle
denervation differs from our results of CRLS1 downregulation in SBMA muscle. It is possible that, in addition to the
effect of denervation, the underlying mechanisms of CL reduction in SBMA muscle may be caused by altered androgen
signaling and AR function. The unbalanced phospholipid membrane composition of SBMA mitochondria may induce
increased fragility, and it may lower the stress threshold. SBMA mitochondria may be more sensitive to the normal
increase in ROS production that occurs during normal skeletal muscle activity, causing transient physiological
oxidative stress (37). SBMA muscle mitochondria have an altered membrane lipid composition, which may cause a
latent fragility and explain the mitochondriapenia as a result of an imbalance in mitochondrial turnover that favors
mitochondrial removal.
In conclusion, we show here for the first time that mitochondrial mass is reduced, mitochondrial morphology
and lipid composition is aberrant, and mitophagy is enhanced in the muscle of SBMA patients. These observations have
been obtained in muscle biopsy specimens derived from SBMA patients with various degrees of motor impairment
and/or disease duration, ranging from a mild to severe phenotype. We propose a model whereby abnormal
mitochondria are subjected to quality control and eliminated, leading to aberrant mitochondrial network and function in
SBMA muscle. These findings highlight the relevance of mitochondria in disease pathogenesis and identify
mitochondrial homeostasis as a target for therapeutic manipulation.
by guest on January 15, 2017http://hm
g.oxfordjournals.org/D
ownloaded from
Borgia et al., Re-Resubmitted
16
Materials and Methods
Human samples
Anonymized control and patient biopsy sample collection was approved by the local Ethics Committee.
Written informed consent was obtained from each patient. In all cases, biopsied muscles were clinically affected and
showed weakness and/or atrophy. Myopathic changes together with neurogenic atrophy were observed in all muscle
biopsies. We studied 19 SBMA patients followed at our Neuromuscular Clinic of the University of Padova (Table S1).
Main clinical data, including age at disease onset, age at biopsy and first clinical symptoms were recorded for each
patient. Genomic DNA was extracted from the peripheral blood according to standard procedures. CAG repeats
fragment sizing in AR gene was performed on an ABI PRISM 3700 DNA Sequencer (Applied Biosystems, Foster City,
California, USA). The specific length of CAG repeats was further verified via Sanger sequencing. Muscle biopsies were
obtained using an open biopsy procedure with the collection of 100-200 mg of muscle tissue. All biopsies were
immediately frozen in liquid nitrogen for histopathology and biochemical analyses and stored at -80°C until analyzed.
Muscle biopsies from 18 age- and sex-matched healthy subjects, with no signs of neuromuscular diseases and with
normal creatine kinase levels were used as controls. Muscle biopsies from 5 age-matched female controls and 46 age-
matched male patients affected with neurogenic diseases, including amyotrophic lateral sclerosis (ALS; 32) and
sensory-motor neuropathies (14), followed at our Neuromuscular Clinic of the University of Padova, were used for
atrophy and hypertrophy indexes evaluation.
Nuclear/cytosolic and mitochondria fractionation
Nuclear and cytosolic fractions were obtained by treating fifty x 20 µm thick fresh-frozen sections of muscle
biopsies with the NE−PER Nuclear and Cytoplasmic Extraction kit (Thermo Scientific), supplemented with protease
inhibitors cocktail (Sigma). Protein concentration was determined by BCA assay (Thermo Scientific). For each sample,
30 µg of nuclear and cytosolic proteins were loaded for the different analyses. Nuclear enrichment was tested by
Western blotting as the ratio between PARP (nuclear marker) and β-tubulin (cytosolic marker) in total lysate, nuclear
and cytosolic fractions of each muscle sample. As shown in Fig. S3, in total lysate and the cytosolic fraction the
PARP:β-tubulin ratio was 0.07 ± 0.01 and 0.21 ± 0.14 respectively, whereas in the nuclear fraction this ratio was 6.03 ±
0.70. This procedure yielded a 29-fold and 86-fold enrichment of the nuclear fraction when compared to cytosolic
fraction and the total homogenate, respectively.
Human muscle mitochondria were isolated from frozen muscle specimens (50-100 mg), as previously
described (96). Each muscle sample was diluted 1:10 in Buffer A (20 mM HEPES, 100 mMKCl, 1 mM EDTA, 2 mM
β-mercaptoethanol, 0.3 % BSA), homogenized using a glass pestle in a glass potter and centrifuged at 800g for 10 min
by guest on January 15, 2017http://hm
g.oxfordjournals.org/D
ownloaded from
Borgia et al., Re-Resubmitted
17
at 4°C. The resulting supernatant (S1) was transferred to a new tube and the pellet was diluted 1:20 in Buffer A and
centrifuged at 800g for 10 min at 4°C, to increase the yield of mitochondria. The resulting supernatants (S1+S2) were
pooled and centrifuged at 10000g for 10 min at 4°C. The resulting supernatants (S1+S2) were pooled to increase the
yield of mitochondria. The resulting supernatants (S1+S2) were pooled and centrifuged at 10000g for 10 min at 4°C.
Following this centrifugation step, supernatant was discarded and the pellets containing the mitochondria were
suspended in the isotonic MSEM buffer (3 ml/initial g of tissue, 220 mM Mannitol, 70 mM sucrose, 1 mM EDTA, 2
mM β-mercaptoethanol, 5 mM MOPS), aliquoted in several tubes, centrifuged at 20000g for 10 min at 4°C and stored
at -80°C until further analysis. Mitochondrial enrichment was tested by Western blotting as the ratio between TOM20
(mitochondrial marker) and β-tubulin (cytosolic marker) in the total lysate and in the isolated mitochondria of muscle
from two SBMA and two control subjects. As shown in Fig. S6, the total lysate TOM20:β-tubulin ratio was 0.50 ±
0.06, whereas in isolated mitochondria it was 7.85 ± 1.36. This procedure yielded a 16-fold enrichment of the
mitochondrial fraction compared to the total homogenate.
Molecular analyses
To measure mtDNA copy number, total DNA was isolated from muscle tissue using the DNeasy Blood &
Tissue Kit (Qiagen). Quantitative polymerase chain reaction (qPCR) was performed using a ABI PRISM 7000 light
cycler, using Platinum quantitative PCR SuperMix-UDG with ROX (Invitrogen). The mtDNA copy number was
estimated as previously described (97). Briefly, the mitochondrial encoded gene, cytochrome c oxidase (COII), was
amplified and compared to the amplification profile of the nuclear single copy gene, Amyloid Precursor protein (APP).
The relative level for each gene was calculated using the “½^Ct method”. In all experiments, each sample was analyzed
in triplicate. Probes were labeled with FAM and TAMRA. For mRNA quantification, total RNA was isolated from
muscle biopsies using TRIzol Reagent (Life Technologies). First-Strand cDNA synthesis was performed using High-
Capacity cDNA Reverse Transcription Kit (Life Technologies) and transcript levels were quantified by SYBER Green
Real-Time PCR (Life Technologies) using the ABI PRISM 7000 sequence detection system. Primer sequences are
listed in the Table S2.
Biochemical analyses
For Western blotting analysis, total muscle lysates were obtained by cutting 30 x 20 µm-thick fresh-frozen
sections from each muscle biopsy and placing these sections on ice for 30 min in 200 µl of RIPA buffer (65 mM Tris,
150 mM NaCl, 1 % NP-40, 0.25 % Na-DOC, 1 mM EDTA, pH 7.4) that contained 2 µl of a protease inhibitor cocktail
(Sigma) (24). After centrifugation at 20000g for 20 minutes at 4°C, the supernatant was collected and stored at –80°C
by guest on January 15, 2017http://hm
g.oxfordjournals.org/D
ownloaded from
Borgia et al., Re-Resubmitted
18
until use. Protein concentration was determined by BCA assay (Thermo Scientific). Thirty µg of protein from each
sample were loaded for the different analyses. The protein samples were separated by SDS-PAGE (7.5% or 10%
polyacrylamide gels) and transferred to a nitrocellulose membrane (Whatman). Membranes were blocked in 5 % (w/v)
fat-free milk in 0.02 M Tris/HCl pH 7.5, 137mM NaCl, and 0.1 % (v/v) Tween-20 for 1 h at room temperature and then
incubated overnight at 4 °C with the primary antibodies diluted in blocking solution. Bound antibody was visualized
using an ECL reagent (GE Healthcare). Integrated optical density of each band was calculated with commercial
software (Gel-Pro Analyzer 3). The primary antibodies used were: anti-AR polyclonal (Santa Cruz, N-20, sc-816,
1:1000); anti-ACTB monoclonal (Chemicon International, MAB1501, 1:20000); anti-PARP-1 polyclonal (Santa Cruz,
H-250, 1:2000); anti-β-tubulin polyclonal (Santa Cruz, H-235, 1:1000); anti-TOM20 polyclonal (Santa Cruz, Sc-11415,
1:1000); anti-SQSTM1/p62 monoclonal (Sigma, 041M4812 1:2000); anti-LC3 monoclonal (Sigma, L7543, 1:1000);
anti-Beclin-1 polyclonal (Cell Signaling, 3738, 1:1000); anti-LAMP-1 monoclonal (DSHB, H4A3, 1:400); anti-BNIP3
polyclonal (Sigma, B7931, 1:1000); anti-PINK1 monoclonal (Cell Signaling, D8G3, 1:1000); anti-PARK2 monoclonal
(Santa Cruz, Sc-32282, 1:1000); anti-Ubiquitin monoclonal (Millipore, MAB1510, 1:1000); anti-DLP1 monoclonal
(BD Biosciences, 611112, 1:1000); anti-Fis1 polyclonal (Alexis, ALX-210-907, 1:1000); anti-ATPase polyclonal
(home-made), generous gift of Prof. F. Dabbeni-Sala from University of Padua.
For Blue Native PAGE (BN-PAGE), mitochondrial pellets were resuspended at 10 µg/µl in Native Buffer
(Invitrogen) with 4% Digitonin (Sigma) for 1 hour on ice and centrifuged 20 min at 16000g at 4°C. The supernatant
was collected and 1% G250 sample buffer additive (Invitrogen) was added. Ten µg of mitochondrial membrane
proteins were loaded onto a 3-12 % Bis-Tris gel (NativePAGE™ Novex® Bis-Tris Gel System, Invitrogen), as
manufacturers’ instructions, and transferred to Immobilon-P transfer membrane (Millipore). Membranes were blocked
in 2 % bovine serum albumin in 0.02 M Tris/HCl pH 7.5, 137mM NaCl, and 0.1 % (v/v) Tween-20 for 1 h at room
temperature and then incubated for 1 h at room temperature with the primary antibodies diluted in blocking solution.
Visualization of the antibody protein complexes was achieved by using enhanced chemiluminescence (LiteAblot-
Turbo, Euroclone) and the ChemiDocTM
XRS+ System (Bio-Rad). Densitometry was performed with the Gel-Pro
Analyzer 3 software. The primary antibodies used were: anti-MTCO1 monoclonal (Abcam, ab14705, 1:5000), anti-
Complex I subunit NDUFB8 monoclonal (Molecular Probes, 459210, 1:5000) and anti-GRP75 polyclonal (Santa Cruz,
sc-13967, 1:5000).
OXPHOS activities were tested as previously described (98). Briefly, muscle biopsies (20-30 mg) were
homogenized in Sucrose buffer 250 mM (0.121 g Tris, 0.15 g KCl and 0.038 g EGTA in a final volume of 50 ml). On
the same day of the experiment, 0,854 g of sucrose was added to 10 ml of this buffer, and then the homogenate was
centrifuged at 600g for 10 min at 4°C. The supernatant was transferred into a new tube on ice for respiratory chain
by guest on January 15, 2017http://hm
g.oxfordjournals.org/D
ownloaded from
Borgia et al., Re-Resubmitted
19
complex analysis. Citrate synthase (CS) was quantified as previously described (98). A protein amount corresponding
to a CS activity of 2500, 4000 or 5000 nmol·min−1
·mg−1
was loaded for the different analyses. Protein concentration
was determined by Bradford assay (Sigma). The enzymatic activities of respiratory chain complexes I–IV were assayed
in duplicate or triplicate with a single-wavelength, temperature-controlled spectrophotometer at 37°C, as previously
described (98). The enzymatic activities for each mitochondrial enzyme was calculated as nmol·min−1
·mg−1
of protein
and also normalized to the activity of CS, a mitochondrial matrix enzyme, used as a marker of the abundance of
mitochondria within a tissue.
Lipidomic analysis in mitochondria isolated from muscle
For mitochondria lipid extraction, 100 µl aliquots of mitochondrial suspension (containing 10 µg of protein)
were used for lipid extraction. Lipids were extracted according to the method of Bligh and Dyer (99) substituting
deuterated dichloromethane (DMC) with chloroform (100). Briefly, 320 µl of methanol (MeOH) was added to each 100
µl sample. Samples were then vortexed for 60 s. Next, 630 µl of DCM was added, the sample was again vortexed for 60
s and 200 µl of water was added to induce phase separation. The samples were then vortexed for 60 s and allowed to
equilibrate at room temperature for 10 min before centrifugation at 8000g for 10 min at 10°C. A total of 10 µl of the
lower lipid-rich DCM layer was then collected and diluted in 990 µl of acetonitrile (ACN)/DCM/H2O (80:15:5 v/v/v)
before LC-MS (Liquid Chromatography–Mass Spectrometry) analysis. One microliter of sample (equivalent to 200 pg
of proteins) was processed for Nano Liquid Chromatography–Mass Spectrometry (LC–MS) analysis. The LC/MS
analyses were run on an Agilent (Agilent, Santa Clara, CA, US) 6520 accurate mass Quadrupole Time-of-Flight (Q-
TOF) LC-MS system governed by Agilent MassHunter software (B.05.00 version). The LC system consists of a 1200
series High Performance Liquid Chromatography (HPLC) system coupled on-line to MS through a Chip Cube Interface
(Agilent Technologies, CA, USA). Each sample (1 µl) was loaded onto a large capacity chip-column filled with 3 µm
Merck ZIC-HILIC, integrating a 500 nl capacity trap-column, a 75 µm × 150 mm column, connection capillaries, and a
nano-spray emitter. Solvent A was ACN/DCM/MET/H2O (60:10:10:20 v/v/v/v), containing 5 mM ammonium formate,
while solvent B was ACN/DCM/H2O (80:15:5 v/v/v) containing 5 mM ammonium formate. Peptides were separated
with a linear gradient of 0–100% of solvent A in 30 min at a flow rate of 0.35 µl min-1
. The LC effluents were
introduced into the Q-TOF spectrometer by Agilent Chip Cube Interface that operated in negative mode (Vap=1700V)
with nitrogen as desolvating gas at 325°C and 4.0 l/min; fragmentor, skimmer, and octapole were set at 150, 65, and
750 V, respectively. The Q-TOF operates in MS mode at 2 GHz, extend dynamic range with two reference ions (mass
accuracy 5 ppm, resolution about 0.05 Da). Mass spectra were acquired in a data-dependent mode: MS/MS spectra of
the 5 most intense ions were acquired for each MS scan in the 140–1700 Da range. Scan speed was set to 3 MS spectra
by guest on January 15, 2017http://hm
g.oxfordjournals.org/D
ownloaded from
Borgia et al., Re-Resubmitted
20
s-1
and 5 MS/MS spectra s-1
. Lipid identification and quantification was performed, after conversion of the raw data in
XML format, by the software LipidXplorer (101).
Histological analyses
The atrophy index (AI) and hypertrophy index (HI) were measured in routine H&E-stained muscle sections
(Olympus BX60) from 19 controls (14 males, 5 females), 15 SBMA patients, 32 ALS patients (26 males, 6 females)
and 14 patients with sensory-motor neuropathies (9 males, 5 females), according to Dubowitz (23), using ImageJ
software. We measured the minor diameter of each fiber (almost 50 fibers for each muscle sample), because this is not
altered by oblique sectioning or kinking of the fibers. Considering that normal males have a minor diameter of 40-80µm
(normal females: 30-70µm), AI and HI were calculated giving different importance to fibers with mild or severe
changes in size, using the following equations:
Atrophy Index = (n° of fibers with a minor diameter <10µm)*4 +
(n° of fibers with a minor diameter of 10-20µm)*3 +
(n° of fibers with a minor diameter of 20-30µm)*2 +
(n° of fibers with a minor diameter of 30-40µm)*1
Hypertrophy Index = (n° of fibers with a minor diameter of 80-90µm)*1 +
(n° of fibers with a minor diameter of 90-100µm)*2 +
(n° of fibers with a minor diameter of 100-110µm)*3 +
(n° of fibers with a minor diameter >110µm)*4
These products are divided by the total numbers of fibers and then multiplied by 1000.
For nicotinamide adenine dinucleotide (NADH) staining, frozen 8 µm cryosections from 5 controls and 6
SBMA patients were brought to room temperature and then incubated for 40 min at 37°C in 25 ml of 0.2 M Tris/HCl
buffer pH 7.4, 25 ml of distilled water, 25 mg of nitro-blue tetrazolium (NBT) (Sigma N-6876) and 20 mg NADH
(Sigma N-8129). Percentage of dark blue area for field was calculated in the NADH-stained sections (Olympus BX60)
using ImageJ software, by measuring the number of pixels for field with a dark blue staining. Briefly, the used
procedure divided the image into objects and background with respect to the threshold set through Image J
by guest on January 15, 2017http://hm
g.oxfordjournals.org/D
ownloaded from
Borgia et al., Re-Resubmitted
21
(background: low intensity pixels-light blue; object: high intensity pixels-dark blue). Then, the number of pixels for
field with a value above threshold was measured
For immunofluorescence analysis (IF) and imaging, 8 µm muscle cryosections were collected on Superfrost
slides, fixed with 4% paraformaldehyde (PFA), treated with 0.5% Triton-X-100, blocked in 10% fetal bovine serum in
PBS 1X for 30 min and then incubated overnight at 4 °C with primary antibodies , diluted in blocking solution, against
rabbit LC3 (Cell Signaling, polyclonal, #2775, 1:200) and mouse ATP5A (Abcam, monoclonal, ab110273, 1:200) in
10% FBS in PBS 1X. Each primary antibody was sequentially incubated separately on the sections. Appropriate
secondary fluorescent antibodies (Alexa-Fluor-488, Invitrogen, A11008, 1:200 for anti-LC3 and Alexa-Fluor-647,
Invitrogen, A21235, 1:200 for anti-ATP5A) were used for 1 h at room temperature at the end of the respective section.
Slides were mounted using Vectashield medium with DAPI stain (Vector) and examined on a confocal microscope
(Leica TCS SP5). In the z-axis stacks acquired, each image was separated by 0.5 µm along the z-axis. Using the
program Fiji, the number of object-voxel was analyzed in each green and red slide of the z-stack. Considering the
autophagosoma diameter is about 1 µm, only the voxels equal to or greater than 1 µm were analyzed. To evaluate the
LC3-ATPase colocalization signal, we used the following formula: �(�1 − �2)� + (1 − 2)� + (1 − 2)� and was
considered a green-red colocalized voxel only when the green voxel (LC3-autophagosoma) was bigger than the red one
(ATPase-mitochondria).
For transmission electron microscopy, muscle specimens were fixed in 3.5% glutaraldehyde in 0.1 M sodium-
cacodylate buffer (pH 7.4, room temperature) for 2 hours followed by buffer rinse and post fixation for 1 hour in 2%
osmium tetroxide. The specimens were rapidly dehydrated in graded ethanol and acetone, infiltrated with EPON-
acetone (1:1) mixture for 2 hours, and embedded in EPON (102). Ultrathin sections were stained with uranyl acetate
and lead citrate (Reynolds) and examined with a Philips EM400 transmission electron microscope operating at 100 kV.
Statistical analysis
Data were expressed as mean values ± SEM. Statistical differences of continuous data from two experimental
groups were calculated using Student t tests. Comparisons of data from more than two groups were performed using a
one-way ANOVA followed by a Fisher’s least significant difference post hoc test. We considered a P-value <0.05 to be
significant.
by guest on January 15, 2017http://hm
g.oxfordjournals.org/D
ownloaded from
Borgia et al., Re-Resubmitted
22
Acknowledgments
We thank Bruno Gavassini (University of Padova) for technical assistance, the Telethon Network of Genetic
BioBank (GTB12001D to E.P.), and the Eurobiobank network.
Funding
This work was supported by Telethon-Italy and Provincia Autonoma di Trento (TCP12013 to M.P), Italian
Ministry of Health (RF-2011-02350097 to G.S. and M.P.), Bando Progetti Strategici di Ateneo-University of Trento (to
M.P.), Association Française contre les Myopathies (18722 to G.S. and M.P.), Telethon-Italy (GGP13222 to L.S.),
Fondazione CARIPARO (to L.S), Dulbecco Telethon Institute International Postdoctoral Programme (DTI-IMPORT to
L.T.), and Akira Arimura Foundation (to L.T.).
Conflict of interests
The authors have no conflict of interest to declare.
Abbreviations
ACN Acetonitrile
AI Atrophy index
ALS Amyotrophic lateral sclerosis
APP Amyloid Precursor protein
AR Androgen receptor
AV Autophagic vacuoles
BM Bethlem Myopathy
BNIP3 BCL2/Adenovirus E1B 19kDa Interacting Protein 3
BN-PAGE Blue Native PAGE
CDP-DAG Cytidine diphosphate diacylglycerol
CL Cardiolipin
CMDmt Congenital muscular dystrophy with mitochondrial structural abnormalities
COII Cytochrome c oxidase subunit II
COX4 Cytochrome c oxidase subunit 4
COXVb Cytochrome c oxidase subunit Vb
CRLS1 Cardiolipin synthase
CS Citrate synthase
DMC Dichloromethane
Drp1 Dynamin-related protein 1
DRPLA Dentatorubral-pallidoluysian atrophy
ERRα Estrogen-related receptor α
FAM Fluorescein
FOXO Forkhead box O transcription factors
FUS Fused in sarcoma
by guest on January 15, 2017http://hm
g.oxfordjournals.org/D
ownloaded from
Borgia et al., Re-Resubmitted
23
GRP75 75 kDa glucose regulated protein
H&E Hematoxylin & eosin
HD Huntington’s disease
hFis1 Human fission 1 protein
HI Hypertrophy index
IMM Inner mitochondrial membrane
LAMP1 Lysosome-associated membrane protein 1
LC Liquid Chromatography
LC3 Microtubule-associated protein 1A/1B-light chain 3
MFN Mitofusin
MnSOD Manganese superoxide dismutase
MS Mass Spectrometry
MTCO1 Mitochondrially Encoded Cytochrome c oxidase I
MtDNA Mitochondrial DNA
mTOR Mechanistic target of rapamycin
MUL1 Mitochondrial E3 Ubiquitin Protein Ligase 1
NBT Nitro-blue tetrazolium
NDP52 Nuclear Domain 10 Protein 52
NDUFB8 NADH:Ubiquinone Oxidoreductase Subunit B8
NRF1 Nuclear respiratory factor 1
OMM Outer mitochondrial membrane
OXPHOS Oxidative phosphorylation system
PA Phosphatidic acid
PARK2 E3 ubiquitin-protein ligase parkin
PARP Poly (ADP-ribose) polymerase
PC Phosphatidylcholine
PE Phosphatidylethanolamine
PG Phosphatidylglycerol
PGC1α, PPARGC1α Peroxisome proliferator-activated receptor γ coactivator 1 alpha
PGC-1β, PPARGC1β Peroxisome proliferator-activated receptor γ coactivator 1 beta
PI Phophatidylinositol
PINK1 PTEN-induced putative kinase 1
PS Phosphatidylserine
Q-TOF Quadrupole Time-of-Flight
RPLPO Large ribosomal protein
SBMA Spinal and bulbar muscular atrophy
SCA Spinocerebellar ataxia
SQSTM1 Sequestosome 1
TAMRA Tetramethylrhodamine
TDP-43 TAR DNA-binding protein 43
TEM Transmission electron microscopy
TFAM Mitochondrial transcription factor A
TOM20 Translocase of outer mitochondrial membrane 20
UCMD Ullrich Congenital Muscular Dystrophy
UPS Ubiquitin proteasome system
VCP Valosin-containing protein
∆Ψm Mitochondrial membrane potential
by guest on January 15, 2017http://hm
g.oxfordjournals.org/D
ownloaded from
Borgia et al., Re-Resubmitted
24
References
1 Kennedy, W.R., Alter, M. and Sung, J.H. (1968) Progressive proximal spinal and bulbar muscular atrophy of
late onset. A sex-linked recessive trait. Neurology, 18, 671-680.
2 Querin, G., Bertolin, C., Da Re, E., Volpe, M., Zara, G., Pegoraro, E., Caretta, N., Foresta, C., Silvano, M.,
Corrado, D. et al. (2015) Non-neural phenotype of spinal and bulbar muscular atrophy: results from a large cohort of
Italian patients. Journal of neurology, neurosurgery, and psychiatry.
3 La Spada, A.R., Wilson, E.M., Lubahn, D.B., Harding, A.E. and Fischbeck, K.H. (1991) Androgen receptor
gene mutations in X-linked spinal and bulbar muscular atrophy. Nature, 352, 77-79.
4 Orr, H.T. and Zoghbi, H.Y. (2007) Trinucleotide repeat disorders. Annual review of neuroscience, 30, 575-621.
5 Katsuno, M., Adachi, H., Kume, A., Li, M., Nakagomi, Y., Niwa, H., Sang, C., Kobayashi, Y., Doyu, M. and
Sobue, G. (2002) Testosterone reduction prevents phenotypic expression in a transgenic mouse model of spinal and
bulbar muscular atrophy. Neuron, 35, 843-854.
6 Chevalier-Larsen, E.S., O'Brien, C.J., Wang, H., Jenkins, S.C., Holder, L., Lieberman, A.P. and Merry, D.E.
(2004) Castration restores function and neurofilament alterations of aged symptomatic males in a transgenic mouse
model of spinal and bulbar muscular atrophy. The Journal of neuroscience : the official journal of the Society for
Neuroscience, 24, 4778-4786.
7 Yu, Z., Dadgar, N., Albertelli, M., Gruis, K., Jordan, C., Robins, D.M. and Lieberman, A.P. (2006) Androgen-
dependent pathology demonstrates myopathic contribution to the Kennedy disease phenotype in a mouse knock-in
model. The Journal of clinical investigation, 116, 2663-2672.
8 Pennuto, M. and Basso, M. (2015) In Vitro and In Vivo Modeling of Spinal and Bulbar Muscular Atrophy. J
Mol Neurosci.
9 Takeyama, K., Ito, S., Yamamoto, A., Tanimoto, H., Furutani, T., Kanuka, H., Miura, M., Tabata, T. and Kato,
S. (2002) Androgen-dependent neurodegeneration by polyglutamine-expanded human androgen receptor in Drosophila.
Neuron, 35, 855-864.
10 Nedelsky, N.B., Pennuto, M., Smith, R.B., Palazzolo, I., Moore, J., Nie, Z., Neale, G. and Taylor, J.P. (2010)
Native functions of the androgen receptor are essential to pathogenesis in a Drosophila model of spinobulbar muscular
atrophy. Neuron, 67, 936-952.
11 Pandey, U.B., Nie, Z., Batlevi, Y., McCray, B.A., Ritson, G.P., Nedelsky, N.B., Schwartz, S.L., DiProspero,
N.A., Knight, M.A., Schuldiner, O. et al. (2007) HDAC6 rescues neurodegeneration and provides an essential link
between autophagy and the UPS. Nature, 447, 859-863.
12 Katsuno, M., Adachi, H., Doyu, M., Minamiyama, M., Sang, C., Kobayashi, Y., Inukai, A. and Sobue, G.
(2003) Leuprorelin rescues polyglutamine-dependent phenotypes in a transgenic mouse model of spinal and bulbar
muscular atrophy. Nature medicine, 9, 768-773.
13 Fernandez-Rhodes, L.E., Kokkinis, A.D., White, M.J., Watts, C.A., Auh, S., Jeffries, N.O., Shrader, J.A.,
Lehky, T.J., Li, L., Ryder, J.E. et al. (2011) Efficacy and safety of dutasteride in patients with spinal and bulbar
muscular atrophy: a randomised placebo-controlled trial. The Lancet. Neurology, 10, 140-147.
14 Katsuno, M., Banno, H., Suzuki, K., Takeuchi, Y., Kawashima, M., Yabe, I., Sasaki, H., Aoki, M., Morita, M.,
Nakano, I. et al. (2010) Efficacy and safety of leuprorelin in patients with spinal and bulbar muscular atrophy
(JASMITT study): a multicentre, randomised, double-blind, placebo-controlled trial. The Lancet. Neurology, 9, 875-
884.
15 Sambataro, F. and Pennuto, M. (2012) Cell-autonomous and non-cell-autonomous toxicity in polyglutamine
diseases. Prog Neurobiol, 97, 152-172.
16 Cortes, C.J., Ling, S.C., Guo, L.T., Hung, G., Tsunemi, T., Ly, L., Tokunaga, S., Lopez, E., Sopher, B.L.,
Bennett, C.F. et al. (2014) Muscle expression of mutant androgen receptor accounts for systemic and motor neuron
disease phenotypes in spinal and bulbar muscular atrophy. Neuron, 82, 295-307.
17 Lieberman, A.P., Yu, Z., Murray, S., Peralta, R., Low, A., Guo, S., Yu, X.X., Cortes, C.J., Bennett, C.F.,
Monia, B.P. et al. (2014) Peripheral androgen receptor gene suppression rescues disease in mouse models of spinal and
bulbar muscular atrophy. Cell reports, 7, 774-784.
18 Monks, D.A., Johansen, J.A., Mo, K., Rao, P., Eagleson, B., Yu, Z., Lieberman, A.P., Breedlove, S.M. and
Jordan, C.L. (2007) Overexpression of wild-type androgen receptor in muscle recapitulates polyglutamine disease.
Proceedings of the National Academy of Sciences of the United States of America, 104, 18259-18264.
19 Soraru, G., D'Ascenzo, C., Polo, A., Palmieri, A., Baggio, L., Vergani, L., Gellera, C., Moretto, G., Pegoraro,
E. and Angelini, C. (2008) Spinal and bulbar muscular atrophy: skeletal muscle pathology in male patients and
heterozygous females. Journal of the neurological sciences, 264, 100-105.
20 Harding, A.E., Thomas, P.K., Baraitser, M., Bradbury, P.G., Morgan-Hughes, J.A. and Ponsford, J.R. (1982)
X-linked recessive bulbospinal neuronopathy: a report of ten cases. Journal of neurology, neurosurgery, and psychiatry,
45, 1012-1019.
21 Palazzolo, I., Stack, C., Kong, L., Musaro, A., Adachi, H., Katsuno, M., Sobue, G., Taylor, J.P., Sumner, C.J.,
Fischbeck, K.H. et al. (2009) Overexpression of IGF-1 in muscle attenuates disease in a mouse model of spinal and
bulbar muscular atrophy. Neuron, 63, 316-328.
by guest on January 15, 2017http://hm
g.oxfordjournals.org/D
ownloaded from
Borgia et al., Re-Resubmitted
25
22 Rocchi, A., Milioto, C., Parodi, S., Armirotti, A., Borgia, D., Pellegrini, M., Urciuolo, A., Molon, S.,
Morbidoni, V., Marabita, M. et al. (2016) Glycolytic-to-oxidative fiber-type switch and mTOR signaling activation are
early-onset features of SBMA muscle modified by high-fat diet. Acta neuropathologica.
23 Dubowitz, V. and Sewry, C.A. (2007) Muscle biopsy : a practical approach 3rd edn. Elsevier.
24 Malena, A., Pennuto, M., Tezze, C., Querin, G., D'Ascenzo, C., Silani, V., Cenacchi, G., Scaramozza, A.,
Romito, S., Morandi, L. et al. (2013) Androgen-dependent impairment of myogenesis in spinal and bulbar muscular
atrophy. Acta neuropathologica, 126, 109-121.
25 Ranganathan, S., Harmison, G.G., Meyertholen, K., Pennuto, M., Burnett, B.G. and Fischbeck, K.H. (2009)
Mitochondrial abnormalities in spinal and bulbar muscular atrophy. Human molecular genetics, 18, 27-42.
26 Bott, L.C., Badders, N.M., Chen, K.L., Harmison, G.G., Bautista, E., Shih, C.C., Katsuno, M., Sobue, G.,
Taylor, J.P., Dantuma, N.P. et al. (2016) A small-molecule Nrf1 and Nrf2 activator mitigates polyglutamine toxicity in
spinal and bulbar muscular atrophy. Hum Mol Genet.
27 Gomes, L.C. and Scorrano, L. (2013) Mitochondrial morphology in mitophagy and macroautophagy.
Biochimica et biophysica acta, 1833, 205-212.
28 Mizushima, N. and Komatsu, M. (2011) Autophagy: renovation of cells and tissues. Cell, 147, 728-741.
29 Wang, K. and Klionsky, D.J. (2011) Mitochondria removal by autophagy. Autophagy, 7, 297-300.
30 Ding, W.X. and Yin, X.M. (2012) Mitophagy: mechanisms, pathophysiological roles, and analysis. Biological
chemistry, 393, 547-564.
31 Rusmini, P., Polanco, M.J., Cristofani, R., Cicardi, M.E., Meroni, M., Galbiati, M., Piccolella, M., Messi, E.,
Giorgetti, E., Lieberman, A.P. et al. (2015) Aberrant Autophagic Response in The Muscle of A Knock-in Mouse Model
of Spinal and Bulbar Muscular Atrophy. Scientific reports, 5, 15174.
32 Chua, J.P., Reddy, S.L., Merry, D.E., Adachi, H., Katsuno, M., Sobue, G., Robins, D.M. and Lieberman, A.P.
(2014) Transcriptional activation of TFEB/ZKSCAN3 target genes underlies enhanced autophagy in spinobulbar
muscular atrophy. Human molecular genetics, 23, 1376-1386.
33 Klionsky, D.J., Abdelmohsen, K., Abe, A., Abedin, M.J., Abeliovich, H., Acevedo Arozena, A., Adachi, H.,
Adams, C.M., Adams, P.D., Adeli, K. et al. (2016) Guidelines for the use and interpretation of assays for monitoring
autophagy (3rd edition). Autophagy, 12, 1-222.
34 Springer, W. and Kahle, P.J. (2011) Regulation of PINK1-Parkin-mediated mitophagy. Autophagy, 7, 266-278.
35 Yun, J., Puri, R., Yang, H., Lizzio, M.A., Wu, C., Sheng, Z.H. and Guo, M. (2014) MUL1 acts in parallel to
the PINK1/parkin pathway in regulating mitofusin and compensates for loss of PINK1/parkin. eLife, 3, e01958.
36 Fu, M., St-Pierre, P., Shankar, J., Wang, P.T., Joshi, B. and Nabi, I.R. (2013) Regulation of mitophagy by the
Gp78 E3 ubiquitin ligase. Molecular biology of the cell, 24, 1153-1162.
37 Romanello, V. and Sandri, M. (2015) Mitochondrial Quality Control and Muscle Mass Maintenance. Frontiers
in physiology, 6, 422.
38 Youle, R.J. and Narendra, D.P. (2011) Mechanisms of mitophagy. Nature reviews. Molecular cell biology, 12,
9-14.
39 Mitsuhashi, S. and Nishino, I. (2011) Phospholipid synthetic defect and mitophagy in muscle disease.
Autophagy, 7, 1559-1561.
40 Patil, V.A. and Greenberg, M.L. (2013) Cardiolipin-mediated cellular signaling. Advances in experimental
medicine and biology, 991, 195-213.
41 Acehan, D., Vaz, F., Houtkooper, R.H., James, J., Moore, V., Tokunaga, C., Kulik, W., Wansapura, J., Toth,
M.J., Strauss, A. et al. (2011) Cardiac and skeletal muscle defects in a mouse model of human Barth syndrome. The
Journal of biological chemistry, 286, 899-908.
42 Montie, H.L., Cho, M.S., Holder, L., Liu, Y., Tsvetkov, A.S., Finkbeiner, S. and Merry, D.E. (2009)
Cytoplasmic retention of polyglutamine-expanded androgen receptor ameliorates disease via autophagy in a mouse
model of spinal and bulbar muscular atrophy. Human molecular genetics, 18, 1937-1950.
43 Palazzolo, I., Burnett, B.G., Young, J.E., Brenne, P.L., La Spada, A.R., Fischbeck, K.H., Howell, B.W. and
Pennuto, M. (2007) Akt blocks ligand binding and protects against expanded polyglutamine androgen receptor toxicity.
Hum Mol Genet, 16, 1593-1603.
44 Rusmini, P., Sau, D., Crippa, V., Palazzolo, I., Simonini, F., Onesto, E., Martini, L. and Poletti, A. (2007)
Aggregation and proteasome: the case of elongated polyglutamine aggregation in spinal and bulbar muscular atrophy.
Neurobiology of aging, 28, 1099-1111.
45 Rusmini, P., Bolzoni, E., Crippa, V., Onesto, E., Sau, D., Galbiati, M., Piccolella, M. and Poletti, A. (2010)
Proteasomal and autophagic degradative activities in spinal and bulbar muscular atrophy. Neurobiology of disease, 40,
361-369.
46 Yu, Z., Wang, A.M., Adachi, H., Katsuno, M., Sobue, G., Yue, Z., Robins, D.M. and Lieberman, A.P. (2011)
Macroautophagy is regulated by the UPR-mediator CHOP and accentuates the phenotype of SBMA mice. PLoS
genetics, 7, e1002321.
47 DiFiglia, M., Sapp, E., Chase, K.O., Davies, S.W., Bates, G.P., Vonsattel, J.P. and Aronin, N. (1997)
Aggregation of huntingtin in neuronal intranuclear inclusions and dystrophic neurites in brain. Science, 277, 1990-1993.
48 Havel, L.S., Li, S. and Li, X.J. (2009) Nuclear accumulation of polyglutamine disease proteins and
neuropathology. Mol Brain, 2, 21.
by guest on January 15, 2017http://hm
g.oxfordjournals.org/D
ownloaded from
Borgia et al., Re-Resubmitted
26
49 Klement, I.A., Skinner, P.J., Kaytor, M.D., Yi, H., Hersch, S.M., Clark, H.B., Zoghbi, H.Y. and Orr, H.T.
(1998) Ataxin-1 nuclear localization and aggregation: role in polyglutamine-induced disease in SCA1 transgenic mice.
Cell, 95, 41-53.
50 Saudou, F., Finkbeiner, S., Devys, D. and Greenberg, M.E. (1998) Huntingtin acts in the nucleus to induce
apoptosis but death does not correlate with the formation of intranuclear inclusions. Cell, 95, 55-66.
51 Bichelmeier, U., Schmidt, T., Hubener, J., Boy, J., Ruttiger, L., Habig, K., Poths, S., Bonin, M., Knipper, M.,
Schmidt, W.J. et al. (2007) Nuclear localization of ataxin-3 is required for the manifestation of symptoms in SCA3: in
vivo evidence. The Journal of neuroscience : the official journal of the Society for Neuroscience, 27, 7418-7428.
52 Cutress, M.L., Whitaker, H.C., Mills, I.G., Stewart, M. and Neal, D.E. (2008) Structural basis for the nuclear
import of the human androgen receptor. J Cell Sci, 121, 957-968.
53 Freibaum, B.D., Lu, Y., Lopez-Gonzalez, R., Kim, N.C., Almeida, S., Lee, K.H., Badders, N., Valentine, M.,
Miller, B.L., Wong, P.C. et al. (2015) GGGGCC repeat expansion in C9orf72 compromises nucleocytoplasmic
transport. Nature, 525, 129-133.
54 Zhang, K., Donnelly, C.J., Haeusler, A.R., Grima, J.C., Machamer, J.B., Steinwald, P., Daley, E.L., Miller,
S.J., Cunningham, K.M., Vidensky, S. et al. (2015) The C9orf72 repeat expansion disrupts nucleocytoplasmic transport.
Nature, 525, 56-61.
55 Giorgetti, E., Yu, Z., Chua, J.P., Shimamura, R., Zhao, L., Zhu, F., Venneti, S., Pennuto, M., Guan, Y., Hung,
G. et al. (2016) Rescue of Metabolic Alterations in AR113Q Skeletal Muscle by Peripheral Androgen Receptor Gene
Silencing. Cell reports, 17, 125-136.
56 Finsterer, J., Mishra, A., Wakil, S., Pennuto, M. and Soraru, G. (2015) Mitochondrial implications in
bulbospinal muscular atrophy (Kennedy disease). Amyotroph Lateral Scler Frontotemporal Degener, 17, 112-118.
57 Pronsato, L., Boland, R. and Milanesi, L. (2013) Non-classical localization of androgen receptor in the C2C12
skeletal muscle cell line. Arch Biochem Biophys, 530, 13-22.
58 Beauchemin, A.M., Gottlieb, B., Beitel, L.K., Elhaji, Y.A., Pinsky, L. and Trifiro, M.A. (2001) Cytochrome c
oxidase subunit Vb interacts with human androgen receptor: a potential mechanism for neurotoxicity in spinobulbar
muscular atrophy. Brain research bulletin, 56, 285-297.
59 Orsucci, D., Rocchi, A., Caldarazzo Ienco, E., Ali, G., LoGerfo, A., Petrozzi, L., Scarpelli, M., Filosto, M.,
Carlesi, C., Siciliano, G. et al. (2014) Myopathic involvement and mitochondrial pathology in Kennedy disease and in
other motor neuron diseases. Current molecular medicine, 14, 598-602.
60 Su, S., Jou, S., Cheng, W., Lin, T., Li, J., Huang, C., Lee, Y., Soong, B. and Liu, C. (2010) Mitochondrial
DNA damage in spinal and bulbar muscular atrophy patients and carriers. Clinica chimica acta; international journal of
clinical chemistry, 411, 626-630.
61 Cortes, C.J., Miranda, H.C., Frankowski, H., Batlevi, Y., Young, J.E., Le, A., Ivanov, N., Sopher, B.L.,
Carromeu, C., Muotri, A.R. et al. (2014) Polyglutamine-expanded androgen receptor interferes with TFEB to elicit
autophagy defects in SBMA. Nat Neurosci, 17, 1180-1189.
62 Twig, G., Elorza, A., Molina, A.J., Mohamed, H., Wikstrom, J.D., Walzer, G., Stiles, L., Haigh, S.E., Katz, S.,
Las, G. et al. (2008) Fission and selective fusion govern mitochondrial segregation and elimination by autophagy. The
EMBO journal, 27, 433-446.
63 Ni, H.M., Williams, J.A. and Ding, W.X. (2015) Mitochondrial dynamics and mitochondrial quality control.
Redox biology, 4, 6-13.
64 Novak, I. (2012) Mitophagy: a complex mechanism of mitochondrial removal. Antioxidants & redox signaling,
17, 794-802.
65 Lazarou, M., Sliter, D.A., Kane, L.A., Sarraf, S.A., Wang, C., Burman, J.L., Sideris, D.P., Fogel, A.I. and
Youle, R.J. (2015) The ubiquitin kinase PINK1 recruits autophagy receptors to induce mitophagy. Nature, 524, 309-
314.
66 Lo Verso, F., Carnio, S., Vainshtein, A. and Sandri, M. (2014) Autophagy is not required to sustain exercise
and PRKAA1/AMPK activity but is important to prevent mitochondrial damage during physical activity. Autophagy,
10, 1883-1894.
67 Romanello, V., Guadagnin, E., Gomes, L., Roder, I., Sandri, C., Petersen, Y., Milan, G., Masiero, E., Del
Piccolo, P., Foretz, M. et al. (2010) Mitochondrial fission and remodelling contributes to muscle atrophy. The EMBO
journal, 29, 1774-1785.
68 Milan, G., Romanello, V., Pescatore, F., Armani, A., Paik, J.H., Frasson, L., Seydel, A., Zhao, J., Abraham, R.,
Goldberg, A.L. et al. (2015) Regulation of autophagy and the ubiquitin-proteasome system by the FoxO transcriptional
network during muscle atrophy. Nature communications, 6, 6670.
69 Hong, K., Li, Y., Duan, W., Guo, Y., Jiang, H., Li, W. and Li, C. (2012) Full-length TDP-43 and its C-terminal
fragments activate mitophagy in NSC34 cell line. Neurosci Lett, 530, 144-149.
70 Wong, Y.C. and Holzbaur, E.L. (2014) Optineurin is an autophagy receptor for damaged mitochondria in
parkin-mediated mitophagy that is disrupted by an ALS-linked mutation. Proceedings of the National Academy of
Sciences of the United States of America, 111, E4439-4448.
71 Yang, J.W., Kim, S.M., Kim, H.J., Kim, J.E., Park, K.S., Kim, S.H., Lee, K.W. and Sung, J.J. (2013)
Hypolipidemia in patients with amyotrophic lateral sclerosis: a possible gender difference? J Clin Neurol, 9, 125-129.
by guest on January 15, 2017http://hm
g.oxfordjournals.org/D
ownloaded from
Borgia et al., Re-Resubmitted
27
72 Bernardi, P. and Bonaldo, P. (2013) Mitochondrial dysfunction and defective autophagy in the pathogenesis of
collagen VI muscular dystrophies. Cold Spring Harb Perspect Biol, 5, a011387.
73 Mitsuhashi, S., Hatakeyama, H., Karahashi, M., Koumura, T., Nonaka, I., Hayashi, Y.K., Noguchi, S., Sher,
R.B., Nakagawa, Y., Manfredi, G. et al. (2011) Muscle choline kinase beta defect causes mitochondrial dysfunction and
increased mitophagy. Human molecular genetics, 20, 3841-3851.
74 Skulachev, V.P. (2001) Mitochondrial filaments and clusters as intracellular power-transmitting cables. Trends
in biochemical sciences, 26, 23-29.
75 Galloway, C.A., Lee, H. and Yoon, Y. (2012) Mitochondrial morphology-emerging role in bioenergetics. Free
radical biology & medicine, 53, 2218-2228.
76 Westermann, B. (2012) Bioenergetic role of mitochondrial fusion and fission. Biochimica et biophysica acta,
1817, 1833-1838.
77 Schlame, M., Rua, D. and Greenberg, M.L. (2000) The biosynthesis and functional role of cardiolipin. Prog
Lipid Res, 39, 257-288.
78 Lecocq, J. and Ballou, C.E. (1964) On the Structure of Cardiolipin. Biochemistry, 3, 976-980.
79 Claypool, S.M. and Koehler, C.M. (2012) The complexity of cardiolipin in health and disease. Trends in
biochemical sciences, 37, 32-41.
80 Paradies, G., Paradies, V., De Benedictis, V., Ruggiero, F.M. and Petrosillo, G. (2014) Functional role of
cardiolipin in mitochondrial bioenergetics. Biochimica et biophysica acta, 1837, 408-417.
81 Pfeiffer, K., Gohil, V., Stuart, R.A., Hunte, C., Brandt, U., Greenberg, M.L. and Schagger, H. (2003)
Cardiolipin stabilizes respiratory chain supercomplexes. The Journal of biological chemistry, 278, 52873-52880.
82 Jiang, F., Ryan, M.T., Schlame, M., Zhao, M., Gu, Z., Klingenberg, M., Pfanner, N. and Greenberg, M.L.
(2000) Absence of cardiolipin in the crd1 null mutant results in decreased mitochondrial membrane potential and
reduced mitochondrial function. The Journal of biological chemistry, 275, 22387-22394.
83 Wenz, T., Hielscher, R., Hellwig, P., Schagger, H., Richers, S. and Hunte, C. (2009) Role of phospholipids in
respiratory cytochrome bc(1) complex catalysis and supercomplex formation. Biochimica et biophysica acta, 1787,
609-616.
84 Claypool, S.M., Oktay, Y., Boontheung, P., Loo, J.A. and Koehler, C.M. (2008) Cardiolipin defines the
interactome of the major ADP/ATP carrier protein of the mitochondrial inner membrane. J Cell Biol, 182, 937-950.
85 Claypool, S.M. (2009) Cardiolipin, a critical determinant of mitochondrial carrier protein assembly and
function. Biochimica et biophysica acta, 1788, 2059-2068.
86 Chu, C.T., Ji, J., Dagda, R.K., Jiang, J.F., Tyurina, Y.Y., Kapralov, A.A., Tyurin, V.A., Yanamala, N.,
Shrivastava, I.H., Mohammadyani, D. et al. (2013) Cardiolipin externalization to the outer mitochondrial membrane
acts as an elimination signal for mitophagy in neuronal cells. Nat Cell Biol, 15, 1197-1205.
87 Ren, M., Phoon, C.K. and Schlame, M. (2014) Metabolism and function of mitochondrial cardiolipin. Prog
Lipid Res, 55, 1-16.
88 Joshi, A.S., Thompson, M.N., Fei, N., Huttemann, M. and Greenberg, M.L. (2012) Cardiolipin and
mitochondrial phosphatidylethanolamine have overlapping functions in mitochondrial fusion in Saccharomyces
cerevisiae. The Journal of biological chemistry, 287, 17589-17597.
89 Bottinger, L., Horvath, S.E., Kleinschroth, T., Hunte, C., Daum, G., Pfanner, N. and Becker, T. (2012)
Phosphatidylethanolamine and cardiolipin differentially affect the stability of mitochondrial respiratory chain
supercomplexes. J Mol Biol, 423, 677-686.
90 Lee, H.J., Mayette, J., Rapoport, S.I. and Bazinet, R.P. (2006) Selective remodeling of cardiolipin fatty acids in
the aged rat heart. Lipids Health Dis, 5, 2.
91 Han, X., Yang, J., Cheng, H., Yang, K., Abendschein, D.R. and Gross, R.W. (2005) Shotgun lipidomics
identifies cardiolipin depletion in diabetic myocardium linking altered substrate utilization with mitochondrial
dysfunction. Biochemistry, 44, 16684-16694.
92 DePrimo, S.E., Diehn, M., Nelson, J.B., Reiter, R.E., Matese, J., Fero, M., Tibshirani, R., Brown, P.O. and
Brooks, J.D. (2002) Transcriptional programs activated by exposure of human prostate cancer cells to androgen.
Genome biology, 3, RESEARCH0032.
93 Wang, G., Jones, S.J., Marra, M.A. and Sadar, M.D. (2006) Identification of genes targeted by the androgen
and PKA signaling pathways in prostate cancer cells. Oncogene, 25, 7311-7323.
94 Wicks, K.L. and Hood, D.A. (1991) Mitochondrial adaptations in denervated muscle: relationship to muscle
performance. The American journal of physiology, 260, C841-850.
95 Ostojic, O., O'Leary, M.F., Singh, K., Menzies, K.J., Vainshtein, A. and Hood, D.A. (2013) The effects of
chronic muscle use and disuse on cardiolipin metabolism. Journal of applied physiology (Bethesda, Md. : 1985), 114,
444-452.
96 Zerbetto, E., Vergani, L. and Dabbeni-Sala, F. (1997) Quantification of muscle mitochondrial oxidative
phosphorylation enzymes via histochemical staining of blue native polyacrylamide gels. Electrophoresis, 18, 2059-
2064.
97 Malena, A., Loro, E., Di Re, M., Holt, I.J. and Vergani, L. (2009) Inhibition of mitochondrial fission favours
mutant over wild-type mitochondrial DNA. Human molecular genetics, 18, 3407-3416.
by guest on January 15, 2017http://hm
g.oxfordjournals.org/D
ownloaded from
Borgia et al., Re-Resubmitted
28
98 Spinazzi, M., Casarin, A., Pertegato, V., Salviati, L. and Angelini, C. (2012) Assessment of mitochondrial
respiratory chain enzymatic activities on tissues and cultured cells. Nature protocols, 7, 1235-1246.
99 Bligh, E.G. and Dyer, W.J. (1959) A rapid method of total lipid extraction and purification. Canadian journal
of biochemistry and physiology, 37, 911-917.
100 Cequier-Sanchez, E., Rodriguez, C., Ravelo, A.G. and Zarate, R. (2008) Dichloromethane as a solvent for lipid
extraction and assessment of lipid classes and fatty acids from samples of different natures. Journal of agricultural and
food chemistry, 56, 4297-4303.
101 Herzog, R., Schuhmann, K., Schwudke, D., Sampaio, J.L., Bornstein, S.R., Schroeder, M. and Shevchenko, A.
(2012) LipidXplorer: a software for consensual cross-platform lipidomics. PloS one, 7, e29851.
102 Tomasi, M., Canato, M., Paolini, C., Dainese, M., Reggiani, C., Volpe, P., Protasi, F. and Nori, A. (2012)
Calsequestrin (CASQ1) rescues function and structure of calcium release units in skeletal muscles of CASQ1-null mice.
American journal of physiology. Cell physiology, 302, C575-586.
by guest on January 15, 2017http://hm
g.oxfordjournals.org/D
ownloaded from
Borgia et al., Re-Resubmitted
29
Figure Legends
Figure 1. Atrophic and hypertrophic fibers in the skeletal muscle of SBMA patients.
A) Representative images of H&E-stained cryosections of control and SBMA quadriceps muscles. Scale bar, 40
µm.
B) Table showing the mean values of the atrophy and hypertrophy indexes in SBMA, ALS, and neurogenic
patients and control subjects. The values, quantified as described in Materials and Methods, are expressed as
mean ± SEM. Significance by ANOVA + LDS Fisher post-doc: atrophy index: p < 0.001 SBMA, ALS, and
neurogenic atrophy patients vs controls; hypertrophy index: p < 0.001 SBMA vs controls, p < 0.001 SBMA vs
ALS patients, p < 0.001 SBMA vs neurogenic patients.
C) Representative NADH-stained quadriceps muscle sections of control and SBMA subjects. Scale bar, 80 µm.
D) Analysis of the hypertrophy index in oxidative and glycolytic fibers. Graph, mean ± SEM, n = 4 SBMA
patients and 5 control subjects. Significance by Student t test: **p < 0.01, ***p < 0.001.
Figure 2. Aberrant subcellular localization of polyglutamine-expanded AR in the muscle of SBMA patients.
A) Western blotting analysis of AR levels in total lysates, cytosolic, nuclear and mitochondrial fractions from
quadriceps muscles of SBMA patients and control subjects. β-actin, β-tubulin, PARP, and ATPase were used
as loading controls.
B) Quantification of AR in total lysates, and nuclear, cytosolic and mitochondrial fractions. Graph, mean ± SEM,
n = 7 SBMA patients and 7 control subjects. Poly (ADP-ribose) polymerase (PARP), citrate synthase (CS).
Significance by Student t test: *p < 0.05, **p < 0.01.
C) Real-time PCR analysis of the AR mRNA transcript levels normalized to large ribosomal protein (RPLPO)
mRNA in the muscle of SBMA patients and control individuals. Graph, mean ± SEM, n = 6 SBMA patients
and 3 control subjects. Significance by Student t test: *p < 0.05, **p < 0.01.
Figure 3. Mitochondrial abnormalities in the muscle of SBMA patients.
A) Representative image of TEM analysis of control muscle specimens.
B-F) Representative images of TEM analysis of SBMA muscle specimens. (B) TEM analysis revealed myofibrillar
disorganization and Z-line streaming. (C-D) Degenerated mitochondria with dense matrix (arrows). (E-F)
Mitochondria with dilated-hypodense matrix and swelling (asterisks).
Scale bar, 1 µm.
by guest on January 15, 2017http://hm
g.oxfordjournals.org/D
ownloaded from
Borgia et al., Re-Resubmitted
30
Figure 4. Reduction of mitochondria in the muscle of SBMA patients.
A) Real-time PCR analysis of mtDNA copy number measured as the ratio between cytochrome c oxidase II
(COII) and nuclear amyloid precursor protein (APP) genes. Graph, mean ± SEM, n = 13 SBMA patients and
14 control subjects.
B) Mitochondrial mass expressed as the percentage of dark blue area in NADH-stained muscle cross sections.
Graph, mean ± SEM, n = 6 SBMA patients and 5 control subjects.
C) NADH analysis of quadriceps muscle of control and SBMA subjects. Scale bar, 80 µm.
D) Citrate synthase (CS) activity, expressed as nmol · min−1 · mg−1 of protein. Graph, mean ± SEM, n = 6
SBMA patients and 4 control subjects.
E) Activity of the respiratory chain complexes I–IV, expressed as nmol · min−1 · mg−1 of protein. Graph, mean ±
SEM, n = 6 SBMA patients and 4 control subjects.
Significance by Student t test: *p < 0.05, **p < 0.01, ***p < 0.001.
Figure 5. Increased autophagy in the muscle of SBMA patients.
A) TEM analysis of quadriceps muscle biopsies derived from two SBMA patients revealed the presence of
autophagic vacuoles (AV). Scale bar, 1 µm.
B) Western blotting analysis of LC3-II, p62, Beclin-1 and LAMP1 levels. β-actin was used as loading control.
Graph, mean ± SEM, n = 10 SBMA patients and 5 control subjects (top panels), and 9 SBMA patients and 9
control subjects (bottom panel).
C) Immunofluorescence analysis of LC3 in control and SBMA muscle tissues. The number of
autophagosomes/fiber was measured as the number of green object-for-fiber (puncta/fiber). Graph, mean ±
SEM, n = 50 fibers from each muscle sample derived from 11 SBMA patients and 10 control subjects. LC3
was detected using a specific antibody. Scale bar, 20 µm.
Significance by Student t test: *p < 0.05, **p < 0.01, ***p < 0.001.
Figure 6. Mitophagy is induced in the muscle of SBMA patients.
A-B) Western blotting analysis of BNIP3, PINK1, PARK2, and ubiquitin levels in mitochondria isolated from the
quadriceps muscle of SBMA patients and controls subjects normalized to CS activity. TOM20 and ATPase were
used as loading controls. Graph, mean ± SEM, n = 5 SBMA patients and 5 control subjects. Significance by
Student t test: *p < 0.05.
by guest on January 15, 2017http://hm
g.oxfordjournals.org/D
ownloaded from
Borgia et al., Re-Resubmitted
31
Figure 7. Increased mitophagy and mitochondrial fission proteins in the muscle of SBMA patients.
A) Representative images of anti-LC3 (green) and anti-ATPase (red) immunostaining of control and SBMA
muscle tissues. Zoom: magnification of the marked area (circle). Scale bar, 20 µm.
B) Number of colocalized autophagosome-mitochondria (yellow puncta), measured as number of yellow
puncta/fiber. Graph, mean ± SEM, n = 11 SBMA patients and 10 control subjects, n of fibers: 50 for each
sample.
C) Western blotting analysis of Drp1 and hFis1 levels normalized to CS activity in mitochondria isolated from the
quadriceps muscle of SBMA patients and control subjects. ATPase was used as loading control. Graph, mean
± SEM, n = 4 SBMA patients and 4 control subjects.
Significance by Student t test: *p < 0.05, **p < 0.01.
Figure 8. Reduced cardiolipin levels and biosynthesis in the muscle of SBMA patients.
A) Mass spectrometry lipidomic analysis of mitochondrial membranes isolated from SBMA patients and control
subjects. Cardiolipin (CL), phosphatidylethanolamine (PE), phosphatidylserine (PS), phosphatidylcholine (PC)
and phosphatidylinositol (PI) amounts were normalized to CS activity. Graph, mean ± SEM, n = 4 SBMA
patients and 4 control subjects.
B) Composition of CL molecular species in control and SBMA muscle samples. The values are expressed as
mean ± SEM of two independent experiments. # Percentage of the molecular species/total CL. * Range of the
major combinations among the shown acyl moieities.
C) Real-time PCR analysis of cardiolipin synthase (CRLS1) normalized to RPLPO in the muscle of SBMA
patients and control subjects. Graph, mean ± SEM, n = 5 SBMA patients and 6 control subjects.
Significance by Student t test: *p < 0.05, **p < 0.01.
Figure 9. Cartoon representing cardiolipin functions in mitochondria.
A) Cardiolipin (CL) is essential for normal electron transport and proton translocation activity of complex I, III
and IV and, with its negative charged head group, CL attracts and provides a local pool of protons necessary
for complex V function. CL also promotes the assembling of OXPHOS complexes into supercomplexes, which
implies an improvement of electron transfer and a reduction in ROS production.
B) CL is involved in mitochondrial dynamics. It is critical for the fusion of the IMMs via its interaction with optic
atrophy (Opa1), promoting its dimerization and enhancing its GTPase activity. CL also has a role in the fission
by guest on January 15, 2017http://hm
g.oxfordjournals.org/D
ownloaded from
Borgia et al., Re-Resubmitted
32
pathway. After its transfer from the IMM to the OMM, it mediates Drp1 recruitment to mitochondrial
membrane surface and enhances Drp1 GTPase activity.
C) In concert with complex V, CL promotes cristae formation. CL structure composed of two phosphatidyl
moieties with a single glycerol group promotes negative curvature of membrane.
D) CL externalization from IMM to OMM acts as an “eat-me-signal” for the autophagic machinery, promoting
mitophagy. The negative charged head group of externalized CL interacts with the basic CL binding sites of
LC3, which mediates both autophagosome formation and cargo recognition. LC3 recognizes CL more
effectively than its metabolites and oxidized CL, suggesting that CL oxidation is not a prerequisite for
mitochondria elimination through mitophagy.
E) CL plays a role in apoptosis. During apoptosis initiation, CL undergoes peroxidation catalyzed by cytocrome c.
Mitochondrial injuries generate ROS, which cause a significant amount of CL to flip to the outer leaflet of
IMM, where it binds to cytochrome c. After peroxidation and externalization, CL binds a set of apoptotic
proteins such as caspase-8, which are recruited to the mitochondrial surface. Caspase-8 cleaves Bid to a
truncated form (tBid), which induces Bax/Bak oligometization thereby permeabilizing the membrane and
releasing cytochrome c.
AV, autophagic vacuole; cyt c, cytochrome c; IMS, intermembrane space; IMM, inner mitochondrial membrane;
OMM, outer mitochondrial membrane.
by guest on January 15, 2017http://hm
g.oxfordjournals.org/D
ownloaded from
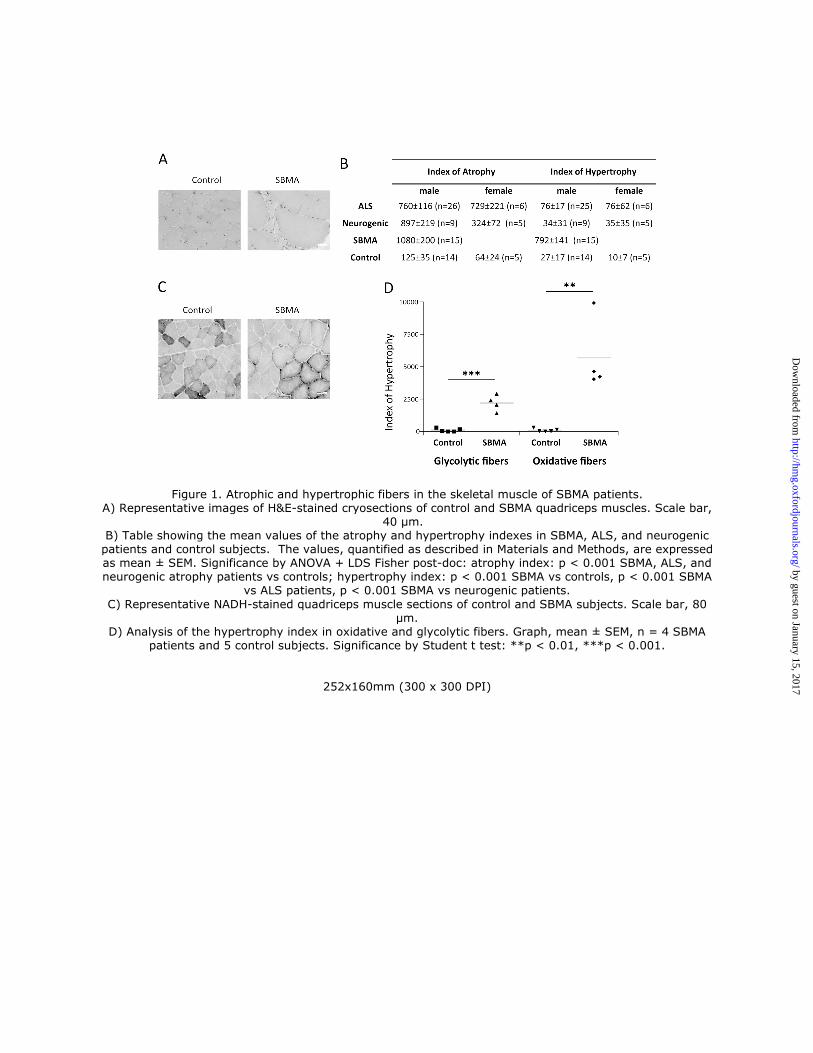
Figure 1. Atrophic and hypertrophic fibers in the skeletal muscle of SBMA patients. A) Representative images of H&E-stained cryosections of control and SBMA quadriceps muscles. Scale bar,
40 µm. B) Table showing the mean values of the atrophy and hypertrophy indexes in SBMA, ALS, and neurogenic patients and control subjects. The values, quantified as described in Materials and Methods, are expressed as mean ± SEM. Significance by ANOVA + LDS Fisher post-doc: atrophy index: p < 0.001 SBMA, ALS, and neurogenic atrophy patients vs controls; hypertrophy index: p < 0.001 SBMA vs controls, p < 0.001 SBMA
vs ALS patients, p < 0.001 SBMA vs neurogenic patients.
C) Representative NADH-stained quadriceps muscle sections of control and SBMA subjects. Scale bar, 80 µm.
D) Analysis of the hypertrophy index in oxidative and glycolytic fibers. Graph, mean ± SEM, n = 4 SBMA patients and 5 control subjects. Significance by Student t test: **p < 0.01, ***p < 0.001.
252x160mm (300 x 300 DPI)
by guest on January 15, 2017http://hm
g.oxfordjournals.org/D
ownloaded from
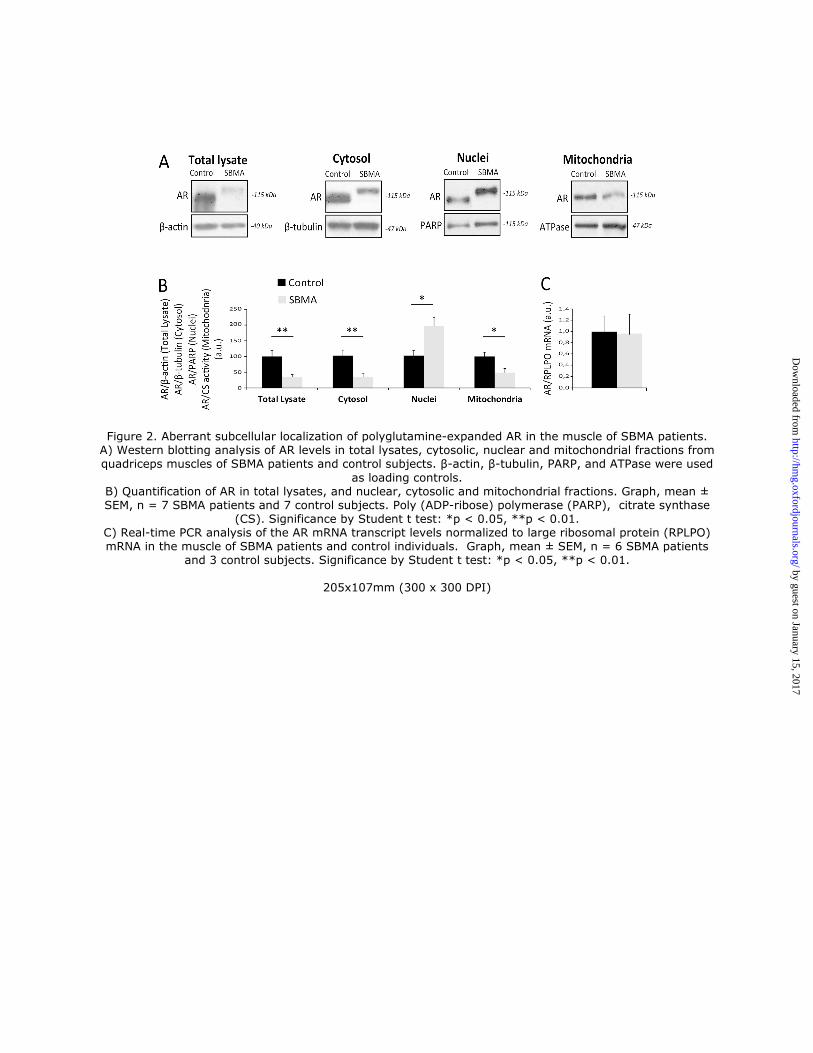
Figure 2. Aberrant subcellular localization of polyglutamine-expanded AR in the muscle of SBMA patients. A) Western blotting analysis of AR levels in total lysates, cytosolic, nuclear and mitochondrial fractions from quadriceps muscles of SBMA patients and control subjects. β-actin, β-tubulin, PARP, and ATPase were used
as loading controls. B) Quantification of AR in total lysates, and nuclear, cytosolic and mitochondrial fractions. Graph, mean ± SEM, n = 7 SBMA patients and 7 control subjects. Poly (ADP-ribose) polymerase (PARP), citrate synthase
(CS). Significance by Student t test: *p < 0.05, **p < 0.01. C) Real-time PCR analysis of the AR mRNA transcript levels normalized to large ribosomal protein (RPLPO) mRNA in the muscle of SBMA patients and control individuals. Graph, mean ± SEM, n = 6 SBMA patients
and 3 control subjects. Significance by Student t test: *p < 0.05, **p < 0.01.
205x107mm (300 x 300 DPI)
by guest on January 15, 2017http://hm
g.oxfordjournals.org/D
ownloaded from
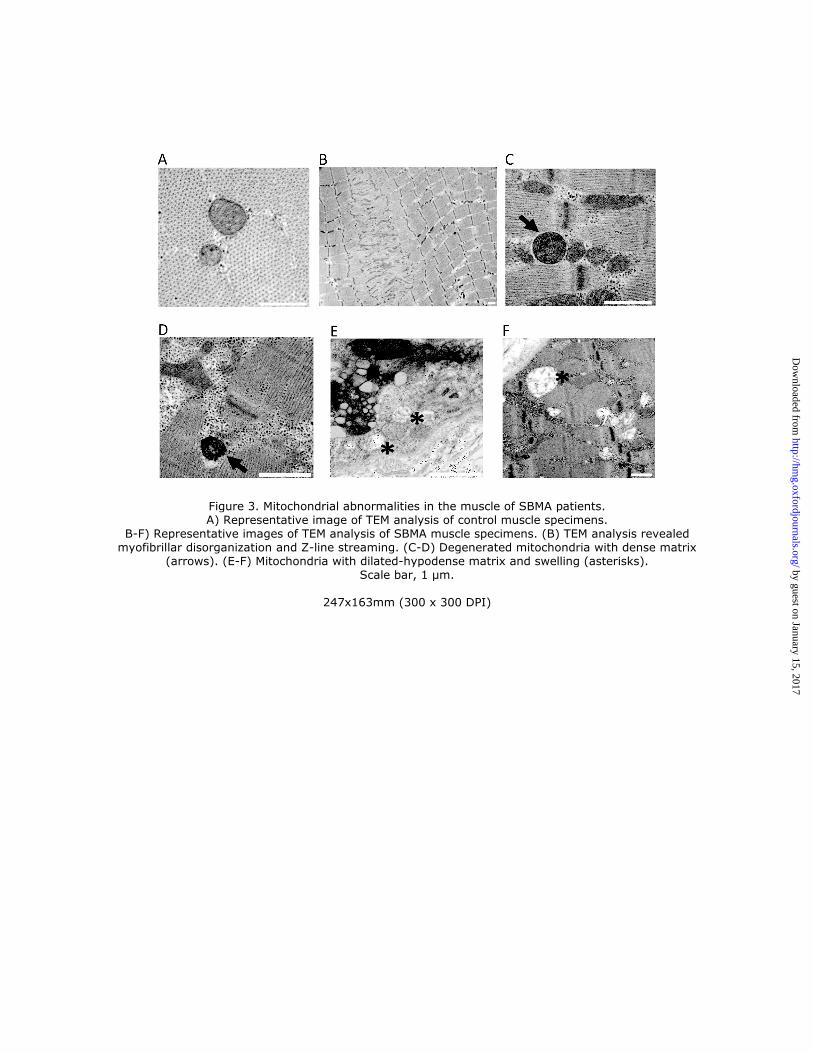
Figure 3. Mitochondrial abnormalities in the muscle of SBMA patients. A) Representative image of TEM analysis of control muscle specimens.
B-F) Representative images of TEM analysis of SBMA muscle specimens. (B) TEM analysis revealed myofibrillar disorganization and Z-line streaming. (C-D) Degenerated mitochondria with dense matrix
(arrows). (E-F) Mitochondria with dilated-hypodense matrix and swelling (asterisks). Scale bar, 1 µm.
247x163mm (300 x 300 DPI)
by guest on January 15, 2017http://hm
g.oxfordjournals.org/D
ownloaded from
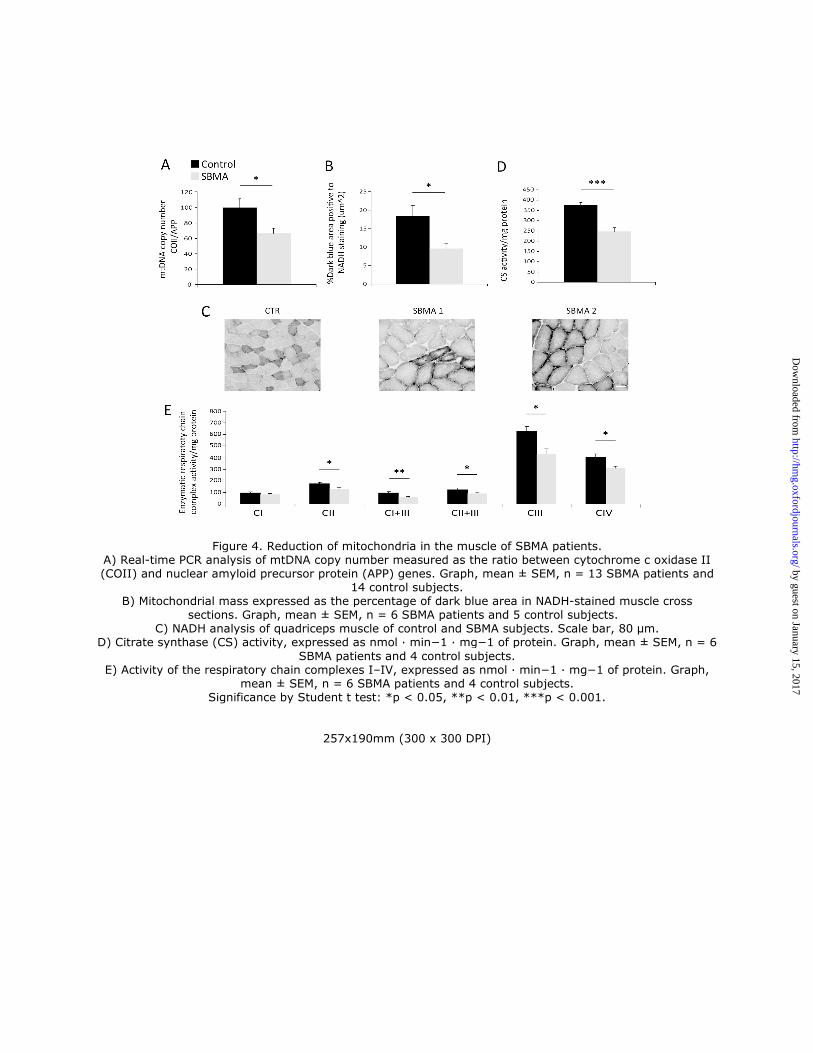
Figure 4. Reduction of mitochondria in the muscle of SBMA patients. A) Real-time PCR analysis of mtDNA copy number measured as the ratio between cytochrome c oxidase II (COII) and nuclear amyloid precursor protein (APP) genes. Graph, mean ± SEM, n = 13 SBMA patients and
14 control subjects. B) Mitochondrial mass expressed as the percentage of dark blue area in NADH-stained muscle cross
sections. Graph, mean ± SEM, n = 6 SBMA patients and 5 control subjects. C) NADH analysis of quadriceps muscle of control and SBMA subjects. Scale bar, 80 µm.
D) Citrate synthase (CS) activity, expressed as nmol ∙ min−1 ∙ mg−1 of protein. Graph, mean ± SEM, n = 6
SBMA patients and 4 control subjects. E) Activity of the respiratory chain complexes I–IV, expressed as nmol ∙ min−1 ∙ mg−1 of protein. Graph,
mean ± SEM, n = 6 SBMA patients and 4 control subjects. Significance by Student t test: *p < 0.05, **p < 0.01, ***p < 0.001.
257x190mm (300 x 300 DPI)
by guest on January 15, 2017http://hm
g.oxfordjournals.org/D
ownloaded from
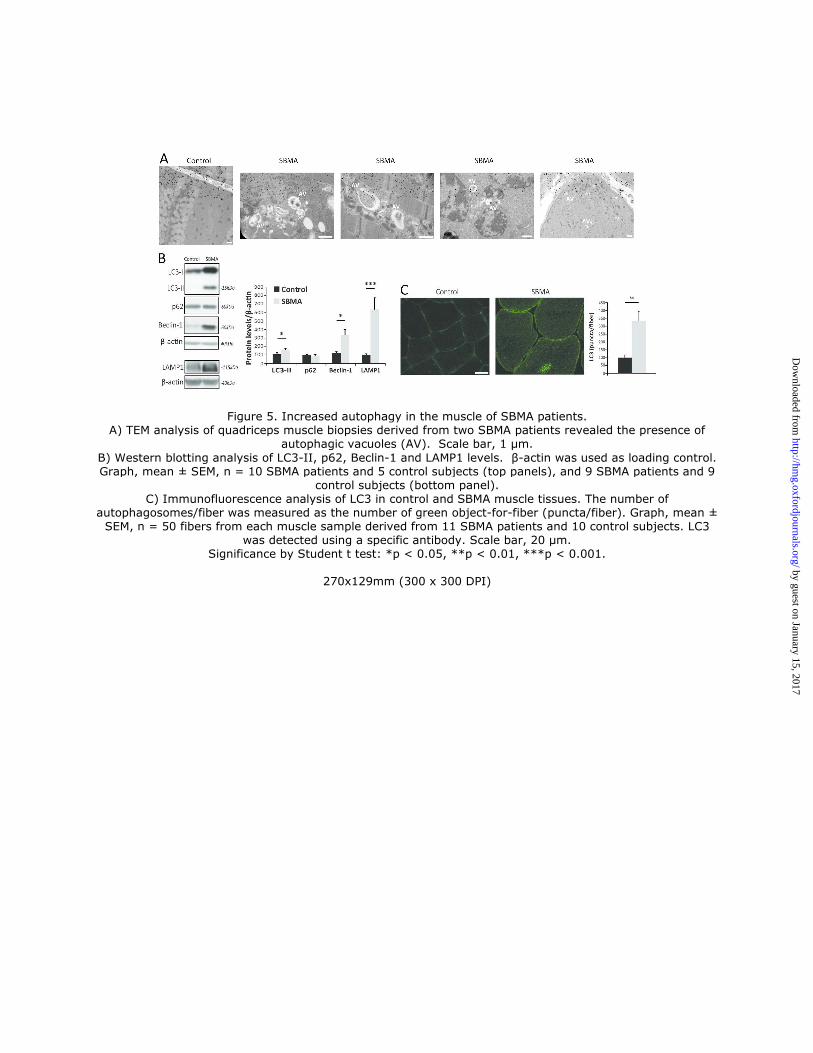
Figure 5. Increased autophagy in the muscle of SBMA patients. A) TEM analysis of quadriceps muscle biopsies derived from two SBMA patients revealed the presence of
autophagic vacuoles (AV). Scale bar, 1 µm.
B) Western blotting analysis of LC3-II, p62, Beclin-1 and LAMP1 levels. β-actin was used as loading control. Graph, mean ± SEM, n = 10 SBMA patients and 5 control subjects (top panels), and 9 SBMA patients and 9
control subjects (bottom panel). C) Immunofluorescence analysis of LC3 in control and SBMA muscle tissues. The number of
autophagosomes/fiber was measured as the number of green object-for-fiber (puncta/fiber). Graph, mean ± SEM, n = 50 fibers from each muscle sample derived from 11 SBMA patients and 10 control subjects. LC3
was detected using a specific antibody. Scale bar, 20 µm. Significance by Student t test: *p < 0.05, **p < 0.01, ***p < 0.001.
270x129mm (300 x 300 DPI)
by guest on January 15, 2017http://hm
g.oxfordjournals.org/D
ownloaded from
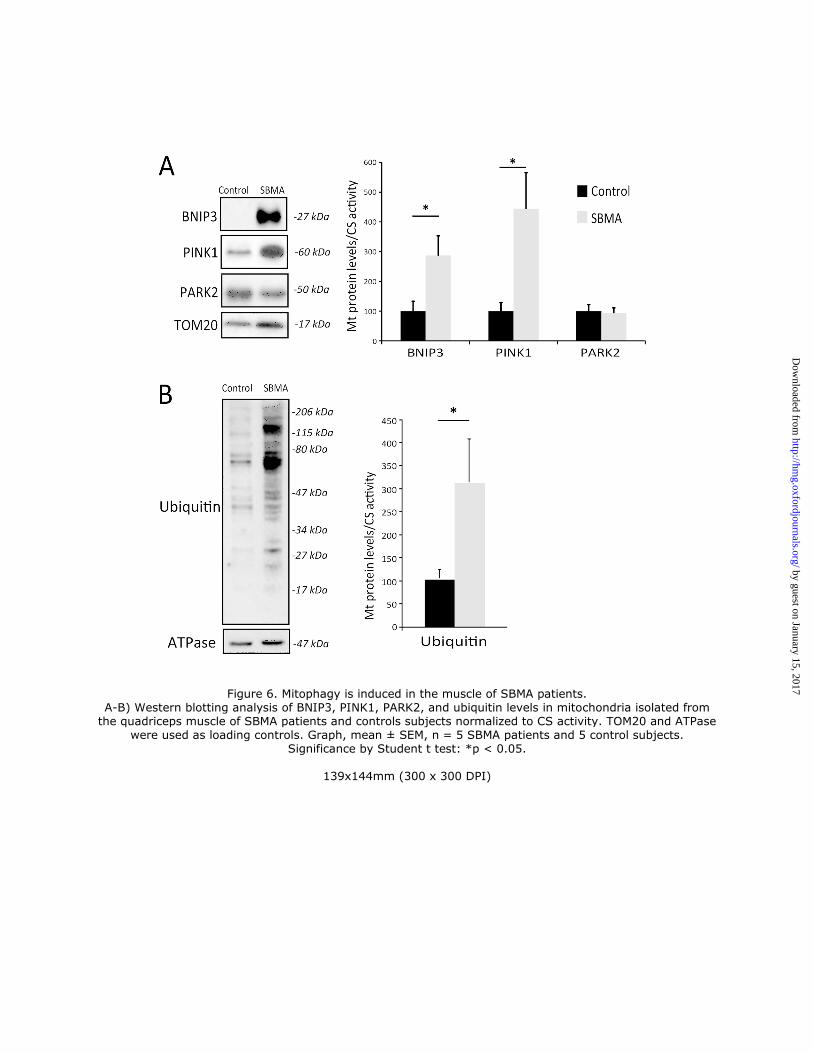
Figure 6. Mitophagy is induced in the muscle of SBMA patients. A-B) Western blotting analysis of BNIP3, PINK1, PARK2, and ubiquitin levels in mitochondria isolated from
the quadriceps muscle of SBMA patients and controls subjects normalized to CS activity. TOM20 and ATPase were used as loading controls. Graph, mean ± SEM, n = 5 SBMA patients and 5 control subjects.
Significance by Student t test: *p < 0.05.
139x144mm (300 x 300 DPI)
by guest on January 15, 2017http://hm
g.oxfordjournals.org/D
ownloaded from
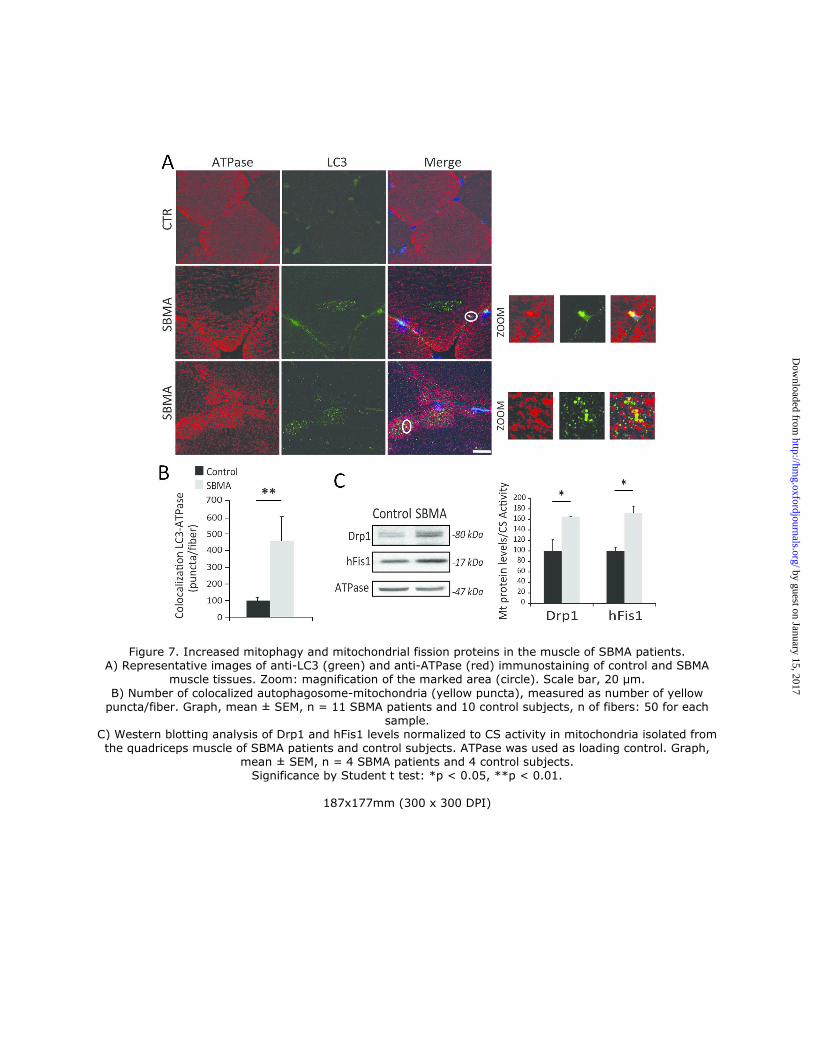
Figure 7. Increased mitophagy and mitochondrial fission proteins in the muscle of SBMA patients. A) Representative images of anti-LC3 (green) and anti-ATPase (red) immunostaining of control and SBMA
muscle tissues. Zoom: magnification of the marked area (circle). Scale bar, 20 µm.
B) Number of colocalized autophagosome-mitochondria (yellow puncta), measured as number of yellow puncta/fiber. Graph, mean ± SEM, n = 11 SBMA patients and 10 control subjects, n of fibers: 50 for each
sample. C) Western blotting analysis of Drp1 and hFis1 levels normalized to CS activity in mitochondria isolated from the quadriceps muscle of SBMA patients and control subjects. ATPase was used as loading control. Graph,
mean ± SEM, n = 4 SBMA patients and 4 control subjects. Significance by Student t test: *p < 0.05, **p < 0.01.
187x177mm (300 x 300 DPI)
by guest on January 15, 2017http://hm
g.oxfordjournals.org/D
ownloaded from
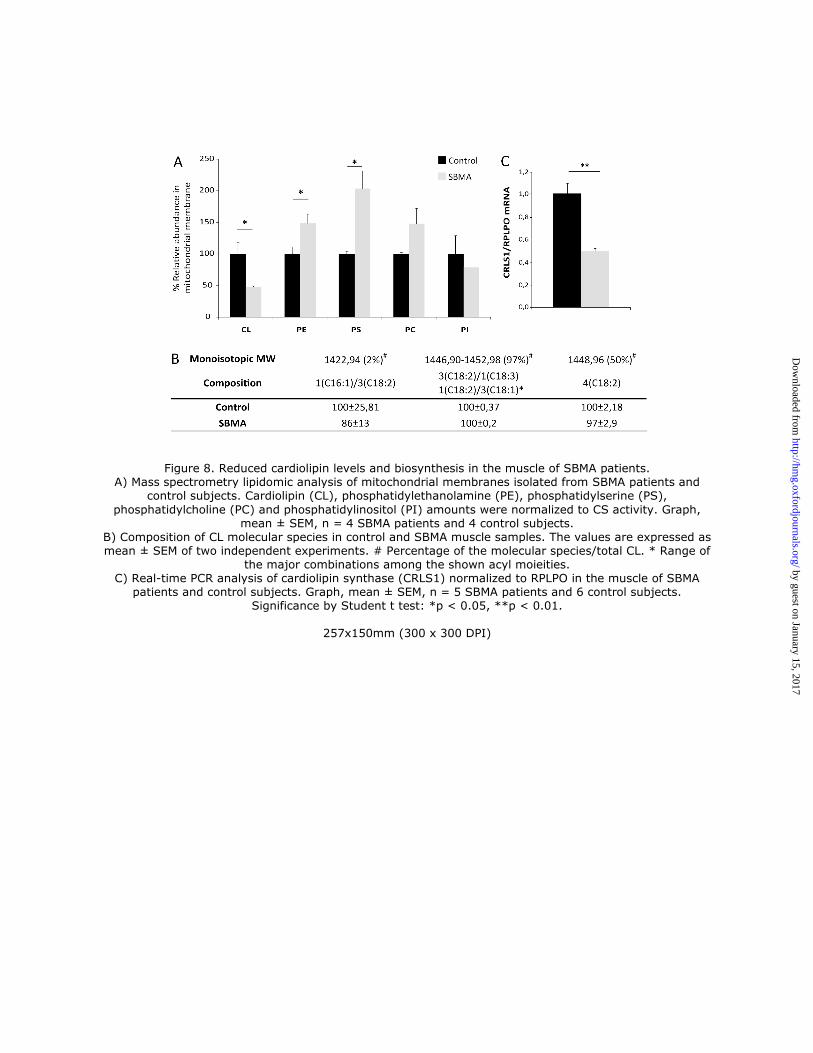
Figure 8. Reduced cardiolipin levels and biosynthesis in the muscle of SBMA patients. A) Mass spectrometry lipidomic analysis of mitochondrial membranes isolated from SBMA patients and
control subjects. Cardiolipin (CL), phosphatidylethanolamine (PE), phosphatidylserine (PS),
phosphatidylcholine (PC) and phosphatidylinositol (PI) amounts were normalized to CS activity. Graph, mean ± SEM, n = 4 SBMA patients and 4 control subjects.
B) Composition of CL molecular species in control and SBMA muscle samples. The values are expressed as mean ± SEM of two independent experiments. # Percentage of the molecular species/total CL. * Range of
the major combinations among the shown acyl moieities. C) Real-time PCR analysis of cardiolipin synthase (CRLS1) normalized to RPLPO in the muscle of SBMA
patients and control subjects. Graph, mean ± SEM, n = 5 SBMA patients and 6 control subjects. Significance by Student t test: *p < 0.05, **p < 0.01.
257x150mm (300 x 300 DPI)
by guest on January 15, 2017http://hm
g.oxfordjournals.org/D
ownloaded from
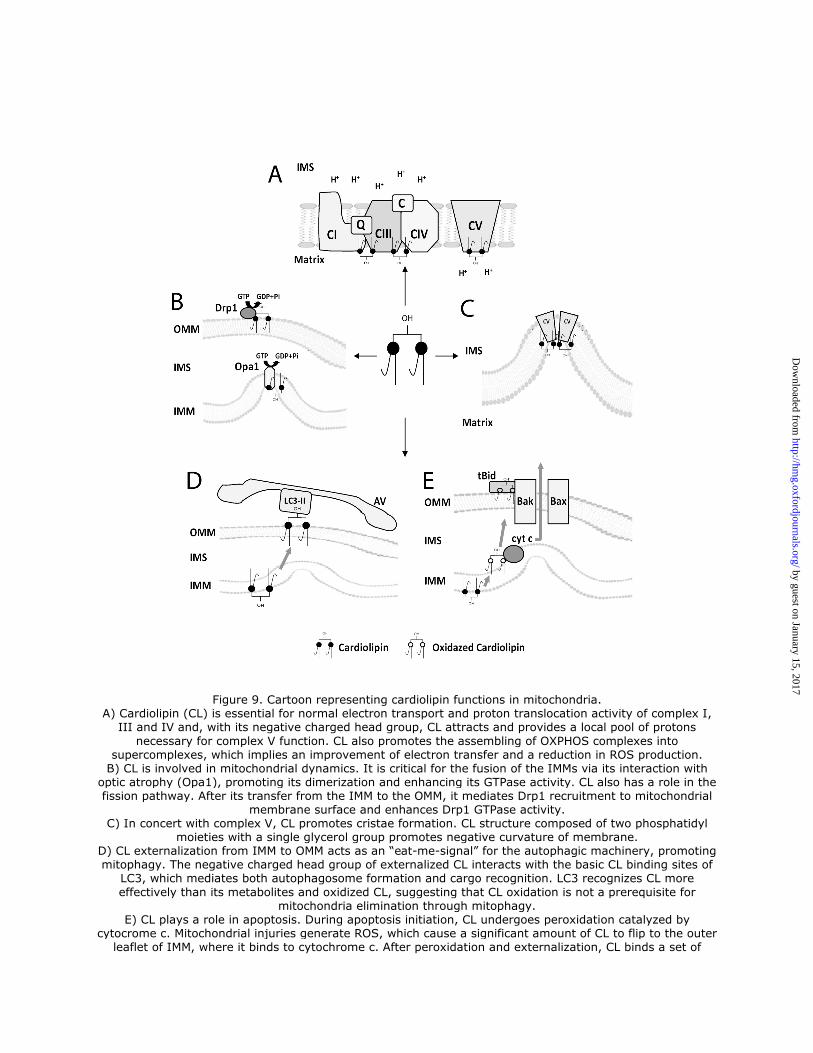
Figure 9. Cartoon representing cardiolipin functions in mitochondria. A) Cardiolipin (CL) is essential for normal electron transport and proton translocation activity of complex I,
III and IV and, with its negative charged head group, CL attracts and provides a local pool of protons
necessary for complex V function. CL also promotes the assembling of OXPHOS complexes into supercomplexes, which implies an improvement of electron transfer and a reduction in ROS production. B) CL is involved in mitochondrial dynamics. It is critical for the fusion of the IMMs via its interaction with
optic atrophy (Opa1), promoting its dimerization and enhancing its GTPase activity. CL also has a role in the fission pathway. After its transfer from the IMM to the OMM, it mediates Drp1 recruitment to mitochondrial
membrane surface and enhances Drp1 GTPase activity. C) In concert with complex V, CL promotes cristae formation. CL structure composed of two phosphatidyl
moieties with a single glycerol group promotes negative curvature of membrane. D) CL externalization from IMM to OMM acts as an “eat-me-signal” for the autophagic machinery, promoting mitophagy. The negative charged head group of externalized CL interacts with the basic CL binding sites of
LC3, which mediates both autophagosome formation and cargo recognition. LC3 recognizes CL more
effectively than its metabolites and oxidized CL, suggesting that CL oxidation is not a prerequisite for mitochondria elimination through mitophagy.
E) CL plays a role in apoptosis. During apoptosis initiation, CL undergoes peroxidation catalyzed by cytocrome c. Mitochondrial injuries generate ROS, which cause a significant amount of CL to flip to the outer
leaflet of IMM, where it binds to cytochrome c. After peroxidation and externalization, CL binds a set of
by guest on January 15, 2017http://hm
g.oxfordjournals.org/D
ownloaded from

apoptotic proteins such as caspase-8, which are recruited to the mitochondrial surface. Caspase-8 cleaves Bid to a truncated form (tBid), which induces Bax/Bak oligometization thereby permeabilizing the membrane
and releasing cytochrome c. AV, autophagic vacuole; cyt c, cytochrome c; IMS, intermembrane space; IMM, inner mitochondrial
membrane; OMM, outer mitochondrial membrane.
180x189mm (300 x 300 DPI)
by guest on January 15, 2017http://hm
g.oxfordjournals.org/D
ownloaded from