Incorporating Assessment, Inventory and Monitoring (AIM...
41
Transcript of Incorporating Assessment, Inventory and Monitoring (AIM...


Incorporating Assessment, Inventory and Monitoring (AIM) for Monitoring Fuels Project Effectiveness
BLM Guidebook 11/27/2018 Attachment 1-1

Incorporating Assessment, Inventory and Monitoring (AIM) for Monitoring Fuels Project Effectiveness
BLM Guidebook 11/27/2018 Attachment 1-2
Table of Contents
Purpose 4
Introduction and Background 4
Fuels Program Monitoring Overview 4
AIM Strategy Background and Overview 4
Terrestrial AIM Core Indicators and Methods 5
Fuels Program AIM Incorporation 6
Benefits of Incorporating AIM in Fuels Management and Monitoring 7
Benefits of Collecting All of the AIM Core Indicators 7
Adaptive Management 8
Designing Fuels/Vegetation Treatment Monitoring Activities 8
Fuels Monitoring Design Worksheet 8
Management Objectives 9
Project/Treatment Objectives and Benchmarks 9
Indicators and Methods 10
Consistency in Measurements 10
Relationship of Objectives, Benchmarks, Indicators & Methods 10
Using Existing AIM Data 11
Selecting Indicators and Methods 12
Modifications to AIM Methods 15
Use of Other (non-AIM) Data Sources 15
Sample Design Guidelines 15
Implementation Rules 16
Data Management 17
Analysis and Reporting 19
Developing a Project Level Program of Work (POW) 20
Monitoring Activities as Part of the Fuels Program of Work 20
Coordination of Monitoring Activities 20
Monitoring Crew Coordination 21
AIM Training 21
Costs 21

Incorporating Assessment, Inventory and Monitoring (AIM) for Monitoring Fuels Project Effectiveness
BLM Guidebook 11/27/2018 Attachment 1-3
Definitions 22
Appendices
Appendix 1: Fuels Monitoring Design Worksheet Instructions 25
Appendix 1A: Fuels Monitoring Design Worksheet Template 35
Appendix 2: AIM Modifications 39
Appendix 3: Ensuring Consistency in Measurements 40

Incorporating Assessment, Inventory and Monitoring (AIM) for Monitoring Fuels Project Effectiveness
BLM Guidebook 11/27/2018 Attachment 1-4
Purpose This purpose of this document is to provide direction for monitoring fuels program vegetation treatments using Assessment, Inventory and Monitoring (AIM) standards, principles and practices.
Introduction and Background The Bureau of Land Management (BLM) Fuels Management and Renewable Resources Programs are integrating to deliver a comprehensive vegetation management approach. This integration will allow BLM’s varied programs to achieve the common goal of protecting, maintaining and restoring ecologically diverse native plant communities on America’s public lands. The BLM has developed the Assessment, Inventory and Monitoring (AIM) Strategy to establish a consistent framework for collecting monitoring data that is compatible across scales, programs, and administrative boundaries. Data collected in accordance with the AIM Strategy provides reliable, quantitative information that can be used repeatedly to direct defensible management decisions. Consistent data collection methods increase efficiency across programs by providing common interpretation. Consistent data sets can be combined from more than one sampling effort to provide more information for assessments and decisions.
Vegetation information and monitoring data are required to effectively plan and implement vegetation treatments and subsequently to determine whether project and treatment objectives have been achieved. However, monitoring programs and practices vary widely across fuels programs in each state. Practices may also differ from methods used by natural resources programs within a management unit. Increasing the consistency of vegetation treatment monitoring through incorporation of the AIM strategy will enable managers to utilize existing AIM data when developing projects, share data collected by both fuels and natural resources programs, and identify efficiencies, such as sharing monitoring crews between fuels and other programs. Fuels Program Monitoring Overview The BLM policies require all field units with fuels management programs to monitor and report on the treatment effectiveness.1 Specifically, the fuels program collects pre-treatment vegetation data to ascertain baseline conditions needed to develop project proposals, comply with project-level NEPA, develop project and treatment objectives, and define fire behavior parameters in cases of prescribed fire. The goal of post treatment fuels and vegetation treatment monitoring is to determine if the treatments are meeting objectives outlined in NEPA/decision documents and project plans.
AIM Strategy Background and Overview The AIM strategy was developed to improve the effectiveness of BLM’s monitoring activities. AIM provides a standardized process for collecting quantitative information on the status, condition, trend, amount, location, and spatial pattern of natural resources on the nation’s public
1 M-9214-1 Fuels Management and Community Assistance Handbook, 2016

Incorporating Assessment, Inventory and Monitoring (AIM) for Monitoring Fuels Project Effectiveness
BLM Guidebook 11/27/2018 Attachment 1-5
lands. AIM provides information for managers to make informed decisions on how BLM activities meet resource management objectives. The AIM strategy provides five key BLM monitoring principles:
1. A standard set of core quantitative indicators and methods, enabling easy comparison of measurements in different locations and over time.
2. A defensible and statistically valid plot monitoring selection process that informs levels of land management.
3. Integration with remote sensing, providing an overall view of conditions across the landscape.
4. Universal electronic data capture and management standards that will streamline information access and its application to management decisions.
5. A structured implementation process built on management questions and ecosystem knowledge.
The AIM program includes terrestrial and aquatic components. Guidance presented in this document focuses on incorporating terrestrial AIM methods and protocols when monitoring vegetation treatments. Vegetation treatments requiring monitoring of perennial streams or rivers should review and incorporate components of aquatic AIM as appropriate. Information about Aquatic AIM methods and indicators can be found in the BLM AIM National Aquatic Monitoring Framework Protocol for Wadeable, Lotic Systems (Technical Reference 1735-2).. The AIM represents one of the most extensive and publicly available plot measurement datasets across Western U.S. federal lands. This enables integration with remotely sensed imagery and other geospatial information for a range of analysis, classification, and validation purposes.
Since 2011, the BLM has collected field information from terrestrial and aquatic AIM field plots, with new plots established every year. The BLM AIM databases, known as Terrestrial AIM Data Base (TerrADat) and Aquatic AIM Database (AquADat) are updated annually. These databases are accessible internally and externally.
Standardized core indicators that are ecologically relevant and tied to rangeland health are collected at each plot. These indicators inform biotic integrity and soil and site stability. The terrestrial core indicators include vegetation height and composition; ground cover; non-native plant species; species of management concern; species richness; and canopy gap. Soils and plot characteristics are also described.
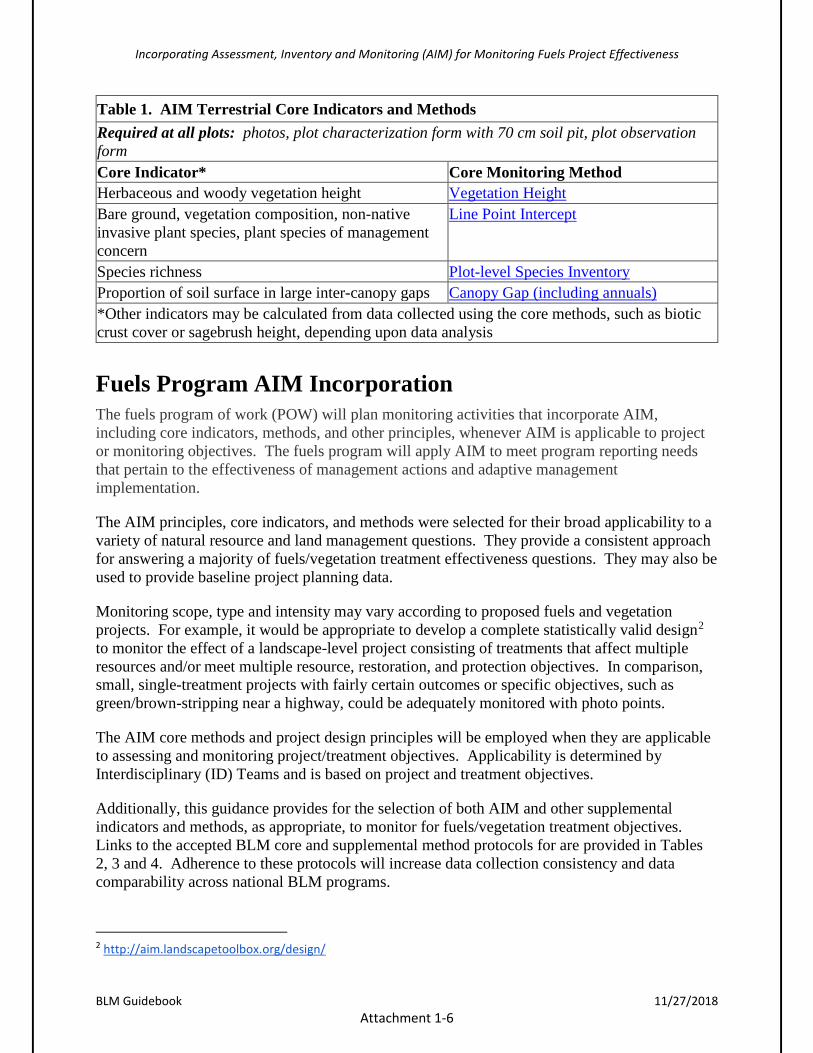
Terrestrial AIM Core Indicators and Methods Table 1 summarizes the AIM Terrestrial Core Indicators and Methods. Table 2 (on page 11) provides more detail on how the core indicators and methods relate to common fuels treatment objectives.
Incorporating Assessment, Inventory and Monitoring (AIM) for Monitoring Fuels Project Effectiveness
BLM Guidebook 11/27/2018 Attachment 1-6
Table 1. AIM Terrestrial Core Indicators and Methods Required at all plots: photos, plot characterization form with 70 cm soil pit, plot observation form Core Indicator* Core Monitoring Method Herbaceous and woody vegetation height Vegetation Height Bare ground, vegetation composition, non-native invasive plant species, plant species of management concern
Line Point Intercept
Species richness Plot-level Species Inventory Proportion of soil surface in large inter-canopy gaps Canopy Gap (including annuals) *Other indicators may be calculated from data collected using the core methods, such as biotic crust cover or sagebrush height, depending upon data analysis
Fuels Program AIM Incorporation The fuels program of work (POW) will plan monitoring activities that incorporate AIM, including core indicators, methods, and other principles, whenever AIM is applicable to project or monitoring objectives. The fuels program will apply AIM to meet program reporting needs that pertain to the effectiveness of management actions and adaptive management implementation.
The AIM principles, core indicators, and methods were selected for their broad applicability to a variety of natural resource and land management questions. They provide a consistent approach for answering a majority of fuels/vegetation treatment effectiveness questions. They may also be used to provide baseline project planning data.
Monitoring scope, type and intensity may vary according to proposed fuels and vegetation projects. For example, it would be appropriate to develop a complete statistically valid design2 to monitor the effect of a landscape-level project consisting of treatments that affect multiple resources and/or meet multiple resource, restoration, and protection objectives. In comparison, small, single-treatment projects with fairly certain outcomes or specific objectives, such as green/brown-stripping near a highway, could be adequately monitored with photo points.
The AIM core methods and project design principles will be employed when they are applicable to assessing and monitoring project/treatment objectives. Applicability is determined by Interdisciplinary (ID) Teams and is based on project and treatment objectives.
Additionally, this guidance provides for the selection of both AIM and other supplemental indicators and methods, as appropriate, to monitor for fuels/vegetation treatment objectives. Links to the accepted BLM core and supplemental method protocols for are provided in Tables 2, 3 and 4. Adherence to these protocols will increase data collection consistency and data comparability across national BLM programs.
2 http://aim.landscapetoolbox.org/design/
Incorporating Assessment, Inventory and Monitoring (AIM) for Monitoring Fuels Project Effectiveness
BLM Guidebook 11/27/2018 Attachment 1-7
Incorporating AIM indicators and methods into fuels project assessment and monitoring requires coordination at all office levels. District and field office AIM coordinators and fuels specialists should begin coordinating assessment and monitoring needs during the fuels project/treatment ID Team planning process. The AIM and fuels program state leads should coordinate activities and associated assessment and monitoring needs (i.e. funding, sample design needs, monitoring crew coordination, etc.) during the state’s fuels POW development process.
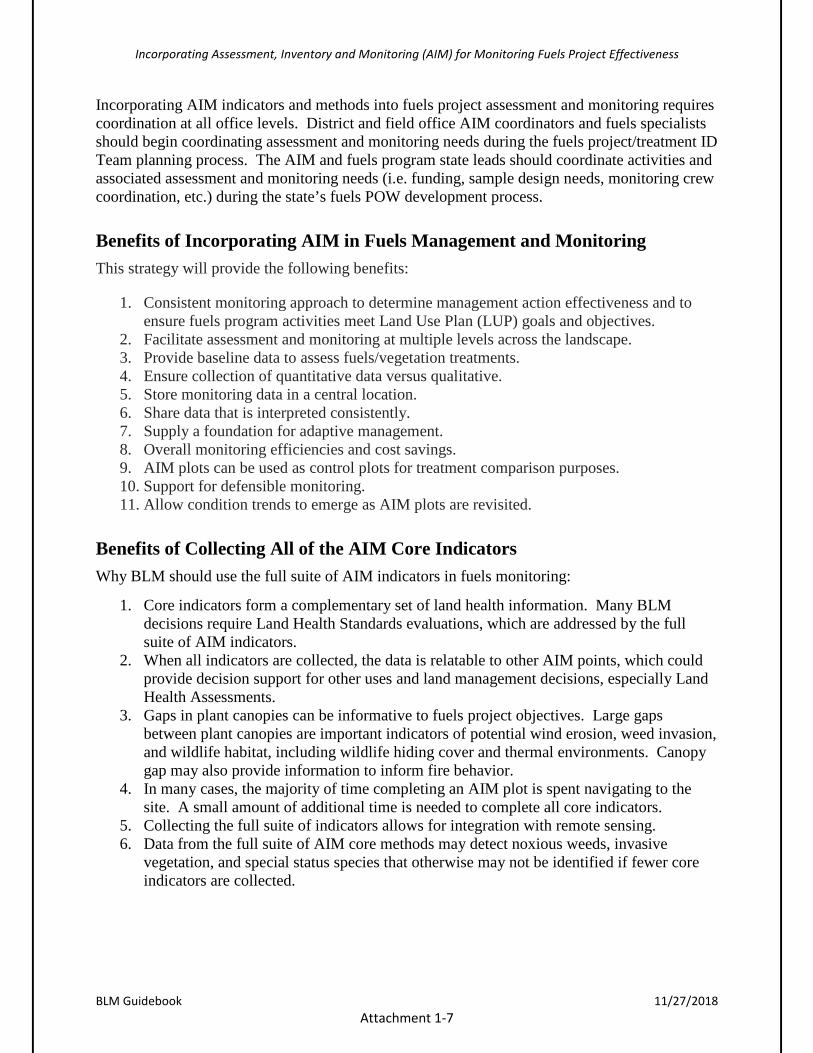
Benefits of Incorporating AIM in Fuels Management and Monitoring This strategy will provide the following benefits:
1. Consistent monitoring approach to determine management action effectiveness and to ensure fuels program activities meet Land Use Plan (LUP) goals and objectives.
2. Facilitate assessment and monitoring at multiple levels across the landscape. 3. Provide baseline data to assess fuels/vegetation treatments. 4. Ensure collection of quantitative data versus qualitative. 5. Store monitoring data in a central location. 6. Share data that is interpreted consistently. 7. Supply a foundation for adaptive management. 8. Overall monitoring efficiencies and cost savings. 9. AIM plots can be used as control plots for treatment comparison purposes. 10. Support for defensible monitoring. 11. Allow condition trends to emerge as AIM plots are revisited.
Benefits of Collecting All of the AIM Core Indicators Why BLM should use the full suite of AIM indicators in fuels monitoring:
1. Core indicators form a complementary set of land health information. Many BLM decisions require Land Health Standards evaluations, which are addressed by the full suite of AIM indicators.
2. When all indicators are collected, the data is relatable to other AIM points, which could provide decision support for other uses and land management decisions, especially Land Health Assessments.
3. Gaps in plant canopies can be informative to fuels project objectives. Large gaps between plant canopies are important indicators of potential wind erosion, weed invasion, and wildlife habitat, including wildlife hiding cover and thermal environments. Canopy gap may also provide information to inform fire behavior.
4. In many cases, the majority of time completing an AIM plot is spent navigating to the site. A small amount of additional time is needed to complete all core indicators.
5. Collecting the full suite of indicators allows for integration with remote sensing. 6. Data from the full suite of AIM core methods may detect noxious weeds, invasive
vegetation, and special status species that otherwise may not be identified if fewer core indicators are collected.

Incorporating Assessment, Inventory and Monitoring (AIM) for Monitoring Fuels Project Effectiveness
BLM Guidebook 11/27/2018 Attachment 1-8
Adaptive Management The AIM Strategy provides consistent data to determine the effectiveness of treatments and to identify appropriate adaptive management actions. Consistently collected data can be aggregated for analysis; therefore, this data can help guide adaptive planning and implementation adjustments at the treatment, project, LUP and/or national program levels. Any adaptive management changes are subject to the appropriate environmental analysis.
Designing Fuels/Vegetation Treatment Monitoring Activities Fuels Monitoring Design Worksheet Monitoring fuels/vegetation treatments using AIM starts with developing the Fuels Monitoring Design Worksheet (FMDW) to determine the level of monitoring required (see Figure 1). The FMDW (Appendix 1A) should be completed when monitoring is required for a fuels-funded vegetation treatment project. The worksheet ensures a consistent approach to fuels/vegetation treatment assessment and monitoring, documenting the monitoring decision process(es), and reporting results. Use of the FMDW guides the incorporation of AIM principles and practices as appropriate to the project scale, complexity, and types of treatment objectives. The workflow for completing the FMDW is provided in FMDW Instructions (Appendix 1). Complex projects involving multiple treatment types, treatment areas, or timeframes may use more than one FMDW.
The scope, type, and frequency of monitoring required depends on the developed monitoring objectives based on the project and treatment objectives. Clearly articulating the treatment objectives, and tying them to indicators and monitoring questions, will assist in selecting the most suitable monitoring methods. This will also determine an appropriate monitoring schedule for both short and long-term objectives.
Interdisciplinary (ID) Teams will participate in developing assessment and monitoring plans for fuels/vegetation treatments so that the data collected can identify the full range of resource objectives. Fieldwork can then be planned most efficiently to meet monitoring needs across programs (see H-9214-1). Additional monitoring project design guidance is available from the AIM Landscape Toolbox Website: http://aim.landscapetoolbox.org/design/.
The FMDW will become part of the project file and should be located with the project/treatment implementation plan (i.e. mechanical treatment plan, prescribed fire plan, etc.).

Incorporating Assessment, Inventory and Monitoring (AIM) for Monitoring Fuels Project Effectiveness
BLM Guidebook 11/27/2018 Attachment 1-9
Figure 1: Basic Monitoring Design Workflow (for more detailed workflow see Appendix 1).
Management Objectives Management objectives are the overarching goals that drive fuels/vegetation project and treatment implementation. Management objectives are found in Land Use Plans (LUP) as well as the Fundamentals of Rangeland Health (43 CFR 4180), state Rangeland Health Standards and Guidelines, Fire Management Plans (FMPs), Community Wildfire Protection Plans (CWPPs), weeds management plans, and other land management decision documents.
Project/Treatment Objectives and Benchmarks A fuels project is a planned series of vegetation treatments that involve one or more treatment units with specific treatment objectives identified. Project and treatment objectives are site-specific and designed to support the identified management objectives. Benchmarks are a key component of every monitoring objective. Benchmarks are indicator values, or ranges of values, that establish desired, meaningful conditions or identify when an adaptive management action should be taken. Benchmarks are used to compare observed indicator values at assessed points (i.e., monitoring sites or plots) to desired conditions, or conditions under which adaptive management is needed.
In complex projects that include a variety of treatment types, it may be necessary to define the project objective(s) and each treatment’s objective(s) separately. Simpler projects may consist of just one or two treatments with consistent objectives.

Incorporating Assessment, Inventory and Monitoring (AIM) for Monitoring Fuels Project Effectiveness
BLM Guidebook 11/27/2018 Attachment 1-10
Indicators and Methods The project and/or treatment objectives and benchmarks will guide selection of appropriate indicators and methods to assess and monitor the project/treatment(s). Indicators are measurable and observable elements that are affected by the treatments being applied. They help to determine whether project/treatment objectives have been achieved. Methods are the actual field protocols used to measure each indicator. A list of AIM core methods and other acceptable indicator measurements are included in Tables 2, 3 and 4. Select the AIM core methods and indicators needed to determine if project/treatment objectives have been met. If all AIM core indicators are not used, data may still be input into the AIM data set as long as other data quality requirements are met (see Terrestrial AIM Data Management Protocol, and Appendix 3; TerraDat Decision Tree).
Measurement Consistency
When selecting monitoring methods, analyzing data, or comparing datasets, it is important to understand how differing methodologies, protocols, and implementation rules can influence indicator measurement calculations. Comparing data collected using different methods or protocols can lead to incorrect conclusions and misinformed management decisions. Therefore, it is important to follow established methodologies consistently and document rulesets and other details to ensure appropriate data analyzation and interpretation (see Appendix 3 for further discussion on measurement consistency).
Relationships Between Objectives, Benchmarks, Indicators & Methods Two examples relating project objectives, benchmarks, indicators and methods are provided below:
Example 1: A large landscape-scale prescribed fire is proposed with the management objective of restoring ecosystem function and improving Greater Sage-Grouse habitat by removing juniper from sagebrush ecological sites. Supplemental herbicide treatments may be applied to control annual grasses following the prescribed fire. The project treatment objectives and benchmarks are:
1. Reduce live juniper cover to less than1 percent in the year following initial treatment. 2. Increase perennial grass foliar cover to more than 20 percent five years following initial
treatment. 3. Reduce mean canopy gap size between sagebrush plants from 100 cm to less than 50 cm
five years following initial treatment. 4. Increase soil surface stability values from 3.0 to more than 5.0 five years following initial
treatment 5. Limit annual grass cover to less than 5 percent foliar cover annually following the
prescribed fire.

Incorporating Assessment, Inventory and Monitoring (AIM) for Monitoring Fuels Project Effectiveness
BLM Guidebook 11/27/2018 Attachment 1-11
In this example, the indicators include vegetation cover, canopy gap, and soil surface stability. The values for these indicators are calculated from data collected through the AIM core methods of line-point intercept, canopy gap, and the soil stability test. These indicator values are then compared to the established benchmark values to determine treatment effectiveness.
Example 2: A small linear fuel break has been implemented to support the sole management objective of reducing rates of spread and fire intensity and to protect a nearby community. The fuel break has a treatment objective of reducing vegetation cover annually during fire season, with a benchmark of less than10 percent vegetation cover.
In this example, due to the small size of the project and low investment involved, photo points and visual assessment(s) are adequate to determine treatment success. However, the AIM core method of Line Point Intercept (LPI) could be utilized to quantitatively measure vegetation cover if necessary. Collecting LPI data for this project would enable additional calculations such as bare ground and litter cover without additional fieldwork.
Using Existing AIM Data Use the Fuels Objectives and AIM Core and Supplemental Methods crosswalk tables (Tables 2, 3) to determine how the AIM core and supplemental indicators should be used to evaluate common vegetation treatment objectives.
Existing AIM data from within a planned project boundary, or from nearby, can be used as baseline data to determine pre-treatment conditions, assess variability, and estimate appropriate sample sizes within the project area. When AIM data has been collected following vegetation treatments, the data may be used to evaluate treatment effectiveness. Previously established AIM plots may need to be re-sampled to characterize conditions before and/or after treatment. It may be necessary to establish additional plots to achieve the necessary sample size.
The first step is to consider the existing data within each reporting unit (see FMDW instructions, Appendix 1, Step 3) and determine if the information seems appropriate, feasible, and defendable for the project. Be sure to include any planned data collection in this assessment.
To obtain AIM data, follow the instructions in the Accessing AIM Data instructions. For examples of how AIM data can be used, see AIM Data in Use. Sample sizes using plot data can be estimated using the Sampling Sufficiency for Landscape Monitoring Objectives tool. When AIM data plots are not available or there are no sufficient AIM plots established to meet monitoring objectives, it may be necessary to select additional monitoring locations. When possible, plots that have been selected as part of an existing AIM design may be incorporated into the project sample design for efficiency. If existing AIM plots will be re-visited, employees should work with a local AIM coordinator to efficiently use monitoring resources and ensure sampling schedules and methods are compatible to meet monitoring objectives for AIM, fuels, and other programs.

Incorporating Assessment, Inventory and Monitoring (AIM) for Monitoring Fuels Project Effectiveness
BLM Guidebook 11/27/2018 Attachment 1-12
Selecting Indicators and Methods Monitoring methods implemented for fuels/vegetation treatment effectiveness should be based upon treatment and monitoring objectives defined in the FMDW. Use Table 2 to select methods based on treatment and monitoring objectives. The AIM core methods listed in Table 2 are recommended for monitoring the listed treatment objective and should be used when they meet the objective(s) identified in the FMDW. Rationale should be documented in the FMDW when the core methods are not used and in cases when project scope or objectives do not require collection of quantitative data. Table 2. Fuels Objectives and AIM Core Methods
Treatment Objective Indicator AIM Core Method3
Modify target vegetation height Vegetation height Vegetation Height
Modify fuel continuity Vegetation gap size Vegetation cover
Canopy Gap* Line Point Intercept
Modify fuel amount Fuel cover Line Point Intercept Modify age and/or size class distribution
Vegetation height Vegetation Height
Modify cover or abundance of target vegetation or species
Vegetation cover Line Point Intercept
Increase and maintain species diversity
Species composition Species richness
Line Point Intercept Species inventory
Release understory vegetation Target spp. Mortality Vegetation cover
Line Point Intercept
Increase site stability Soil stability Bare Ground Vegetation continuity
Line Point Intercept Canopy Gap
*The AIM Core Method for canopy gap includes annuals as part of the vegetation canopy. Canopy gap including only perennials as part of the vegetation canopy is considered a supplemental AIM method.
When AIM core indicators and methods are insufficient to meet the identified monitoring objectives, first determine whether the needed supplemental indicators can be derived from the core methods. For example, plant basal cover can be calculated using line point intercept data. If the needed indicators cannot be derived from the core methods, the consistent supplemental methods listed in table 3 below are recommended for monitoring fuels/vegetation treatments.
3 Monitoring Manual for Grassland, Shrubland, and Savanna Ecosystems 2nd Edition, Volume 1, Core Methods.
Incorporating Assessment, Inventory and Monitoring (AIM) for Monitoring Fuels Project Effectiveness
BLM Guidebook 11/27/2018 Attachment 1-13
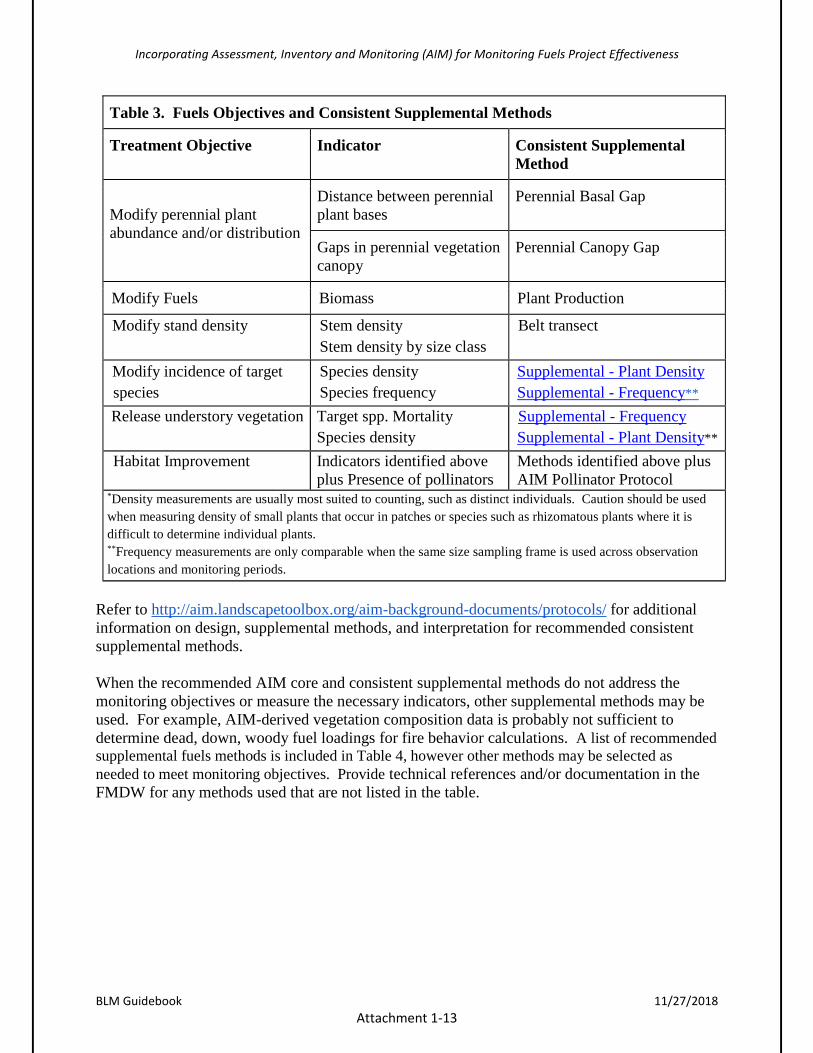
Table 3. Fuels Objectives and Consistent Supplemental Methods
Treatment Objective Indicator Consistent Supplemental Method
Modify perennial plant abundance and/or distribution
Distance between perennial plant bases
Perennial Basal Gap
Gaps in perennial vegetation canopy
Perennial Canopy Gap
Modify Fuels Biomass Plant Production
Modify stand density Stem density Stem density by size class
Belt transect
Modify incidence of target species
Species density Species frequency
Supplemental - Plant Density Supplemental - Frequency**
Release understory vegetation Target spp. Mortality Species density
Supplemental - Frequency Supplemental - Plant Density**
Habitat Improvement Indicators identified above plus Presence of pollinators
Methods identified above plus AIM Pollinator Protocol
*Density measurements are usually most suited to counting, such as distinct individuals. Caution should be used when measuring density of small plants that occur in patches or species such as rhizomatous plants where it is difficult to determine individual plants. **Frequency measurements are only comparable when the same size sampling frame is used across observation locations and monitoring periods.
Refer to http://aim.landscapetoolbox.org/aim-background-documents/protocols/ for additional information on design, supplemental methods, and interpretation for recommended consistent supplemental methods. When the recommended AIM core and consistent supplemental methods do not address the monitoring objectives or measure the necessary indicators, other supplemental methods may be used. For example, AIM-derived vegetation composition data is probably not sufficient to determine dead, down, woody fuel loadings for fire behavior calculations. A list of recommended supplemental fuels methods is included in Table 4, however other methods may be selected as needed to meet monitoring objectives. Provide technical references and/or documentation in the FMDW for any methods used that are not listed in the table.
Incorporating Assessment, Inventory and Monitoring (AIM) for Monitoring Fuels Project Effectiveness
BLM Guidebook 11/27/2018 Attachment 1-14
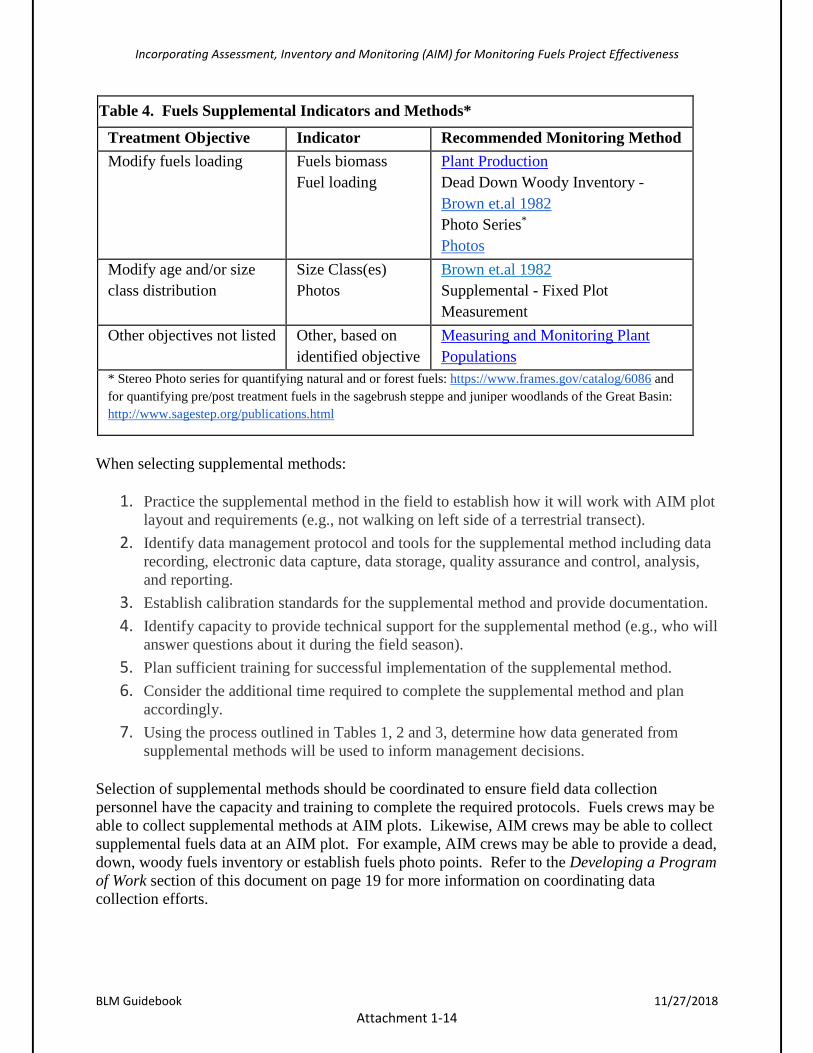
Table 4. Fuels Supplemental Indicators and Methods*
Treatment Objective Indicator Recommended Monitoring Method Modify fuels loading Fuels biomass
Fuel loading Plant Production Dead Down Woody Inventory - Brown et.al 1982 Photo Series*
Photos Modify age and/or size class distribution
Size Class(es) Photos
Brown et.al 1982 Supplemental - Fixed Plot Measurement
Other objectives not listed Other, based on identified objective
Measuring and Monitoring Plant Populations
* Stereo Photo series for quantifying natural and or forest fuels: https://www.frames.gov/catalog/6086 and for quantifying pre/post treatment fuels in the sagebrush steppe and juniper woodlands of the Great Basin: http://www.sagestep.org/publications.html
When selecting supplemental methods:
1. Practice the supplemental method in the field to establish how it will work with AIM plot layout and requirements (e.g., not walking on left side of a terrestrial transect).
2. Identify data management protocol and tools for the supplemental method including data recording, electronic data capture, data storage, quality assurance and control, analysis, and reporting.
3. Establish calibration standards for the supplemental method and provide documentation. 4. Identify capacity to provide technical support for the supplemental method (e.g., who will
answer questions about it during the field season). 5. Plan sufficient training for successful implementation of the supplemental method. 6. Consider the additional time required to complete the supplemental method and plan
accordingly. 7. Using the process outlined in Tables 1, 2 and 3, determine how data generated from
supplemental methods will be used to inform management decisions. Selection of supplemental methods should be coordinated to ensure field data collection personnel have the capacity and training to complete the required protocols. Fuels crews may be able to collect supplemental methods at AIM plots. Likewise, AIM crews may be able to collect supplemental fuels data at an AIM plot. For example, AIM crews may be able to provide a dead, down, woody fuels inventory or establish fuels photo points. Refer to the Developing a Program of Work section of this document on page 19 for more information on coordinating data collection efforts.
Incorporating Assessment, Inventory and Monitoring (AIM) for Monitoring Fuels Project Effectiveness
BLM Guidebook 11/27/2018 Attachment 1-15
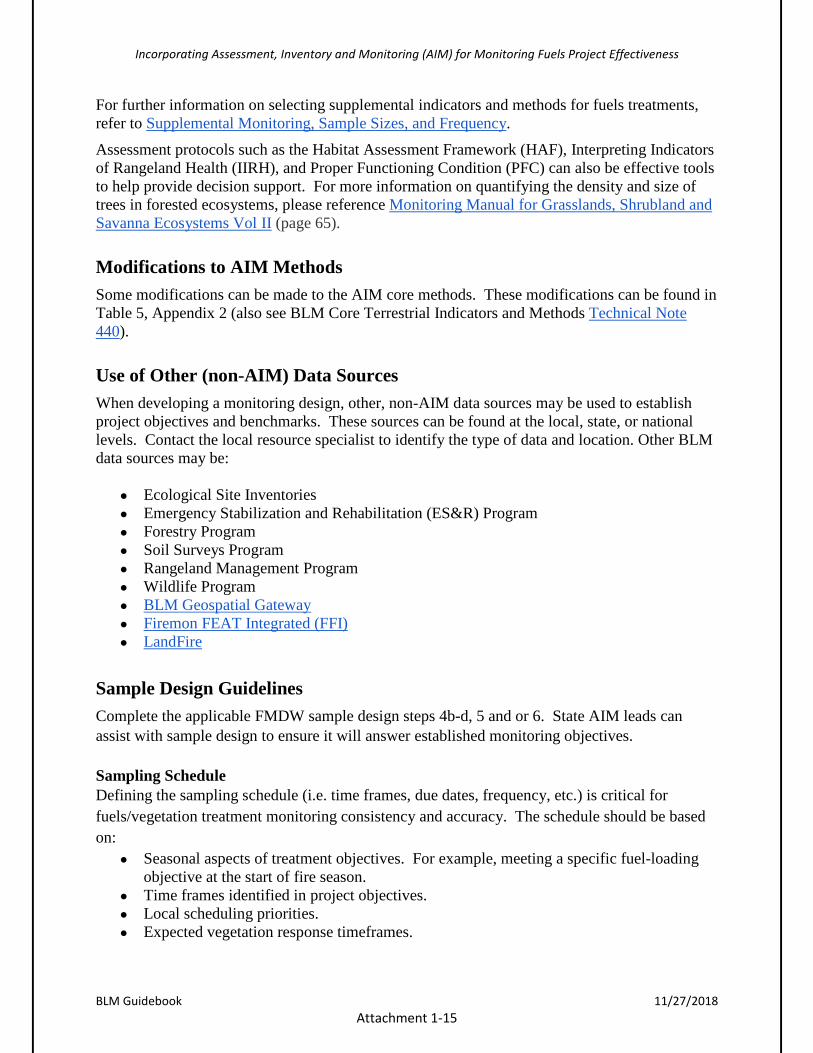
For further information on selecting supplemental indicators and methods for fuels treatments, refer to Supplemental Monitoring, Sample Sizes, and Frequency. Assessment protocols such as the Habitat Assessment Framework (HAF), Interpreting Indicators of Rangeland Health (IIRH), and Proper Functioning Condition (PFC) can also be effective tools to help provide decision support. For more information on quantifying the density and size of trees in forested ecosystems, please reference Monitoring Manual for Grasslands, Shrubland and Savanna Ecosystems Vol II (page 65).
Modifications to AIM Methods Some modifications can be made to the AIM core methods. These modifications can be found in Table 5, Appendix 2 (also see BLM Core Terrestrial Indicators and Methods Technical Note 440).
Use of Other (non-AIM) Data Sources When developing a monitoring design, other, non-AIM data sources may be used to establish project objectives and benchmarks. These sources can be found at the local, state, or national levels. Contact the local resource specialist to identify the type of data and location. Other BLM data sources may be:
● Ecological Site Inventories ● Emergency Stabilization and Rehabilitation (ES&R) Program ● Forestry Program ● Soil Surveys Program ● Rangeland Management Program ● Wildlife Program ● BLM Geospatial Gateway ● Firemon FEAT Integrated (FFI) ● LandFire
Sample Design Guidelines Complete the applicable FMDW sample design steps 4b-d, 5 and or 6. State AIM leads can assist with sample design to ensure it will answer established monitoring objectives. Sampling Schedule Defining the sampling schedule (i.e. time frames, due dates, frequency, etc.) is critical for fuels/vegetation treatment monitoring consistency and accuracy. The schedule should be based on:
● Seasonal aspects of treatment objectives. For example, meeting a specific fuel-loading objective at the start of fire season.
● Time frames identified in project objectives. ● Local scheduling priorities. ● Expected vegetation response timeframes.

Incorporating Assessment, Inventory and Monitoring (AIM) for Monitoring Fuels Project Effectiveness
BLM Guidebook 11/27/2018 Attachment 1-16
● Plant phenology (e.g., flowering/green up stages). ● Accessibility, including weather considerations. ● Budget and annual fuels program of work.
Unexpected events may require schedule modifications. Coordination between local fuels and AIM coordinators is important. Treatments with multiple objectives may require different monitoring methods to be conducted at varying frequencies to answer treatment effectiveness questions adequately. An example for a project with multiple treatments is provided in Step 4c of the FMDW instructions: Appendix 1. Determining Sample Location and Amount Randomized sampling locations are preferred (i.e. monitoring certain treatment types, specific vegetation type, etc.). However, if targeted sampling points (e.g. monitoring location set to meet a specific objective in an aspen stand regeneration area) will be used, provide rationale and methodology for selecting these non-random sampling locations. When using a sample design with randomized plot selection, it is recommended that the state AIM lead review the design. Points should be drawn using the Shiny Spatially Balanced Sampling Tool. If it is a landscape-scale project with strata greater than 3,000 acres, the AIM state lead or local AIM coordinator can assist with drawing points from the AIM master sample. Stratification and Intensification Stratification refers to dividing a population or study area into sub-groups or sub-units called strata for the purposes of sampling or data analysis. Stratification can be used to distribute sample points across the landscape and/or to ensure areas of interest or reporting units are sufficiently sampled (i.e., have adequate sample sizes for analysis). Stratification takes into account properties of the study area like physiography, management boundaries, ownership, or other aspects necessary for the specific monitoring objectives. Fuels/vegetation projects are likely to incorporate treatment types and control (untreated) areas into the stratification. The most common stratification mechanism for AIM is Landfire Biophysical Settings. Intensification increases the density of monitoring locations within an area of special interest to increase sampling accuracy. Intensifying may be appropriate within parts of the project area due to sensitive resources, uncertainty of treatment effects, or landscape variability that cannot be accounted for through stratification.
Implementation Rules Identify monitoring implementation rules to ensure success and efficiency of monitoring activities. For example, develop rejection criteria that will be used to determine if a point cannot be sampled (see FMDW instructions; Step 4d, Appendix 1). A plot tracking spreadsheet found in the AIM Landscape Toolbox should be created when sample points are drawn. This spreadsheet should be used throughout the monitoring period to document implementation information for each point, including rejecting or relocating plots.

Incorporating Assessment, Inventory and Monitoring (AIM) for Monitoring Fuels Project Effectiveness
BLM Guidebook 11/27/2018 Attachment 1-17
Implementation rules include the criteria for relocating or rejecting plots. Monitoring objectives related to treatments should also be considered. For example, a selected sampling point may be rejected if a planned treatment was not applied at the plot location. Additional plot rejection criteria should be carefully considered. Efforts should be made to minimize plot rejections. Broad rejection criteria reduce the extent of the project area that may be sampled, and effectively decreases the inference area. The methods completed at each plot may also be contingent upon the treatment(s) applied. These rules should be clearly defined in the FMDW to insure that the correct methods and indicators are collected at each location. For example, seeding density may be measured in an area where a seed mix was applied, but that method may not be required in portions of the project area that did not receive the seeding treatment. Plot Relocation and Rejection Process Under certain circumstances, it is not feasible to sample a randomly selected plot due to safety concerns, access restrictions, or plot characteristics. In these circumstances, first attempt to relocate the plot according to the following plot relocation instructions. If relocating the plot will not resolve the plot rejection issue, the plot is rejected and not sampled. A standard set of rejection criteria is available in the AIM landscape toolbox under Point Evaluation & Rejection and may be used as an aid to make criteria determinations.
Sample points should be reviewed against rejection criteria in the office using ancillary data sources (e.g., ownership maps, topographic maps, and aerial or satellite imagery). The same GIS data should be used during sample design. Rejection criteria such as excessive slope or change in ecological site should be verified in the field before rejecting a plot. The field sampling team should review the rejection criteria again once they have arrived at the point in the field. The reason for plot movement or rejection should be recorded on the plot tracking spreadsheet. This information is incorporated into data analysis. When a point is rejected, a new point from the pool of “overdraw” points within the same strata is added to maintain sample design balance and weightings. Plots must be sampled unless they meet one or more of the rejection criteria listed in the FMDW. It is important to preserve the statistical inference area while also maximizing efficiency and promoting safety during field sampling. Plots are not rejected due to subjective criteria such as being unrepresentative or due to proximity to anthropogenic disturbances or features.
Data Management States fuels program leads should work with AIM state leads to develop a data management plan based on the amount, type, and intensity of monitoring for fuels projects within a state. This plan should include:
1. Data storage location. AIM core indicator data collected in DIMA can be stored in the national AIM database, provided all the ingestion criteria are met, reference the TerraADat Decision Tree, Appendix 3: Terrestrial AIM Data Management Protocol.

Incorporating Assessment, Inventory and Monitoring (AIM) for Monitoring Fuels Project Effectiveness
BLM Guidebook 11/27/2018 Attachment 1-18
Some supplemental indicators can be collected and stored in DIMA; others will require another state, local or national-level data storage solution.
2. Data management procedures. The AIM core indicator data should use standard data management procedures (Terrestrial AIM Data management Protocol).
3. Roles and responsibilities for data storage. 4. Identify who will be involved in the QA/QC process, roles, and responsibilities.
Quality Assurance and Control To ensure monitoring data quality, a quality assurance and control (QA/QC) plan should be developed (see FMDW instructions; Step 7, Appendix 1). Data management is addressed in the QA/QC plan. The Terrestrial AIM Data Management Protocol provides the recommended quality assurance and quality control for each step of the process. To ensure that data can be ingested into TerrADat, follow all steps in the Terrestrial AIM Data Management Protocol and ensure that data collectors attend AIM core methods training. Data Storage The Database for Inventory, Monitoring and Assessment (DIMA) is an easily used software tool for data collection, management and interpretation. The DIMA database should be used whenever possible for data collection and storage. Data must be stored in the DIMA when any of the AIM core and supplemental methods are collected (LPI, etc.). The DIMA provides a consistent approach to the data collection of the standardized methods and will help with the quality assurance process. Additional information and tutorials on how to perform tasks in DIMA can be found on the Jornada DIMA Website and Landscape Toolbox – Tools and Methods for Land Health Monitoring. The DIMA is required for data entry into TerrADat, the Terrestrial AIM Database, which houses all BLM terrestrial monitoring data collected by states and field offices. When data meets all requirements of ingestion into TerrADat, follow the QA/QC process and coordinate with AIM leads or local AIM coordinators to submit data to the BLM National Operations Center (NOC) annually at the end of the field season. A copy of the final DIMA should be maintained locally. For more information on data storage protocols see TerrADat Decision Tree, Appendix 3: Terrestrial AIM Data Management Protocol. When data does not meet the TerrADat requirements (i.e. some supplemental data, not all core methods were sampled, etc.) it must be managed at the local or state level. The data should be placed in the fuels project file. Fuels treatment polygon data should be consolidated at the state level and placed in the Vegetation Management Action Portal (VMAP) as per policy (FA-IM-2018-005). This should be coordinated with each AIM state lead.
Incorporating Assessment, Inventory and Monitoring (AIM) for Monitoring Fuels Project Effectiveness
BLM Guidebook 11/27/2018 Attachment 1-19
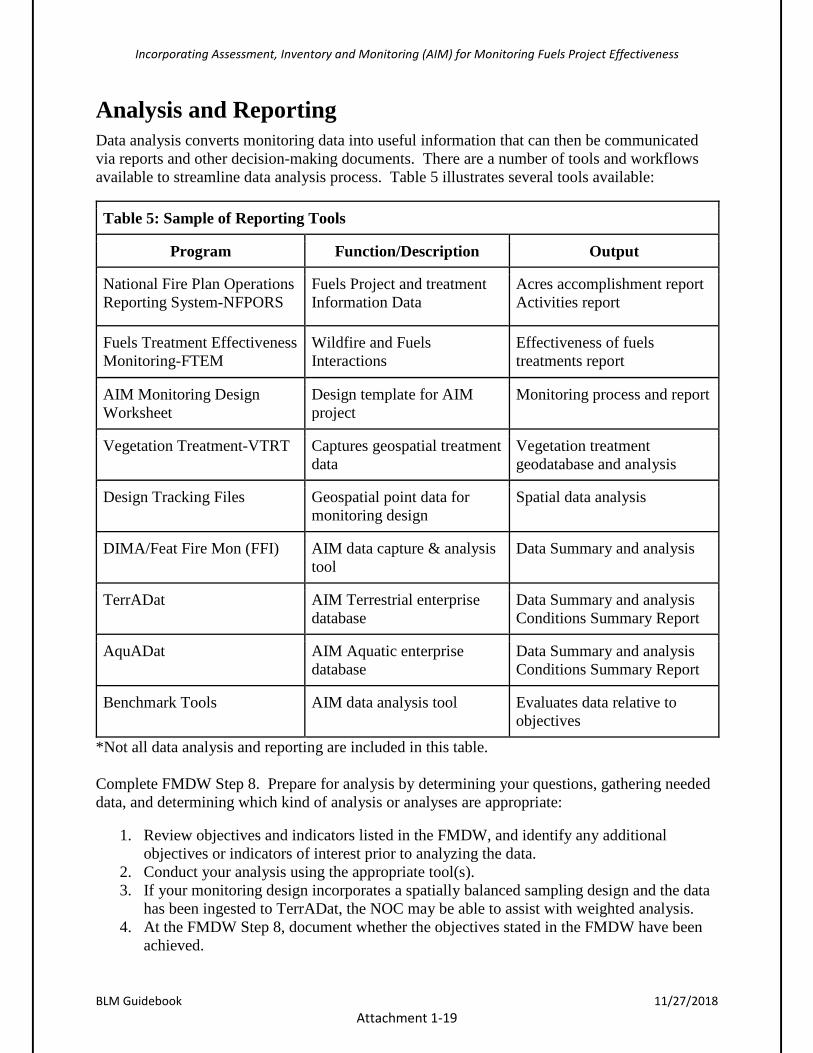
Analysis and Reporting Data analysis converts monitoring data into useful information that can then be communicated via reports and other decision-making documents. There are a number of tools and workflows available to streamline data analysis process. Table 5 illustrates several tools available:
Table 5: Sample of Reporting Tools
Program Function/Description Output
National Fire Plan Operations Reporting System-NFPORS
Fuels Project and treatment Information Data
Acres accomplishment report Activities report
Fuels Treatment Effectiveness Monitoring-FTEM
Wildfire and Fuels Interactions
Effectiveness of fuels treatments report
AIM Monitoring Design Worksheet
Design template for AIM project
Monitoring process and report
Vegetation Treatment-VTRT Captures geospatial treatment data
Vegetation treatment geodatabase and analysis
Design Tracking Files
Geospatial point data for monitoring design
Spatial data analysis
DIMA/Feat Fire Mon (FFI) AIM data capture & analysis tool
Data Summary and analysis
TerrADat AIM Terrestrial enterprise database
Data Summary and analysis Conditions Summary Report
AquADat AIM Aquatic enterprise database
Data Summary and analysis Conditions Summary Report
Benchmark Tools AIM data analysis tool Evaluates data relative to objectives
*Not all data analysis and reporting are included in this table. Complete FMDW Step 8. Prepare for analysis by determining your questions, gathering needed data, and determining which kind of analysis or analyses are appropriate:
1. Review objectives and indicators listed in the FMDW, and identify any additional objectives or indicators of interest prior to analyzing the data.
2. Conduct your analysis using the appropriate tool(s). 3. If your monitoring design incorporates a spatially balanced sampling design and the data
has been ingested to TerrADat, the NOC may be able to assist with weighted analysis. 4. At the FMDW Step 8, document whether the objectives stated in the FMDW have been
achieved.

Incorporating Assessment, Inventory and Monitoring (AIM) for Monitoring Fuels Project Effectiveness
BLM Guidebook 11/27/2018 Attachment 1-20
5. Document additional results, lessons learned and general observations in the comments section at the end of the worksheet.
6. Interpret your results to determine consistency with management goals.
Developing a Project Level Program of Work (POW)
Monitoring Activities as Part of the Fuels Program of Work All fuels projects will identify monitoring activities associated with the project’s treatments. Monitoring activities are identified in the fuels out-year POW. The monitoring workload is determined by referring to the sampling schedule in each FMDW. The workload will identify the budget required for each project. Funding needs for monitoring treatments and data analysis should be identified as a project’s ‘planned direct cost’ in NFPORS ‘Activities.’ A portion of the available budget must be identified to meet yearly monitoring workload requirements. The fuels program will fund the monitoring activities required for a project or treatment(s) fully funded by the fuels program. For projects that are not fully funded, the allocation will be applied proportionally across the project, treatment(s), and activities. Jointly funded integrated projects/treatments will allocate monitoring funding proportionally by program area. Jointly funded integrated vegetation treatment projects may have additional monitoring standards and requirements.
Coordination of Monitoring Activities The AIM efforts require iterative planning and coordination from multiple entities. Fuels management staff should coordinate with their AIM state leads and or local AIM coordinators and other programs to identify and plan fuels/vegetation projects to be monitored in the current and out-years.
Stages of project planning and implementation that may require monitoring coordination include:
● Project development and NEPA analysis ● FMDW development ● Developing the monitoring POW ● Funding ● Training ● Implementation (data collection) ● Data management ● Reporting
Incorporating Assessment, Inventory and Monitoring (AIM) for Monitoring Fuels Project Effectiveness
BLM Guidebook 11/27/2018 Attachment 1-21
Monitoring Crew Coordination Other programs such as range, wildlife, and forestry may also be implementing AIM. Look for opportunities to increase efficiencies by sharing monitoring resources. These opportunities should be identified during the POW development. Coordination with AIM state leads, as well as local project leads will help in determining the level of resource sharing that should occur. To identify AIM state leads and local coordinators, refer to the contact page on the AIM website: http://aim.landscapetoolbox.org/learn-3/contact/. Two examples of program requirements to use the AIM strategy for assessment and monitoring:
1. Emergency Stabilization and Burned Area Rehabilitation (ESR) program is required to implement AIM on wildfires over 10,000 acres.
2. The BLM has adopted the Terrestrial AIM strategy as a framework to collect site-scale seasonal sage-grouse habitat data to support Habitat Assessment Framework (HAF) assessments.
Examples of efficient use of field crews to meet AIM and fuels program monitoring needs include:
1. An AIM crew sampling near a proposed fuels treatment may be asked to complete additional plots for the fuels project.
2. An AIM crew can collect additional fuels data using supplemental methods at AIM plot. 3. A fuels monitoring crew may assist AIM monitoring projects. If collecting AIM data, the
fuels monitoring crew will need training in AIM methods.
AIM Training The AIM training for fuels program personnel should be coordinated between state fuels and AIM leads, and local AIM coordinators and fuels specialists. At a minimum, crew leaders must be trained in AIM core methods and go through re-training every three years. When possible, it is recommended that all crewmembers take the core training. Terrestrial core methods training opportunities are offered annually through the National Training Center (NTC). Additional training may be available in your state. Prior to AIM sampling, monitoring project leads should coordinate with local resources specialist to familiarize crews with project area, objectives, logistics and local considerations.
Costs The cost of monitoring can vary depending on how the monitoring data is collected. Commonly, AIM crews can be hired through agreements or contracts rather than using BLM staff. If the fuels group has a small number of points to monitor for treatment effectiveness, it may be best to contribute to the AIM agreement/contract on a per point basis. The cost of AIM points can vary between $1,000 and $2,500. Please contact the AIM state lead to determine the exact cost per point and how to add money to the agreement/contract.

Incorporating Assessment, Inventory and Monitoring (AIM) for Monitoring Fuels Project Effectiveness
BLM Guidebook 11/27/2018 Attachment 1-22
Definitions 1. Adaptive Management - A systematic approach for improving resource management
by learning from management outcomes. 2. Benchmarks - Indicator values or ranges of values that establish desired conditions and
are meaningful for management. Benchmarks are used to compare observed indicator values at assessed points to desired conditions. For example, achieving a benchmark value of plant density may tell you that a seeding project was successful; failure to achieve it may trigger reevaluation of seeding methods. Likewise, observed conductivity values characterize the amount of dissolved cations and anions in water at an assessed point, but without appropriate benchmarks, such values lack context and cannot be used to assess condition or the attainment of management objectives. Benchmarks for a given indicator may vary by potential (e.g., ecological sites), thus different benchmark groups may be necessary within a project area so the points are understood as meeting or not meeting an objective relative to potential.
3. Core Indicators (AIM) - Measurable ecosystem component applicable across many different ecosystems, management objectives, and agencies.
4. Effectiveness Monitoring - The process of collecting data to determine whether desired outcomes are met as the allowable uses and management actions are being implemented.
5. Fuel Break – A fuel break is "a strategically located wide block, or strip, on which the cover of flammable vegetation has been changed to one of lower fuel volume, height, or cover to reduce flammability". The primary reason for the creation of a fuel break is to change the behavior of a wildfire entering the fuel-altered zone so the fuel break can be used as an anchor for indirect attack on wildland fires.
6. Indicator - A component of a system whose characteristics (e.g., presence or absence, quantity, distribution) are used as an index of an attribute (e.g., biotic integrity) that is too difficult, inconvenient or expensive to measure.
7. Intensification - An effort that increases the density of monitoring locations within an area of special interest to increase the accuracy (mean estimate closer to the population mean) and precision (smaller confidence interval) of indicator estimates. Typically performed in anticipation of special management decisions (e.g., permit renewal) that require greater accuracy and precision than provided by existing monitoring designs within the same area.
8. Management Objective or Management Goal - Broad goals or desired outcomes land managers are trying to achieve with land management. Management objectives and goals provide the context for why monitoring information is needed and how it will be used. Often, these are derived from planning documents and policy. Examples include maintaining forage production for livestock or high-quality habitat for big game animals.
9. Fuels Monitoring Design Worksheet (FMDW) - This worksheet serves many purposes including documenting decisions and reasons for completing monitoring, providing the necessary information for drawing sample points and completing analyses once data are collected. The FMDW worksheet instructions and a blank worksheet can be found as Appendix 1 and 1A.
10. Sample Design - Provides information on the target and final sample sizes, strata definitions and the sample selection methodology. This term can be used interchangeable with “sample plan”, “survey design”, “sampling plan” or “sampling

Incorporating Assessment, Inventory and Monitoring (AIM) for Monitoring Fuels Project Effectiveness
BLM Guidebook 11/27/2018 Attachment 1-23
design”. In AIM, the details of the sample design are covered in the Monitoring Design Worksheet.
11. Supplemental Indicators - A measurable ecosystem component that is specific to a given ecosystem, land use, or management objective.
12. Stratification - Stratification refers to dividing a population or study area up into sub-groups or subunits called strata for the purposes of sampling or data analysis. Reasons to stratify: 1) variability in indicators is different across types of land; 2) ensure different types of land or uncommon portions of a study area are sampled; 3) to deal with differences in land potential. Examples of strata include biophysical settings (see BpS), stream order (see Strahler stream order) , management unit boundary, and ecological sites (see Ecological Sites; Monitoring Manual for Grassland, Shrubland, and Savanna Ecosystems, Volume II)
For other AIM definitions, refer to: aim.landscapetoolbox.org

Incorporating Assessment, Inventory and Monitoring (AIM) for Monitoring Fuels Project Effectiveness
BLM Guidebook 11/27/2018 Attachment 1-24
Appendices:

Incorporating Assessment, Inventory and Monitoring (AIM) for Monitoring Fuels Project Effectiveness
BLM Guidebook 11/27/2018 Attachment 1-25
Appendix 1: Fuels Monitoring Design Worksheet Instructions
Use the following instructions to complete the Fuels Monitoring Design Worksheet (FMDW):

Incorporating Assessment, Inventory and Monitoring (AIM) for Monitoring Fuels Project Effectiveness
BLM Guidebook 11/27/2018 Attachment 1-26
Fuels Monitoring Design Worksheet - Project/Treatment Unit Name
Date Monitoring Design Initiated: _________________________________ Treatment Funding FY: _________________________________________ Field Office: ___________________________________________________ NFPORS Project Name: _ and #: ________________ NFPORS Treatment Name(s): and #(s): _______________ Treatment(s) Type: _____________________________________________ Project/Treatment Contact: ______________________________________ Treatment Implementation Contact: _______________________________ Monitoring Contact: _____________________________________________
Length of monitoring schedule (years): ____________ Number of years into monitoring schedule: _______________ Summary of Results Use information obtained in Step 8 to inform the following:
1. Monitoring Objectives Met/Not Met: Document whether the monitoring objectives stated in the Step 2 have been achieved.
2. Treatment Objectives Met/Not Met: Identify if the project and treatment objectives
identified in Step 1 have been met or unmet. 1, 2, 3 etc. - met/not met and values (optional or include at end).
3. Lessons Learned, Adaptive Management Summary: Summarize lessons learned, general
observations and future needs identified in Step 8a at the end of the worksheet.

Incorporating Assessment, Inventory and Monitoring (AIM) for Monitoring Fuels Project Effectiveness
BLM Guidebook 11/27/2018 Attachment 1-27
Step 1: Identify management and treatment objectives List management objectives and treatment objectives. Objectives should be taken or derived from the selected alternative in the NEPA document. Relevant management objectives may also be found in the guiding Land Use Plan. Management Objectives are the overarching goals that drive implementation of fuels/vegetation projects and treatments. Project and treatment objectives are designed to support the management objectives and should be Specific, Measurable, Attainable, Realistic, and Timely (SMART). They should also specify post-treatment benchmarks of treatment success. Management Objectives: Examples –
1. Management Objective: modify vegetation along maintained gravel roads to reduce flame lengths and improve effectiveness of initial attack.
2. Management Objective: reduce potential rate of spread of wildfire in area currently dominated by fine fuels.
3. Management Objective: restore sagebrush steppe vegetation community currently in Phase II juniper.
Description of Treatments: Provide a short description of the treatments (type, size, vegetation, relation to project, etc.) Treatment Objectives: Examples -
1. Treatment Objective: reduce average sagebrush height in mowed strips to less than 20 cm in the mowed area
2. Treatment Objective: reduce cheatgrass foliar cover to less than 10% 3. Treatment Objectives:
a. Reduce live juniper cover to less than 1% in treated area b. Increase native bunchgrass foliar cover to >20% in treated area
Step 2: Study area and reporting units and monitoring objectives Step 2a: Project Study Area: Normally, the study area will be the treatment or project area defined in the NEPA document. The study area may be bigger if control (untreated) plots are needed to determine treatment effectiveness. Step 2b: Available Data Identify if there are available AIM Data or other fuels data that will used to assess baseline conditions and/or monitor effectiveness. Step 2c: Reporting Units List or description of units used to quantify or describe work. Reporting units are areas on the landscape with common ecological characteristics and/or management (treatments) that will be grouped together when data are analyzed and treatment effectiveness is evaluated. Examples include areas sharing

Incorporating Assessment, Inventory and Monitoring (AIM) for Monitoring Fuels Project Effectiveness
BLM Guidebook 11/27/2018 Attachment 1-28
common objectives, often grouped by treatment types, ecological sites or potential vegetation. Sample sizes required will increase with increased stratification and finer-grain reporting units. Step 2d: Monitoring Objectives The monitoring objectives are defined by the treatment objectives listed above. There may be short and long-term objectives, depending upon the treatment types and expected responses. Monitoring Objectives Examples-
1. Monitoring Objective: Be 80% sure that mean sagebrush height in mowed strips is <20cm prior to July 1 each year.
2. Monitoring Objective: Be 90% sure that mean annual grass and forb foliar cover in treatment area is <10% three years after treatment.
3. Monitoring Objectives: a. Be 80% sure that live juniper cover in treatment area is no more than 1% the year
following treatment b. Be 80% sure that native bunchgrass foliar cover in treatment area is >20% within ten
years following treatment Step 3: Select criteria for stratifying the study area (if necessary) Example Stratification and Site Weighting (in table form):
Strata – Treatment/ Veg Type
Approx. stratum acres
Proportional area
Proportion of target
sites
Sites per
strata
Approx. site weight in acres/site
ARTRW Herbicide 1,800 .45 .30 12 150
ARTRW Herb + Seed 2,000 .5 .60 24 83
ATRW Mow 200 .05 .10 4 50
Total 4,000 1.0 40
If stratification is not necessary, provide rationale: Example: A treatment involves a single type of herbicide application in homogenous cheatgrass cover type within a 300’ elevation range, so no stratification is warranted.

Incorporating Assessment, Inventory and Monitoring (AIM) for Monitoring Fuels Project Effectiveness
BLM Guidebook 11/27/2018 Attachment 1-29
Step 4: Select and document monitoring methods, estimate sample sizes, set sampling schedule and develop implementation rules Step 4a: Monitoring Methods If quantitative monitoring methods are not required, identify the methods that will be used and provide rationale. When monitoring is completed, complete Step 8: Example: Ocular or photo point method(s) will be used because only First Order Fire Effects is required to determine accomplishment of treatment objectives Core Methods: List the Core methods that will be used to assess and monitor treatments. Use the table below to help select then list methods to be used based on treatment and monitoring objectives. The AIM Core Methods listed are preferred for monitoring vegetation treatments, and will be used when they meet the monitoring objective(s) identified in the Step 1.
Table 4a: Fuels Objectives and AIM Core Methods
Treatment Objective Indicator AIM Core Method4
Modify target vegetation height Vegetation height Vegetation Height
Modify fuel continuity Vegetation gap size Vegetation cover
Canopy Gap* Line Point Intercept
Modify fuel amount Fuel cover Line Point Intercept Modify age and/or size class distribution Vegetation height Vegetation Height Modify cover or abundance of target vegetation or species
Vegetation cover Line Point Intercept
Increase and maintain species diversity Species composition Species richness
Line Point Intercept Species inventory
Release understory vegetation Target spp. Mortality Vegetation cover
Line Point Intercept
Increase site stability Soil stability Bare Ground Vegetation continuity
Line Point Intercept Soil stability test kit Canopy gap
Supplemental Methods List the supplemental methods used.
4 Monitoring Manual for Grassland, Shrubland, and Savanna Ecosystems 2nd Edition, Volume 1, Core Methods, by Jeffrey E. Herrick, Justin W. Van Zee, Sarah. E. McCord, Ericha M. Courtright, Jason W. Karl, and Laura M. Burkett, USDA - ARS Jornada Experimental Range, Las Cruces, New Mexico.
Incorporating Assessment, Inventory and Monitoring (AIM) for Monitoring Fuels Project Effectiveness
BLM Guidebook 11/27/2018 Attachment 1-30
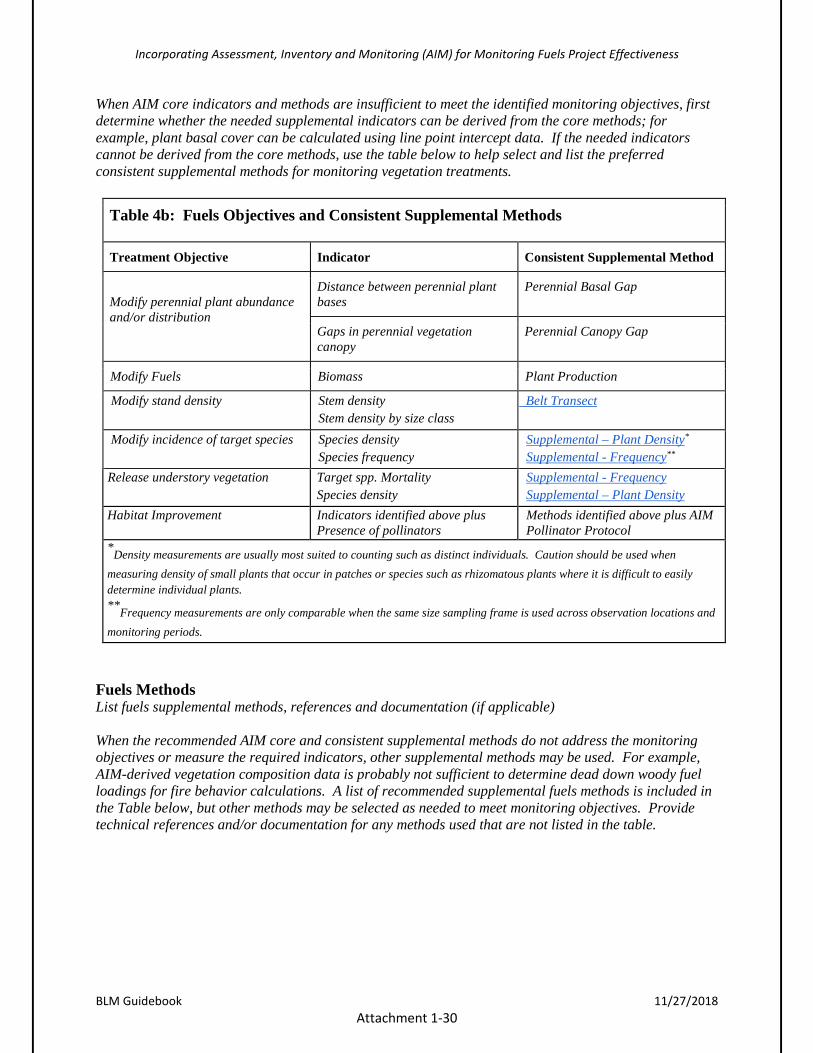
When AIM core indicators and methods are insufficient to meet the identified monitoring objectives, first determine whether the needed supplemental indicators can be derived from the core methods; for example, plant basal cover can be calculated using line point intercept data. If the needed indicators cannot be derived from the core methods, use the table below to help select and list the preferred consistent supplemental methods for monitoring vegetation treatments.
Table 4b: Fuels Objectives and Consistent Supplemental Methods
Treatment Objective Indicator Consistent Supplemental Method
Modify perennial plant abundance and/or distribution
Distance between perennial plant bases
Perennial Basal Gap
Gaps in perennial vegetation canopy
Perennial Canopy Gap
Modify Fuels Biomass Plant Production
Modify stand density Stem density Stem density by size class
Belt Transect
Modify incidence of target species Species density Species frequency
Supplemental – Plant Density*
Supplemental - Frequency**
Release understory vegetation Target spp. Mortality Species density
Supplemental - Frequency Supplemental – Plant Density
Habitat Improvement Indicators identified above plus Presence of pollinators
Methods identified above plus AIM Pollinator Protocol
*Density measurements are usually most suited to counting such as distinct individuals. Caution should be used when measuring density of small plants that occur in patches or species such as rhizomatous plants where it is difficult to easily determine individual plants. **Frequency measurements are only comparable when the same size sampling frame is used across observation locations and monitoring periods.
Fuels Methods List fuels supplemental methods, references and documentation (if applicable) When the recommended AIM core and consistent supplemental methods do not address the monitoring objectives or measure the required indicators, other supplemental methods may be used. For example, AIM-derived vegetation composition data is probably not sufficient to determine dead down woody fuel loadings for fire behavior calculations. A list of recommended supplemental fuels methods is included in the Table below, but other methods may be selected as needed to meet monitoring objectives. Provide technical references and/or documentation for any methods used that are not listed in the table.
Incorporating Assessment, Inventory and Monitoring (AIM) for Monitoring Fuels Project Effectiveness
BLM Guidebook 11/27/2018 Attachment 1-31
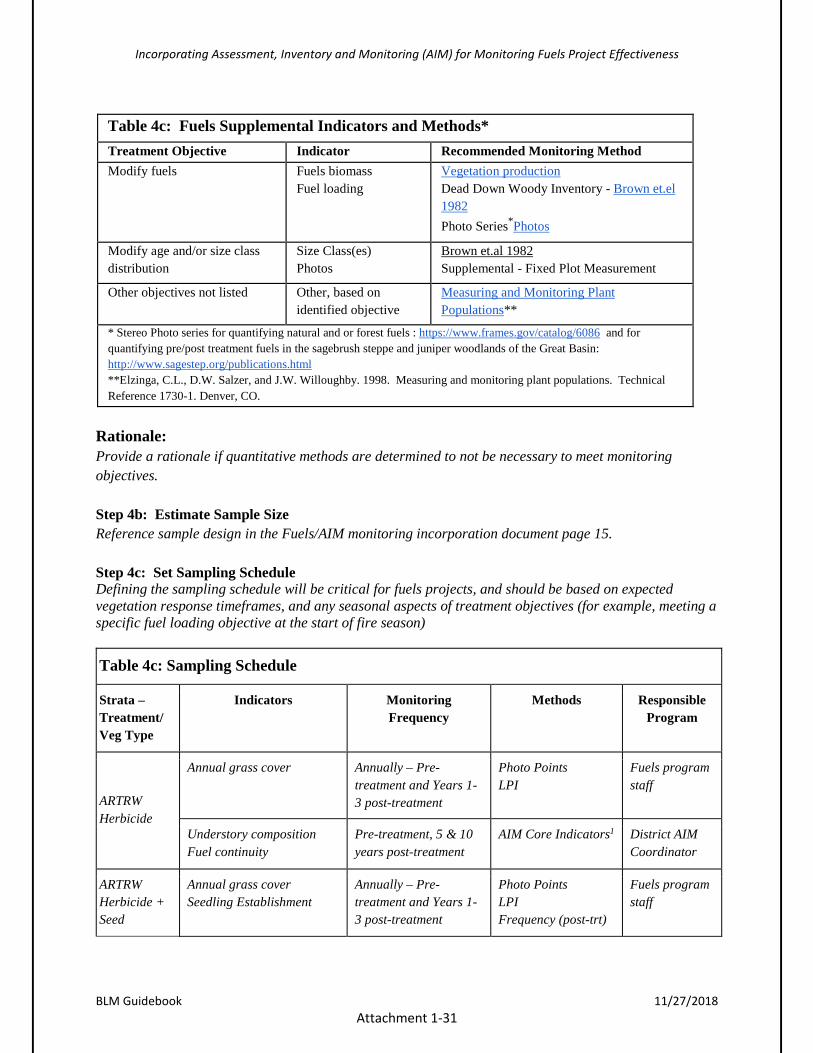
Table 4c: Fuels Supplemental Indicators and Methods*
Treatment Objective Indicator Recommended Monitoring Method Modify fuels Fuels biomass
Fuel loading Vegetation production Dead Down Woody Inventory - Brown et.el 1982 Photo Series*Photos
Modify age and/or size class distribution
Size Class(es) Photos
Brown et.al 1982 Supplemental - Fixed Plot Measurement
Other objectives not listed Other, based on identified objective
Measuring and Monitoring Plant Populations**
* Stereo Photo series for quantifying natural and or forest fuels : https://www.frames.gov/catalog/6086 and for quantifying pre/post treatment fuels in the sagebrush steppe and juniper woodlands of the Great Basin: http://www.sagestep.org/publications.html **Elzinga, C.L., D.W. Salzer, and J.W. Willoughby. 1998. Measuring and monitoring plant populations. Technical Reference 1730-1. Denver, CO.
Rationale: Provide a rationale if quantitative methods are determined to not be necessary to meet monitoring objectives. Step 4b: Estimate Sample Size Reference sample design in the Fuels/AIM monitoring incorporation document page 15. Step 4c: Set Sampling Schedule Defining the sampling schedule will be critical for fuels projects, and should be based on expected vegetation response timeframes, and any seasonal aspects of treatment objectives (for example, meeting a specific fuel loading objective at the start of fire season)
Table 4c: Sampling Schedule
Strata – Treatment/ Veg Type
Indicators Monitoring Frequency
Methods Responsible Program
ARTRW Herbicide
Annual grass cover Annually – Pre-treatment and Years 1-3 post-treatment
Photo Points LPI
Fuels program staff
Understory composition Fuel continuity
Pre-treatment, 5 & 10 years post-treatment
AIM Core Indicators1 District AIM Coordinator
ARTRW Herbicide + Seed
Annual grass cover Seedling Establishment
Annually – Pre-treatment and Years 1-3 post-treatment
Photo Points LPI Frequency (post-trt)
Fuels program staff

Incorporating Assessment, Inventory and Monitoring (AIM) for Monitoring Fuels Project Effectiveness
BLM Guidebook 11/27/2018 Attachment 1-32
Understory composition Fuel continuity Site stability
Pre-treatment, 5 & 10 years post-treatment
AIM Core Indicators1 District AIM Coordinator
Step 4d: Develop implementation rules Plot rejection criteria - The following list of rejection criteria will be used to determine if a point cannot be sampled. Additional rejection criteria may be identified as appropriate for project objectives. If one or more of the following is true, first attempt to relocate the plot according to the plot relocation instructions below:
● Sample point is unsafe to sample (e.g., unstable soil surface, cliffs, hazardous wildlife, law enforcement concerns)
● Sample point is >3 miles from the closest point accessible by vehicle ● Access to the point was denied (document the reason: e.g., access route unsafe, access
required passage through non-BLM land, locked gate). Slope of sample point exceeds 50% ● Sample point transect(s) or plot would intersect a road or primitive road ● Sample point transect(s) or plot would intersect a wetland, riparian, or aquatic feature ● Sample point transect(s) or plot are not on, or would leave BLM managed lands and/or other
project boundary ● Sample point transect(s) or plot would intersect a fence or other structure ● Sample point transect(s) or plot would not be completely within the defined stratum
Plot relocation instructions - when feasible, attempt to relocate the plot following this protocol prior to rejecting the plot.
● From the original plot center point, move 50 m North. With this location as the center of a new potential plot, evaluate the rejection criteria. Sample the new plot if it is not rejected.
● If the new plot is rejected, move 50 m east of the original plot center point and evaluate the rejection criteria again.
● Each time the new plot is rejected, repeat the remaining cardinal directions- South then West.
● If 50 m in all four cardinal directions of the original plot center point are rejected, reject the plot. If not, record the reason for the original rejection, relocation attempts, and replacement point ID from “overdraw” points in the plot tracking spreadsheet.

Incorporating Assessment, Inventory and Monitoring (AIM) for Monitoring Fuels Project Effectiveness
BLM Guidebook 11/27/2018 Attachment 1-33
Step 5: Collect and evaluate available data to determine sampling sufficiency and the validity of the strata This step may be completed using existing data or the first year’s data to evaluate sampling sufficiency and validity of strata. If the monitoring project does not use quantitative methods and stratified/randomized sampling, skip this step Step 6: Select statistically valid monitoring locations Apply stratification identified in Step 3 and select randomized sampling points. Randomized sampling locations are preferred; however, if targeted sampling points will be used, provide rationale and methodology for selecting targeted sampling locations.
Step 7: Develop Quality Assurance and Quality Control (QA and QC) Procedures and Data Management Plans Determined based upon selected methods, adjust table as needed to provide documentation of special or additional tasks. EXAMPLE QA/QC Timeline Worksheet:
Task Who When Date to be Completed
Attended training/ learned field protocols
Anyone collecting field data (i.e., field crews)
Before data collection begins Spring 2019
Calibration Anyone collecting field data (i.e., field crews)
Before data collection begins and various times throughout field season (i.e., changing landscapes, etc.)
Spring 2019 following training
QC checks Field Crew Lead Daily (i.e., before you leave a plot) and weekly (i.e., after a hitch)
Following data collection at every plot
Early- and mid-season check
Project Lead After the field crew’s first hitch and half way through the field season
May 2019 and July 2019
End of season QC check
Crew Lead After all data collection has ceased Late August 2019
End of season QC check
Project Lead or State Lead
After crew lead has finished QC check Mid September 2019
Incorporating Assessment, Inventory and Monitoring (AIM) for Monitoring Fuels Project Effectiveness
BLM Guidebook 11/27/2018 Attachment 1-34
STEP 8: Analyze and report Step 8a: Data Collection Changes: After field data collection is completed document any changes to the sampling schedule, methods, or project design. Step 8b: Report Results: Review Monitoring Objectives and benchmarks and analyze data. Determine whether or not objectives have been achieved and report results. Step 8c: Identify Lessons Learned: Identify and document lessons learned and adaptive management actions needed. Step 8d: Use information from this step to complete the summary report on Page 1. This may be completed several times over the life of the monitoring plan to determine needs for re-treatment, and progress towards short-term and longer-term management objectives. Optional Appendices: Attach maps, photos, remote sensing data, related reports, etc. if applicable

Incorporating Assessment, Inventory and Monitoring (AIM) for Monitoring Fuels Project Effectiveness
BLM Guidebook 11/27/2018 Attachment 1-35
Appendix 1A: Fuels Monitoring Design Worksheet Template
Fuels Monitoring Design Worksheet - Project/Treatment Unit Name
Date Monitoring Design Initiated: _______________________________ Treatment Funding FY: _______________________________________ Field Office: _________________________________________________ NFPORS Project Name: and #: ________________ NFPORS Treatment Name(s): and #s: ______________ Treatment(s) Type: ____________________________________________ Project/Prescribed Fire Contact: _________________________________ Treatment Implementation Contact: ______________________________ Monitoring Contact: ____________________________________________
Length of monitoring schedule (years):________ Number of years into monitoring schedule: ___________ Summary of Results
1. Monitoring Objectives Met/Not Met:
2. Treatment Objectives Met/Not Met:
3. Lessons Learned, Adaptive Management Summary:
Incorporating Assessment, Inventory and Monitoring (AIM) for Monitoring Fuels Project Effectiveness
BLM Guidebook 11/27/2018 Attachment 1-36
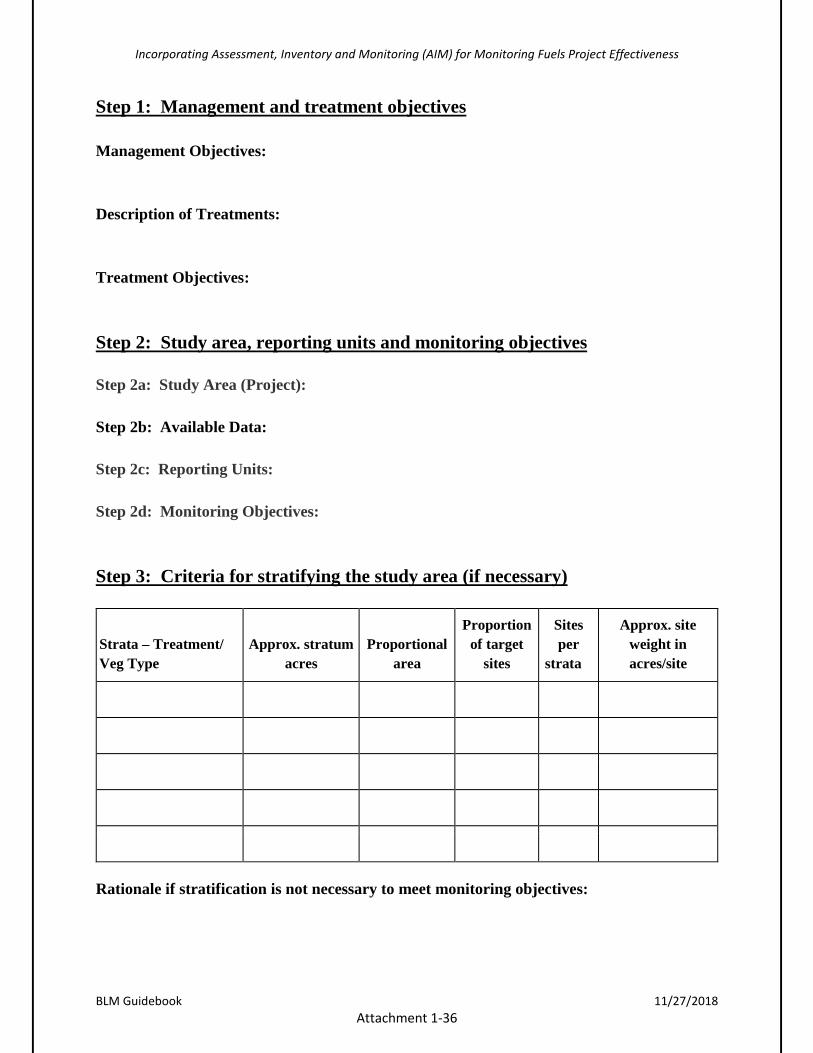
Step 1: Management and treatment objectives Management Objectives: Description of Treatments: Treatment Objectives: Step 2: Study area, reporting units and monitoring objectives Step 2a: Study Area (Project): Step 2b: Available Data: Step 2c: Reporting Units: Step 2d: Monitoring Objectives: Step 3: Criteria for stratifying the study area (if necessary)
Strata – Treatment/ Veg Type
Approx. stratum acres
Proportional area
Proportion of target
sites
Sites per
strata
Approx. site weight in acres/site
Rationale if stratification is not necessary to meet monitoring objectives:
Incorporating Assessment, Inventory and Monitoring (AIM) for Monitoring Fuels Project Effectiveness
BLM Guidebook 11/27/2018 Attachment 1-37
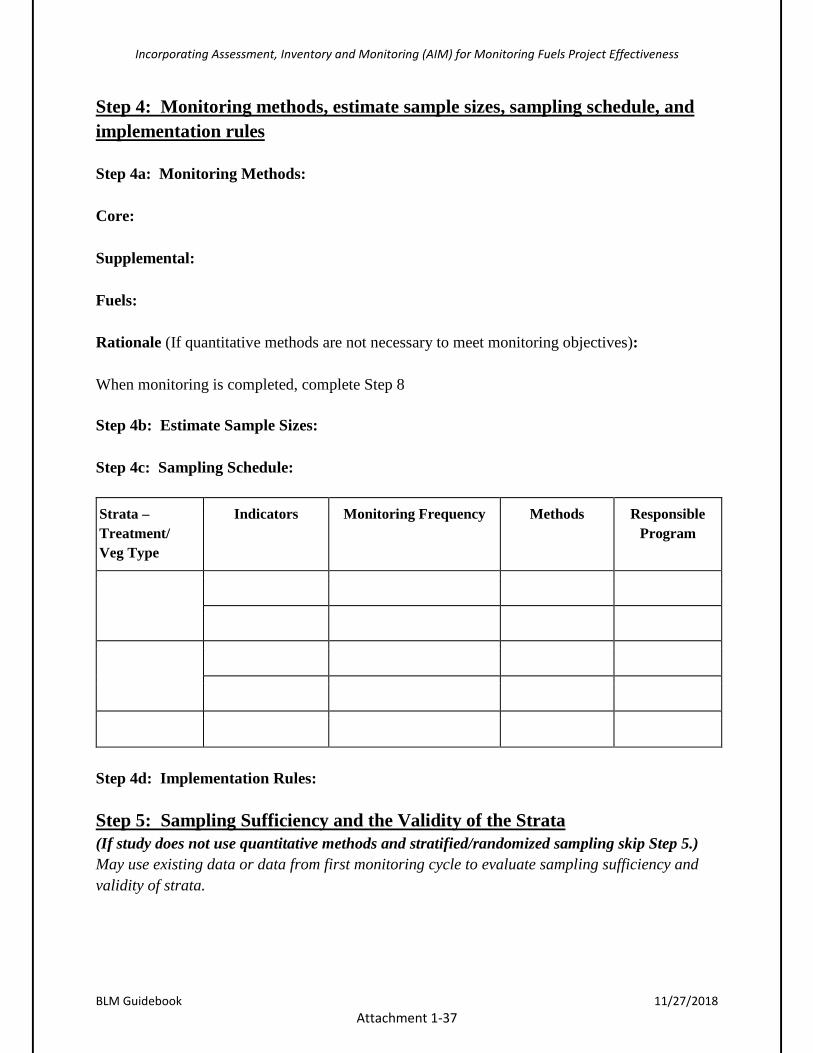
Step 4: Monitoring methods, estimate sample sizes, sampling schedule, and implementation rules Step 4a: Monitoring Methods: Core: Supplemental: Fuels: Rationale (If quantitative methods are not necessary to meet monitoring objectives): When monitoring is completed, complete Step 8 Step 4b: Estimate Sample Sizes: Step 4c: Sampling Schedule: Strata – Treatment/ Veg Type
Indicators Monitoring Frequency Methods Responsible Program
Step 4d: Implementation Rules: Step 5: Sampling Sufficiency and the Validity of the Strata (If study does not use quantitative methods and stratified/randomized sampling skip Step 5.) May use existing data or data from first monitoring cycle to evaluate sampling sufficiency and validity of strata.

Incorporating Assessment, Inventory and Monitoring (AIM) for Monitoring Fuels Project Effectiveness
BLM Guidebook 11/27/2018 Attachment 1-38
Step 6: Monitoring locations Apply stratification identified in Step 3 and select randomized sampling points Document rationale here if selecting targeted, rather than randomized sampling locations. Step 7: Quality Assurance and Quality Control (QA and QC) Procedures and Data Management Plan.
Task Who When Date to be Completed
Note: Expand this table as needed to document any additional project specific tasks STEP 8: Analysis and Report
Step 8a: Data Collection Changes: Step 8b: Results: Step 8c: Lessons Learned, Adaptive Management Actions: (Step 8d): Use information from this step to complete the summary report on Page 1. This may be completed several times over the life of the monitoring plan to determine needs for re-treatment, and progress towards short-term and longer-term management objectives. Optional Appendices:

Incorporating Assessment, Inventory and Monitoring (AIM) for Monitoring Fuels Project Effectiveness
BLM Guidebook 11/27/2018 Attachment 1-39
Appendix 2: AIM Modifications The following table provides information to help determine out how AIM methods can be modified but still produce consistent data.
AIM Methods Modification: What Can and Cannot be Modified
Method What Can be Modified What Cannot be Modified
Line-point intercept with plot-level species inventory
• Number and spatial distribution of transects* • Length of transects • Number of points per transect • Additional information about species at all points or a subset of points (e.g., dead vs. live hit)
• Foliar vs. total canopy cover (must use foliar) • Definition of litter vs. standing dead (litter is detached; standing dead is included in foliar cover) • The minimum size of a rock fragment before it is considered soil (i.e., rocks smaller than 5 mm or about 1/4 in are considered soil) • Size of fixed plot for plot level species inventory (circular plot of 30 meter radius recommended) • Amount of time a fixed plot is searched (searches should be at least 15 minutes and continue until new species detections are more than 2 minutes apart)
Vegetation height • Number and spatial distribution of transects* • Length of transects • Number of points per transect • Number of species or functional groups for which height is recorded (provided that tallest is always recorded)
Radius of circle within which maximum height is determined (6 in or 15 cm)
Canopy gap intercept
• Number and spatial distribution of transects* • Length of transects • Minimum gap (20 cm) size can be decreased
• Definition of canopy necessary to stop a gap (50% cover on any 0.1-ft (1.25-in or 3-cm) segment) • The decision to include annual grasses and forbs when interrupting a gap** • Minimum gap size cannot be increased • What happens at beginning/end of transect (gaps defined to ends of the transect only)
Soil stability • Number of sampling locations within a plot • Where samples are selected along transect (provided that it is systematic or random)
• Whether or not subsurface samples are collected (can help interpretation where surface disturbance is common) • Time thresholds for determining stability class (see references in Table 2)
*Transects should be independent (not contiguous or intersecting) **Perennial canopy gap may be collected as a supplemental method.

Incorporating Assessment, Inventory and Monitoring (AIM) for Monitoring Fuels Project Effectiveness
BLM Guidebook 11/27/2018 Attachment 1-40
Appendix 3: Ensuring Consistency in Measurements The following provides information on the differences in potential monitoring indicators and methods. It is intended to help guide the selection of methods and ensure consistency in obtaining vegetation data.
Foliar cover is the percentage of ground covered by the vertical projection of the aerial portion of plants (Figure 2). This is effectively the area that is protected from raindrops and the area in shade when the sun is directly overhead. This is the definition used in erosion models. Foliar cover reflects changes in the density of the plant canopy associated with leaf and twig detachment, as well as changes in the size and number of individual plants in a defined area. The line point intercept method is an AIM core method because it measures the area actually covered by leaves, twigs, and stems and can be used to calculate a variety of indicators. It provides multiple canopy layers, including estimates for ground cover. In contrast, canopy cover includes the percentage of ground covered by a vertical projection of the outermost perimeter of the natural spread of foliage of plants. Small openings within the canopy are included. Measuring canopy cover, as opposed to foliar cover, results in a higher estimate of “cover” particularly for stoloniferous grasses and for shrubs and trees with diffuse canopies (Godinez-Alvarez et al. 2009). When reviewing older, existing data, canopy cover was often collected instead of foliar cover and small stones and biological soil crusts were often considered bare ground. Figure 2: Comparison of Foliar and Canopy Cover
Annual production estimates include three components: 1) current year’s growth present at the time of the evaluation; 2) current year’s growth that has been removed by herbivory; and 3) expected growth that will occur by the end of the growing season(s). Standing biomass differs from annual production in that it includes all live plant material above ground regardless of the year it was produced, while residual dry matter is usually defined as all herbaceous material, including detached litter, present at the end of the growing season. Frequency measurements are entirely dependent upon the plot size used, and frequency values cannot be compared between datasets collected with differing plot sizes. Density is calculated on a number per unit area basis, but plot sizes used should be appropriate to the size and distribution of individuals being counted.
End of Document