Income & Poverty in Miami-dade County: 2015 poverty in Miami-Dade County and, to the extent...
47
INCOME & POVERTY IN MIAMI-DADE COUNTY: 2013 Department of Regulatory & Economic Resources Planning Research & Economic Analysis June, 2015
Transcript of Income & Poverty in Miami-dade County: 2015 poverty in Miami-Dade County and, to the extent...

INCOME & POVERTY IN MIAMI-DADE COUNTY: 2013
Department of Regulatory & Economic Resources
Planning Research & Economic Analysis
June, 2015

Income & Poverty in Miami-Dade: 2013
2015 RER Planning Research & Economic Analysis. Page | 1
Table of Contents Summary ....................................................................................................................................................... 5
Introduction .................................................................................................................................................. 9
County-Wide Households and Families ...................................................................................................... 11
Household Income .................................................................................................................................. 11
Household Income by Race and Ethnicity ............................................................................................... 12
Household Living Wage ........................................................................................................................... 13
Household Income by Source ................................................................................................................. 16
Household Poverty Status ....................................................................................................................... 18
Population in poverty by household type ............................................................................................... 19
Degree of Poverty in Families ................................................................................................................. 21
Benefits ................................................................................................................................................... 22
Income and Poverty of Individuals – 2013 .................................................................................................. 24
Poverty by Age and Gender .................................................................................................................... 25
Poverty by Race ....................................................................................................................................... 28
Poverty by Nativity/Foreign Born ........................................................................................................... 29
Poverty and Educational Attainment ...................................................................................................... 30
Poverty and Employment ....................................................................................................................... 31
Poverty, Age & Health Insurance ............................................................................................................ 31
Upcoming .................................................................................................................................................... 35

Income & Poverty in Miami-Dade: 2013
2015 RER Planning Research & Economic Analysis. Page | 3
Appendix ..................................................................................................................................................... 37
Table A1: Household Income .................................................................................................................. 39
Table A2: Household Income by Race and Ethnicity ............................................................................... 39
Table A3: Household Quintile Incomes ................................................................................................... 40
Table A4: Average Household Income by Source ................................................................................... 41
Table A5: Poverty by Household Type and Share Composition .............................................................. 42
Table A6: Percent Poverty Households by Type and Age Group ............................................................ 43
Table A7: Poverty Status of Married-Couple Families by Working Status of Householder and Spouse 44
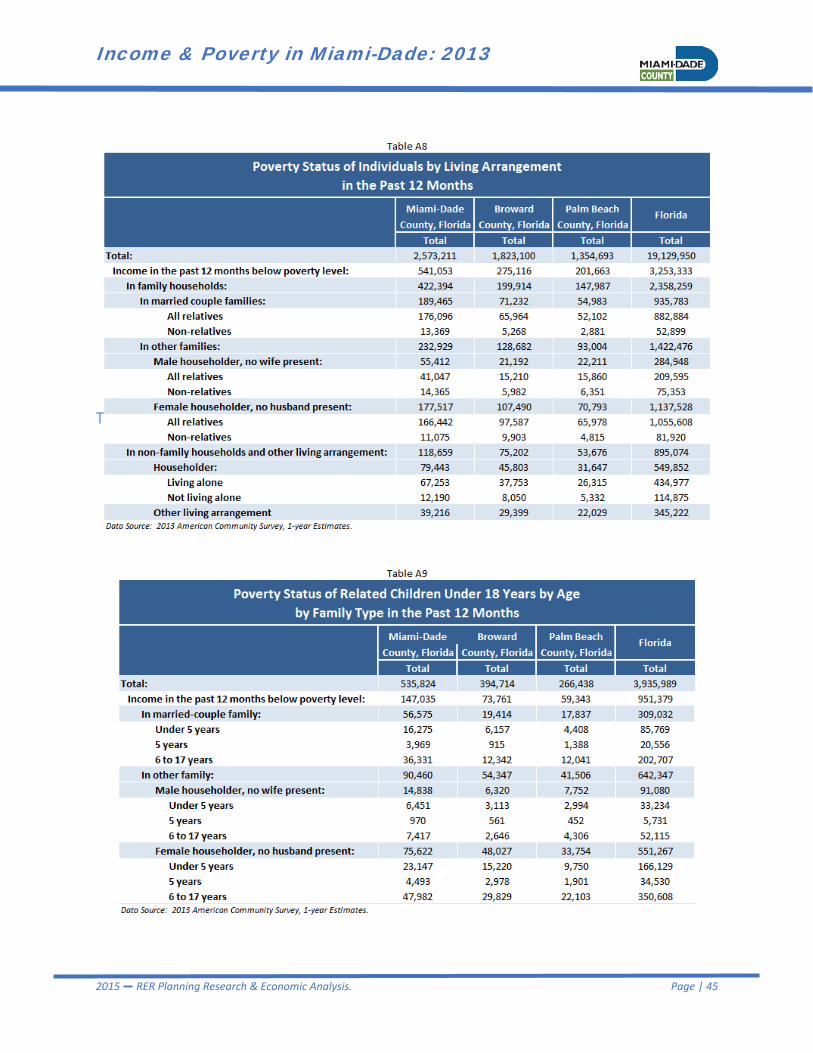
Table A8: Poverty Status of Individuals by Living Arrangement ............................................................. 45
Table A9: Poverty Status of Related Children Under 18 Years of Age by Family Type ........................... 45
Table A10: Poverty Status of Families by Family Type by Presence of Related Children ....................... 46
Table A11: Ratio of Income to Poverty Level of Families ....................................................................... 46
Table A12: Poverty Thresholds for 2013 by Size of Family and Number of Related Children ................ 47
Table A13: Income Deficit ....................................................................................................................... 47
Table A14: Households that Received Food Stamps/SNAP by Presence of Children ............................. 48
Table A15: Persons in Poverty by Sex and Age ....................................................................................... 49
Table A16: Ratio of Income to Poverty Level of Families ....................................................................... 50
Table A17: Ratio of Income to Poverty by Age Group ............................................................................ 51
Table A18: Poverty by Race and Ethnicity .............................................................................................. 52

Income & Poverty in Miami-Dade: 2013
2015 RER Planning Research & Economic Analysis. Page | 5
Summary
Household Incomes The median household income in Miami-Dade was estimated at $41,913 in 2013. This placed
Miami-Dade 242nd out of the 263 US Counties with a population greater than 250,000. 32 percent of households in Miami-Dade, almost one-third, earned less than $25,000 in 2013. The median household income for White, non-Hispanic households was $64,976 in 2013. The
Black non-Hispanic household median was 51 percent of that amount, $32,044, and the Hispanic household median was 61 percent, at $39,674. Income Distribution
The highest-earning 20 percent of households in the County accounted for 55 percent of all income earned in Miami-Dade and earned, on average, 1,903 percent more than the average household in the lowest-earning 20 percent.
60 percent of households earned less than a living income in 2013, an income high enough so that the household is financially stable.
The lowest-earning 60 percent of households in Miami-Dade accounted for less than one quarter of all household income earned in the County. Household Poverty
179,200 households (21.3 percent of the total) were in poverty in 2013. Married-couple family households, which make up 43 percent of all households in the County,
had 44,500 in poverty. Nonfamily households, including many young single and elderly households and making up about 32 percent of total households, had 79,400 persons in poverty. And single-parent female-headed households, accounting for about 18 percent of all households, contributed 43,600 poverty households to the total.
35 percent of all individuals living in poverty lived in married-couple family households, while 33 percent lived in single-parent female-headed households, and 22 percent lived in nonfamily households.
Over 51 percent of all children living in poverty, 147,000 children, lived in single-parent female-headed households in 2013.
33,200 families live on incomes that are less than one-half the poverty level. For example, a single-parent female-headed family with two children, at exactly 50 percent of the poverty threshold, would have to live on $782 per month.
More than one quarter of all households in Miami-Dade County received SNAP (Food Stamps) in 2013.
Income & Poverty in Miami-Dade: 2013
2015 RER Planning Research & Economic Analysis. Page | 7
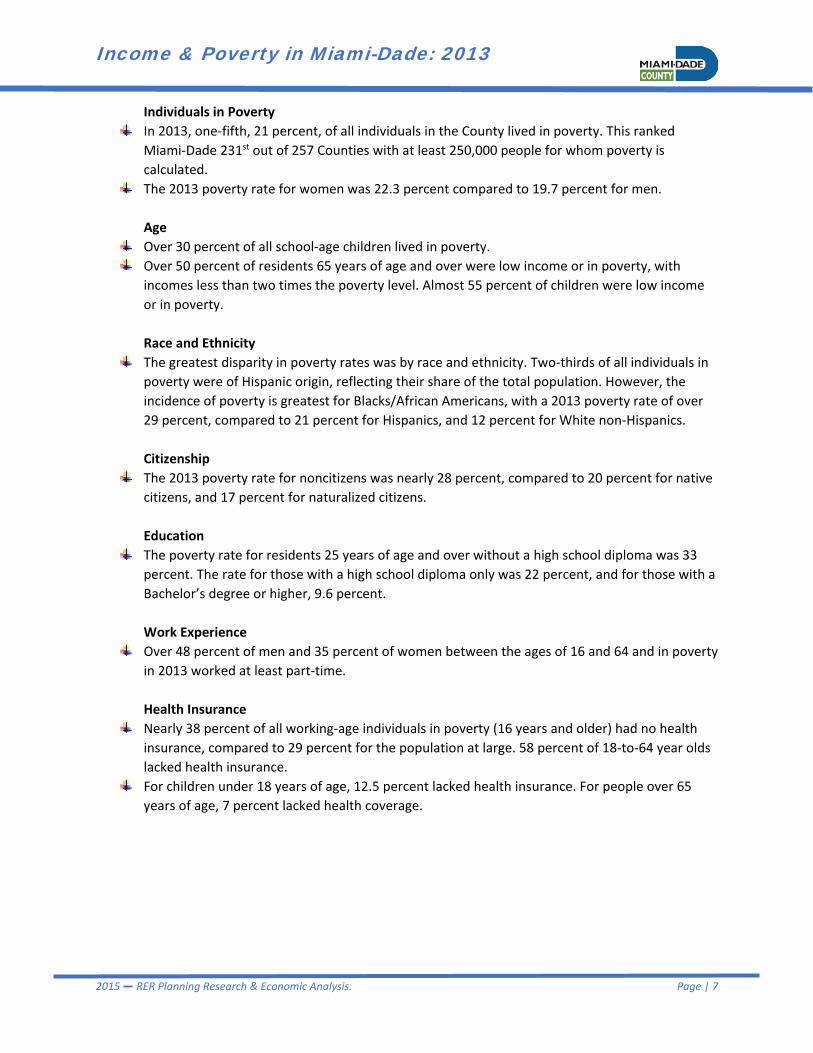
Individuals in Poverty In 2013, one-fifth, 21 percent, of all individuals in the County lived in poverty. This ranked
Miami-Dade 231st out of 257 Counties with at least 250,000 people for whom poverty is calculated.
The 2013 poverty rate for women was 22.3 percent compared to 19.7 percent for men. Age
Over 30 percent of all school-age children lived in poverty. Over 50 percent of residents 65 years of age and over were low income or in poverty, with
incomes less than two times the poverty level. Almost 55 percent of children were low income or in poverty. Race and Ethnicity
The greatest disparity in poverty rates was by race and ethnicity. Two-thirds of all individuals in poverty were of Hispanic origin, reflecting their share of the total population. However, the incidence of poverty is greatest for Blacks/African Americans, with a 2013 poverty rate of over 29 percent, compared to 21 percent for Hispanics, and 12 percent for White non-Hispanics. Citizenship
The 2013 poverty rate for noncitizens was nearly 28 percent, compared to 20 percent for native citizens, and 17 percent for naturalized citizens. Education
The poverty rate for residents 25 years of age and over without a high school diploma was 33 percent. The rate for those with a high school diploma only was 22 percent, and for those with a Bachelor’s degree or higher, 9.6 percent. Work Experience
Over 48 percent of men and 35 percent of women between the ages of 16 and 64 and in poverty in 2013 worked at least part-time. Health Insurance
Nearly 38 percent of all working-age individuals in poverty (16 years and older) had no health insurance, compared to 29 percent for the population at large. 58 percent of 18-to-64 year olds lacked health insurance.
For children under 18 years of age, 12.5 percent lacked health insurance. For people over 65 years of age, 7 percent lacked health coverage.

Income & Poverty in Miami-Dade: 2013
2015 RER Planning Research & Economic Analysis. Page | 9
Introduction Who are the poor? What do they look like? Do we have a clear picture or is our understanding clouded by stereotypes and misunderstandings? Poverty is often measured in two ways: relatively poor compared to others, and absolutely poor without the basic necessities. Relative poverty refers to the distribution of wealth and income across a population. In a market economy where there are economic “winners” and “losers,” there is arguably a tendency for wealth and income to concentrate in the hands of the economic “winners.” Once the nature and extent of this distribution is identified it then becomes a subjective matter for the community to decide how much concentration, or inequality, is acceptable or tolerable. This concept of relative poverty can change over time and between places. During times of strong economic growth when “the tide is rising” for most everyone, it may not seem as important whether inequality is growing. There are other times, when income and living standards for many are stagnating, that it may be of great concern that inequality is growing. Incomes considered comparatively poor in 2015 can seem far different from what was considered poor in 1990. Yet, even as this standard changes, it remains important to understand the nature and magnitude of this relative poverty. It can have significant social and economic consequences for the County, measurable in dollars and cents lost to alternative productive uses.
The second approach to measuring poverty is from an absolute sense. Absolute poverty is a condition in which there is a lack of sufficient resources to satisfy even basic biological and economic necessities. It is not merely whether people are going hungry or can’t afford adequate shelter; absolute poverty is a condition in which individuals or families lack the resources to fully participate in economic life. For example, do workers have access to reliable transportation to and from employment opportunities? And, like relative poverty, the standard of what defines absolute poverty can change over time. In 1990 access to a computer may not have been considered by most to be an economic necessity. In 2015 there is little doubt that such is the case for one to fully participate in the information technology-dependent economy. Once again, understanding the nature and extent of absolute poverty in Miami-Dade County is vital to the ability to assess, and when necessary, mitigate, the impacts and costs to the region.
Poverty can be measured in two ways: relatively poor compared to others, and absolutely poor without enough to eat, or a car to get to work.

Income & Poverty in Miami-Dade: 2013
2015 RER Planning Research & Economic Analysis. Page | 10
The following report is the first in a series of three reports that explore both of these measures of poverty in Miami-Dade County and, to the extent possible, the change over time and across the landscape of the County since 1990. They draw upon data from the 1990 and 2000 Decennial Censuses, and the 2013 American Community Survey (ACS) 1-year and 5-year estimates. This report, Income & Poverty in Miami-Dade: 2013, is a look at the most current measures of poverty in the County and places it in context with other counties, all of Florida and the nation. The second report, Patterns of Poverty and Inequality in Miami-Dade: 1990-2013, will explore in more detail the geographic distribution of poverty across the County and the degree to which this distribution as well as the characteristics of the poor have changed since 1990. The third report, People Living in Poverty in Miami-Dade: 1990-2013, will investigate the population living in areas of the County where there was concentrated poverty reported in the Censuses of 1990 and 2000 and the 2013 ACS 5-year estimates. It will explore the extent to which key characteristics of the population living in such areas have or have not changed over time.

Income & Poverty in Miami-Dade: 2013
2015 RER Planning Research & Economic Analysis. Page | 11
County-Wide Households and Families The poverty rate in Miami-Dade County for individuals was 21 percent, according to the 2013 ACS 1-year estimates1, the most recent year for which data was available. Responses to the survey questions specific to income help identify the general economic situation of the community (i.e., economic well-being, sources of income, poverty status, etc.). In order to identify poverty, the Census Bureau uses a “set of dollar value thresholds” that vary by family size and composition to determine who is poor2. Household poverty is determined by the poverty status of the householder as defined at the unit level. Households are identified as poor when the total income of the householder’s family in the last 12 months is below the designated poverty threshold. Additionally, if a household is designated as poor, then every individual in it is also considered poor. For nonfamily householders and people living alone or with “unrelated individuals,” poverty thresholds vary by age. Thus, income becomes the vital measure of general economic circumstances. With this in mind, we will start with a look at incomes in Miami-Dade County.
Household Income One measure of household income is the median. The median income is the income level for which exactly half of all households earn more and half earn less. This can also be considered the income of the typical household. The 2013 median household income in Miami-Dade County was $41,913. The
1 Note on the data: The American Community Survey (ACS) is an ongoing statistical survey or questionnaire to regularly gather data about the social and economic conditions of the nation. The Census Bureau surveys 3 million American households each year and publishes data for every community in the country right down to groups of blocks through 3 sets of reports, 1-year, 3-year and 5-year estimates. The longer time frames allow for the collection of more surveys over time leading to more statistically meaningful results. 2 U.S. Census Bureau. (2013), American Community Survey and Puerto Rico Community Survey, 2013 Subject Definitions, Retrieved February 25, 2015, from http://www.census.gov/acs/www/Downloads/data_documentation/SubjectDefinitions/2013_ACSSubjectDefinitions.pdf

Income & Poverty in Miami-Dade: 2013
2015 RER Planning Research & Economic Analysis. Page | 12
Census Bureau reports the income for all counties in the U.S., and this median household income ranks Miami-Dade as 242nd out of the 263 counties in the US with a population of at least 250,000. This places Miami-Dade in the bottom 8 percent of all U.S. counties. In other words, 92 percent of the largest counties had higher median incomes than Miami-Dade.
The median household income for all of Florida in 2013 was $46,036, 10 percent higher than the Miami-Dade figure. The median household income in Broward was $50,446 (170/263) while in Palm Beach County it was $51,804 (157/263).
The ACS also groups households according to income ranges. Nearly 32 percent of all Miami-Dade households, almost one-third, earned less than $25,000 in 2013, while more than half, 57 percent, earned less than $50,000. In comparison, 50 percent of Broward households, 48 percent of Palm Beach households, and 53 percent of all Florida households earned less than $50,000. At the other extreme, 18 percent of all Miami-Dade County households earned $100,000 or more versus 21 percent in Broward, 23 percent in Palm Beach, and 18 percent for all of Florida.
Household Income by Race and Ethnicity The data shows only a modest variation in income between Miami-Dade and neighboring counties. However, it shows a great disparity between racial and ethnic groups within Miami-Dade. While county-wide 57 percent of households earned less than $50,000 per year, for Black non-Hispanic households, that ratio was 68.5 percent, and just 9.1 percent earned more than $100,000. The opposite extreme was
White non-Hispanic households with 37 percent earning less than $50,000 per year and 32 percent earning more than $100,000. Hispanic households fell in between and toward the lower end with 60 percent earning less than $50,000 and 15 percent with annual earnings in excess of $100,000.
Median incomes tell a similar story. Black non-Hispanic households had a median annual income of $32,944. The White non-Hispanic median household income was almost exactly double at $64,976, with the Hispanic household median at $39,674.

Income & Poverty in Miami-Dade: 2013
2015 RER Planning Research & Economic Analysis. Page | 13
The Census Bureau does not have a definition for the concept of “middle class.” One way, however, to measure the distribution of income is by comparing the shares of income of equal-sized groups of
households. The Census Bureau uses five groups, or quintiles. Table 1 shows how this would be done. If one were to line up all the households in the County by lowest to highest income and then break the line into five equal groups of 167,898 households each, the result would be income quintiles. By comparing the incomes earned by each group, an income distribution picture emerges.
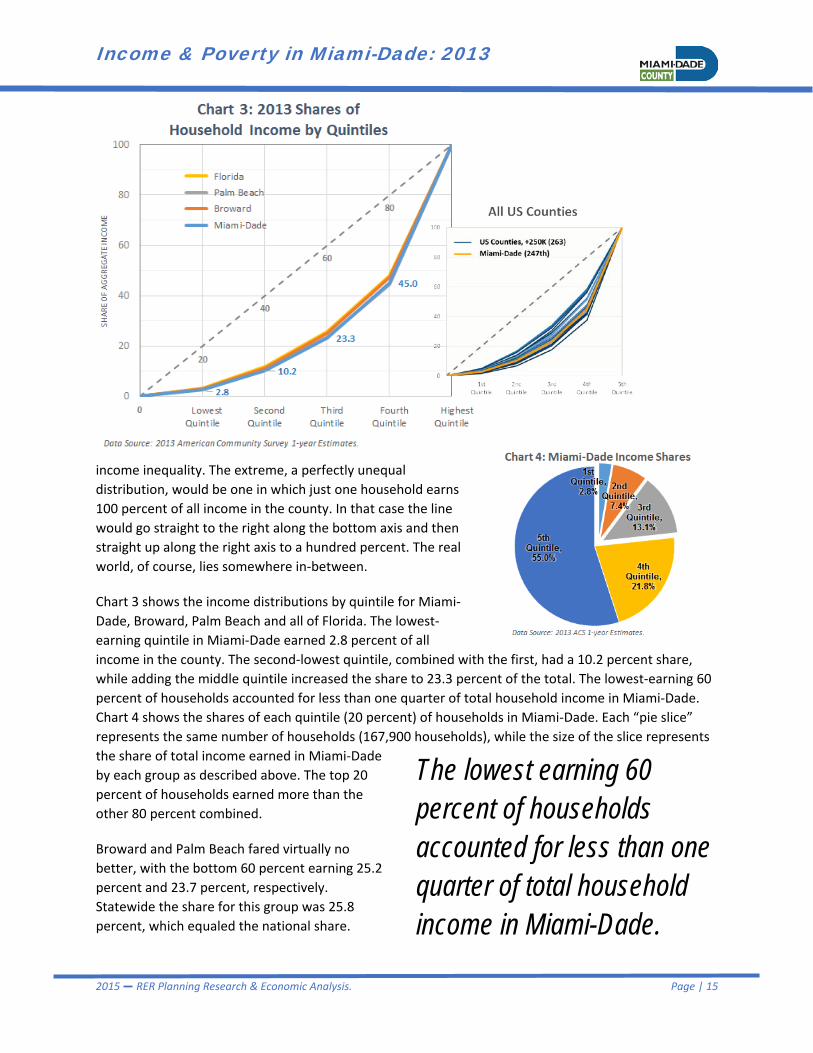
The lowest Miami-Dade income quintile in 2013, the lowest-earning 20 percent of households, earned less than $16,393 per year, with an average annual income of $8,729, and accounted for only 2.8 percent of income earned by all households combined. The second quintile earned more than $16,393 and less than $32,202, with an average of $23,832 and a share of the total equal to 7.4 percent. The average income of the second quintile was 170 percent higher than the average of the first quintile. The third quintile of households had incomes between $32,202 and $53,226, an average of $42,198, and accounted for 13.1 percent of total household income. The fourth fell into the $53,226 to $91,255 range, averaged $69,961, and claimed a 21.8 percent share of all households’ income. Finally, households in the top quintile earned $91,256 or more, averaged $176,875 per year and accounted for more than half, 55 percent, of all household income earned in Miami-Dade County. This top quintile, the top earning 20 percent of households, had an average income that was 1,903 percent higher than the average of the lowest 20 percent, and even 153 percent higher than the average of the second highest-earning 20 percent of households, the fourth quintile.
Household Living Wage While the top quintile average was very high relative to all other households, what about the averages in the bottom four quintiles? Were they low only in comparison to the top group, or were the average incomes of the bottom 60 to 80 percent of households low
Households in the top quintile averaged $176,875 per year and accounted for more than half, 55 percent, of all income earned in Miami-Dade County. This top quintile had an average income that was 1,903 percent higher than the average of the lowest 20 percent.

Income & Poverty in Miami-Dade: 2013
2015 RER Planning Research & Economic Analysis. Page | 14
in absolute terms? The lowest-earning 60 percent of Miami-Dade households earned less than $53,226 per year. How does that amount compare to the average annual cost of living in Miami-Dade? There are many sources available to get an estimate of the cost of living in Miami-Dade. Three of them are combined here to try and obtain an unbiased estimate: the MIT Living Wage Model3, the Economic Policy Institute Family Budget Calculator4, and the U.S.
HUD income limits for low income households5. All of these sources report what is a low but secure level of income. This will be referred to in the following as a living income. The first two are based on an estimate of actual household expenditures while the third is based on relative income levels.
The estimated necessary annual income for a family of three from each data source is provided in Table 2. The average from all three provides a living income estimate of $54,100 for a family of three. This happens to be nearly identical to the upper limit of 60 percent of Miami-Dade Households, $53,226. It means that about 60 percent of all households in Miami-Dade barely scratch out a living income or earn much less. Now, this in an average based on the assumption that all households have three people. As will be seen below, the largest share of households in the lowest income ranges are nonfamily households. They may be single-person elderly households or households with one or two unrelated individuals. For this reason, the $54,100 per year living income may be overstated. However, even if it were overstated by, say 25 percent, it would yield an average living income of approximately $41,000 per year, about 98 percent of the County’s median income. Therefore, we can say with confidence that 50 to 60 percent of Miami-Dade households earn less than a “living” income.
Using the household quintile data, the degree of income inequality can be studied by comparing the actual distribution in the County to a perfectly equal distribution. If every household in the county earned exactly the same income then the county would have a perfectly equal distribution. Any 20 percent group of households would earn the same share of aggregate income as any other 20 percent group and the distribution would look like the dashed diagonal line in Chart 3. The farther the line showing the actual income shares by quintile group is from the straight diagonal, the greater is the
3 The MIT Living Wage Model, Online: http://livingwage.mit.edu/ (May 27. 2015) 4 The Economic Policy Institute Family Budget Calculator, http://www.epi.org/resources/budget/ (May 27, 2015) 5 U.S. Dept. of Housing and Urban Development, http://www.huduser.org/portal/datasets/il/il2013/2013summary.odn (May 27, 2015)
50 to 60 percent of Miami-Dade households earn less than a “Living” income.
Income & Poverty in Miami-Dade: 2013
2015 RER Planning Research & Economic Analysis. Page | 15
income inequality. The extreme, a perfectly unequal distribution, would be one in which just one household earns 100 percent of all income in the county. In that case the line would go straight to the right along the bottom axis and then straight up along the right axis to a hundred percent. The real world, of course, lies somewhere in-between.
Chart 3 shows the income distributions by quintile for Miami-Dade, Broward, Palm Beach and all of Florida. The lowest-earning quintile in Miami-Dade earned 2.8 percent of all income in the county. The second-lowest quintile, combined with the first, had a 10.2 percent share, while adding the middle quintile increased the share to 23.3 percent of the total. The lowest-earning 60 percent of households accounted for less than one quarter of total household income in Miami-Dade. Chart 4 shows the shares of each quintile (20 percent) of households in Miami-Dade. Each “pie slice” represents the same number of households (167,900 households), while the size of the slice represents the share of total income earned in Miami-Dade by each group as described above. The top 20 percent of households earned more than the other 80 percent combined.
Broward and Palm Beach fared virtually no better, with the bottom 60 percent earning 25.2 percent and 23.7 percent, respectively. Statewide the share for this group was 25.8 percent, which equaled the national share.
The lowest earning 60 percent of households accounted for less than one quarter of total household income in Miami-Dade.

Income & Poverty in Miami-Dade: 2013
2015 RER Planning Research & Economic Analysis. Page | 16
The smaller pop-out in chart 3 places Miami-Dade’s distribution in the context of the 263 largest counties across the US for which the Census Bureau reports income by quintile. Recall that the closer to the straight diagonal line the distribution lies, the more equal the distribution, and note that Miami-Dade lies among the counties farthest from the diagonal. In fact, compared to Miami-Dade’s income distribution, only 6 out of the 263 counties had an income distribution in 2013 that was more unequal.
Income distribution matters to the local society and economy in more than just an abstract moral sense or in that it isn’t considered fair. There are measurable social and economic costs that have been associated with higher levels of inequality. In particular, higher inequality is associated with higher levels of crime and slower economic growth rates. Many studies show a strong link between income inequality and crime6. There has also been much research into the effects of inequality on economic growth for, among other reasons, it affects the ability of some members of a society to invest in their own education7, “the great equalizer.”
Household Income by Source The US Census Bureau, through the ACS, also identifies a variety of income sources for households. This data can be somewhat misleading since each household can earn income from multiple sources, or in some cases, from none. In 2013, 78.8 percent of all households in Miami-Dade had earnings from at least one source. The major source, by far, is wage or salary income. Seventy-five percent of all households had wage or salary earnings, and the average amount per household in 2013 was $67,755.
In Broward, 75.8 percent had wage or salary earnings, with a household average of $72,404. Palm Beach, with a much larger retirement community, had fewer of their households with wage and salary income in 2013, 66.5 percent, but
6 Thomas D. Stucky, Seth B. Payton & John R. Ottensmann (2015): Intra and inter-neighborhood income inequality and crime, Journal of Crime and Justice, DOI: 10.1080/0735648X.2015.1004551 7 OECD (2014): Focus on Inequality and Growth: Does Income Inequality Hurt Economic Growth. Online: http://www.oecd.org/els/soc/Focus-Inequality-and-Growth-2014.pdf

Income & Poverty in Miami-Dade: 2013
2015 RER Planning Research & Economic Analysis. Page | 17
had the highest average, $76,204 per household. Statewide, 69 percent of all households earned wage and salary income averaging $65,274 in 2013.
The second most significant source of earnings in retiree-rich Florida comes from social security. Among all Miami-Dade households, 29.3 percent had earnings from social security. Broward was approximately the same at 29.1 percent while, predictably, the numbers for Palm Beach County and statewide households were much higher, at 38.8 percent and 36.3 percent, respectively. The average 2013 social security income for Miami-Dade households that received it was very low, $14,298 per household. This was lower than either Broward or Palm Beach, with average of $16,655 and $19,324, respectively. Statewide the average earnings from social security was $17,861 in 2013.
Among the other income sources, 8.2 percent of Miami-Dade earned retirement income, which includes income from pensions, annuities, IRAs and similar plans, but not social security. The amount averaged $22,193 per household with such income. Also in 2013, 12.1 percent of Miami-Dade households had earnings from interest, dividends or rental income, with the average per household with such earnings at $22,771.
Another major difference between Miami-Dade and neighboring counties is in earnings from transfer payments. In a data indicator that may reflect a relatively larger elderly and/or disabled population that is in or near poverty compared to neighboring counties, 7.1 percent of Miami-Dade households received supplemental security income, compared to only 4.2 percent in Broward, 3.2 percent in Palm Beach and 5 percent statewide. Supplemental Security Income provides an income floor, a minimum amount of income, for elderly and disabled with limited financial means. While the share of households is higher in Miami-Dade, the average per household is not, just $7,918 in 2013 compared to $9,543 in Broward, $10,111 in Palm Beach and $9,195 statewide. This disparity may indicate that even though the elderly and/or disabled population is significantly larger in Miami-Dade, their cohorts in Broward and Palm Beach may be poorer since it takes a larger check to lift them up to the desired income floor. Food stamp/SNAP usage is also much higher in Miami-Dade, where 23.8 percent of all households receive food stamps, nearly double the share in Broward at 12.1 percent. In Palm Beach County 9 percent of households received food stamps, and statewide the share was 13.4 percent.
In Miami-Dade 29.3 percent of all households received social security, earning an average of $14,298 per year.

Income & Poverty in Miami-Dade: 2013
2015 RER Planning Research & Economic Analysis. Page | 18
Household Poverty Status The household poverty rate in Miami-Dade County was 21.3 percent (179,200 households), according to the 2013 ACS 1-year estimates8. This rate was much higher than the rates for neighboring counties. In Broward 14.4 percent of households (95,600 households) were living in poverty, while the rate in Palm Beach was 12.7 percent (67,600 households) and Statewide, 15.6 percent (1,123,500 households). Of the 179,200 households in poverty in the County, married-couple families accounted for 24.9 percent (44,500 households) compared to 20 percent in Broward and 21 percent in Palm Beach and Statewide (Chart 6a). Miami-Dade families with a male householder and no wife made up 6.5 percent (11,600) of all poor households in the County compared to 4.5 percent in Broward, 5.9 percent in Palm Beach and 5.5 percent Statewide. Families with a female head and no husband accounted for 24.3 percent (43,600) of poor households in Miami-Dade. In Broward this number was 27.6 percent, Palm Beach, 26.2 percent and all of Florida, 24.8 percent. Nonfamily households are defined as having unrelated people living together or a person living alone. This group made up the largest segment of households in poverty in Miami-Dade, accounting for 44.3 percent of the total (79,400 households).
Elderly nonfamily households with a householder 65 years of age or older represented 43 percent of all nonfamily households in poverty (34,300 households). In Broward 48 percent of all poor households were nonfamily households. Palm Beach County saw similar numbers with 47 percent of all poor households being nonfamily households and Statewide 49 percent of all households in poverty were nonfamily.
8 The Census Bureau uses a set of money income thresholds that vary by family size and composition to determine who is in poverty. If a family's total income is less than the family's threshold, then that family and every individual in it is considered in poverty. The official poverty thresholds do not vary geographically, but they are updated for inflation using Consumer Price Index (CPI-U). The official poverty definition uses money income before taxes and does not include capital gains or noncash benefits (such as public housing, Medicaid, and food stamps).
Nonfamily households accounted for 44.3 percent (79,400/179,200) of all poverty households. 34,300 of these were elderly nonfamily households.

Income & Poverty in Miami-Dade: 2013
2015 RER Planning Research & Economic Analysis. Page | 19
Another way to look at the data and understand the incidence of household poverty is to measure the share of each household type that is poor. In Miami-Dade County there were 362,700 married-couple families. They represented 43 percent of all County households. Of these, 12.3 percent (44,500 households) were poor. The next largest group of households was nonfamily households, of which there were 269,000. Of these, 29.5 percent were poor (79,400 households). Single-parent female-headed families totaled 149,700 and this group had a poverty rate of 29.1 percent (43,600 households). The 58,100 male-headed single-parent households had a poverty rate of 20 percent (11,600 households). Chart 6b shows how Miami-Dade County households fared compared to Broward, Palm Beach and Florida. An interesting note, marriage would appear to be a panacea for poverty considering the differences in relative rates. However, the ACS shows that for married-couple families with only one spouse working, the poverty rate jumps up to 18 percent. In Miami-Dade in 2013, less than 14 percent of the married-couple households in poverty had two or more workers. This could be particularly significant for demographic sub-groups such as young Black males with very high relative unemployment rates.
Population in poverty by household type To this point, the data has focused on the numbers and types of households rather than individuals. Chart 7 looks at the number of individuals in poverty and the types of households in which they lived. In Miami-Dade in 2013 there were 541,100 people in poverty. Of this total, over 78 percent lived in family households with the largest share living in married-couple families, 35 percent (189,500 people). Broward County saw 26 percent of their poverty population living in married-couple families, while in Palm Beach it was 27 percent, and statewide, 29 percent. Miami-Dade had nearly 33 percent of individuals in poverty (177,500 people) living in a

Income & Poverty in Miami-Dade: 2013
2015 RER Planning Research & Economic Analysis. Page | 20
single-parent female-headed household. While nonfamily households made up over 44 percent of all Miami-Dade households in poverty, of their share of all poor individuals, they accounted for less than 22 percent (118,700 people) due to the predominance of single-person households.
It is only in Miami-Dade where people in poverty living in married-couple households outnumber those living in single-parent female-headed households. In Broward
County over 39 percent of the poverty population live in female-headed households compared to less than 26 percent in married-couple households. In Palm Beach County it was 35 percent in female-headed households compared to 27 percent in married-couple families, and state-wide it was, 35 percent in single-parent female-headed families and 29 percent in married-couple families.
More detail on the age of people living in poverty will follow in the next section of this report. However, while the focus is on household structure it’s worth asking, where did children in poverty live? There were 535,800 children under the age of 18 in Miami-Dade in 2013. More than one quarter of them, 27.4 percent, lived in poverty. That is, 147,000 Miami-Dade County children lived in poverty. Unlike when the adult poor were included and the population was split between married-couple and single-parent female-headed households, a majority of children in poverty lived in single-parent female-headed households. In Miami-Dade, a majority of children in poverty, 51.4 percent, lived in single-parent female-headed households, amounting to 75,600 children. For comparison, in Broward the percentage was even higher; 65 percent (48,000 children) lived in single-parent female-headed households. In Palm Beach it was 57 percent (33,800 children), and statewide, 58 percent (551,300
The largest share of all people in poverty and living in families, 35 percent (189,500 people), lived in married couple families.
In Miami-Dade, a majority of children in poverty, 51.4 percent (75,600 out of 147,000) lived in single-parent female-headed households.

Income & Poverty in Miami-Dade: 2013
2015 RER Planning Research & Economic Analysis. Page | 21
children). Out of Miami-Dade’s 51 percent, 15.7 percent were preschool children under 5 years of age. That rate was similar to Palm Beach County and statewide, but the share of preschool children in Broward was higher at 21 percent. Though there were far fewer male-headed households, still there were over 14,800 children in poverty living in this type of household in Miami-Dade, with a little less than half, 43 percent, of preschool age.
The balance of children in poverty were in married-couple families. Over 11 percent of all children in poverty (16,300 children) were under 5 years of age and living in married couple families. An additional 27.4 percent (40,300 children) were 5-to-17 year-olds living in these families, for a total of almost 39 percent (56,600 children) of Miami-Dade children living in poverty.
Degree of Poverty in Families The discussion to this point has referred to poverty as a homogeneous group; a family is either poor or it’s not. This section will look at the degree or intensity of poverty in the context of families. Chart 9 shows the ratio of income to poverty among families for the three counties in South Florida. Note these aren’t shares of families, but rather, the actual number of families. Miami-Dade has nearly 150,000 more total families than Broward and over 240,000 more than Palm Beach. The poverty status of a family is determined by comparing annual income to a set of dollar values called thresholds. These thresholds are estimated nationally for families by family size, the number of children, and age of the householder. They do not vary geographically and are updated annually for changes in the cost of living. An appendix table shows the 2013 thresholds.
As an illustration of just what these ratios mean in terms of dollars and cents, consider that in South Florida there are 68,300 families living on incomes less than one-half of the poverty threshold (“Under .50”). The poverty threshold is the same for all of them regardless of which county the live in. These 68,300 families are of all sizes and types. However, as an example, take a married-couple family of four people including two children. The poverty threshold for such a family in 2013 was $23,624. Therefore a family earning less than 50 percent of the poverty threshold would have earned less than $984 per month9. In the case of a single-parent female-headed household with two children, they would have earned less than $782 per month. For a two-person elderly household, that would have meant living on an income of $587 per month.
9 When the Census Bureau calculates these thresholds they use money income before taxes and do not include capital gains or noncash benefits (such as public housing, Medicaid, and food stamps). They would include social security and SSI.

Income & Poverty in Miami-Dade: 2013
2015 RER Planning Research & Economic Analysis. Page | 22
Another way to evaluate the intensity of poverty is to consider the income deficit, or shortfall, that would have to be offset in order to raise a family up to the poverty threshold. In Miami-Dade it would take $699 per month to raise the average family up to the poverty threshold. In other words, if every family below the poverty threshold in 2013 had received a check for $699 each month, on average, then every family in poverty, along with the 422,400 people living in them, would have been lifted up to the poverty threshold. The total bill in Miami-Dade County would have been $69.8 million per month to write checks and eliminate family poverty in 2013.10 In the neighboring counties and statewide the monthly deficit was greater. In Broward it would have taken an average of $749 per month, in Palm Beach, $769 per month, and statewide, $781 per month.
The $699 monthly deficit was the average for all families. This amount varies by family type. For married-couple families in Miami-Dade the average monthly deficit was smaller, $632 per month. In
Broward married-couple families’ average monthly shortfall was $677, in Palm Beach, $667 monthly, and statewide, $696. The largest shortfalls by far were for single-parent female-headed families. In Miami-Dade their shortfall was $810 per month to lift them up to the poverty line. Female-headed single-parent households in Broward would have needed $804 monthly while those in Palm Beach and statewide would have required $838 and $866, respectively.
Benefits It was noted previously that poverty is calculated based on cash income and that non-cash benefits such as the Supplemental Nutrition Assistance Program (SNAP or food stamps) and Medicaid are specifically excluded from the calculation. In Miami-Dade County 25.5 percent of all households received SNAP. This is substantially higher than Broward (13.4 percent), Palm Beach (10.2 percent) and the rest of Florida
10 Similar data on the income deficit for nonfamily households is not available and therefore was not included here.
The total bill in Miami-Dade County would have been $69.8 million per month to write checks and eliminate family poverty in 2013.

Income & Poverty in Miami-Dade: 2013
2015 RER Planning Research & Economic Analysis. Page | 23
(15.1 percent). Another difference between Miami-Dade, Broward and Palm Beach Counties is that in Miami-Dade a majority of households receiving food stamps, 54.5 percent, do not have children. In Broward 51.6 percent of recipients do have children while in Palm Beach County 51.7 percent have children.
Chart 11 shows the share of households receiving SNAP benefits by household type. In Miami-Dade the largest share goes to married-couple families either with or without children, accounting for 35.4 percent of households that receive food stamps. Of course, they make up the largest share of all families. Married couples with children make up 20 percent of SNAP households. Single-parent female-headed households with children were an additional 20 percent of SNAP households, and without children, another 11 percent. Nonfamily households, most likely especially elderly households, accounted for nearly 24 percent of households receiving SNAP.
The second major noncash benefit program that doesn’t factor directly into poverty rates is Medicaid benefits. This data is not available by household or family type. It is, however, available by the ratio poverty to income and will be presented below with the poverty summary of individuals.

Income & Poverty in Miami-Dade: 2013
2015 RER Planning Research & Economic Analysis. Page | 24
Income and Poverty of Individuals – 2013 This section will now turn to an assessment of poverty in the County for individuals regardless of the type of family or household structure in which they live. Households and families are the most fundamental socioeconomic decision-making units in a region, and therefore, understanding their income and poverty patterns is important. However, using them as a window through which to look at poverty also adds a layer of complexity to an already complex issue. This section will explore poverty data at the individual level.
The poverty rate of all individuals in Miami-Dade County was 21 percent according to the 2013 ACS 1-year estimate. In other words, one out of five residents lived in poverty in 2013. As shown in chart 12, this places the county near the bottom of the 4th quintile of counties. Miami-Dade ranks 231st out of 258 of the counties identified by the Census Bureau with over 250,000 residents for whom the poverty status was determined. Ninety percent of all U.S. counties had lower poverty rates than Miami-Dade. The median poverty rate across all counties was 16.4 percent in 2013. Broward County, with a poverty rate of 15.1 percent, ranked 136th, while Palm Beach County ranked 129th with a poverty rate of 14.9 percent.
The data shows the poverty rate for women is higher than for men. The 2013 poverty rate for men in Miami-Dade was 19.7 percent and for women, 22.3 percent. In Broward the rates were 14.3 and 15.8 percent, respectively. Palm Beach County saw rates for men and women of 13.6 and 16.1 percent, respectively. Statewide the male poverty rate was 16 percent compared to a rate of 18 percent for women.
The data shows the poverty rate for women is higher than that for men, 22.3 percent vs 19.7 percent.

Income & Poverty in Miami-Dade: 2013
2015 RER Planning Research & Economic Analysis. Page | 25
Poverty by Age and Gender The poverty distribution by county, age and gender can be seen in Chart 13. Over 30 percent of all preschool-aged children in Miami-Dade, nearly 46,000 children, lived in poverty. An additional 103,000 school-aged children were in poverty, resulting in a total of 149,000 Miami-Dade children under the age of 18 in poverty. This is 27.5 percent of the total population in poverty. At the other extreme, there were 45,000 seniors between the ages of 65 and 74 (“young” retirees) in poverty and an additional 41,000 over the age of 74. This total of 86,000 seniors amounts to 16 percent of the poor population. Therefore the young and the old account for 43.4 percent of the total poverty population. The balance, 306,000 poor, almost 57 percent of the population in poverty, were working age, 18 to 64 years of age.
In comparison, children under the age of 18 accounted for 30 percent of the Palm Beach County population in poverty and in Broward, children were just over 27 percent of the poor. Statewide (not shown), children made up 30 percent of those who lived in poverty. As for the elderly, Broward data showed 14 percent of the poor were over the age of 65. In Palm Beach this group made up just less than 14 percent, and statewide, those over the age of 65 accounted for nearly 12 percent of the poor.
In Miami-Dade women accounted for 55 percent of the total population in poverty. Working-age women (18-to-64 year olds) accounted for nearly 1 out of 3 (31.8 percent) of the poor in Miami-Dade. By comparison, working-age men accounted for 24.7 percent of the poverty population. The numbers are very similar across South Florida and statewide. In Broward County 54 percent of the population in
poverty was women. Thirty-two percent of all poor were working-age women. And in Palm Beach County 56 percent of the poverty population was women, and working-age women accounted for 33 percent of the total poor. All of Florida was similar. Women made up 54 percent of those in poverty and working-age women were 33 percent of the total.
Over 30 percent of all preschool aged children in Miami-Dade, nearly 46,000 children, lived in poverty.
Income & Poverty in Miami-Dade: 2013
2015 RER Planning Research & Economic Analysis. Page | 26
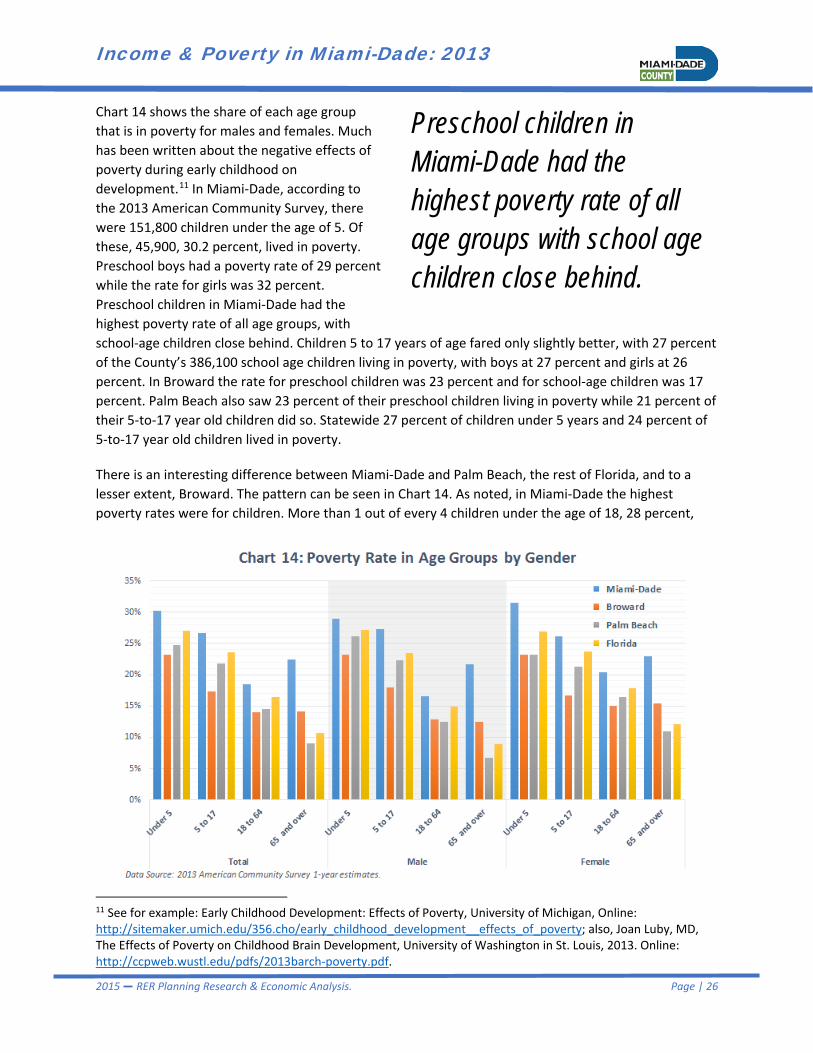
Chart 14 shows the share of each age group that is in poverty for males and females. Much has been written about the negative effects of poverty during early childhood on development.11 In Miami-Dade, according to the 2013 American Community Survey, there were 151,800 children under the age of 5. Of these, 45,900, 30.2 percent, lived in poverty. Preschool boys had a poverty rate of 29 percent while the rate for girls was 32 percent. Preschool children in Miami-Dade had the highest poverty rate of all age groups, with school-age children close behind. Children 5 to 17 years of age fared only slightly better, with 27 percent of the County’s 386,100 school age children living in poverty, with boys at 27 percent and girls at 26 percent. In Broward the rate for preschool children was 23 percent and for school-age children was 17 percent. Palm Beach also saw 23 percent of their preschool children living in poverty while 21 percent of their 5-to-17 year old children did so. Statewide 27 percent of children under 5 years and 24 percent of 5-to-17 year old children lived in poverty.
There is an interesting difference between Miami-Dade and Palm Beach, the rest of Florida, and to a lesser extent, Broward. The pattern can be seen in Chart 14. As noted, in Miami-Dade the highest poverty rates were for children. More than 1 out of every 4 children under the age of 18, 28 percent,
11 See for example: Early Childhood Development: Effects of Poverty, University of Michigan, Online: http://sitemaker.umich.edu/356.cho/early_childhood_development__effects_of_poverty; also, Joan Luby, MD, The Effects of Poverty on Childhood Brain Development, University of Washington in St. Louis, 2013. Online: http://ccpweb.wustl.edu/pdfs/2013barch-poverty.pdf.
Preschool children in Miami-Dade had the highest poverty rate of all age groups with school age children close behind.

Income & Poverty in Miami-Dade: 2013
2015 RER Planning Research & Economic Analysis. Page | 27
were living in poverty. The rate fell off sharply for working-age residents 18 to 64 years of age, where the poverty rate was 19 percent, or 1 in 5 in poverty. The rate for the elderly 65 years and over jumped back up significantly. Just less than 1 out of every 4 seniors in Miami-Dade (23 percent) lived in poverty. In Broward there was a similar drop-off from children to the 18-to-64 year old population, 19 percent down to 14 percent. The poverty rate for the over-65 population was approximately the same at 14.1 percent. However, in Palm Beach County and statewide the pattern was different. Each had a similar drop-off in the poverty rates of children compared to working age, 23 percent to 15 percent and 25 percent to 16 percent, respectively. Unlike in Miami-Dade and Broward, though, the poverty rate continued to drop for the elderly. In Palm Beach the poverty rate for those 65-years-old and above was 9 percent, while statewide it was 11 percent, just about 1 out of 10.
Chart 15 continues to show poverty according to age group; in this case, the ratio of income-to-poverty by age group. Looking at the population under 18-years-old, 53 percent lived in households earning less than two times the poverty threshold. This represents the poverty, near-poverty and low-income populations, and is nearly 10 percent higher than in Broward, about 6.5 percent higher than Palm Beach, and 4 percent higher than statewide. In Miami-Dade, nearly 28 percent of this age group lived below the poverty threshold, and 11 percent fell into the extremely poor range with a ratio of income to poverty of less than 0.5, or, in other words, in a household earning less than one-half the poverty threshold. But, interestingly, 17 percent of this age group fell into the 0.5 to .99 range. This is three to six percent higher than the other geographies.
This same pattern is repeated in the working-age population, 18-to-64 years old. Forty-one percent fell into the low-income and poverty range, with a ratio of less than 2 times the poverty level. This is about 5 percent higher than the statewide working-age population, 7 percent higher than Palm Beach and 8 percent higher than Broward. The extreme poor of this age group in Miami-Dade, 7.7 percent, was about the same as the other geographies. The biggest
Just less than 1 out of every 4 seniors in Miami-Dade (23 percent) lived in poverty.

Income & Poverty in Miami-Dade: 2013
2015 RER Planning Research & Economic Analysis. Page | 28
difference, again, between Miami-Dade and the other areas, was the 0.5 to 0.99 range, 11 percent, which was 2 percent higher than all of Florida and 3 percent higher than Broward and Palm Beach Counties.
The pattern is even more pronounced in the elderly population. Fifty-one percent of the 65-and-over population fell into the low-income-poverty ratio ranges. This is much higher than the other areas included here, almost 23 percent higher than Palm Beach, 13 percent higher than Broward, and 18 percent higher than the all of Florida. The elderly in extreme poverty in Miami-Dade was similar to the other areas, but the share in poverty (a ratio of income-to-poverty threshold of 0.5 to 0.99) was more than twice all of the other areas. It was 9 percent higher than Broward, almost 10.5 percent higher than all of Florida, and 12 percent higher than Palm Beach.
To summarize, this data on the poverty-low-income population (a ratio of income-to-poverty threshold of less than 1.0), the data shows that the poverty rates in Miami-Dade for the various age segments of the population is much higher than the neighboring counties and all of Florida for each age group. In addition, Miami-Dade has an even greater share of the population that is poor or low-income in every age group. This is especially pronounced for the elderly.
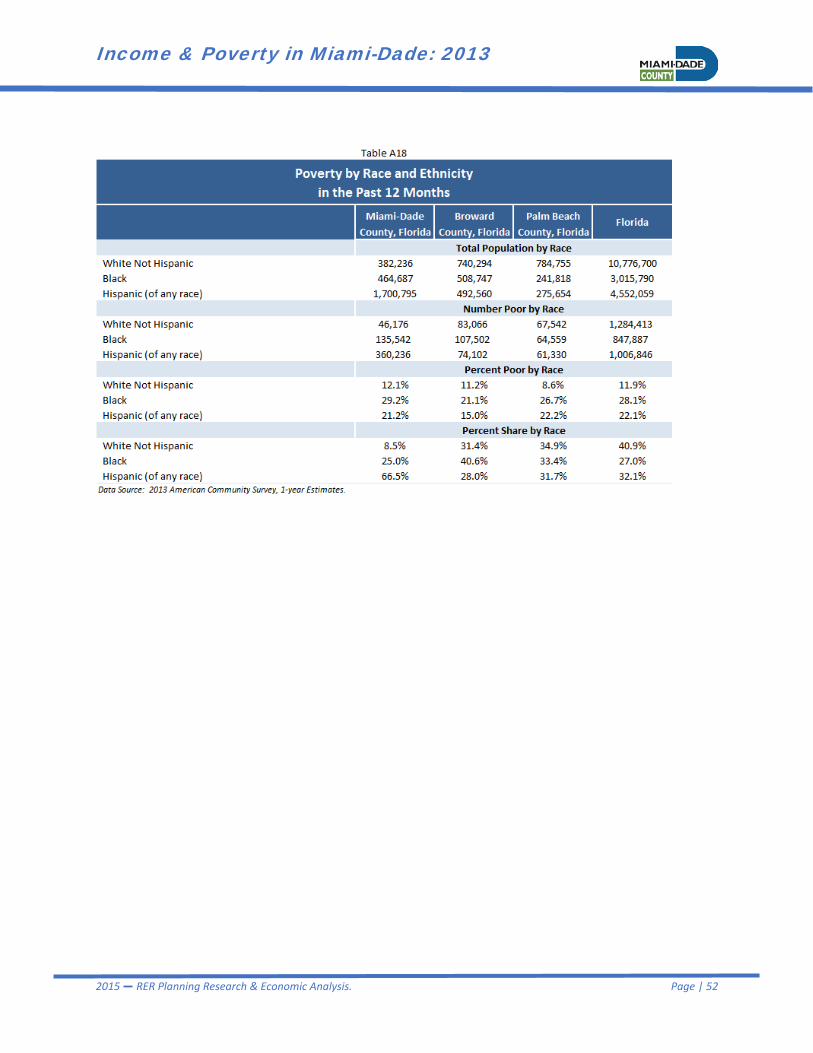
Poverty by Race Chart 16a shows the poverty rate for White non-Hispanics, Blacks, and Hispanics. The highest poverty rate in each area was for the Black population, 29 percent in Miami-Dade, 21 percent in Broward, nearly 27 percent in Palm Beach, and 28 percent statewide. In every case these were about double or more the rates of the White non-Hispanic population. Their poverty rate was 12 percent in Miami-Dade, 41 percent of the Black rate. In Broward the White Non-Hispanic rate was 11 percent, just more than half the rate for Blacks. In Palm Beach the White non-Hispanic rate was less than half the rate of Blacks, at 8.6 percent, and statewide it was 42 percent of the Black poverty rate, at 12 percent.
Miami-Dade has a much greater share of the population that is poor or low income in every age group compared to neighboring counties.

Income & Poverty in Miami-Dade: 2013
2015 RER Planning Research & Economic Analysis. Page | 29
Chart 16b shows the share of the poor in each area belonging to the racial or ethnic group. According to the data, two-thirds, 66.5 percent of the poor in Miami-Dade were Hispanic. The raw number was 360,200 people. One-quarter, 25 percent of the poor, were Black, while the remainder, 8.5 percent, were White non-Hispanic. In Broward County, almost 41 percent of the poor were Black, 31 percent were White non-Hispanic, and 28 percent were Hispanic. In Palm Beach 35 percent were White non-Hispanic, 33 percent, Black, and 32 percent were Hispanic. Finally, statewide White non-Hispanics made up the largest share of the poor with 41 percent of the total, followed by Hispanics with 32 percent, and Blacks with 27 percent.
Poverty by Nativity/Foreign Born Charts 17a and 17b illustrate poverty and nativity. Chart 17a shows the poverty rates by nativity, and it can be seen that the rates for native-born and naturalized citizens fairly closely reflect the overall poverty rates for each county (indicated by the vertical grey bars). The rates are higher in Miami-Dade for both groups compared to the other areas. It is interesting to note that in every case the poverty rate for the native-born population exceeds that of naturalized citizens by about 2 to 3 percent. In the case of non-citizens, the difference between the counties and statewide disappears with the exception of Broward. In Miami-Dade, Palm Beach and statewide, more than1 in 4 non-citizens were poor, while it was 1 in 5 in Broward. In every case it was much higher than the overall rates.

Income & Poverty in Miami-Dade: 2013
2015 RER Planning Research & Economic Analysis. Page | 30
Chart 17b shows the share of the poor by nativity. In Broward and Palm Beach two thirds of the poor population was native-born, and statewide, three quarters was native. This reflects the makeup of the population overall. In Broward 68 percent of the total population is native-born. In Palm Beach, 76 percent, and statewide 80 percent are native-born. This is a big difference from Miami-Dade where the native-born account for less than 48 percent of the total population. As a result 54 percent of the poor in Miami-Dade are either non-citizens or naturalized citizens.
Poverty and Educational Attainment Chart 18 shows the very clear relationship between increasing educational attainment and decreasing poverty. The poverty rate of the population over 25 years of age without a high-school diploma was 33 percent in Miami-Dade. For those with just a high-school diploma, the rate dropped to 22 percent. And, for the population with at least a bachelor’s degree, the poverty rate dropped all the way down to 9.6 percent. The same pattern is equally apparent for Broward, Palm Beach and all of Florida. This correlation, however, does not imply causation. It may be that greater educational attainment limits poverty. However, it would be just as easy to argue that increasing poverty limits the opportunity for educational attainment. The reality might be that, to some degree, both directions of causality, combined, lead to the results seen in the data.
The data also shows that educational attainment is no guarantee of avoiding poverty even though the correlation is evident. The data shows, for example, that in Miami-Dade there were nearly the same number of poor, 114,200, that did not graduate high school as there were poor who only graduated high school, 114,900. And in Miami-Dade, there were nearly 47,000 residents with a Bachelor’s degree or higher living in poverty in 2013.
54 percent of the poor in Miami-Dade are either non-citizens or naturalized citizens.

Income & Poverty in Miami-Dade: 2013
2015 RER Planning Research & Economic Analysis. Page | 31
Poverty and Employment The next set of data will look at poverty by work experience for the population 16 to 64 years of age. In 2013 there were 322,300 poor residents in Miami-Dade between 16 and 64. Chart 19 shows the share of the total poor by work experience for this group. For males, over 48 percent worked at least part-time or part of the year. This compares to 44.5 percent in Broward, 52 percent in Palm Beach County and 46 percent statewide. In terms of raw numbers, 70,300 men in poverty in Miami-Dade worked at least part-time or for part of the year.
The data on the female population shows a much higher share of the poor population did not work, likely as a consequence of parenting responsibilities. In Miami-Dade, over 35 percent of women in poverty worked at least part-time or part of the year. This is much lower than Broward, at 45 percent, Palm Beach at 47 percent, and statewide at 42 percent. Once again, in terms of raw numbers, 65,200 women in poverty worked at least part-time.
Poverty, Age & Health Insurance The ability to work and make a living and to keep the money earned can, and often does, have a direct connection to health. For that reason access to affordable health care is an economic necessity. Countywide for people of all ages and all income ranges, 29 percent had no health insurance. In the case of those in Miami-Dade with incomes below the poverty threshold, 37.5 percent lacked health insurance. While this uninsured rate is quite a bit higher than the population at large, there are even more dramatic differences for certain age groups.
The uninsured rate for the working-age population, 18-to-64 years of age, living in poverty in Miami-Dade was 58.3 percent. For the same group but living with incomes above poverty, the uninsured rate was less than 41 percent. For the very poor (under 0.5 of the poverty threshold) in this age range, the uninsured rate was even higher, at 59.5 percent, and for the near poor, incomes 1 to 1.5 times the poverty threshold, the rate was still higher, at 61.6 percent. Becoming ill or having an accident requiring

Income & Poverty in Miami-Dade: 2013
2015 RER Planning Research & Economic Analysis. Page | 32
medical treatment can create even greater economic and financial hardship for this group, with ripples through the households to which they belong. Statewide the uninsured rate for 18-to-64-year-olds in poverty was much lower, at 48 percent. Nationwide just 39 percent of this group was uninsured. The biggest difference geographically was in the share of the population receiving employer-based insurance. Nationwide over 18 percent of this working-age group received insurance through work. In Florida that number dropped to 15 percent, and in Miami-Dade, less than 10 percent of the 18-to-64-year-olds living in poverty obtained health insurance through the workplace. In addition, nationwide over 34 percent received insurance through Medicaid while that number was just 25 percent in Miami-Dade, and 28 percent statewide.
Health insurance coverage rates for children revealed a significant difference between Miami-Dade and elsewhere. In Miami-Dade, for all children under 18 years of age regardless of poverty status, 50 percent had Medicaid or other means-tested coverage. The Florida rate was 41 percent, and the U.S. rate was 38 percent. 79 percent of poor children under 18 years old received Medicaid insurance. Furthermore, nationwide 9 percent of children under 18 went uninsured, while in Miami-Dade the rate was 12.5 percent. Children in very poor households (under 0.5 of the poverty threshold) had an uninsured rate of 11.4 percent, while for those between 0.5 to 1 times the threshold, the rate was actually higher, 13.2 percent. The near-poor children had a rate of 18.1 percent, 1 out of 5 children. In terms of real numbers, 12.5 percent uninsured translates into over 18,600 children. If the
If the uninsured rate of Children in Miami-Dade was the same as the national rate, then over 5,400 more children would have health insurance coverage.

Income & Poverty in Miami-Dade: 2013
2015 RER Planning Research & Economic Analysis. Page | 33
uninsured rate of children in Miami-Dade was the same as the national rate, then over 5,400 more children would have health insurance coverage.
Among the population 65 years of age and older, it would be expected that everyone would have coverage and little difference would exist between Miami-Dade and elsewhere. However, that isn’t quite the case. In Miami-Dade, the uninsured rate of seniors in poverty was nearly double the rate of poor seniors nationwide, 7 percent versus 3.2 percent. Among the very poor seniors (under 0.5) the rate was much higher, at 13.4 percent, while the uninsured rate for those in the 0.5 to 1 range, was 5.2 percent.
One difference readily apparent between Miami-Dade, the US and Florida was access to employer-based health insurance for poor seniors. Nationwide, nearly 16 percent of seniors 65 years and older and in poverty obtained insurance through their employer. Statewide it was nearly 12 percent, while in Miami-Dade only 2 percent of seniors in poverty had employer-based health insurance. A second area of major difference was with the amount of direct-purchased insurance. Nationwide 23.5 percent of seniors in poverty purchased insurance directly in the market place. Statewide the number was nearly 21 percent. However, in Miami-Dade only 4 percent of poor seniors purchased private insurance. Perhaps as a result of these two distinctions, Miami-Dade seniors in poverty were far more reliant on Medicaid or other means-tested coverage, with nearly 61 percent getting insurance in that way. Nationwide the rate was 39 percent, and statewide the rate was 35.5 percent.
In Miami-Dade, the uninsured rate of seniors in poverty was nearly double the rate of poor seniors nationwide, 7 percent versus 3.2 percent.

Income & Poverty in Miami-Dade: 2013
2015 RER Planning Research & Economic Analysis. Page | 35
Upcoming
The second report in this series, Patterns of Poverty and Inequality in Miami-Dade: 1990-2013, coming out later this year, will explore in more detail the geographic distribution of poverty across the County and the degree to which this distribution, as well as the characteristics of the poor, have changed since 1990.
The third report, People Living in Poverty in Miami-Dade: 1990-2013, due out before the end of the year, will investigate the population living in areas of the County where there was concentrated poverty reported in the Censuses of 1990, 2000 and the 2013 ACS 5-year estimates. It will explore the extent to which key characteristics of the population living in such areas have or have not changed over time.

Income & Poverty in Miami-Dade: 2013
2015 RER Planning Research & Economic Analysis. Page | 37
Appendix
APPENDIX

Income & Poverty in Miami-Dade: 2013
2015 RER Planning Research & Economic Analysis. Page | 39
Table A1: Household Income
Table A2: Household Income by Race and Ethnicity

Income & Poverty in Miami-Dade: 2013
2015 RER Planning Research & Economic Analysis. Page | 40
Table A3: Household Quintile Incomes

Income & Poverty in Miami-Dade: 2013
2015 RER Planning Research & Economic Analysis. Page | 41
Table A4: Average Household Income by Source

Income & Poverty in Miami-Dade: 2013
2015 RER Planning Research & Economic Analysis. Page | 42
Table A5: Poverty by Household Type and Share Composition

Income & Poverty in Miami-Dade: 2013
2015 RER Planning Research & Economic Analysis. Page | 43
Table A6: Percent Poverty Households by Type and Age Group

Income & Poverty in Miami-Dade: 2013
2015 RER Planning Research & Economic Analysis. Page | 44
Table A7: Poverty Status of Married-Couple Families by Working Status of Householder and Spouse
Income & Poverty in Miami-Dade: 2013
2015 RER Planning Research & Economic Analysis. Page | 45
Table A8: Poverty Status of Individuals by Living Arrangement
Table A9: Poverty Status of Related Children Under 18 Years of Age by Family Type

Income & Poverty in Miami-Dade: 2013
2015 RER Planning Research & Economic Analysis. Page | 46
Table A10: Poverty Status of Families by Family Type by Presence of Related Children
Table A11: Ratio of Income to Poverty Level of Families

Income & Poverty in Miami-Dade: 2013
2015 RER Planning Research & Economic Analysis. Page | 47
Table A12: Poverty Thresholds for 2013 by Size of Family and Number of Related Children
Table A13: Income Deficit

Income & Poverty in Miami-Dade: 2013
2015 RER Planning Research & Economic Analysis. Page | 48
Table A14: Households that Received Food Stamps/SNAP by Presence of Children

Income & Poverty in Miami-Dade: 2013
2015 RER Planning Research & Economic Analysis. Page | 49
Table A15: Persons in Poverty by Sex and Age

Income & Poverty in Miami-Dade: 2013
2015 RER Planning Research & Economic Analysis. Page | 50
Table A16: Ratio of Income to Poverty Level of Families
Income & Poverty in Miami-Dade: 2013
2015 RER Planning Research & Economic Analysis. Page | 51
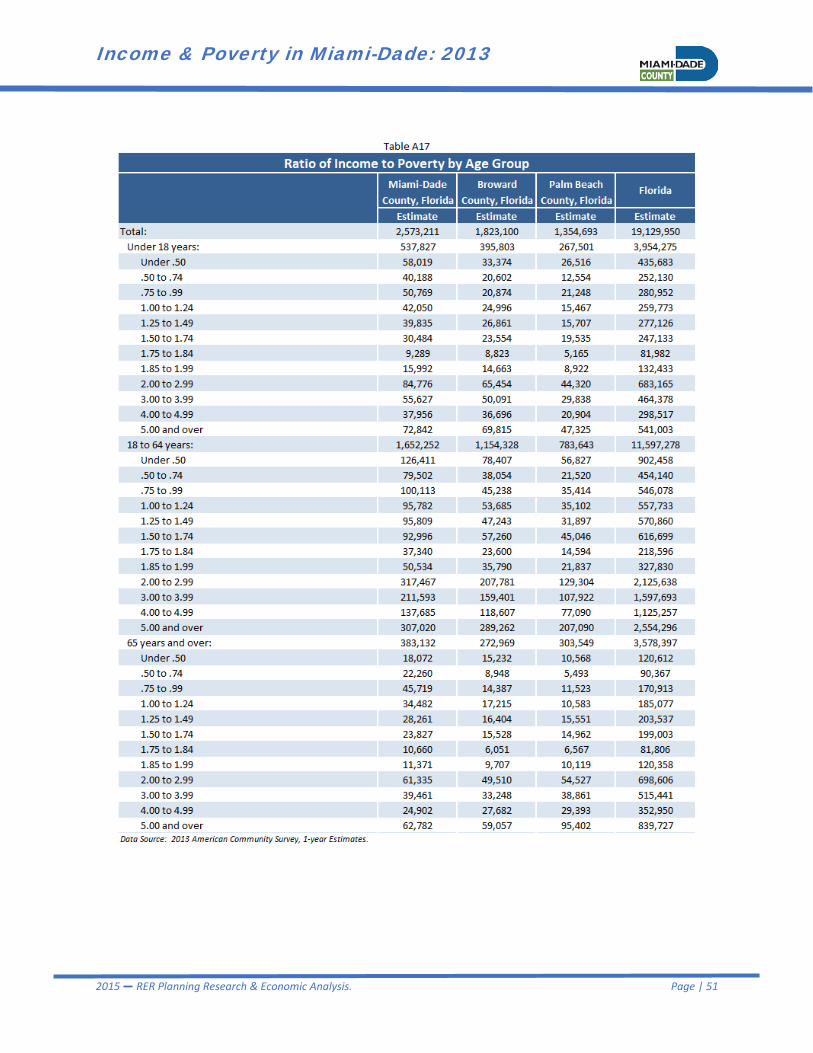
Table A17: Ratio of Income to Poverty by Age Group
Income & Poverty in Miami-Dade: 2013
2015 RER Planning Research & Economic Analysis. Page | 52
Table A18: Poverty by Race and Ethnicity

Miami-Dade County
Department of Regulatory and Economic Resources
Jack Osterholt, Director
Lourdes Gomez, Deputy Director
Copies of this report are available from:
Planning Research and Economic Analysis Section
Stephen P. Clark Center, Suite 1220 111 NW 1st Street
Miami, Florida 33128-1972
(305) 375-2845
Copies can also be found online at:
http://www.miamidade.gov/business/research.asp