Income Inequality: Challenges for Measurement and Policy · 2018-12-07 · Income Inequality:...
55
Income Inequality: Challenges for Measurement and Policy Martin Ravallion Department of Economics Georgetown University 1 Presentation at AFD Conference on Inequality, December 6, 2018
Transcript of Income Inequality: Challenges for Measurement and Policy · 2018-12-07 · Income Inequality:...

Income Inequality: Challenges for Measurement and Policy
Martin RavallionDepartment of Economics
Georgetown University
1
Presentation at AFD Conference on Inequality, December 6, 2018
Global income inequality
Part A: How are we doing? – Received wisdom + dissenting views– Global perspective + example of Indonesia.
Part B: How can we do better?– Objectives and constraints; policy options– Recommendations for thinking about better policies.
2

Part A: How are we doing?First, the received wisdom
3
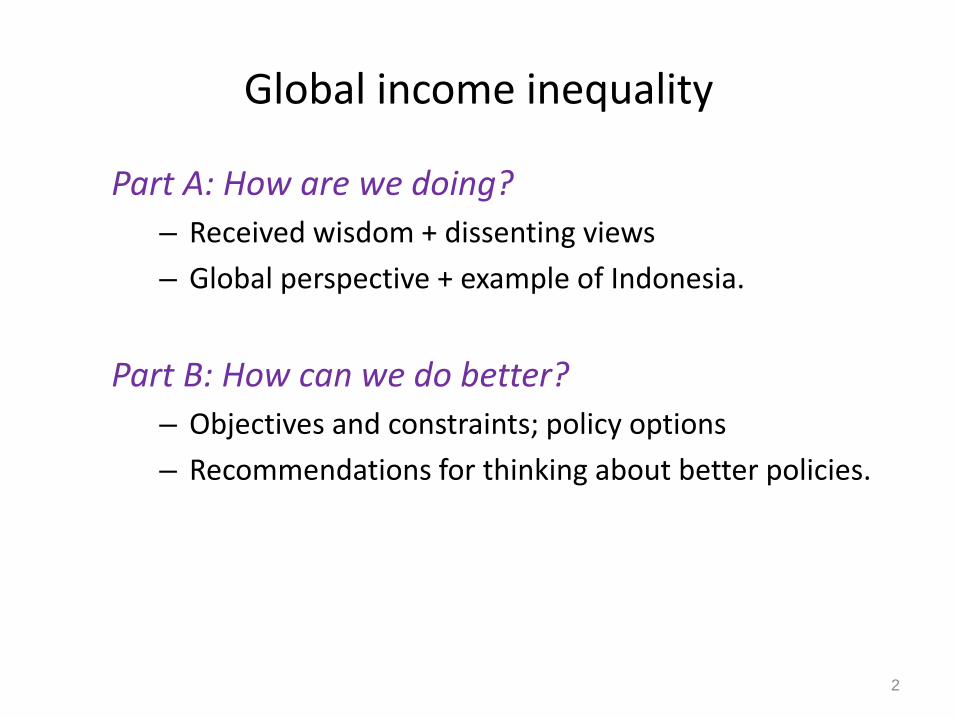
A (super) short history of global inequality
• Rising global inequality from 1820 to about 1990. – Driven mainly by divergent growth processes: today’s rich world
takes off from the early C19th (though some late starters).
• The pattern changed dramatically toward the end of the C20th. Falling global relative inequality in the new Millennium. – Driven by convergent growth processes, esp., high growth in
Asia.
4
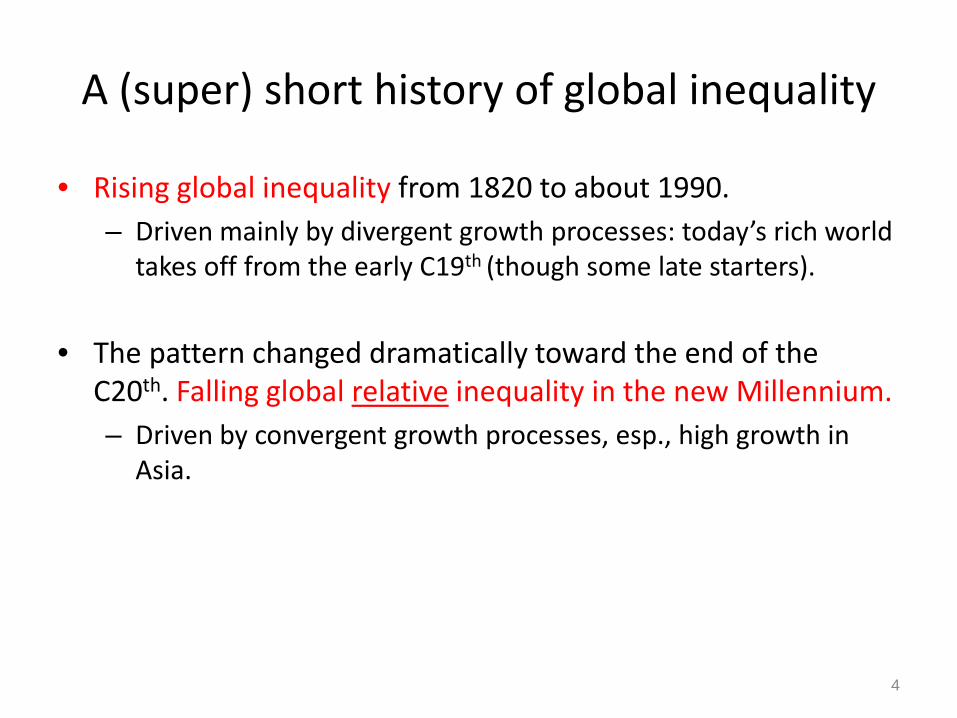
Global relative inequality since 1990
Source: Bourguignon (2016). 5
0.0
0.2
0.4
0.6
0.8
1.0
1988 1992 1996 2000 2004 2008 2012
Total global inequality
Inequality between countries
Inequality within countries
Thei
l ind
ex

Rising inequality within many countries, but not all
• Average inequality within countries has edged upwards since 2000.
• Famous examples of US, China (though signs of stabilization) and India. Also some newcomers; Indonesia =>
• But also falling inequality in some countries (famously Brazil).
• Signs of (slow) inequality convergence: inequality tends to rise when low, fall when high.
• All this assumes anonymity. Rising inequality based on cross-sectional surveys is consistent with convergent income changes in longitudinal data. Indeed, often observed.
6
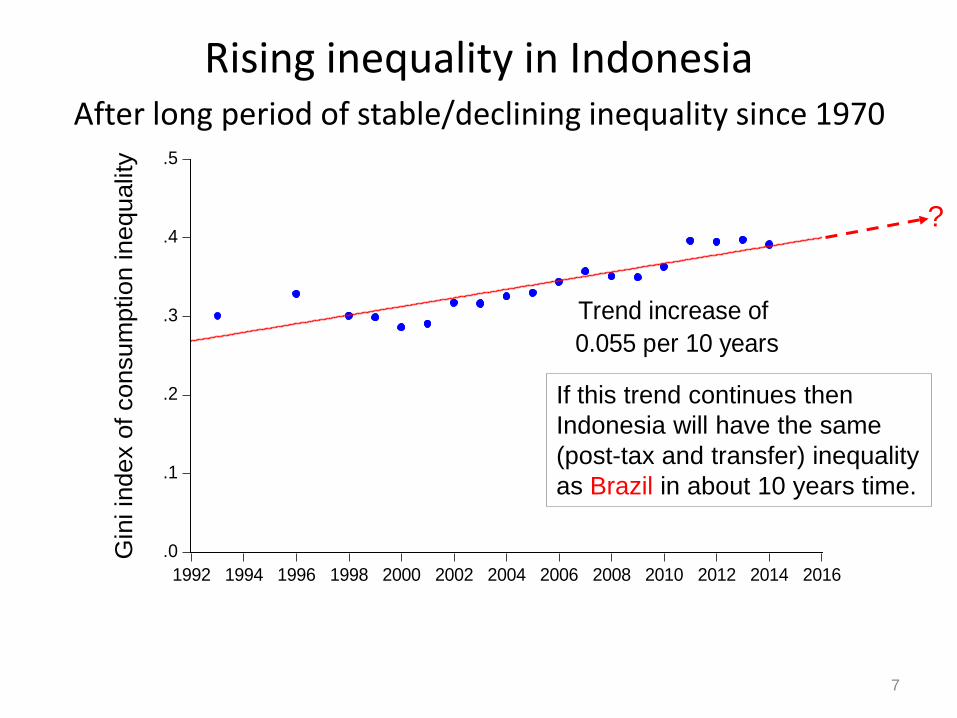
Rising inequality in Indonesia
7
.0
.1
.2
.3
.4
.5
1992 1994 1996 1998 2000 2002 2004 2006 2008 2010 2012 2014 2016
Gin
i ind
ex o
f con
sum
ptio
n in
equa
lity
Trend increase of 0.055 per 10 years
If this trend continues then Indonesia will have the same (post-tax and transfer) inequality as Brazil in about 10 years time.
?
After long period of stable/declining inequality since 1970
The received wisdom is out-of-step with popular thinking
8
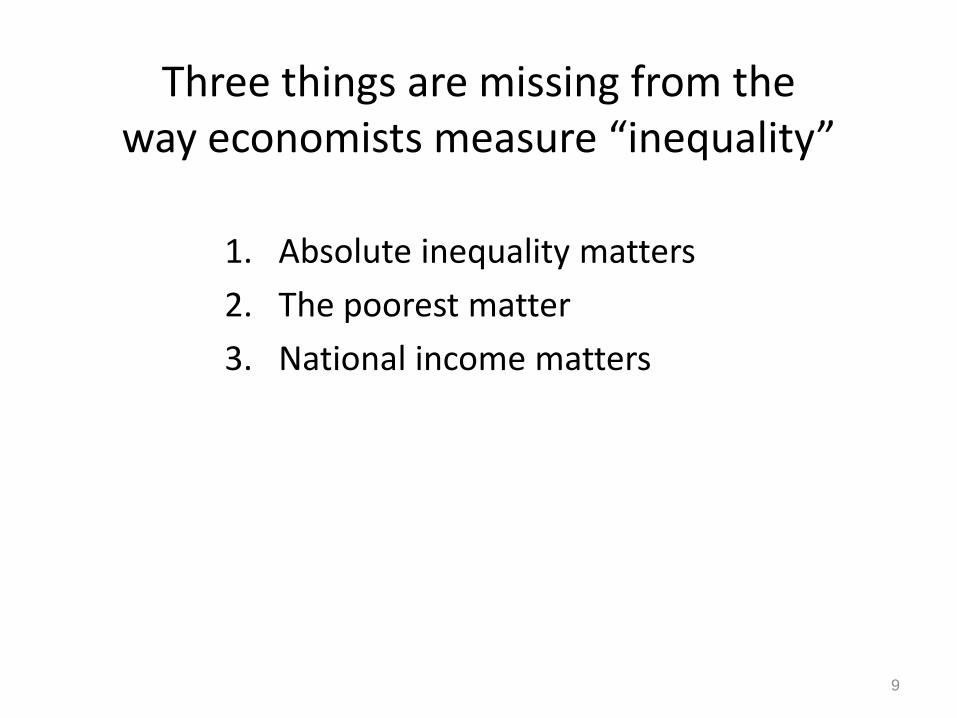
Three things are missing from the way economists measure “inequality”
1. Absolute inequality matters2. The poorest matter3. National income matters
9
1. Wake up call to economists: Many people care about absolute inequality,
and they care about the extremes
10
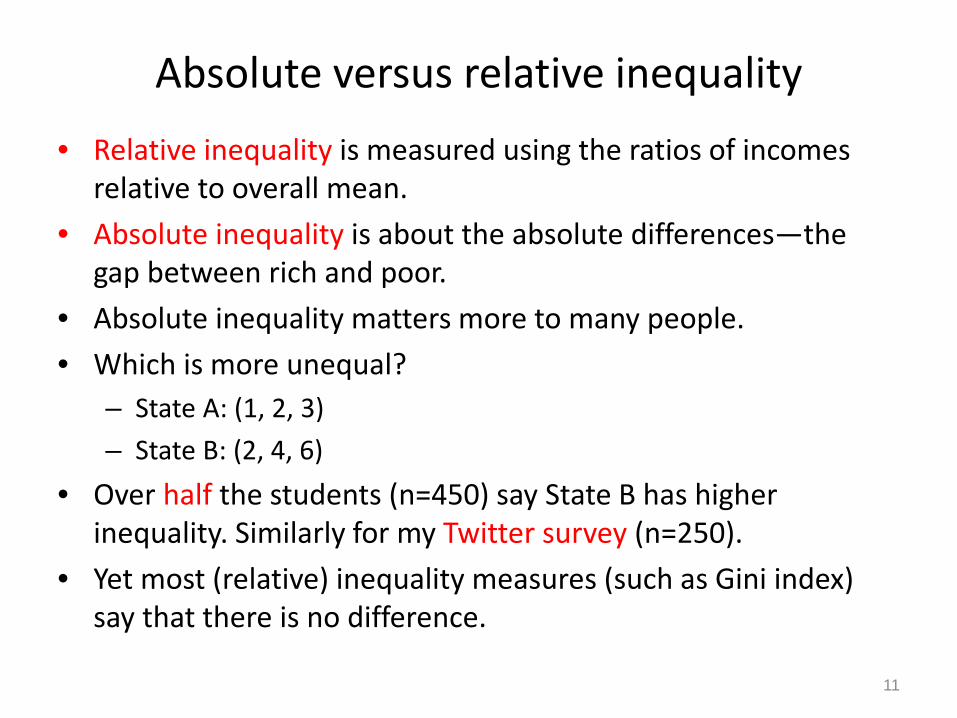
Absolute versus relative inequality• Relative inequality is measured using the ratios of incomes
relative to overall mean.• Absolute inequality is about the absolute differences—the
gap between rich and poor.• Absolute inequality matters more to many people. • Which is more unequal?
– State A: (1, 2, 3)– State B: (2, 4, 6)
• Over half the students (n=450) say State B has higher inequality. Similarly for my Twitter survey (n=250).
• Yet most (relative) inequality measures (such as Gini index) say that there is no difference.
11
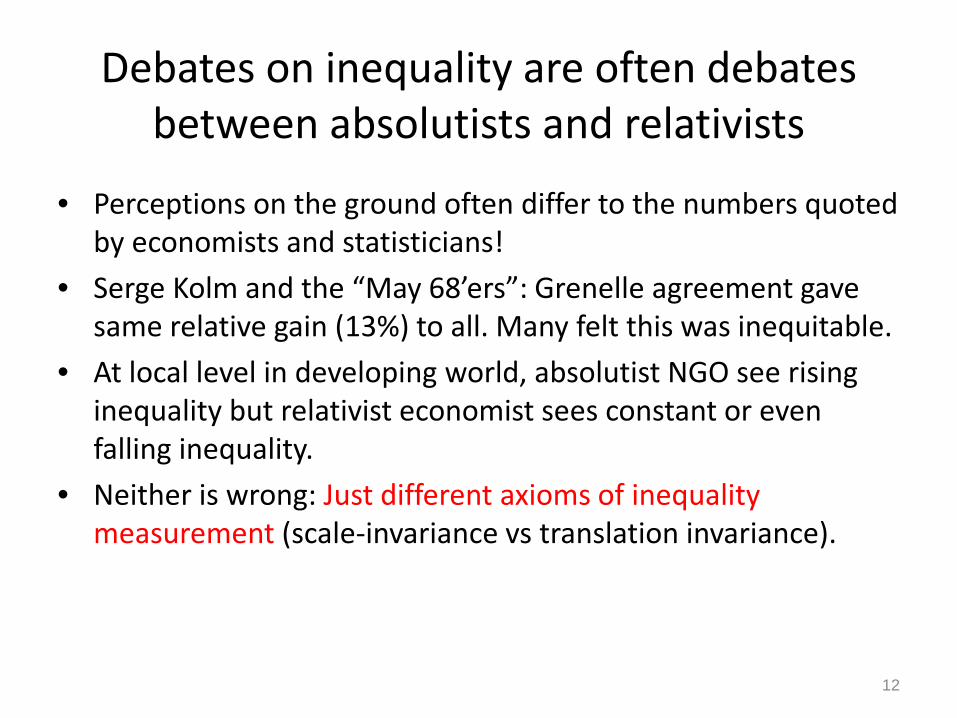
Debates on inequality are often debates between absolutists and relativists
• Perceptions on the ground often differ to the numbers quoted by economists and statisticians!
• Serge Kolm and the “May 68’ers”: Grenelle agreement gave same relative gain (13%) to all. Many felt this was inequitable.
• At local level in developing world, absolutist NGO see rising inequality but relativist economist sees constant or even falling inequality.
• Neither is wrong: Just different axioms of inequality measurement (scale-invariance vs translation invariance).
12

13
Falling relative inequality but rising absolute inequality globally
1988 2008Relative Gini
(scale invariance)
12𝑛𝑛2𝜇𝜇𝑡𝑡
�� 𝑦𝑦𝑖𝑖𝑡𝑡 − 𝑦𝑦𝑗𝑗𝑡𝑡 0.72 0.71
Absolute Gini(translation invariance)
12𝑛𝑛2�̅�𝜇
�� 𝑦𝑦𝑖𝑖𝑡𝑡 − 𝑦𝑦𝑗𝑗𝑡𝑡 0.72 0.90
Two Gini indices

Rising inequality in growing economies?
14
-.15
-.10
-.05
.00
.05
.10
-.10 -.08 -.06 -.04 -.02 .00 .02 .04 .06 .08 .10 .12
Growth rate in the mean (annualized difference in logs)
Gro
wth
in a
bsol
ute
ineq
ualit
y
(ann
ualiz
ed d
iffer
ence
in lo
g ab
solu
te G
ini i
ndex
)
r=0.90
-.06
-.04
-.02
.00
.02
.04
.06
-.10 -.08 -.06 -.04 -.02 .00 .02 .04 .06 .08 .10 .12
Growth rate in the mean (annualized difference in logs)
Gro
wth
in r
ela
tive
ine
qu
alit
y
(an
nu
aliz
ed
dif
fere
nce
in lo
g re
lati
ve G
ini i
nd
ex)
r=0.18
Relative inequality(Kolm’s “rightist” Gini
index)
Absolute inequality(Kolm’s “leftist” Gini
index)
The dilemma for absolutists!
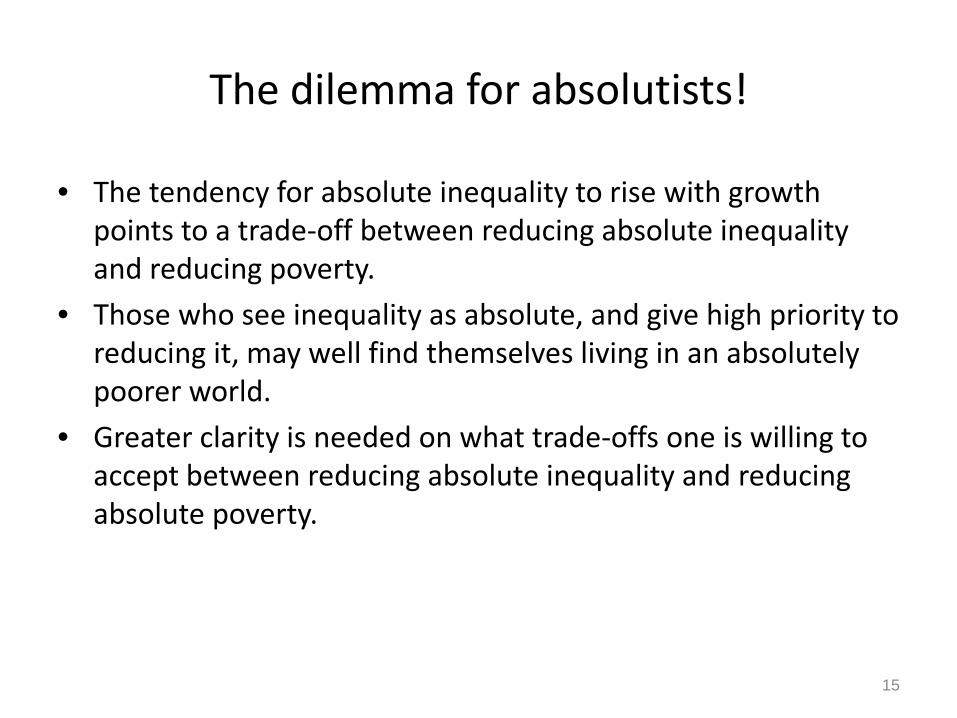
• The tendency for absolute inequality to rise with growth points to a trade-off between reducing absolute inequality and reducing poverty.
• Those who see inequality as absolute, and give high priority to reducing it, may well find themselves living in an absolutely poorer world.
• Greater clarity is needed on what trade-offs one is willing to accept between reducing absolute inequality and reducing absolute poverty.
15

Nor is the “transfer principle” universally accepted
• Pigou-Dalton transfer principle: “mean-preserving transfers from rich to poor reduce inequality”
• This seems very sensible. However, a sizeable minority of my students and Twitter respondents think that (2, 5, 5, 10) is more unequal than (2, 4, 6, 10).
• Yet almost all think that (2, 4, 6) is more unequal than (3, 4, 5).
• Why? People look at the high and low ends of the distribution. How far are the extremes from the middle?
16
2. An important aspect of inequality: Are the poorest left behind?
17
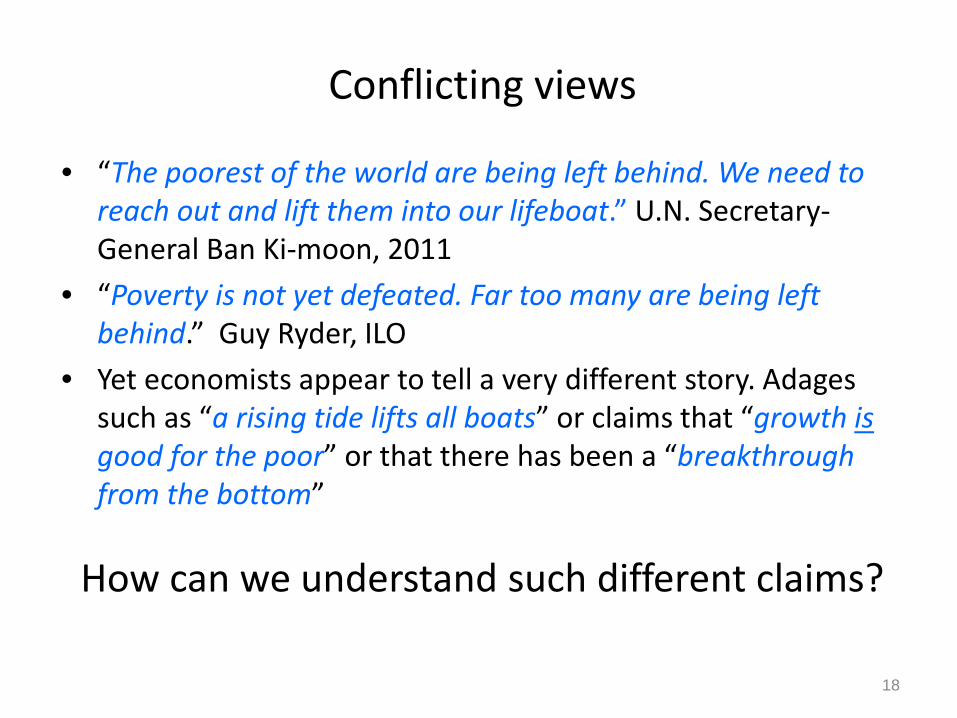
Conflicting views
• “The poorest of the world are being left behind. We need to reach out and lift them into our lifeboat.” U.N. Secretary-General Ban Ki-moon, 2011
• “Poverty is not yet defeated. Far too many are being left behind.” Guy Ryder, ILO
• Yet economists appear to tell a very different story. Adages such as “a rising tide lifts all boats” or claims that “growth isgood for the poor” or that there has been a “breakthrough from the bottom”
18
How can we understand such different claims?
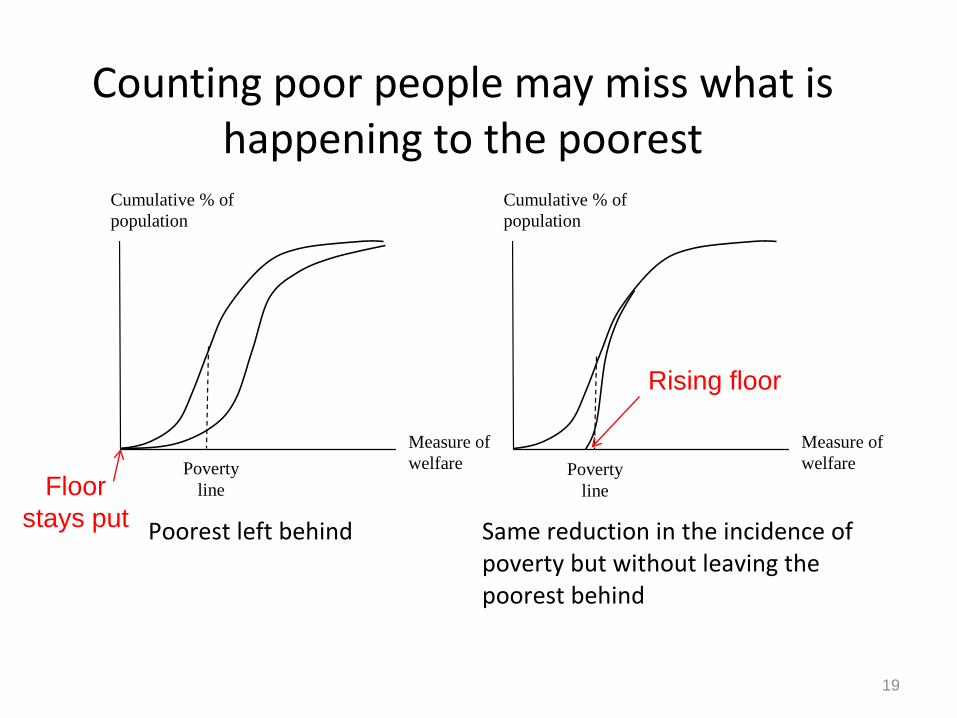
Counting poor people may miss what is happening to the poorest
19
Poorest left behind Same reduction in the incidence of poverty but without leaving the poorest behind
Measure of welfare
Cumulative % of population
Measure of welfare
Cumulative % of population
Poverty line
Poverty line Floor
stays put
Rising floor
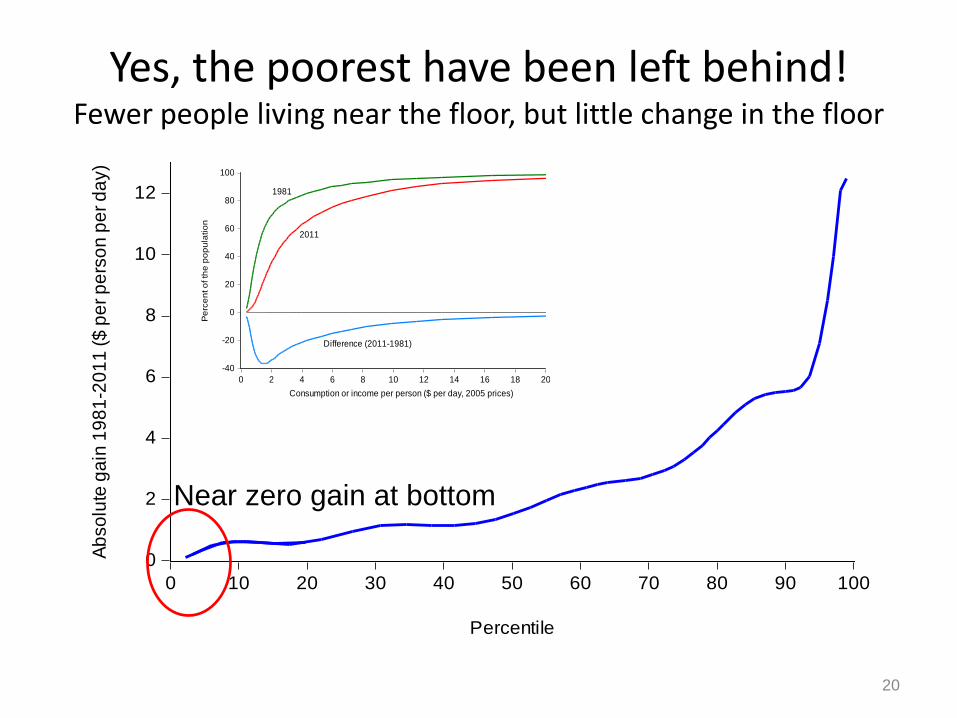
Yes, the poorest have been left behind!Fewer people living near the floor, but little change in the floor
20
0
2
4
6
8
10
12
0 10 20 30 40 50 60 70 80 90 100
Percentile
Abso
lute
gai
n 19
81-2
011
($ p
er p
erso
n pe
r day
)
-40
-20
0
20
40
60
80
100
0 2 4 6 8 10 12 14 16 18 20
Per
cent
of t
he p
opul
atio
n
Consumption or income per person ($ per day, 2005 prices)
1981
2011
Difference (2011-1981)
Near zero gain at bottom
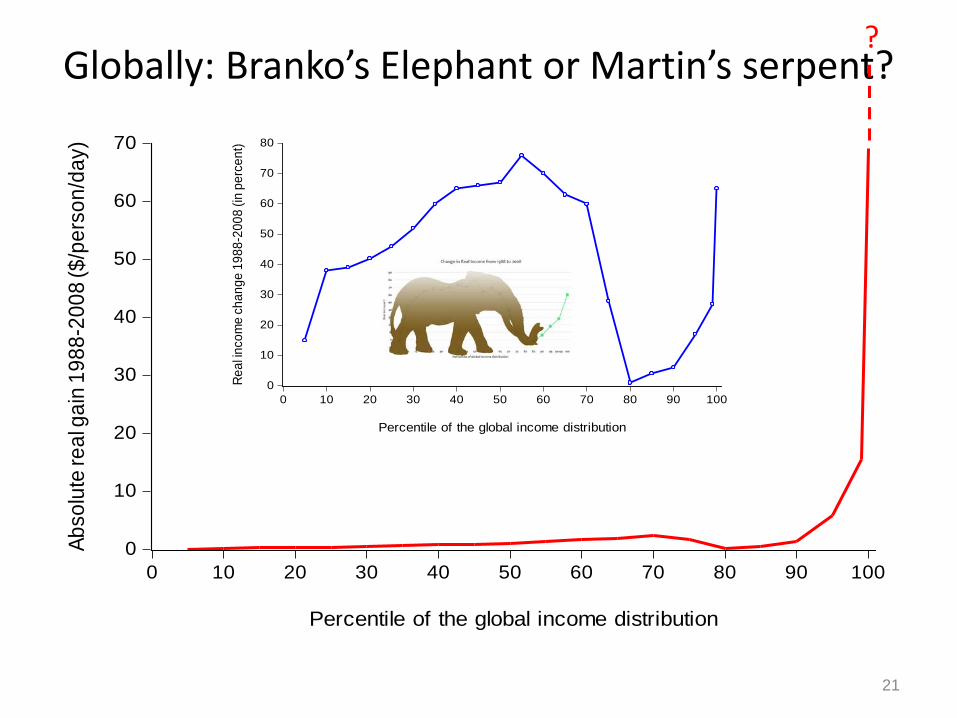
Globally: Branko’s Elephant or Martin’s serpent?
21
0
10
20
30
40
50
60
70
0 10 20 30 40 50 60 70 80 90 100
Percentile of the global income distribution
Abso
lute
real
gai
n 19
88-2
008
($/p
erso
n/da
y)?
0
10
20
30
40
50
60
70
80
0 10 20 30 40 50 60 70 80 90 100
Percentile of the global income distribution
Real
inco
me
chan
ge 1
988-
2008
(in
perc
ent)

Much less progress in raising the consumption floor globally
22
(about $1.00 in 2011 PPP)
Source: Update to Ravallion, “Are Poorest Left Behind?” J. Econ. Growth, 2016.
0
1
2
3
4
5
6
7
8
9
1980 1984 1988 1992 1996 2000 2004 2008 2012 2016
Overall mean
Floor
Mea
n co
nsum
ptio
n in
$ p
er p
erso
n pe
r day
No sign that the new Millennium raised the floor

Indonesia has made somewhat more progress in raising the floor
23
0
1
2
3
4
5
6
1980 1984 1988 1992 1996 2000 2004 2008 2012 2016
Mean consumption ($ per person per day; 2011 PPP)
Overall mean forIndonesia
Consumption floor
Elasticity=0.3
3. Measuring global inequality when national income matters
24
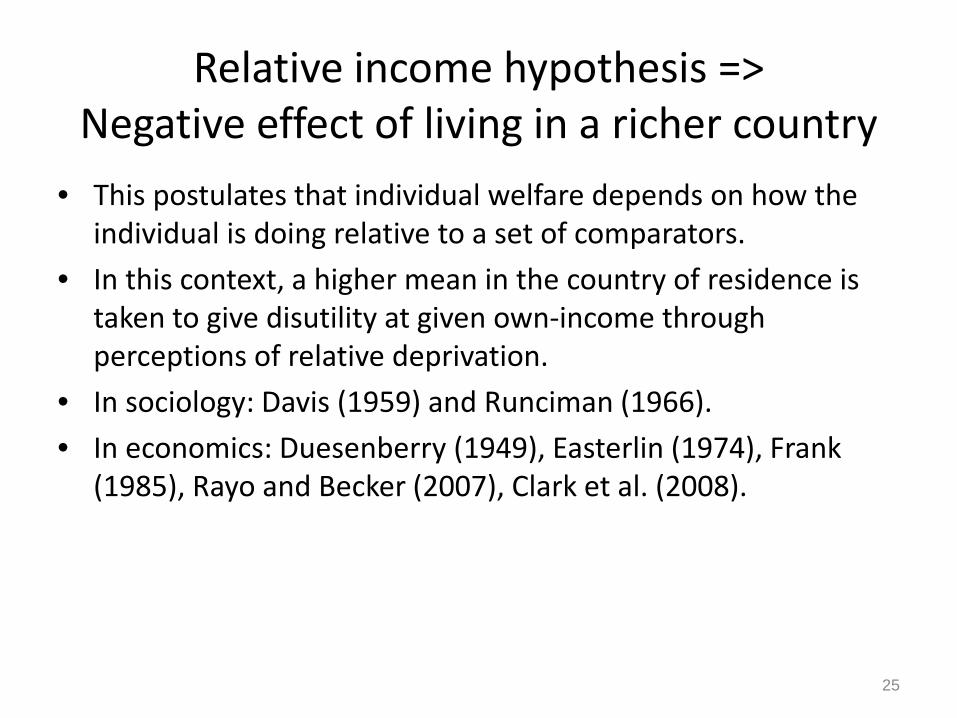
Relative income hypothesis => Negative effect of living in a richer country
• This postulates that individual welfare depends on how the individual is doing relative to a set of comparators.
• In this context, a higher mean in the country of residence is taken to give disutility at given own-income through perceptions of relative deprivation.
• In sociology: Davis (1959) and Runciman (1966). • In economics: Duesenberry (1949), Easterlin (1974), Frank
(1985), Rayo and Becker (2007), Clark et al. (2008).
25
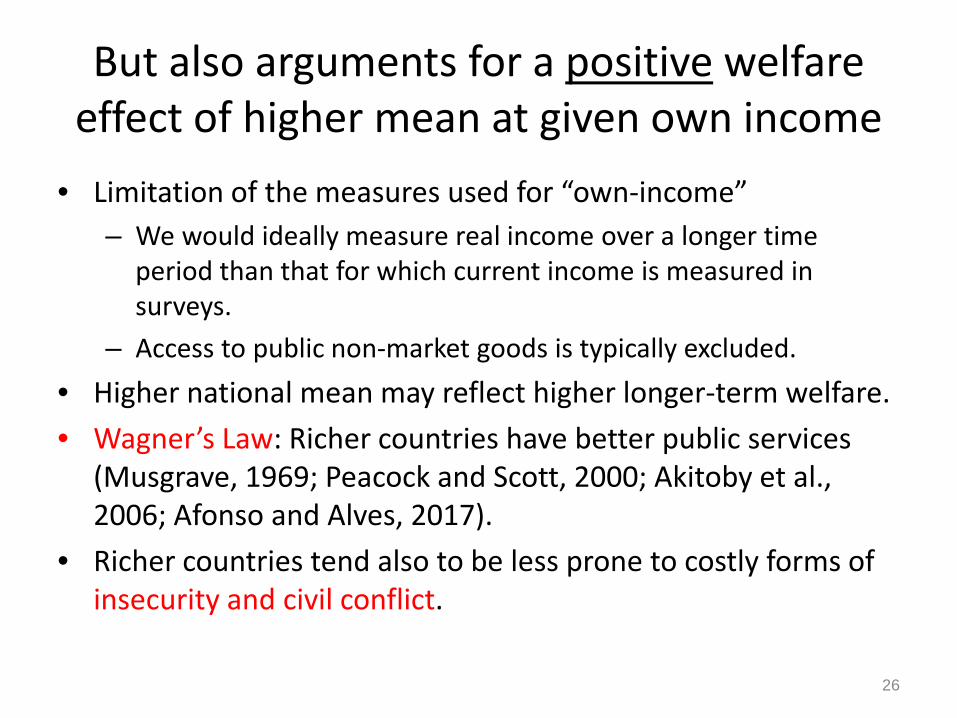
But also arguments for a positive welfare effect of higher mean at given own income
• Limitation of the measures used for “own-income”– We would ideally measure real income over a longer time
period than that for which current income is measured in surveys.
– Access to public non-market goods is typically excluded.• Higher national mean may reflect higher longer-term welfare.• Wagner’s Law: Richer countries have better public services
(Musgrave, 1969; Peacock and Scott, 2000; Akitoby et al., 2006; Afonso and Alves, 2017).
• Richer countries tend also to be less prone to costly forms of insecurity and civil conflict.
26
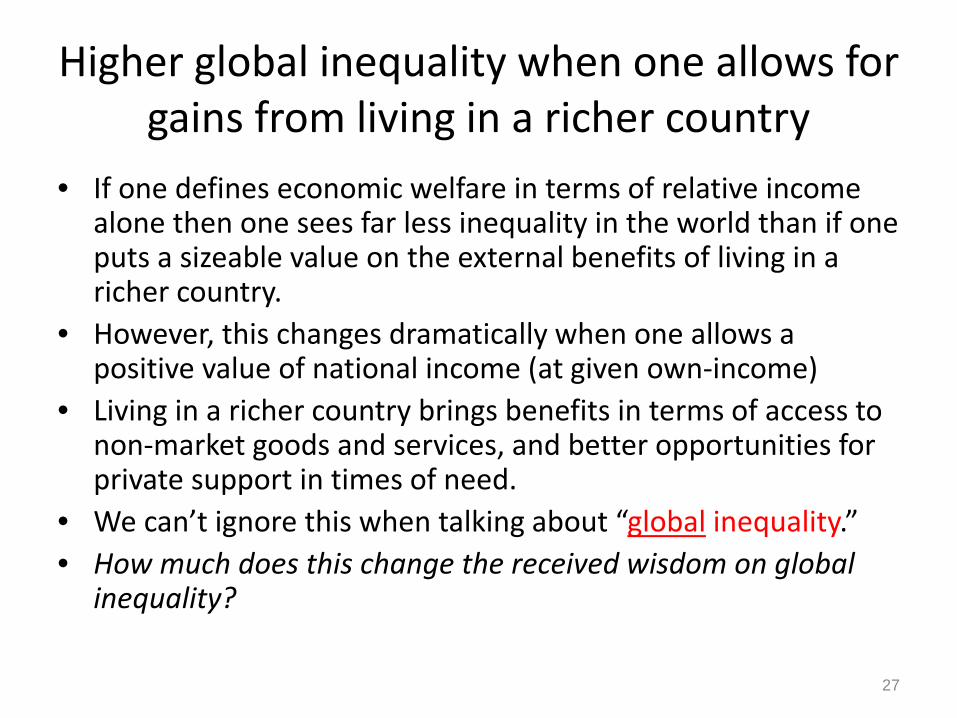
Higher global inequality when one allows for gains from living in a richer country
• If one defines economic welfare in terms of relative income alone then one sees far less inequality in the world than if one puts a sizeable value on the external benefits of living in a richer country.
• However, this changes dramatically when one allows a positive value of national income (at given own-income)
• Living in a richer country brings benefits in terms of access to non-market goods and services, and better opportunities for private support in times of need.
• We can’t ignore this when talking about “global inequality.”• How much does this change the received wisdom on global
inequality?
27
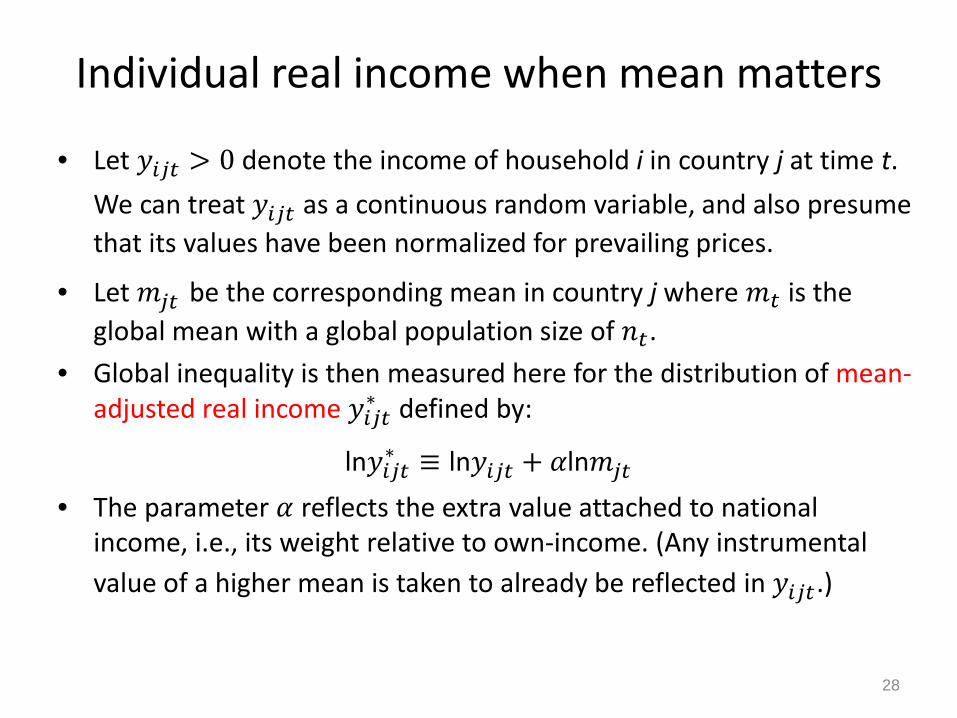
Individual real income when mean matters
• Let 𝑦𝑦𝑖𝑖𝑗𝑗𝑡𝑡 > 0 denote the income of household i in country j at time t. We can treat 𝑦𝑦𝑖𝑖𝑗𝑗𝑡𝑡 as a continuous random variable, and also presume that its values have been normalized for prevailing prices.
• Let 𝑚𝑚𝑗𝑗𝑡𝑡 be the corresponding mean in country j where 𝑚𝑚𝑡𝑡 is the global mean with a global population size of 𝑛𝑛𝑡𝑡.
• Global inequality is then measured here for the distribution of mean-adjusted real income 𝑦𝑦𝑖𝑖𝑗𝑗𝑡𝑡∗ defined by:
ln𝑦𝑦𝑖𝑖𝑗𝑗𝑡𝑡∗ ≡ ln𝑦𝑦𝑖𝑖𝑗𝑗𝑡𝑡 + 𝛼𝛼ln𝑚𝑚𝑗𝑗𝑡𝑡
• The parameter 𝛼𝛼 reflects the extra value attached to national income, i.e., its weight relative to own-income. (Any instrumental value of a higher mean is taken to already be reflected in 𝑦𝑦𝑖𝑖𝑗𝑗𝑡𝑡.)
28
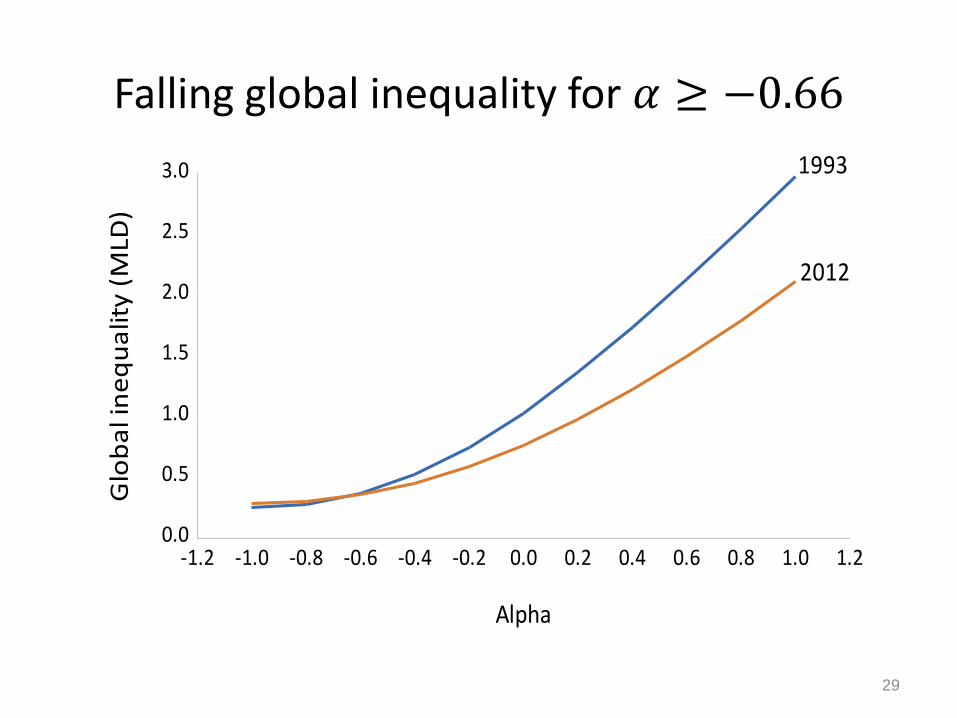
Falling global inequality for 𝛼𝛼 ≥ −0.66
29
0.0
0.5
1.0
1.5
2.0
2.5
3.0
-1.2 -1.0 -0.8 -0.6 -0.4 -0.2 0.0 0.2 0.4 0.6 0.8 1.0 1.2
Alpha
1993
2012
Glo
bal i
nequ
ality
(MLD
)
The national income effect swamps other sources of error
• From what we know based on past global studies using micro data, the national income effect could well be 50% or more of the own-income effect on subjective wellbeing.
• Then global inequality is far higher than prevailing measures suggest, and far higher than found in even the most unequal country.
• The differences in levels of inequality due to even rather modest differences in how one values national mean income tend to swamp the differences seen over time in standard measures, or the differences we see between countries,
• and are also large relative to the impact of even a substantial underestimation of the incomes of the rich.
30

But one still finds falling global inequality
• The stylized fact that overall inequality has been falling since around 1990 is not robust, though one only finds rising inequality with a high negative weight on national income, such as due to relative deprivation.
• The finding of falling between-country inequality since 1990 is robust whatever value (positive or negative) one attaches to national income in assessing individual economic welfare.
31

Part B: How can we do better?
32
Two challenges ahead
• Motivational challenge: Should we care about inequality and relative poverty as well as absolute poverty? – The intrinsic (ethical) and instrumental arguments for why
we need to also worry about inequalities.
• Policy challenge: How might we have greater success against inequality? – Poor performance of current policies esp., in developing
world; objectives and constraints on better policies; policy options.
33
Why do we also care about inequality?
• “Inequality” is too big a word! Needs to be un-packed to inform public action.
• Ethical concerns about: – fairness of processes, such as unfair trades – unequal opportunities in life, esp. from conditions of birth – unequal outcomes in life; utilitarian objections and/or
implications for the next generation– objectionable specific inequities (ethnic, gender,
geographic) especially if due to discrimination.
34
Why do we care? Costs of inequality
• High inequality threatens prospects for future economic growth, and dampens the impact of growth on poverty.– Credit constraints facing the poor and middle class.– Political impediments to reform and public good provision.– Social costs of higher crime, weaker social cohesion.
• Countries starting out with high inequality have a harder time growing their economy, and a harder time assuring that their growth is pro-poor.
35
Policies to help assure pro-poor growth
36

Economic growth and inequality
• Growth has been roughly distribution neutral on average– Falling inequality in some growing economies and in some
periods (Indonesia 1970-90)– But rising in other countries/periods (Indonesia since late-
1990s).• Growth has been the main proximate source of progress
against absolute poverty.• But very mixed evidence that it helps much against relative
poverty or relative inequality.• And growth tends to come with higher absolute inequality.• Some degree of redistribution may be good for growth in
market incomes and can also finance pro-poor policies.• Making markets work better for poor people is also key.
37

38
How to achieve more pro-poor growth?
Literature and policy discussions point to the need to:• Develop human and physical assets of poor people =>
quality services• Make markets work better for poor people (credit, labor,
land)• Remove all negative discrimination (race, gender)• Remove biases against the poor in public spending,
taxation, trade and regulation • Invest in local public goods/infrastructure (not neglecting
poor areas) + agriculture and rural development• Remove restrictions on migration (between and within)• Foster labor absorption from urban economies, esp., small
and medium sized towns
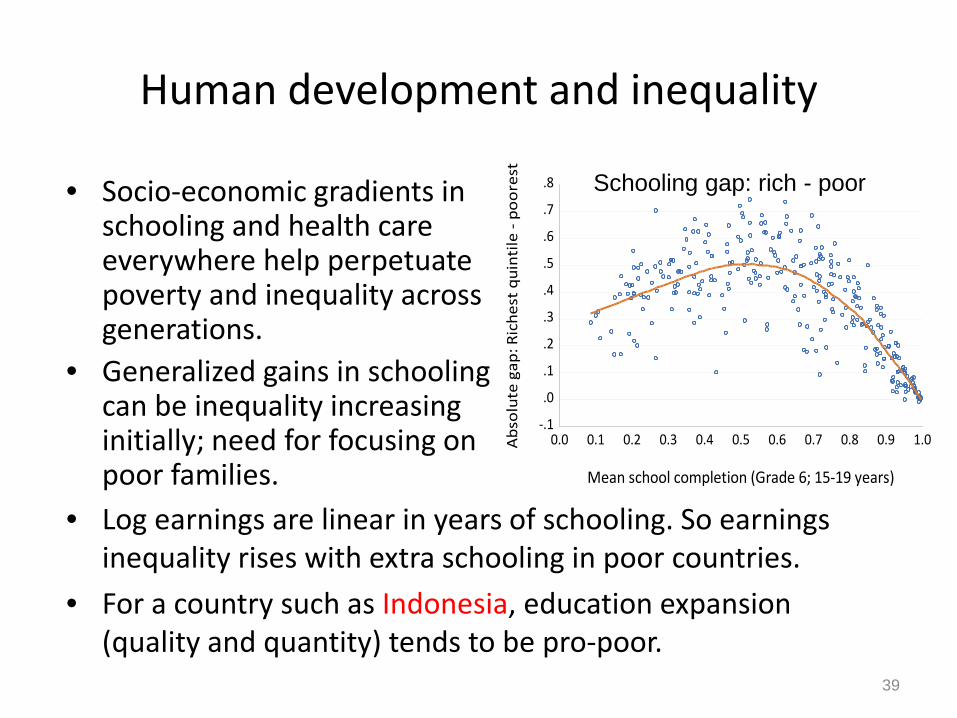
Human development and inequality
• Socio-economic gradients in schooling and health care everywhere help perpetuate poverty and inequality across generations.
• Generalized gains in schooling can be inequality increasing initially; need for focusing on poor families.
39
• Log earnings are linear in years of schooling. So earnings inequality rises with extra schooling in poor countries.
• For a country such as Indonesia, education expansion (quality and quantity) tends to be pro-poor.
-.1
.0
.1
.2
.3
.4
.5
.6
.7
.8
0.0 0.1 0.2 0.3 0.4 0.5 0.6 0.7 0.8 0.9 1.0
Mean school completion (Grade 6; 15-19 years)
Abs
olut
e ga
p: R
iche
st q
uint
ile -
poor
est
Schooling gap: rich - poor

Redistributive policies to complement pro-poor growth
40

Lessons from the advanced economies
• Fiscal incidence studies suggest that redistributive policies—mainly taxes and transfers—have reduced inequality substantially (OECD, IMF). – Average Gini for market incomes = 0.49– Average Gini for disposable income = 0.31
• (Though redistributive effort has not typically increased with the higher inequality of market incomes since mid-1990s.)
• The types of policies have varied over the history of the (current) advanced economies, in line with administrative capabilities and aggregate resources.
41

Fiscal incidence in Indonesia• Fiscal incidence studies: Indonesia does less redistribution
than found in Latin America, but it also has less inequality.
• Indonesia devotes 5% of GDP to social spending (transfers, pensions, health and education) vs. 24% in Brazil.
• Energy subsidies favored over transfers in Indonesia.– High government revenues from the commodity boom 2003-12.– But too much went into energy subsidies, favoring non-poor.– 4% of GDP on energy subsidies vs. 0.4% on targeted transfers.
42
Gini Market income Final
Indonesia 0.39 0.37
Brazil 0.58 0.44 (Lustig, 2016)
Presenter
Presentation Notes
Brazil Ginis: Higher number treats pensions as deferred income; lower number treats them as current transfers.

Rising use of direct interventions in the developing world
• Two main forms:1. Direct non-contributory income transfers to poor or vulnerable
families; with or without conditions. 2. Workfare schemes use work requirements for targeting.
• Today almost every developing country has at least one such program, though often with limited coverage.
• Roughly one billion people currently receive assistance.
43
But are these interventions reaching the poor?

Uneven coverage of poor people
• Only about one third of those in the poorest quintile are receiving help from SSNs.
• And worse performance in poorer countries.
• Indonesia is doing relatively well.
44
0
20
40
60
80
100
0 2000 4000 6000 8000 10000 12000 14000 16000 18000 20000 22000
GDP per capita at PPP for year of survey
Safety net coverage for poorest quintile (%)Safety net coverage for whole population (%)
Poorest quintile
Population
The share of the poorest 20% receiving help from the social safety net (SSN) programs in developing countries.
Source: WB’s ASPIRE data set SSN=Non-contributory transfers targeted to poor and vulnerable people.
Very low coverage of the poor in poorest countries
Some poor countries are doing well
Indonesia
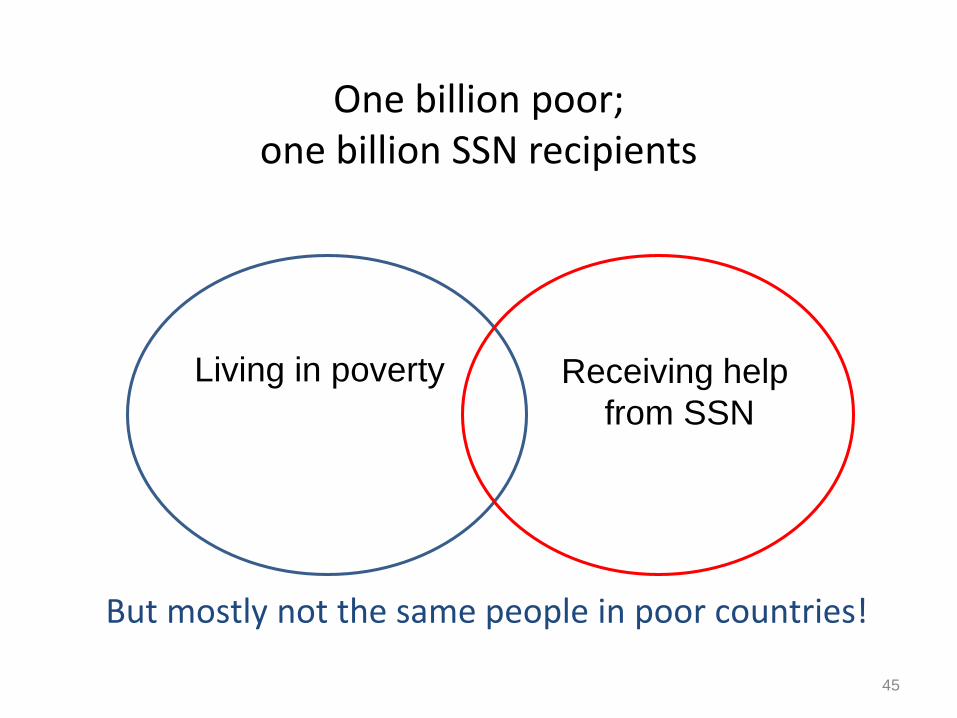
One billion poor; one billion SSN recipients
Living in poverty Receiving help from SSN
45
But mostly not the same people in poor countries!
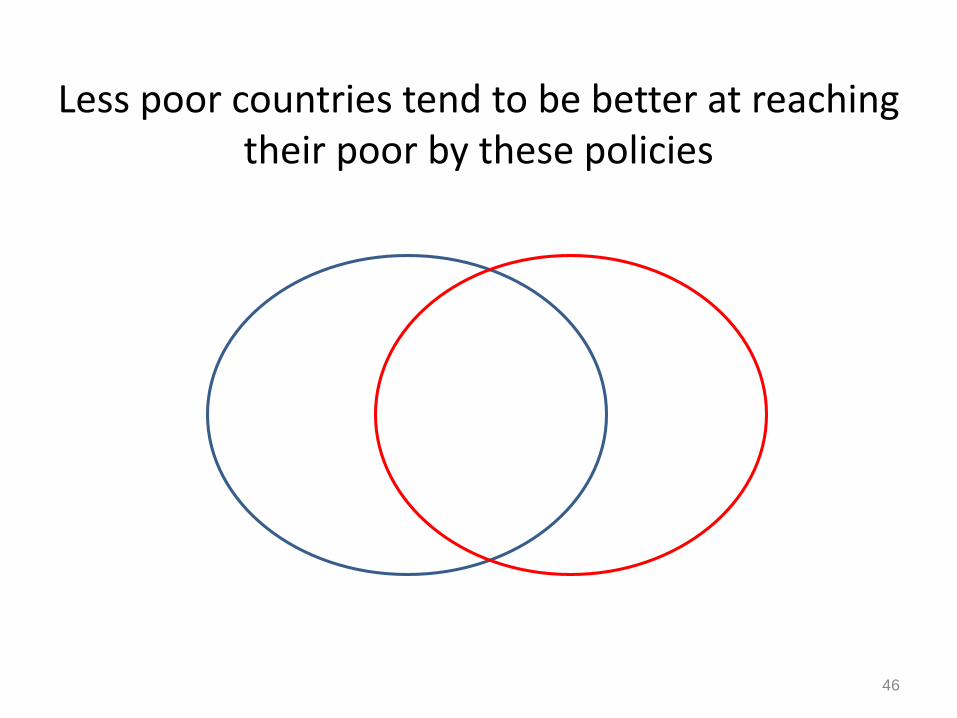
Less poor countries tend to be better at reaching their poor by these policies
46
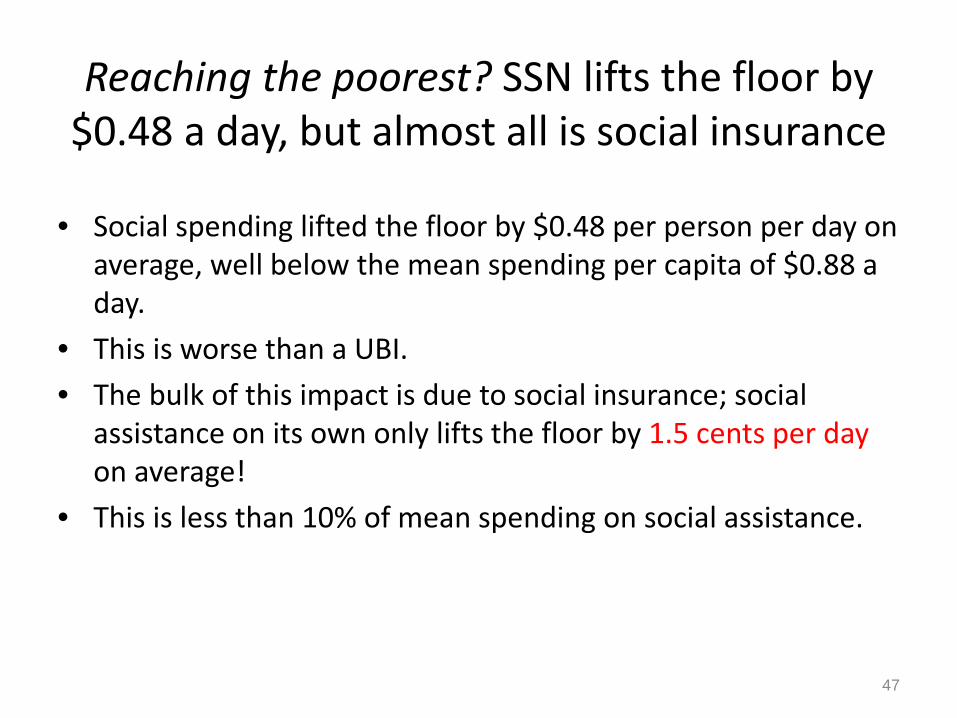
Reaching the poorest? SSN lifts the floor by $0.48 a day, but almost all is social insurance
• Social spending lifted the floor by $0.48 per person per day on average, well below the mean spending per capita of $0.88 a day.
• This is worse than a UBI. • The bulk of this impact is due to social insurance; social
assistance on its own only lifts the floor by 1.5 cents per dayon average!
• This is less than 10% of mean spending on social assistance.
47
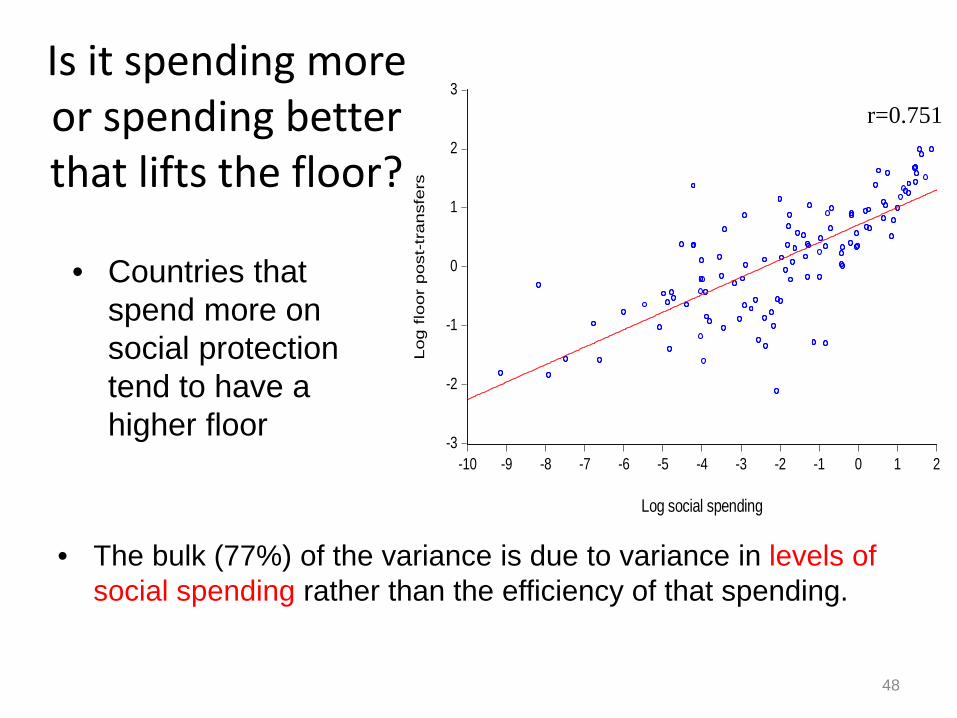
Is it spending more or spending better that lifts the floor?
48
-3
-2
-1
0
1
2
3
-10 -9 -8 -7 -6 -5 -4 -3 -2 -1 0 1 2
Log social spending
Log f
loor
post
-tra
nsf
ers
r=0.751
• The bulk (77%) of the variance is due to variance in levels of social spending rather than the efficiency of that spending.
• Countries that spend more on social protection tend to have a higher floor
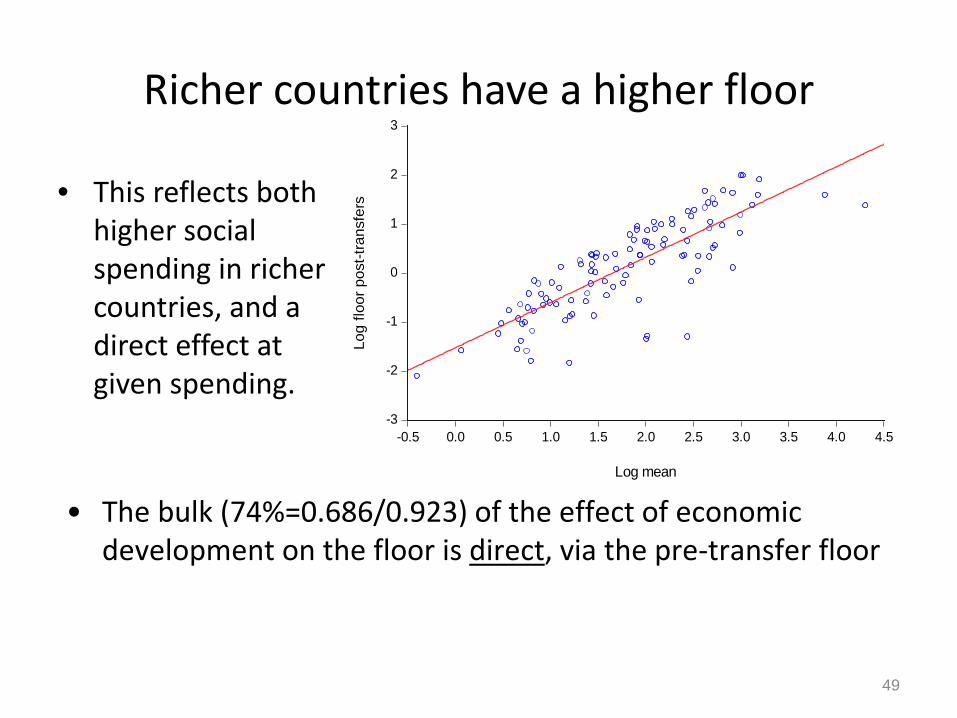
Richer countries have a higher floor
• This reflects both higher social spending in richer countries, and a direct effect at given spending.
49
-3
-2
-1
0
1
2
3
-0.5 0.0 0.5 1.0 1.5 2.0 2.5 3.0 3.5 4.0 4.5
Log mean
Log
floor
pos
t-tra
nsfe
rs
• The bulk (74%=0.686/0.923) of the effect of economic development on the floor is direct, via the pre-transfer floor
A new role for redistributive interventions, but many challenges ahead
• Success against relative poverty and in raising the floor will almost certainly require more effective redistributive policies.
• Constraints include information, incentives, financing and political economy. Administrative capacity is key.
• High marginal tax rates on the poor must be avoided; poverty traps due to fine targeting.
• Information constraints can be severe. Reliable fine targeting is rarely feasible in practice in developing economies.
• Method of financing is key to overall impact.
50
A menu of current policies
• Public services (health, education, security)– Targeted or universal
• Cash transfers– Targeted, state-contingent) or universal– Conditional (e.g., PKH) or unconditional
• Microfinance– Mixed record
• Workfare schemes– Low wage rate– Assets of value to poor people
• Minimum wage rate (if enforceable)• Progressive income tax• Stronger tax enforcement on companies and the rich
51

A policy proposal to consider seriously, for both pro-poor growth and redistribution• Basic full income
– Universal; all citizens (“poor” or not)– Cash plus imputed values of key in-kind services (health,
education)– Cash accumulates in an account for children until age 18 (say)
• Financed by cutting other subsidies and programs that bring little benefit to the poor
• + progressive income tax when administratively feasible• Supportive ID system (e.g., Aadhaar in India, but privacy
concerns need to be addressed).
52
Six recommendations
53

1. Tailor policies to the realities of the setting2. Tap local information + effective state support3. Focus on poverty not finer “targeting” per se4. Protect and promote5. Monitor and evaluate6. Learn from mistakes
54
Presenter
Presentation Notes
Successful policies respect local constraints on the information available, administrative capabilities, budgets and incentive constraints. A key role for analysts is to learn about these constraints and make them explicit. Tapping local information can help identify those in need, and help in responding, as Indonesia has shown. We have seen greater use of participatory, community-based (governmental and non-governmental), institutions for income support and/or service provision. However, these should not be seen as substitutes for strong public administration, which will still be needed in guiding and monitoring local institutions, including addressing grievances. 3. Excessive emphasis on reducing inclusion errors leaving high exclusion errors. The most finely targeted policy (lowest inclusion errors) need not have the most impact on poverty. Information problems; measurement errors Proxy means tests are often poor means tests, esp., poorest Hidden costs of participation Adverse incentives: high marginal tax rates => poverty traps Political economy; concerns about undermining social support/political consensus A universal basic full income should be on the menu. 4. We want to both protect and promote, though there can be a trade off. Transfers have a role in allowing markets to work better from the perspective of poor people. “Smart,” “Social investment,” approaches (CCT and productive workfare) show promise. But assessments must consider all the costs and benefits and avoid paternalism. Greater flexibility is needed in responding to shocks. Participant capture is a common problem. Also local moral hazard. 5. There are persistent knowledge gaps about policy effectiveness. Generalized preferences among the methodological options are rarely defensible in the absence of knowledge about the setting and data. There is a menu of options. It is no less important that policy makers are active in identifying key knowledge gaps, and/or supporting the creation of relevant knowledge. Feedback loops between researchers and policy makers; integration and openness of relevant data. 6. Policy makers must also adapt to evidence of failure, learning from mistakes as well as scaling up successes. Too often, deficient programs survive well beyond their useful life. Bureaucratic inertia and participant capture are common problems. The NGO GiveWell has a page on its website devoted to acknowledging its own mistakes. The first listed of which was not hiring a PhD economist, which the NGO is in the process of correcting at the time of writing. Citizens should demand that governments do the same.

Thank you for your attention!Merci de votre attention!