Income Inequality and the Limits to Capitalism: The Haves ... · 1 Income Inequality and the Limits...
12
1 Income Inequality and the Limits to Capitalism: The Haves and Have- Nots By Brian Fabbri (October 2012) 1 As the world becomes increasingly interdependent it is rapidly migrating toward a very bipolar universe. This is becoming very evident in the US where numerous new academic studies have detailed with an abundance of data that the US is rapidly becoming a nation of Haves and Have-nots. Over the past 30 years, wealth increasingly became concentrated in the top 1% of the population. In 2007 just before the great recession, 23.5% of wealth in America was owned by the top 1%, the highest percentage since the peak in 1928, 23.9%. The net result has been the disenfranchisement of the middle class in America. A recent Pew Research center study revealed that median household income fell 5% over the last decade, household net worth dropped 28%, standards of living deteriorated, and household attitudes toward government, banks, and big business soured. The Eurozone is similarly manifesting itself to be an economic zone of a few relatively healthy economies and several others bordering upon default and depression. The European Commission’s forced austerity requirements on the countries with slumping economies will only exacerbate an already worsening trend of income inequality. These countries, in desperate need for cheap liquidity to help finance massive budget deficits, are being forced to submit to the demands of the richer Eurozone countries in order to postpone bankruptcy. The net result of the austerity measures agreed to will propel these slumping economies into deeper recessions and greater unemployment. As unemployment rises it exaggerates the income disparity between the haves and have- nots. Problems of increasing income inequality are not confined to the West, or to only advanced economies. They are also present right here in Asia. For example, Singapore’s Deputy Prime Minister Tharman Shanmugaratnam said in a recent speech that market forces will only widen disparities in income and wealth. ‘Economic growth itself does not lift all boats and certainly not equally’. He pointed out that the bottom fifth of workers in Singapore have not seen any increase in real incomes in the last decade, and in Singapore’s case it was a decade of robust economic growth. It also was a period of earnest competition. The World Economic Forum in their latest Global Competitiveness Report ranked Singapore the second most competitive economy in the world after 1 The views and opinions expressed herein are those of the author, and do not necessarily represent those of the National University of Singapore (NUS), the NUS Business School or CAMRI.
Transcript of Income Inequality and the Limits to Capitalism: The Haves ... · 1 Income Inequality and the Limits...
1
Income Inequality and the Limits to Capitalism: The Haves and Have-
Nots
By Brian Fabbri (October 2012)1
As the world becomes increasingly interdependent it is rapidly migrating toward a very
bipolar universe. This is becoming very evident in the US where numerous new
academic studies have detailed with an abundance of data that the US is rapidly
becoming a nation of Haves and Have-nots. Over the past 30 years, wealth increasingly
became concentrated in the top 1% of the population. In 2007 just before the great
recession, 23.5% of wealth in America was owned by the top 1%, the highest percentage
since the peak in 1928, 23.9%. The net result has been the disenfranchisement of the
middle class in America. A recent Pew Research center study revealed that median
household income fell 5% over the last decade, household net worth dropped 28%,
standards of living deteriorated, and household attitudes toward government, banks,
and big business soured.
The Eurozone is similarly manifesting itself to be an economic zone of a few relatively
healthy economies and several others bordering upon default and depression. The
European Commission’s forced austerity requirements on the countries with slumping
economies will only exacerbate an already worsening trend of income inequality. These
countries, in desperate need for cheap liquidity to help finance massive budget deficits,
are being forced to submit to the demands of the richer Eurozone countries in order to
postpone bankruptcy. The net result of the austerity measures agreed to will propel
these slumping economies into deeper recessions and greater unemployment. As
unemployment rises it exaggerates the income disparity between the haves and have-
nots.
Problems of increasing income inequality are not confined to the West, or to only
advanced economies. They are also present right here in Asia. For example, Singapore’s
Deputy Prime Minister Tharman Shanmugaratnam said in a recent speech that market
forces will only widen disparities in income and wealth. ‘Economic growth itself does
not lift all boats and certainly not equally’. He pointed out that the bottom fifth of
workers in Singapore have not seen any increase in real incomes in the last decade, and
in Singapore’s case it was a decade of robust economic growth. It also was a period of
earnest competition. The World Economic Forum in their latest Global Competitiveness
Report ranked Singapore the second most competitive economy in the world after
1 The views and opinions expressed herein are those of the author, and do not necessarily represent those of the National University of Singapore (NUS), the NUS Business School or CAMRI.
2
Switzerland. Therefore, according to Mr. Shanmugaratnam, Singapore ‘needs careful
sustained government intervention and a good dose of compassion’ to counter this
inevitable trend. Other major Asian economies are also experiencing rising income
inequality; however, they are further behind Singapore in their economic development
and are at a stage in development when inequality is typically experienced. As these
emerging economies, like China’s, continue to advance into more mature phases of
development, the initial income disparity associated with emerging growth will
transition into a broader economic issue for their governments to control.
Unequal Distribution of Success Attributes
Governments and social engineers, whenever they have had the opportunity, have been
plagued by the difficult tradeoff between promoting a society based upon meritocracy
and providing an adequate lifestyle for the underclass. Nearly all of the most
economically successful countries in the past century have benefitted tremendously
from adopting and promoting a meritocracy. A society that richly rewards achievement
raises the standard of living for all members of society. The evidence from a diverse
group of countries across the universe overwhelmingly supports this concept and
equally condemns claims from alternative regimes such as communism, dictatorships
and fascism. However, unfettered capital markets and meritocracies may create income
inequality.
Then why is there a dilemma, why indeed is there a trade-off? The trade-off comes as a
result of the unequal distribution of personal attributes. The distribution of personal
attributes that drive a meritocracy: skills, intelligence, ambition, desire, and work
discipline are not distributed evenly across the population, or in any political state.
Thus, some individuals succeed and amass enormous wealth and power and some
languish at the bottom of society. The dilemma for society is how to provide enough
social services to those that have not achieved much from the spoils amassed by the
ultra-achievers. If the gifted and dedicated achievers keep all that they have earned,
leaving only crumbs for the not so gifted, they will need to hire many not so gifted to
keep the remaining not so gifted from their doorstep. Because the modern era of
interconnectedness has given all income classes access to information about necessities:
education and health care, and some of the nicer things in life: entertainment and
material items, all classes build similar expectations.
Income inequality is rising in nearly all relatively free market economies. It appears to
be the hallmark of successful market activity. A market economy is based upon
incentives and reward for achievement. The most successful economies reward
achievement the most. History has produced enumerable examples across many
3
different societies and eras that have demonstrated how reward for achievement
promotes economic growth and propels innovation. However, the problem for political
leaders is personal attributes such as skill, ambition, desire for achievement, dedication,
and work effort are not distributed evenly throughout the population. Therefore, the
rewards for achievement are not distributed uniformly either.
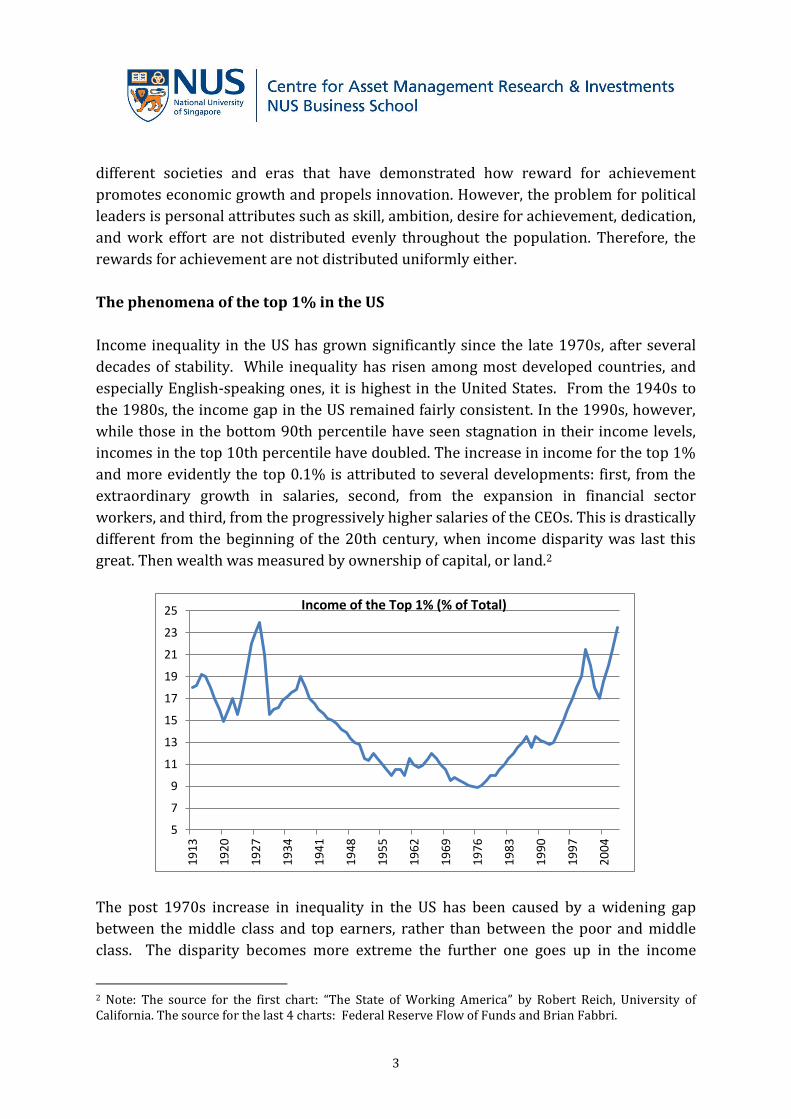
The phenomena of the top 1% in the US
Income inequality in the US has grown significantly since the late 1970s, after several
decades of stability. While inequality has risen among most developed countries, and
especially English-speaking ones, it is highest in the United States. From the 1940s to
the 1980s, the income gap in the US remained fairly consistent. In the 1990s, however,
while those in the bottom 90th percentile have seen stagnation in their income levels,
incomes in the top 10th percentile have doubled. The increase in income for the top 1%
and more evidently the top 0.1% is attributed to several developments: first, from the
extraordinary growth in salaries, second, from the expansion in financial sector
workers, and third, from the progressively higher salaries of the CEOs. This is drastically
different from the beginning of the 20th century, when income disparity was last this
great. Then wealth was measured by ownership of capital, or land.2
The post 1970s increase in inequality in the US has been caused by a widening gap
between the middle class and top earners, rather than between the poor and middle
class. The disparity becomes more extreme the further one goes up in the income
2 Note: The source for the first chart: “The State of Working America” by Robert Reich, University of California. The source for the last 4 charts: Federal Reserve Flow of Funds and Brian Fabbri.
5
7
9
11
13
15
17
19
21
23
25
19
13
19
20
19
27
19
34
19
41
19
48
19
55
19
62
19
69
19
76
19
83
19
90
19
97
20
04
Income of the Top 1% (% of Total)
4
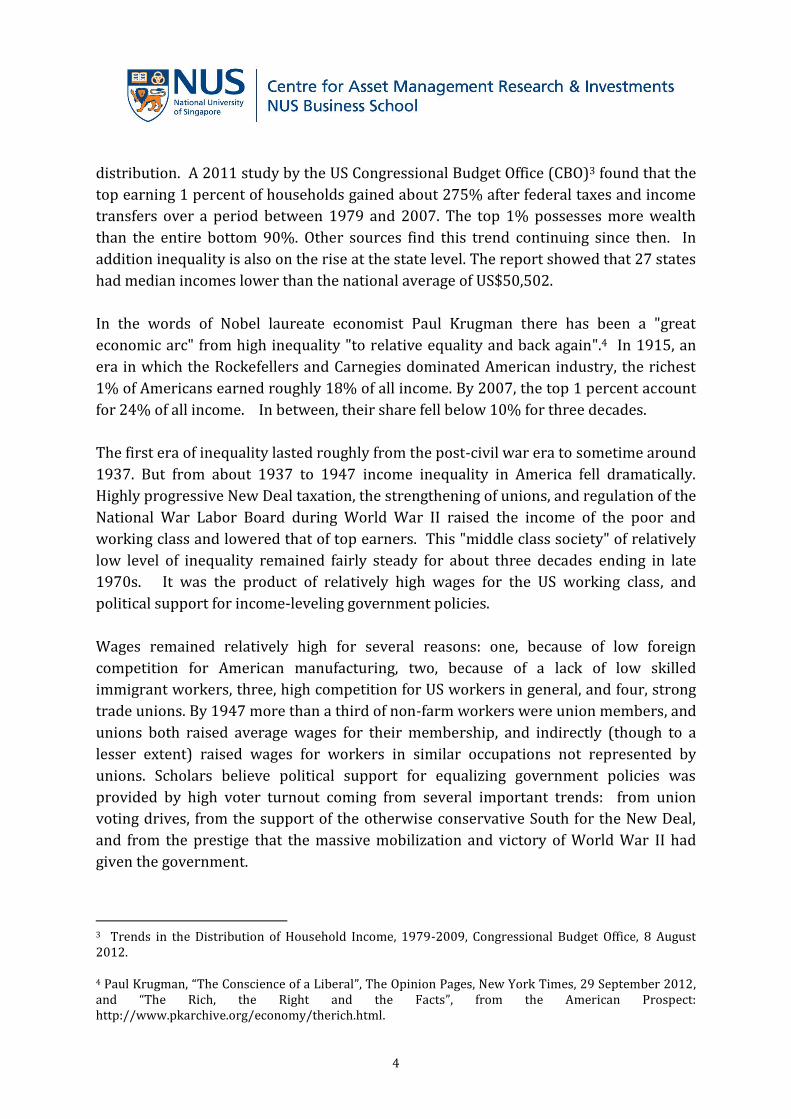
distribution. A 2011 study by the US Congressional Budget Office (CBO)3 found that the
top earning 1 percent of households gained about 275% after federal taxes and income
transfers over a period between 1979 and 2007. The top 1% possesses more wealth
than the entire bottom 90%. Other sources find this trend continuing since then. In
addition inequality is also on the rise at the state level. The report showed that 27 states
had median incomes lower than the national average of US$50,502.
In the words of Nobel laureate economist Paul Krugman there has been a "great
economic arc" from high inequality "to relative equality and back again".4 In 1915, an
era in which the Rockefellers and Carnegies dominated American industry, the richest
1% of Americans earned roughly 18% of all income. By 2007, the top 1 percent account
for 24% of all income. In between, their share fell below 10% for three decades.
The first era of inequality lasted roughly from the post-civil war era to sometime around
1937. But from about 1937 to 1947 income inequality in America fell dramatically.
Highly progressive New Deal taxation, the strengthening of unions, and regulation of the
National War Labor Board during World War II raised the income of the poor and
working class and lowered that of top earners. This "middle class society" of relatively
low level of inequality remained fairly steady for about three decades ending in late
1970s. It was the product of relatively high wages for the US working class, and
political support for income-leveling government policies.
Wages remained relatively high for several reasons: one, because of low foreign
competition for American manufacturing, two, because of a lack of low skilled
immigrant workers, three, high competition for US workers in general, and four, strong
trade unions. By 1947 more than a third of non-farm workers were union members, and
unions both raised average wages for their membership, and indirectly (though to a
lesser extent) raised wages for workers in similar occupations not represented by
unions. Scholars believe political support for equalizing government policies was
provided by high voter turnout coming from several important trends: from union
voting drives, from the support of the otherwise conservative South for the New Deal,
and from the prestige that the massive mobilization and victory of World War II had
given the government.
3 Trends in the Distribution of Household Income, 1979-2009, Congressional Budget Office, 8 August 2012. 4 Paul Krugman, “The Conscience of a Liberal”, The Opinion Pages, New York Times, 29 September 2012, and “The Rich, the Right and the Facts”, from the American Prospect: http://www.pkarchive.org/economy/therich.html.
5
The return to high inequality began in the late 1970s. Studies have found that income
grew more unequal almost continuously since then except during the economic
recessions in 1990-91, 2001, and 2007 sub-prime bust. The present inequality differs in
some ways from the pre-Depression era inequality. Before 1937 a larger share of top
earners’ income came from capital (interest, dividends, income from rent, capital gains).
Post 1970, the income of high-bracket taxpayers comes predominantly from "labor", i.e.,
employment compensation. Economist Timothy Smeeding summed up the current
trend.5 Americans have the highest income inequality in the rich world, and over the
past 20–30 years Americans have also experienced the greatest increase in income
inequality among rich nations. The more detailed the data we can use to observe this
change, the more skewed the change appears to be. The majority of large gains are
indeed at the top of the distribution.
According to CBO the major reason for the observed rise in the unequal distribution of
after-tax income was an increase in market income that is household income before
taxes and transfers. Market income for a household is a combination of labor income
(such as cash wages, employer-paid benefits, employer-paid payroll taxes), business
income (such as income from businesses and farms operated solely by their owners),
capital gains (profits realized from the sale of assets, stock options), capital income
(such as interest from deposits, dividends, rental income), and other income. Of these,
capital gains accounted for 80% of the increase in market income for the households in
the top 20%, in the 2000-2007 periods. Even over the 1991-2000 periods, according to
the CBO, capital gains accounted for 45% of the market income for the top 20% of
households.
The U.S. is not alone among developed nations in facing rising income inequality. The
rich are getting richer and the poor are getting poorer in all the Anglo-Saxon countries
(UK and Canada), while in contrast, there has been stability in the income distribution in
many other developed countries such as France, Japan and Sweden. The pre-tax income
inequality in France is significantly reduced by its tax system where the tax code is more
progressive than in the U.S, similarly in Sweden.
Keeping the Spoils
Income inequalities’ pernicious effects manifest itself in two vital areas: political power
and education. Both enable the wealthy to perpetuate and preserve their privileged
status. The adage that money is power is played out with increasing visibility in each US
5 Timothy Smeeding, “Public Policy, Economic Inequality, and Poverty: The United States in Comparative Perspective”, Social Science Quarterly, Volume 86, Issue Supplement s1, pages 955 – 983, December 2005.

6
national election as wealthy corporations and individuals contribute outrageous
amounts of money to political campaigns to protect their interests. Politicians use the
vast sums of money to purchase expensive media advertising campaigns to successfully
grasp election victories. Once seated in power they are morally obligated to promote
legislation that protects or enhances their benefactors’ economic and social interests.
The complexity of the U.S. tax code creates a disconnect between the tax rates on the
books and what people and corporations pay. Whoever has the best accountant pays the
lowest tax rate. This exacerbates and creates the weird scenario where the rich are
taxed at a lower rate. They also have the best lobbies for tax reduction and the best
accountants who can provide the best strategies to avoid (not evade) taxes. Buttressing
this point is the declaration from the most esteemed investor in America, Warren Buffet,
a billionaire himself, who admitted that his income is taxed at a rate that is well below
that of his secretary.
A similar serious effect that results from high concentrations of wealth is the
perpetuation of income inequality across generations through education. In highly
developed meritocracies, income and wealth is highly positively correlated with
education. University selection in the US is primarily driven by academic achievement
and family affiliation. Academic success is often achieved through expensive and intense
tutoring to supplement private school education. The more educated children gain
access to the best universities, often the most expensive. These universities not only
provide a relatively more celebrated education, but equally important access to mingle
and befriend the next generation of successful individuals. Moreover, those with the
least education are the most likely to be hurt by disruptions and changes in the
economy caused by international trade or by technological changes.
“Also, when you have a degree, you are much more likely to be insured against the
fluctuations of the business cycle,” states Peter Orszag, former director of the US
Congressional Budget Office (cbo). He adds that in the US, immigration, the decline in
unions, and the decline of the minimum wage in real terms - conditions which largely
affect those with less education – may also have an effect on rising inequality.
Technology increases the demand for skilled workers, which raises their wages relative
to unskilled workers. Education raises the supply of skilled workers, bringing relative
wage differentials down and therefore reducing inequality. However, the problem is
that the US has not responded to the technological revolution by becoming more
educated. Indeed, Orszag points out that the demand for skills has far outstripped their
supply, which suggests that income inequality will exist as long as the skills gap
remains.
7
Finally, a new social psychology is gaining more notoriety: last place aversion. As the
middle class continues to decline in number and importance, experimental economists
have discovered that people losing status become much less generous to those below
them when they feel they are in second to last place. They would rather distribute
money upward than help those on the bottom to surpass them. The lack of growth tends
to breed xenophobia, intolerance, and a negative feeling towards the poor. This
complicates the political process and helps explain the sometimes confusing and
economically perverse claims by new political parties (example, the Tea Party in the US)
voicing populist outcries.6
So What?
If the myriad of economic factors and developmental trends have combined to produce
a less equal distribution of income in the Anglo countries, all of whom have been
operating under a meritocracy system, should politicians worry, or equally, should
investors worry? Are the recent fledgling Occupy Wall Street movements just a tiny hint
of a more serious social rebelliousness to come?
In the late 1920s when the income disparity was at its widest the prevailing boom
morphed into the great depression. It is true that millions of dollars in financial assets
were lost, but the social losses emanating from a 25% unemployment rate were graver.
Today’s dilemma is equally serious. After 3 years of insipid economic recovery the
unemployment rate remains above 8%, household liabilities, while lower than at their
peak, remain uncomfortably high from a historical perspective, and household real
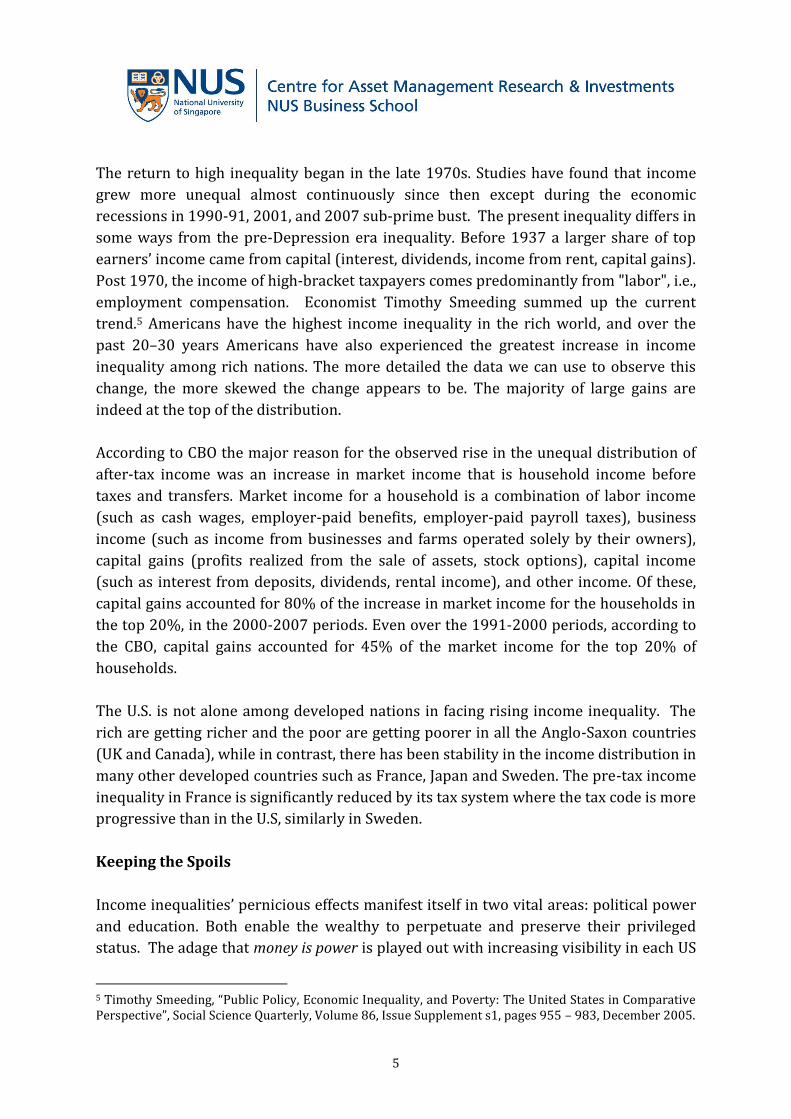
estate values have not recovered. In fact, after years of extracting equity from their
households and the recent plunge in equity values, households own just 43% of their
real estate compared with 72% fifty years ago.
6 Editor’s Note: The New York Magazine article, “The Money-Empathy Gap” reports that “the affluent value individuality — uniqueness, differentiation, achievement — whereas people lower down on the ladder tend to stress homogeneity, harmonious interpersonal relationships, and group affiliation.” http://nymag.com/news/features/money-brain-2012-7/index5.html In a related article in FT Wealth’s Autumn 2012 issue on the Politics of Greed, UC Berkeley psychologist, Paul Piff, and his colleagues are reported to have (controversially) documented that “wealth and higher education are associated with higher levels of independence, freedom and self-esteem” and that “the ’upper classes’ are less cognizant of others, less empathetic and easily distracted.”
8
Ironically, it is financial assets whose values have recovered during the current business
cycle expansion boosted by the massive injection of monetary liquidity. Stimulative
monetary policy has resurrected depressed financial asset prices, but unfortunately not
real estate prices. At mid-year 2012, non-financial asset prices are 18% below their
2007 peak. Since most families in the US own their own homes, and according to a
recent Federal Reserve survey of households, 90% of financial assets (mainly stocks)
are owned by just 10% of the population, it must have been the wealthy who derived all
of the benefit from loose monetary policy. Indeed, in the post great recession period, the
wealth gap became wider.
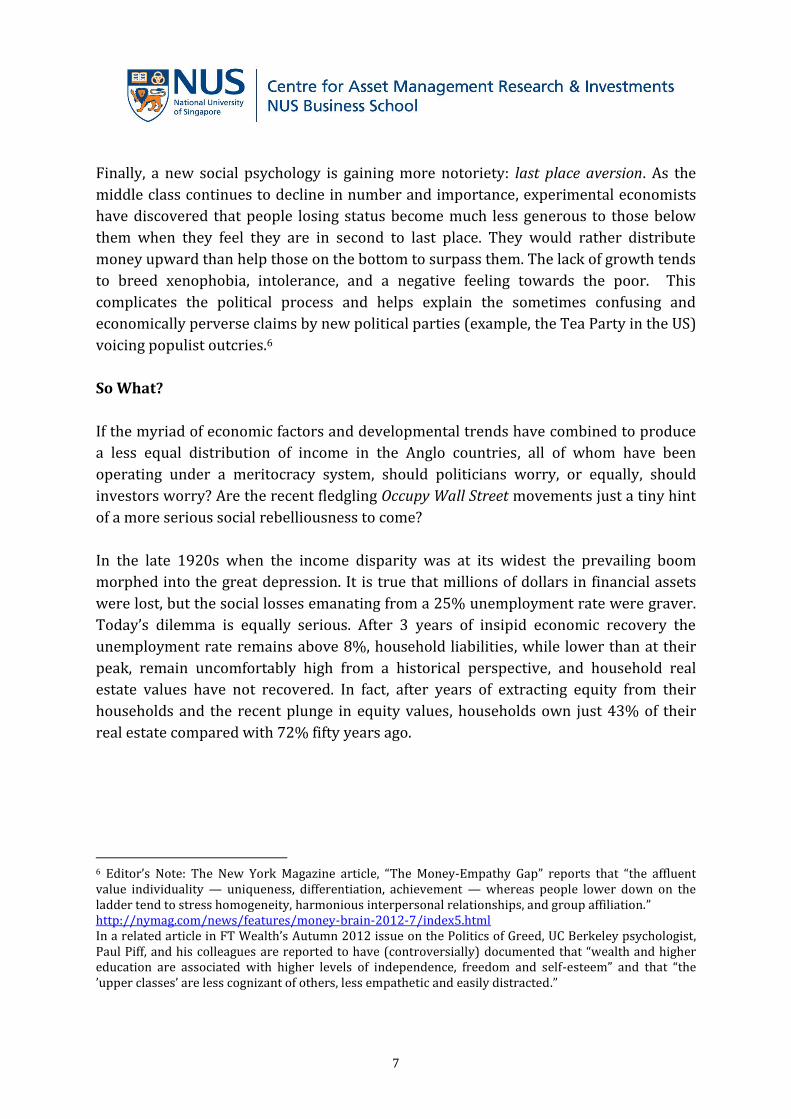
Another result is that the value of household financial assets has risen to double that of
non-financial assets over the past 40 years. In 1972 household assets were roughly
evenly divided between tangible and financial assets, a time marked by a much more
30
35
40
45
50
55
60
65
70
75
0
2000
4000
6000
8000
10000
12000
14000
16000
19
60
Q1
19
62
Q3
19
65
Q1
19
67
Q3
19
70
Q1
19
72
Q3
19
75
Q1
19
77
Q3
19
80
Q1
19
82
Q3
19
85
Q1
19
87
Q3
19
90
Q1
19
92
Q3
19
95
Q1
19
97
Q3
20
00
Q1
20
02
Q3
20
05
Q1
20
07
Q3
20
10
Q1
HH Equity in Real Estate (bns $)
Equity/RE Market Value right
HH Equity left
0
10000
20000
30000
40000
50000
60000
19
72
Q2
19
74
Q1
19
75
Q4
19
77
Q3
19
79
Q2
19
81
Q1
19
82
Q4
19
84
Q3
19
86
Q2
19
88
Q1
19
89
Q4
19
91
Q3
19
93
Q2
19
95
Q1
19
96
Q4
19
98
Q3
20
00
Q2
20
02
Q1
20
03
Q4
20
05
Q3
20
07
Q2
20
09
Q1
20
10
Q4
Comparison of Household Financial and Non Financial Assets (bns $)
Financial
Non financial
9
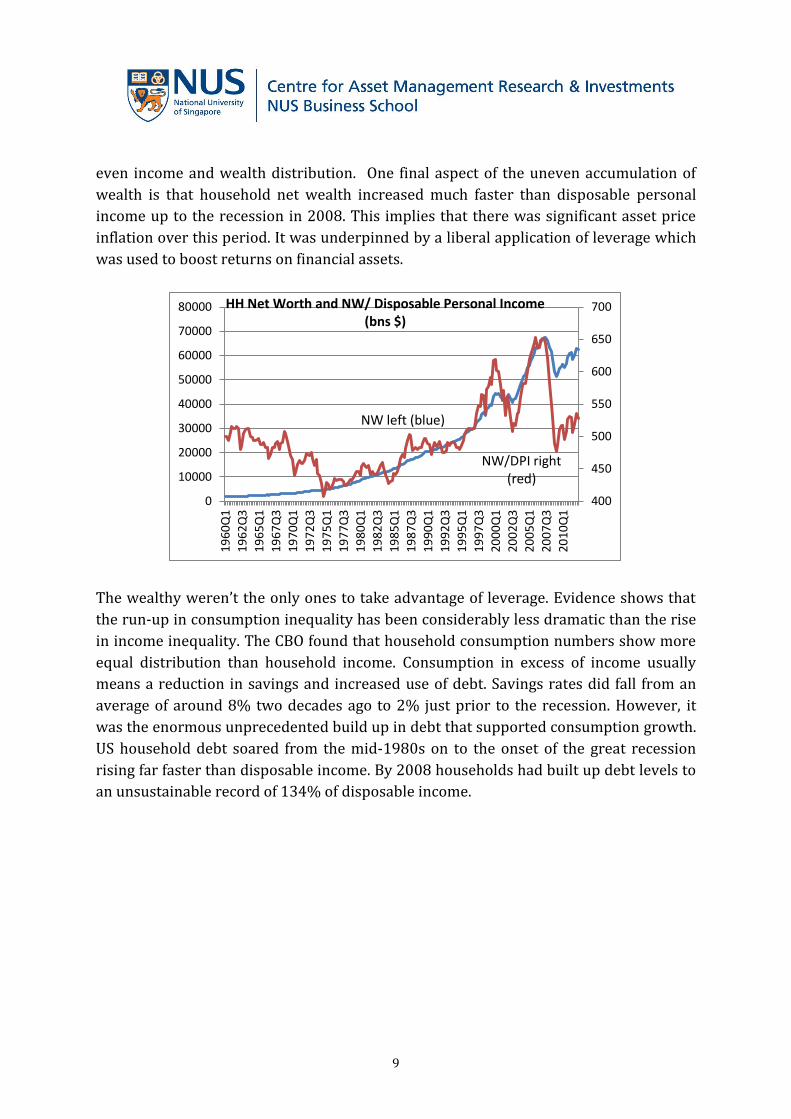
even income and wealth distribution. One final aspect of the uneven accumulation of
wealth is that household net wealth increased much faster than disposable personal
income up to the recession in 2008. This implies that there was significant asset price
inflation over this period. It was underpinned by a liberal application of leverage which
was used to boost returns on financial assets.
The wealthy weren’t the only ones to take advantage of leverage. Evidence shows that
the run-up in consumption inequality has been considerably less dramatic than the rise
in income inequality. The CBO found that household consumption numbers show more
equal distribution than household income. Consumption in excess of income usually
means a reduction in savings and increased use of debt. Savings rates did fall from an
average of around 8% two decades ago to 2% just prior to the recession. However, it
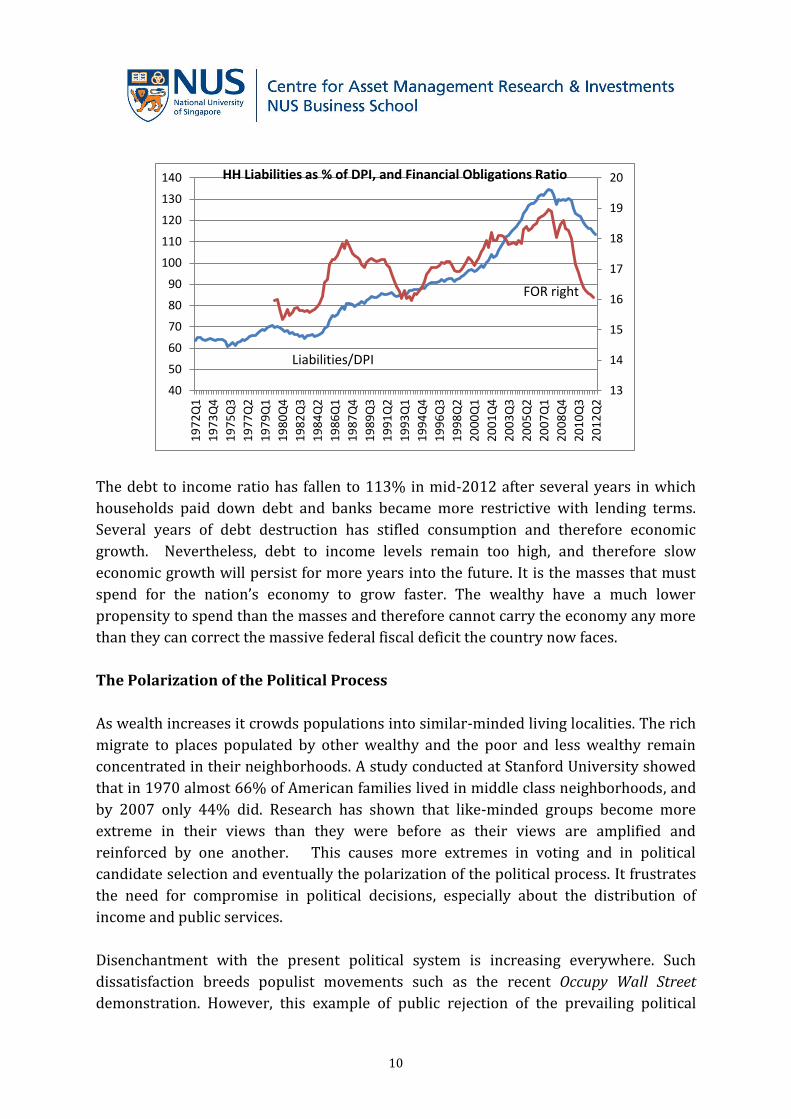
was the enormous unprecedented build up in debt that supported consumption growth.
US household debt soared from the mid-1980s on to the onset of the great recession
rising far faster than disposable income. By 2008 households had built up debt levels to
an unsustainable record of 134% of disposable income.
400
450
500
550
600
650
700
0
10000
20000
30000
40000
50000
60000
70000
80000
19
60
Q1
19
62
Q3
19
65
Q1
19
67
Q3
19
70
Q1
19
72
Q3
19
75
Q1
19
77
Q3
19
80
Q1
19
82
Q3
19
85
Q1
19
87
Q3
19
90
Q1
19
92
Q3
19
95
Q1
19
97
Q3
20
00
Q1
20
02
Q3
20
05
Q1
20
07
Q3
20
10
Q1
HH Net Worth and NW/ Disposable Personal Income (bns $)
NW/DPI right
(red)
NW left (blue)
10
The debt to income ratio has fallen to 113% in mid-2012 after several years in which
households paid down debt and banks became more restrictive with lending terms.
Several years of debt destruction has stifled consumption and therefore economic
growth. Nevertheless, debt to income levels remain too high, and therefore slow
economic growth will persist for more years into the future. It is the masses that must
spend for the nation’s economy to grow faster. The wealthy have a much lower
propensity to spend than the masses and therefore cannot carry the economy any more
than they can correct the massive federal fiscal deficit the country now faces.
The Polarization of the Political Process
As wealth increases it crowds populations into similar-minded living localities. The rich
migrate to places populated by other wealthy and the poor and less wealthy remain
concentrated in their neighborhoods. A study conducted at Stanford University showed
that in 1970 almost 66% of American families lived in middle class neighborhoods, and
by 2007 only 44% did. Research has shown that like-minded groups become more
extreme in their views than they were before as their views are amplified and
reinforced by one another. This causes more extremes in voting and in political
candidate selection and eventually the polarization of the political process. It frustrates
the need for compromise in political decisions, especially about the distribution of
income and public services.
Disenchantment with the present political system is increasing everywhere. Such
dissatisfaction breeds populist movements such as the recent Occupy Wall Street
demonstration. However, this example of public rejection of the prevailing political
13
14
15
16
17
18
19
20
40
50
60
70
80
90
100
110
120
130
1401
97
2Q
1
19
73
Q4
19
75
Q3
19
77
Q2
19
79
Q1
19
80
Q4
19
82
Q3
19
84
Q2
19
86
Q1
19
87
Q4
19
89
Q3
19
91
Q2
19
93
Q1
19
94
Q4
19
96
Q3
19
98
Q2
20
00
Q1
20
01
Q4
20
03
Q3
20
05
Q2
20
07
Q1
20
08
Q4
20
10
Q3
20
12
Q2
HH Liabilities as % of DPI, and Financial Obligations Ratio
FOR right
Liabilities/DPI
11
system in the US is a benign response. Moreover, the spark that ignited this protest was
not the growth in income inequality; rather it was a vigorous response to the crony
capitalism that used public funds to bail out companies and individual managers of
failing institutions. The government underwrote the banks who wound up privatizing
profits and socializing risks. It was as if the public’s embrace of meritocracy was dashed
into the ground when the government decided to reject the market’s natural discipline
to punish failure, and instead chose to reward failure with public funds. The US public is
growing suspicious that the elite in charge of government regulation are placing their
own interests above shared social values. The business and government interaction
witnessed in the past few years creates public outrage, and the ensuing populism
generates dangerous politics, which left uncontested will cause a vicious cycle.
In Europe disenchantment is rising especially among the young. Twenty percent of
those under 25 years old have no jobs. The youth unemployment situation is worse in
Greece and Spain where 25% and close to 50%, respectively, is unemployed.
Consequently, Europe is much closer to a tipping point than the US. The more sinister
examples of disenchantment are the growth of extremist political parties that are
mushrooming throughout Europe, like those that destroyed the continent in the
previous century.
Preventing a tipping point – some suggestions
Are there solutions to prevent bigger, broader and more dangerous popular responses?
Some suggestions are obvious and should prove effective, albeit they are not universally
popular. First, increase the national tax rates’ progressivity back to the levels that
prevailed several decades ago. Second, remove tax deductions that render the present
degree of progressivity ineffective. Return to promoting social goals directly through
expenditures not indirectly through revenue reductions. Third, enforce the present
monopoly and anti-trust legislation vigorously with an objective to improve
competition, and to eliminate all too big to fail institutions, which have shackled
governments. It is robust forms of competition that makes capitalism work. Enhanced
competition will return power back to governments so they won’t be forced to support
companies that are too big to fail. Fourth, ensure that the public strongly believes that
the system is fair — eliminate any suggestion of crony capitalism that has crept into
view recently. Fifth, simplify and minimize government regulations, and shift the
execution of the regulations from the lawyers, lobbyists, and entrenched parties back to
the people. This would reduce the inherent corruption associated with excess
complicated regulation.
12
Some suggestions are more dubious in terms of their timely effectiveness such as:
creating a corporate climate of social responsibility, one that goes beyond that of
maximizing shareholder value. It is a noble suggestion, but it would take years of
education before it would become a guiding corporate principle. Finally, ensure that
public goods are accessible to everyone in society equally, such as education and health
care. Of course in a competitive, free market society private institutions will arise
offering perceived better values that only the wealthy will be able to afford. It was
Adam Smith who warned long ago that capitalism was the best system but an inherently
flawed one that requires careful government regulation and supervision.
Dr Brian Fabbri is Managing Director of FABBRI Global Economics. He was formerly the
Chief US Economist for North America at BNP Paribas, and was based in New York. Dr
Fabbri also worked as Chief International Economist for Midland Bank Plc, as senior vice
president, chief economist and director of institutional research at Thomson McKinnon, as
vice president & senior economist at Salomon Brothers, and as head of the capital markets
unit at the Federal Reserve Bank of New York. He appears regularly on CNBC and other
business networks and radio shows, and is a member of the National Association of
Business Economists, the New York Association of Business Economists, the Downtown
Economists Club and the Money Marketers. Dr Fabbri earned a Ph.D. at New York
University.
For more information, please contact [email protected]