Income, expenses & capital IFRS Other information ...
129
5 March 2020 AVIVA PLC 2019 PRELIMINARY RESULTS ANNOUNCEMENT Maurice Tulloch, Chief Executive Officer, said: In 2019, we set out our priorities and financial targets, strengthened our leadership team and remained focused on helping our customers prepare for a better future. We’ve made good progress, but there is much more to do. Our return on equity was 14.3% and operating profit increased 6% to a record £3.2 billion. Our capital position remains strong and resilient at a 206% Solvency cover ratio. The Board has increased the full year dividend by 3% to 30.9 pence per share. Customers are choosing Aviva to help them save for their future, draw a secure income in retirement and insure what matters most to them. In 2019, we increased customer numbers by 2% to 33.4 million, and improved customer satisfaction levels. In general insurance, sales are up 2% and the outlook is positive in the majority of our markets. In our major life businesses, we have increased customer net inflows and grown assets by 9% to £417 billion. Aviva Investors secured third party net inflows of £2.3 billion on the back of strong investment performance. My objective is to run Aviva better. We will improve business performance and enhance returns through disciplined action on expenses and underwriting. We will focus capital and resources where we can achieve competitive advantage and strong returns and we will take robust action across the portfolio where our performance falls short or where we can see a better way of delivering value to our shareholders. Economic returns • Solvency II return on equity 1,2,‡ 14.3% (2018: 12.5%) • Own funds generation 1,2 £2.3 billion (2018: £2.0 billion) • Operating capital generation 2,‡# £2.3 billion (2018: £3.2 billion) Profit • Operating profit 3,‡# up 6% to £3,184 million (2018: £3,004 million 5 ) • Operating EPS 3,4,‡# up 8% to 60.5 pence (2018: 56.2 pence 5 ) • IFRS profit before tax £3,374 million (2018: £2,129 million) • Basic EPS 63.8 pence (2018: 38.2 pence) Dividend • Final dividend per share 21.40 pence • Total 2019 dividend per share 30.9 pence (2018: 30.0 pence) Capital & Cash • Solvency II capital surplus 2 £12.6 billion (2018: £12.0 billion) • Solvency II cover ratio 2,‡# 206% (2018: 204%) • Solvency II net asset value 2 per share 423 pence (2018: 392 pence) • Cash remittances ‡# £2.6 billion (2018: £3.1 billion) • Centre liquidity 6 £2.4 billion (2018: £1.6 billion) • Debt leverage ratio ‡ 31% (2018: 33%) • IFRS net asset value per share 434 pence (2018: 424 pence) Performance • Life PVNBP up 12% to £45.7 billion (2018: £40.8 billion) • Value of new business (VNB) ‡ up 2% to £1,224 million (2018: £1,202 million) • General insurance net written premiums (NWP) up 2% to £9.3 billion (2018: £9.1 billion) • General insurance combined operating ratio (COR) ‡ 97.5% (2018: 97.2% 5 ) • Controllable costs ‡ £3,939 million (2018: £3,968 million) • Achieved savings £72 million 7 , before programme implementation and IFRS 17 costs of £59 million ‡ Denotes Alternative Performance Measures (APMs) which are key performance indicators of the Group used to measure our performance and financial strength. Further details of this measure are included in the ‘Other information’ section of the Analyst Pack. # Denotes key performance indicators which are used by the Group to determine or modify remuneration. Further details of this measure are included in the ‘Other information’ section of the Analyst Pack. 1 Includes Group centre, debt costs and other items not allocated to the markets. 2 The estimated Solvency II position represents the shareholder view only. See section 3 of the Overview for more details. 3 Group adjusted operating profit is a non-GAAP APM which is not bound by the requirements of IFRS. Further details of this measure are included in the ‘Other information’ section of the Analyst Pack. 4 This measure is derived from the Group adjusted operating profit APM. Further details of this measure are included in the ‘Other information’ section of the Analyst Pack. 5 During 2019 the Group adjusted operating profit APM has been revised and now includes the amortisation and impairment of internally generated intangible assets to better reflect the operational nature of these assets (see note B2(b)). Group adjusted operating profit continues to exclude amortisation and impairment of intangible assets acquired in business combinations. Comparative amounts have been restated resulting in a reduction in the prior period Group adjusted operating profit of £112 million. There is no impact on profit before tax attributable to shareholders’ profit. Following the change in the definition of Group adjusted operating profit, COR, operating expenses and operating earnings per share have also been restated to include the amortisation and impairment of internally generated intangible assets. Comparative amounts have been restated resulting in an increase in prior period COR of 0.6%, an increase in prior period operating expenses of £112 million and a reduction in prior period operating earnings per share of 2.2 pence. 6 Stated as at end February. 7 Constant currency. News Release Aviva plc Preliminary announcement 2019 119
Transcript of Income, expenses & capital IFRS Other information ...

Aviva plc Preliminary Announcement 2019
5 March 2020
AVIVA PLC 2019 PRELIMINARY RESULTS ANNOUNCEMENT
Maurice Tulloch, Chief Executive Officer, said:
In 2019, we set out our priorities and financial targets, strengthened our leadership team and remained focused on helping our customers prepare for a better future. We’ve made good progress, but there is much more to do.
Our return on equity was 14.3% and operating profit increased 6% to a record £3.2 billion. Our capital position remains strong and resilient at a 206% Solvency cover ratio. The Board has increased the full year dividend by 3% to 30.9 pence per share.
Customers are choosing Aviva to help them save for their future, draw a secure income in retirement and insure what matters most to them. In 2019, we increased customer numbers by 2% to 33.4 million, and improved customer satisfaction levels.
In general insurance, sales are up 2% and the outlook is positive in the majority of our markets. In our major life businesses, we have increased customer net inflows and grown assets by 9% to £417 billion. Aviva Investors secured third party net inflows of £2.3 billion on the back of strong investment performance.
My objective is to run Aviva better. We will improve business performance and enhance returns through disciplined action on expenses and underwriting. We will focus capital and resources where we can achieve competitive advantage and strong returns and we will take robust action across the portfolio where our performance falls short or where we can see a better way of delivering value to our shareholders.
Economic returns • Solvency II return on equity1,2,‡ 14.3% (2018: 12.5%) • Own funds generation1,2 £2.3 billion (2018: £2.0 billion) • Operating capital generation2,‡# £2.3 billion (2018: £3.2 billion)
Profit • Operating profit3,‡# up 6% to £3,184 million (2018: £3,004 million5) • Operating EPS3,4,‡# up 8% to 60.5 pence (2018: 56.2 pence5) • IFRS profit before tax £3,374 million (2018: £2,129 million) • Basic EPS 63.8 pence (2018: 38.2 pence)
Dividend • Final dividend per share 21.40 pence • Total 2019 dividend per share 30.9 pence (2018: 30.0 pence)
Capital & Cash • Solvency II capital surplus2 £12.6 billion (2018: £12.0 billion) • Solvency II cover ratio2,‡# 206% (2018: 204%) • Solvency II net asset value2 per share 423 pence (2018: 392 pence) • Cash remittances‡# £2.6 billion (2018: £3.1 billion) • Centre liquidity6 £2.4 billion (2018: £1.6 billion) • Debt leverage ratio‡ 31% (2018: 33%) • IFRS net asset value per share 434 pence (2018: 424 pence)
Performance • Life PVNBP up 12% to £45.7 billion (2018: £40.8 billion) • Value of new business (VNB)‡ up 2% to £1,224 million (2018: £1,202 million) • General insurance net written premiums (NWP) up 2% to £9.3 billion (2018: £9.1 billion) • General insurance combined operating ratio (COR)‡ 97.5% (2018: 97.2%5) • Controllable costs‡ £3,939 million (2018: £3,968 million) • Achieved savings £72 million7, before programme implementation and IFRS 17 costs of £59 million
‡ Denotes Alternative Performance Measures (APMs) which are key performance indicators of the Group used to measure our performance and financial strength. Further details of this measure are included in the ‘Other information’ section of the Analyst Pack. # Denotes key performance indicators which are used by the Group to determine or modify remuneration. Further details of this measure are included in the ‘Other information’ section of the Analyst Pack. 1 Includes Group centre, debt costs and other items not allocated to the markets. 2 The estimated Solvency II position represents the shareholder view only. See section 3 of the Overview for more details. 3 Group adjusted operating profit is a non-GAAP APM which is not bound by the requirements of IFRS. Further details of this measure are included in the ‘Other information’ section of the Analyst Pack. 4 This measure is derived from the Group adjusted operating profit APM. Further details of this measure are included in the ‘Other information’ section of the Analyst Pack. 5 During 2019 the Group adjusted operating profit APM has been revised and now includes the amortisation and impairment of internally generated intangible assets to better reflect the operational nature of these assets (see note B2(b)). Group
adjusted operating profit continues to exclude amortisation and impairment of intangible assets acquired in business combinations. Comparative amounts have been restated resulting in a reduction in the prior period Group adjusted operating profit of £112 million. There is no impact on profit before tax attributable to shareholders’ profit. Following the change in the definition of Group adjusted operating profit, COR, operating expenses and operating earnings per share have also been restated to include the amortisation and impairment of internally generated intangible assets. Comparative amounts have been restated resulting in an increase in prior period COR of 0.6%, an increase in prior period operating expenses of £112 million and a reduction in prior period operating earnings per share of 2.2 pence.
6 Stated as at end February. 7 Constant currency.
News Release Alternative Performance Measures continued
Aviva plc Preliminary announcement 2019 119
Overview Analysis of assets Other information
IFRS Income, expenses & capital
Spread margin The spread margin represents the return made on the Group’s annuity and other non-linked business, based on the expected investment return, less amounts credited to policyholders. While not a key performance metric of the Group, the spread margin is a useful indicator of the expected investment return arising on this business.
Underwriting margin The underwriting margin represents the release of reserves held to cover claims, surrenders and administrative expenses less the cost of actual claims and surrenders in the period.
Unit-linked margin The unit-linked margin represents the annual management charges on unit-linked business. This is an indicator of the return arising on this business.

Key financial metrics
Aviva plc Preliminary Announcement 2019
Profit
2019
£m
Restated1
2018 £m
Sterling % change
Operating profit2,‡# 3,184 3,004 6% Operating earnings per share2,3‡# 60.5p 56.2p 8% IFRS profit before tax attributable to shareholders 3,374 2,129 58% Basic earnings per share 63.8p 38.2p 67%
Capital Position
31 December
2019 31 December
2018 Change
Estimated shareholder Solvency II cover ratio4,‡# 206% 204% 2pp Estimated Solvency II surplus4 £12.6bn £12.0bn 5% Solvency II net asset value per share 423p 392p 8% Solvency II debt leverage‡ 31% 33% (2)pp
Dividend 2019 2018
Sterling % change
Final dividend per share 21.40p 20.75p 3% Total dividend per share 30.90p 30.00p 3%
Solvency II basis: Operating capital generation (OCG)‡# and Cash remittances‡# Solvency II Operating capital generation
Cash remittances
2019
£m 2018
£m Sterling %
change 2019
£m 2018
£m Change
Group 2,259 3,198 (29)% 2,597 3,137 (17)%
Solvency II basis: Operating own funds generation and Return on capital/equity#
Solvency II Operating own funds generation
Solvency II Return on
capital/equity
2019
£m 2018
£m Sterling %
change 2019
% 2018
% Change
UK Life and Investments, Savings & Retirement 1,314 1,663 (21)% 9.5% 11.3% (1.8)pp General Insurance 628 532 18% 14.0% 11.7% 2.3pp Europe Life 574 384 50% 10.3% 6.9% 3.4pp Asia Life 187 144 30% 12.7% 9.7% 3.0pp Group5 2,257 2,022 12% 14.3% 12.5% 1.8pp
Expenses
2019
£m
Restated4 2018
£m Sterling %
change
Operating expenses# 4,119 4,138 — Controllable costs‡ 3,939 3,968 (1)%
Value of new business: Adjusted Solvency II basis (VNB)‡ and Present value of new business premiums (PVNBP)
VNB PVNBP
2019
£m 2018
£m Sterling %
change 2019
£m 2018
£m Sterling %
change
UK Life 592 481 23% 27,570 23,946 15% Europe Life 414 517 (20)% 13,772 12,641 9% Asia Life 206 189 9% 3,057 2,656 15% Other 12 15 (19)% 1,266 1,520 (17)%
Total 1,224 1,202 2% 45,665 40,763 12%
General insurance combined operating ratio (COR)‡ and Net written premiums (NWP)
COR NWP
2019 Restated1
2018 Change 2019 2018 Change
United Kingdom 97.9% 94.6% 3.3pp 4,218 4,193 1% Canada 97.8% 103.1% (5.3)pp 3,061 2,928 5% Europe 95.7% 93.5% 2.2pp 2,017 1,985 2%
Group6 97.5% 97.2% 0.3pp 9,309 9,114 2% ‡ Denotes Alternative Performance Measures (APMs) which are key performance indicators of the Group. Further details of this measure are included in the ‘Other information’ section of the Analyst Pack. # Denotes key performance indicators which are used by the Group to determine or modify remuneration. Further details of this measure are included in the ‘Other information’ section of the Analyst Pack. 1 During 2019 the Group adjusted operating profit APM has been revised and now includes the amortisation and impairment of internally generated intangible assets to better reflect the operational nature of these assets (see note B2(b)). Group
adjusted operating profit continues to exclude amortisation and impairment of intangible assets acquired in business combinations. Comparative amounts have been restated resulting in a reduction in the prior period Group adjusted operating profit of £112 million. There is no impact on profit before tax attributable to shareholders’ profit. Following the change in the definition of Group adjusted operating profit, COR, operating expenses and operating earnings per share have also been restated to include the amortisation and impairment of internally generated intangible assets. Comparative amounts have been restated resulting in an increase in prior period COR of 0.6%, an increase in prior period operating expenses of £112 million and a reduction in prior period operating earnings per share of 2.2 pence.
2 Group adjusted operating profit is a non-GAAP APM which is not bound by the requirements of IFRS. Further details of this measure are included in the ‘Other information’ section of the Analyst Pack. 3 This measure is derived from the Group adjusted operating profit APM. Further details of this measure are included in the ‘Other information’ section of the Analyst Pack. 4 The estimated Solvency II position represents the shareholder view only. See section 3 of the Overview for more details. 5 Includes Group centre, debt costs and other items not allocated to the markets. 6 Group includes Asia & Other net written premiums of £13 million (2018: £8 million).
Alternative Performance Measures continued
Aviva plc Preliminary announcement 2019 119
Overview Analysis of assets Other information
IFRS Income, expenses & capital
Spread margin The spread margin represents the return made on the Group’s annuity and other non-linked business, based on the expected investment return, less amounts credited to policyholders. While not a key performance metric of the Group, the spread margin is a useful indicator of the expected investment return arising on this business.
Underwriting margin The underwriting margin represents the release of reserves held to cover claims, surrenders and administrative expenses less the cost of actual claims and surrenders in the period.
Unit-linked margin The unit-linked margin represents the annual management charges on unit-linked business. This is an indicator of the return arising on this business.

Chief Executive Officer’s report
‡ Denotes Alternative Performance Measures (APMs) which are key performance indicators of the Group used to measure our performance and financial strength. Further details of this measure are included in the ‘Other information’ section of the Analyst Pack. # Denotes key performance indicators which are used by the Group to determine or modify remuneration. Further details of this measure are included in the ‘Other information’ section of the Analyst Pack. 1 Includes Group centre, debt costs and other items not allocated to the markets. 2 The estimated Solvency II position represents the shareholder view only. See section 3 of the Overview for more details. 3 Group adjusted operating profit is a non-GAAP APM which is not bound by the requirements of IFRS. Further details of this measure are included in the ‘Other information’ section of the Analyst Pack. 4 During 2019 the Group adjusted operating profit APM has been revised and now includes the amortisation and impairment of internally generated intangible assets to better reflect the operational nature of these assets (see note B2(b)). Group
adjusted operating profit continues to exclude amortisation and impairment of intangible assets acquired in business combinations. Comparative amounts have been restated resulting in a reduction in the prior period Group adjusted operating profit of £112 million. There is no impact on profit before tax attributable to shareholders’ profit. Following the change in the definition of Group adjusted operating profit, COR, operating expenses and operating earnings per share have also been restated to include the amortisation and impairment of internally generated intangible assets. Comparative amounts have been restated resulting in an increase in prior period COR of 0.6%, an increase in prior period operating expenses of £112 million and a reduction in prior period operating earnings per share of 2.2 pence.
5 This measure is derived from the Group adjusted operating profit APM. Further details of this measure are included in the ‘Other information’ section of the Analyst Pack.
Aviva plc Preliminary Announcement 2019
Overview Aviva made important changes to its business and leadership in 2019 and began to build operating momentum. This is reflected in our improved results, which included: • Solvency II return on equity1,2,‡ of 14.3% (2018: 12.5%); • Growth in Solvency II net asset value2 per share, up 31 pence to 423 pence (2018: 392 pence); • Increased Solvency II capital surplus2 and Solvency II shareholder cover ratio2,‡ at £12.6 billion and 206%
respectively (2018: £12.0 billion and 204% respectively); • Group adjusted operating profit3,‡# up 6% to £3,184 million (2018: £3,004 million4); and • Strong growth in operating earnings per share3,5,‡#, up 8% to 60.5 pence (2018: 56.2 pence4).
The Board of Directors has declared a final dividend of 21.40 pence per share (2018: 20.75 pence). This results in a full year dividend for 2019 of 30.9 pence per share (2018: 30.0 pence), an increase of 3%.
Aviva has many positive attributes: high quality businesses, skilled and dedicated staff, a leading focus on sustainability and ESG and a large, loyal base of customers and intermediary partners. Our brand resonates with our customers and partners due to our track record of helping people to manage life’s uncertainties by saving for the future, drawing a secure income in retirement and insuring what matters most to them.
My goal is for Aviva’s portfolio of businesses to be best in class. We will achieve this through a relentless focus on the customer and commercial rigour as we execute our business plans and we will reallocate capital to maximise performance. In short, we will run Aviva better.
In 2019, our customer numbers were up 2% to 33.4 million and we improved growth in premiums and managed assets. There is much more to do, simplifying our business, reducing costs and navigating competitive markets to make Aviva a stronger, simpler and better company.
COVID-19 presents a new uncertainty in 2020. Our primary focus is the operational readiness and safety for our customers and staff, such that we continue to deliver on our promises. Our scale, diversity and the strength of our balance sheet allows us to meet short-term challenges.
Structure, leadership and culture
In 2019, we made a number of changes to optimise our organisational structure and leadership. These changes were necessary to simplify our ways of working, improve operational efficiency and resilience. We now have greater focus, commercial rigour and accountability throughout the organisation.
In the UK, we separated management of our life and general insurance businesses, and our digital operations have been integrated back into the businesses to improve efficiency and customer delivery. Globally, we have reorganised our portfolio of major markets and strategic investments into five divisions with clear alignment of business model. Our objective is to compete and win in our markets by providing great customer outcomes and excelling at the fundamentals.
Aviva’s leadership team has been strengthened and we have assembled a diverse and talented leadership group with proven success within their respective fields. With a mixture of internal promotions and external hires, my new team brings the expertise, ambition and focus required to grow our business profitably. The new team will help shape our culture, which remains focused on providing the highest standard of service and value for customers, maintaining leadership on environmental and social issues, while at the same time fostering greater commerciality, efficiency and accountability.
Progress against financial targets
At our capital markets day in November 2019, I outlined five key financial objectives that Aviva is targeting for 2022. Delivering these targets will provide a material enhancement in business performance and reinforce the sustainability of our progressive dividend policy and medium-term growth ambitions. In 2019, we made a strong start in pursuit of these objectives and we are on track to achieve our targets:
Return on equity1,2,‡ (RoE) – 2022 target of 12%: Aviva’s RoE was 14.3% in 2019, benefiting from favourable assumption changes. Meeting our 2022 ambition of a sustainable 12% RoE will require improved underlying returns that will be achieved through cost reductions, organic business growth and active capital allocation to higher returning segments.
Operating capital generation2,‡# (OCG) – targeting £7.5 billion in 2019-22 inclusive: In 2019, group OCG totalled £2.3 billion, representing approximately 30% of our four-year target.
Alternative Performance Measures continued
Aviva plc Preliminary announcement 2019 119
Overview Analysis of assets Other information
IFRS Income, expenses & capital
Spread margin The spread margin represents the return made on the Group’s annuity and other non-linked business, based on the expected investment return, less amounts credited to policyholders. While not a key performance metric of the Group, the spread margin is a useful indicator of the expected investment return arising on this business.
Underwriting margin The underwriting margin represents the release of reserves held to cover claims, surrenders and administrative expenses less the cost of actual claims and surrenders in the period.
Unit-linked margin The unit-linked margin represents the annual management charges on unit-linked business. This is an indicator of the return arising on this business.

Chief Executive Officer’s report continued
‡ Denotes Alternative Performance Measures (APMs) which are key performance indicators of the Group used to measure our performance and financial strength. Further details of this measure are included in the ‘Other information’ section of the Analyst Pack. # Denotes key performance indicators which are used by the Group to determine or modify remuneration. Further details of this measure are included in the ‘Other information’ section of the Analyst Pack. 1 Constant currency. 2 This is an Alternative Performance Measure (APM) which provides useful information to enhance the understanding of financial performance. Further details of this measure are included in the ‘Other information’ section of the Analyst Pack.
Aviva plc Preliminary Announcement 2019
Progress against financial targets (continued)
Cash inflows‡ to centre – targeting £8.5 billion to £9.0 billion in 2019-22 inclusive: Cash remittances‡# were £2.6 billion in 2019, representing approximately 30% of our four-year target.
Debt reduction – targeting £1.5 billion reduction in debt by 2022: In 2019, we repaid £0.2 billion of subordinated debt, which was the total amount maturing during the year. With debt maturities of £2.7 billion in the next three years and continued strength in centre liquidity levels and cash generation, we expect to achieve our target, resulting in lower debt leverage‡ and declining interest expense.
Operating expenses – targeting £300 million reduction in controllable costs‡ by 2022: Controllable costs were £3,939 million in 2019 (2018: £3,968 million). Within this, we achieved net savings of £72 million1 and incurred implementation costs of £59 million. We anticipate £150 million of savings (pre implementation costs) in our 2020 results, compared with our 2018 baseline.
Deliver great customer outcomes
At Aviva, delivering great customer outcomes is one of our strategic priorities. In 2019, our performance demonstrates that customers continue to choose Aviva to meet their savings, retirement and insurance needs. Across the Group, we have increased premium volumes and customer fund inflows. We have made further progress in service quality, with positive trends in net promoter scores, customer retention and resolving customer complaints.
Our response to natural catastrophes such as the recent storms in the UK showed Aviva at its best. We provided support to several thousand customers, responding quickly by helping fix damaged properties and using the latest technology to settle claims. We also identified vulnerable customers and worked with our network of suppliers to ensure these claims were given priority.
Natural catastrophes are happening with increased frequency around the world and sustainability is now a key focus for governments, corporates and the wider community. For many years, Aviva has been at the forefront of efforts to combat climate change. The products and services we provide are crucial in helping customers to prepare for, and respond to the challenges that a changing climate brings. We are also a leader in ESG, whether actively investing our customers’ savings, or managing their retirement income. Aviva has been carbon neutral since 2006, is a signatory to the UN sustainable development goals and is committed to being a net zero asset owner by 2050. ESG matters to our customers, and it matters to Aviva.
Excel at the fundamentals
We aim to excel at the fundamentals and our 2019 results show the progress we have made in running Aviva better.
In UK Life, we increased sales across our product suite. In annuities & equity release, our capability in longevity data analytics, asset origination and transaction structuring enabled us to grow new business volumes by 29% to £6.2 billion (2018: £4.8 billion). We delivered strong growth in bulk annuity sales, which included the first tranche (£1.7 billion) from Aviva’s own staff pension scheme. In protection, 2019 was more challenging. Whilst new business volumes increased 4% to £1.9 billion (2018: £1.8 billion), adverse experience and higher reinsurance costs contributed to a reduction in profitability. We responded to these challenges by increasing sophistication of our pricing, underwriting and customer segmentation models.
Across UK Savings & Retirement and Aviva Investors, we improved customer net inflows despite the uncertain backdrop weighing on investor sentiment. UK Savings and Retirement net inflows were £7.5 billion (2018: £6.8 billion) as we maintained our leading position in workplace pensions, winning significant new mandates and delivering strong client retention. We also continued to build momentum and increase share in the platform market. In asset management, investment performance has strengthened, with 84% of Aviva Investors’ funds beating benchmark over a twelve month time horizon, while third-party net inflows2 rose to positive £2.3 billion (2018: negative £0.1 billion). Although 2019 was a challenging year for profitability at Aviva Investors, with a lower opening asset position and reduced asset origination weighing on results, the significant improvement in investment performance and flows are a step in the right direction.
Alternative Performance Measures continued
Aviva plc Preliminary announcement 2019 119
Overview Analysis of assets Other information
IFRS Income, expenses & capital
Spread margin The spread margin represents the return made on the Group’s annuity and other non-linked business, based on the expected investment return, less amounts credited to policyholders. While not a key performance metric of the Group, the spread margin is a useful indicator of the expected investment return arising on this business.
Underwriting margin The underwriting margin represents the release of reserves held to cover claims, surrenders and administrative expenses less the cost of actual claims and surrenders in the period.
Unit-linked margin The unit-linked margin represents the annual management charges on unit-linked business. This is an indicator of the return arising on this business.

Chief Executive Officer’s report continued
‡ Denotes Alternative Performance Measures (APMs) which are key performance indicators of the Group used to measure our performance and financial strength. Further details of this measure are included in the ‘Other information’ section of the Analyst Pack. 1 During 2019 the Group adjusted operating profit APM has been revised and now includes the amortisation and impairment of internally generated intangible assets to better reflect the operational nature of these assets (see note B2(b)). Group
adjusted operating profit continues to exclude amortisation and impairment of intangible assets acquired in business combinations. Comparative amounts have been restated resulting in a reduction in the prior period Group adjusted operating profit of £112 million. There is no impact on profit before tax attributable to shareholders’ profit. Following the change in the definition of Group adjusted operating profit, COR, operating expenses and operating earnings per share have also been restated to include the amortisation and impairment of internally generated intangible assets. Comparative amounts have been restated resulting in a reduction in prior period COR of 0.6%, an increase in prior period operating expenses of £112 million and a reduction in prior period operating earnings per share of 2.2 pence.
2 This is an Alternative Performance Measure (APM) which provides useful information to enhance the understanding of financial performance. Further details of this measure are included in the ‘Other information’ section of the Analyst Pack.
Aviva plc Preliminary Announcement 2019
Excel at the fundamentals (continued)
In general insurance, net written premiums (NWP) increased 2% to £9.3 billion (2018: £9.1 billion). We have continued to gradually and deliberately shift our business mix, with NWP from commercial customers rising 7% in the UK and 17% in Canada. Our focus on providing superior service to customers and intermediaries in the SME and mid-market has supported growth in new client acquisition and attractive retention. Our general insurance combined operating ratio (COR) increased to 97.5% (2018: 97.2%1) though this included an additional £113 million of costs allocated to the general insurance business as a result of the realignment of our digital operations. Excluding the 1.2 percentage point impact from these costs, our COR would have been 96.3%. The key driver of improvement was Canada, where we successfully responded to challenges in the auto insurance market, resulting in a 5.3 percentage point improvement in COR to 97.8% (2018: 103.1%1).
Our life businesses in Europe and Asia also expanded their customer franchises in 2019, with new business volumes up 9% and 15% respectively and European net fund inflows3 remaining robust at £4.5 billion (2018: £4.2 billion). In France, in the face of significantly lower interest rates, we increased unit-linked new business volumes 46% through targeted campaigns and active engagement with our distribution partners. In Poland, we successfully launched a new protection product in the direct market and made a strong start in auto-enrolment, winning nearly 400 new corporate pension schemes covering more than 70,000 employees. In Singapore, we continued to invest in our leading financial advisor network, which provides customers with high levels of service and a wider array of product and provider choice compared with the traditional agency model.
An important element of our programme to run Aviva better is improving our efficiency. In June, we announced plans to reduce our controllable cost‡ base by £300 million per annum, net of inflation. This requires gross (pre-inflation) savings of approximately £500 million relative to our 2018 expense baseline of £4 billion. We have made good progress so far, achieving savings of £72 million in 2019 and laying the groundwork necessary to increase savings to approximately £150 million in 2020.
Invest in sustainable growth
There is no shortage of ambition at Aviva and we have continued to invest in sustainable growth. This investment has been both direct, through deploying capital to write new business, and indirect, to improve the quality and cost effectiveness of our customer propositions and further enhance our data and risk management capability.
In November, we announced plans for Aviva Investors and our UK savings businesses to form a combined business segment called Investments, Savings & Retirement (IS&R). Under the leadership of Euan Munro, IS&R will bring together Aviva’s global asset management capabilities with Aviva’s leading UK workplace pension and platform operations. In addition to the growth potential of each business, their alignment enables Aviva to provide customers with unique, comprehensive solutions from accumulation of pension wealth through to drawing a secure income in retirement. The combination of an ageing society and increased private provision for retirement make this an attractive long-term growth opportunity. The £7.5 billion of net in-flows2 in savings and retirement and £2.3 billion of third party net inflows in Aviva Investors demonstrates that Aviva has the capability and the customer franchise to capture this growth opportunity.
We continue to invest in digital and technology. The integration of our digital activities into our business units will facilitate expense savings as we scale back or stop some activities which are either duplicated or judged not to offer future economic returns. However, we are also aiming to improve the connectivity and co-ordination of digital with our core customer facing businesses. As a result, we are continuing to invest across the group in initiatives that reduce run costs, enhance IT resilience and ensure that our businesses are able to offer service to our customers and distribution partners that is fast, fair and efficient.
Alternative Performance Measures continued
Aviva plc Preliminary announcement 2019 119
Overview Analysis of assets Other information
IFRS Income, expenses & capital
Spread margin The spread margin represents the return made on the Group’s annuity and other non-linked business, based on the expected investment return, less amounts credited to policyholders. While not a key performance metric of the Group, the spread margin is a useful indicator of the expected investment return arising on this business.
Underwriting margin The underwriting margin represents the release of reserves held to cover claims, surrenders and administrative expenses less the cost of actual claims and surrenders in the period.
Unit-linked margin The unit-linked margin represents the annual management charges on unit-linked business. This is an indicator of the return arising on this business.

Chief Executive Officer’s report continued
Aviva plc Preliminary Announcement 2019
Looking ahead Aviva has made important structural changes and achieved good progress in pursuing our first goal of operational improvement. Our 2019 results showed evidence of our potential, with improved momentum on customer flows, assets and premiums, and a good start on delivering our financial targets.
My objective remains to run Aviva better. We will improve business performance, enhancing returns through disciplined execution on expenses and underwriting. We will focus capital and resources where we can achieve competitive advantage and strong returns. We will take robust action across the portfolio where our performance falls short or where we can see a better way of delivering value to our shareholders.
Our foundations are strong and we have the necessary ingredients to succeed. Our franchises are well regarded by customers and partners, our capital position and risk management capabilities provide a secure footing. We have a team of talented colleagues across the group who are passionate about building a better tomorrow for our customers and providing attractive returns for our shareholders.
Maurice Tulloch CEO
Alternative Performance Measures continued
Aviva plc Preliminary announcement 2019 119
Overview Analysis of assets Other information
IFRS Income, expenses & capital
Spread margin The spread margin represents the return made on the Group’s annuity and other non-linked business, based on the expected investment return, less amounts credited to policyholders. While not a key performance metric of the Group, the spread margin is a useful indicator of the expected investment return arising on this business.
Underwriting margin The underwriting margin represents the release of reserves held to cover claims, surrenders and administrative expenses less the cost of actual claims and surrenders in the period.
Unit-linked margin The unit-linked margin represents the annual management charges on unit-linked business. This is an indicator of the return arising on this business.

Chief Financial Officer’s report
‡ Denotes Alternative Performance Measures (APMs) which are key performance indicators of the Group used to measure our performance and financial strength. Further details of this measure are included in the ‘Other information’ section of the Analyst Pack. # Denotes key performance indicators which are used by the Group to determine or modify remuneration. Further details of this measure are included in the ‘Other information’ section of the Analyst Pack. 1 Group adjusted operating profit is a non-GAAP APM which is not bound by the requirements of IFRS. Further details of this measure are included in the ‘Other information’ section of the Analyst Pack. 2 During 2019 the Group adjusted operating profit APM has been revised and now includes the amortisation and impairment of internally generated intangible assets to better reflect the operational nature of these assets (see note B2(b)). Group
adjusted operating profit continues to exclude amortisation and impairment of intangible assets acquired in business combinations. Comparative amounts have been restated resulting in a reduction in the prior period Group adjusted operating profit of £112 million. There is no impact on profit before tax attributable to shareholders’ profit. Following the change in the definition of Group adjusted operating profit, COR, operating expenses and operating earnings per share have also been restated to include the amortisation and impairment of internally generated intangible assets. Comparative amounts have been restated resulting in an increase in prior period COR of 0.6%, an increase in prior period operating expenses of £112 million and a reduction in prior period operating earnings per share of 2.2 pence.
3 Includes Group centre, debt costs and other items not allocated to the markets. 4 The estimated Solvency II position represents the shareholder view only. See section 3 of the Overview for more details.
Aviva plc Preliminary Announcement 2019
Overview
In 2019, the external environment provided both positives and challenges. Economic growth was subdued across most developed economies and government bond yields fell sharply in the second half of the year, moving into negative territory in a number of European countries. However, equity markets rebounded and were supportive for asset values. The political backdrop remained a source of uncertainty, particularly in the UK, where the December general election weighed on confidence and activity across the economy.
Aviva is designed to perform whatever the external environment and made good operational progress in 2019, delivering increases in customer activity levels and profitability across our businesses. Group adjusted operating profit1,‡# increased 6% to £3,184 million (2018: £3,004 million2) while Solvency II return on equity3,4,‡ was 14.3% (2018: 12.5%), continuing to benefit from favourable assumption changes.
We also further strengthened our financial position. Our Solvency II capital surplus4 rose to £12.6 billion (2018: £12.0 billion), with an increase in the cover ratio4,‡# to 206% (2018: 204%). As planned, we reduced debt by £0.2 billion in 2019, leading to a reduction in our leverage ratio‡ to 31% (2018: 33%). Cash remittances‡# of £2.6 billion (2018: £3.1 billion) were again very strong. At the end of February 2020, our centre liquidity was £2.4 billion (February 2019: £1.6 billion).
Reflecting our operational momentum and strong financial fundamentals, the Board of Directors has declared a final dividend of 21.40 pence per share, resulting in a 3% increase in the full year dividend per share to 30.9 pence (2018: 30.0 pence).
Economic returns
At our capital markets day in November 2019, we outlined our intention to increase Aviva’s focus on economic performance in our financial communication. This reflects the importance of economic metrics in how we manage the business: the allocation of capital and other resources across the Group and the trading decisions we make each day. Economic returns ultimately support a sustainable dividend and our ability to invest to grow the company.
In 2019, Aviva generated equity own funds3,4 of £2.3 billion (2018: £2.0 billion) resulting in RoE3,4,‡ of 14.3% (2018: 12.5%). Operating capital generation (OCG)4,‡# was £2.3 billion (2018: £3.2 billion).
Our economic results continued to benefit from significant levels of longevity reserve reductions in our UK Life business, active balance sheet management and other modelling and assumption changes. As a result, net management actions added 6.2% to the Group return on equity (2018: 3.2%) and £0.8 billion to OCG (2018: £1.7 billion). In 2018, OCG also benefited from a number of actions such as model changes that reduced our solvency capital requirement (SCR).
We remain prudently reserved for life expectancy in our UK annuity portfolio, although in light of recent trends witnessed in 2019, we expect longevity reserve releases to be materially lower in future periods. As a result, while management actions are expected to make a positive contribution to capital generation and RoE over time, we reaffirm our guidance that this is likely to be at a much lower level than has been the case in 2018 and 2019.
On an underlying basis (excluding net management actions), return on equity was 8.1% (2018: 9.3%) and OCG was £1.4 billion (2018: £1.5 billion). Our results benefited from improved returns in general insurance, particularly from Canada, and a reduction in debt interest and corporate centre expenditure. However, this was offset by lower returns from our life businesses which were affected by the loss of temporary transitionals on new business, experience variances in the UK, and lower new business profitability in Europe due to record low interest rates.
To achieve our 12% RoE target in 2022, an increase in underlying economic returns is planned. This improvement will include lower costs, improved operating experience, higher new business profitability and prioritisation of capital to product and business segments offering superior returns.
Alternative Performance Measures continued
Aviva plc Preliminary announcement 2019 119
Overview Analysis of assets Other information
IFRS Income, expenses & capital
Spread margin The spread margin represents the return made on the Group’s annuity and other non-linked business, based on the expected investment return, less amounts credited to policyholders. While not a key performance metric of the Group, the spread margin is a useful indicator of the expected investment return arising on this business.
Underwriting margin The underwriting margin represents the release of reserves held to cover claims, surrenders and administrative expenses less the cost of actual claims and surrenders in the period.
Unit-linked margin The unit-linked margin represents the annual management charges on unit-linked business. This is an indicator of the return arising on this business.

Chief Financial Officer’s report continued
‡ Denotes Alternative Performance Measures (APMs) which are key performance indicators of the Group used to measure our performance and financial strength. Further details of this measure are included in the ‘Other information’ section of the Analyst Pack. # Denotes key performance indicators which are used by the Group to determine or modify remuneration. Further details of this measure are included in the ‘Other information’ section of the Analyst Pack. 1 Group adjusted operating profit is a non-GAAP APM which is not bound by the requirements of IFRS. Further details of this measure are included in the ‘Other information’ section of the Analyst Pack. 2 During 2019 the Group adjusted operating profit APM has been revised and now includes the amortisation and impairment of internally generated intangible assets to better reflect the operational nature of these assets (see note B2(b)). Group
adjusted operating profit continues to exclude amortisation and impairment of intangible assets acquired in business combinations. Comparative amounts have been restated resulting in a reduction in the prior period Group adjusted operating profit of £112 million. There is no impact on profit before tax attributable to shareholders’ profit. Following the change in the definition of Group adjusted operating profit, COR, operating expenses and operating earnings per share have also been restated to include the amortisation and impairment of internally generated intangible assets. Comparative amounts have been restated resulting in an increase in prior period COR of 0.6%, an increase in prior period operating expenses of £112 million and a reduction in prior period operating earnings per share of 2.2 pence.
3 This measure is derived from the Group adjusted operating profit APM. Further details of this measure are included in the ‘Other information’ section of the Analyst Pack. 4 The estimated Solvency II position represents the shareholder view only. See section 3 of the Overview for more details. 5 This is an Alternative Performance Measure (APM) which provides useful information to enhance the understanding of financial performance. Further details of this measure are included in the ‘Other information’ section of the Analyst Pack.
Aviva plc Preliminary Announcement 2019
Business performance review
Our operational progress in 2019 was reflected in improved IFRS results. Group adjusted operating profit1,‡# increased 6% to £3,184 million (2018: £3,004 million2), which in turn gave rise to 8% growth in operating earnings per share1,3,‡# to 60.5 pence (2018: 56.2 pence2). IFRS profit before tax increased to £3,374 million (2018: £2,129 million) helped by positive investment variances, and this led to basic EPS of 63.8 pence (2018: 38.2 pence).
In UK Life and Investments, Savings & Retirement, own funds generation4 was £1,314 million (2018: £1,663 million), giving rise to return on capital4,‡ of 9.5% (2018: 11.3%). The reduction in results was due to the loss of transitional benefits on new business, adverse experience variances related to persistency, expenses and challenges in the protection market, and lower operating profit from Aviva Investors where revenues were impacted by lower opening assets under management in higher margin propositions and divestment of our European indirect real estate business in 2018. Positive assumption changes related to longevity reserves of approximately £0.8 billion were partially offset by a £175 million provision in relation to a heritage pension product where certain pension policyholders may not have been adequately informed of switching options available to them. While financial results were lower in 2019, we achieved higher sales and customer net inflows5 across our life and savings businesses. This underpinned asset growth of 19% in long-term savings to £138 billion (2018: £116 billion), 9% in annuities & equity release to £67 billion (2018: £62 billion) and 5% in Aviva Investors to £346 billion (2018: £331 billion), supporting a positive outlook for future financial results in our UK Life and Savings segments.
General Insurance results improved in 2019, with own funds generation increasing to £628 million (2018: £532 million) and return on capital of 14.0% (2018: 11.7%). The improvement in results was principally driven by a recovery in profitability in Canada where pricing and underwriting actions we took in response to industry-wide challenges in the auto insurance market helped drive a 5.3 percentage point improvement in the combined operating ratio (COR)‡ to 97.8% (2018: 103.1%2). We are continuing to aim for a 96% or better COR in Canada in 2020. In the UK, reported COR in 2019 has been affected by higher costs following its incorporation of UK Digital during the year. Adjusting for these changes, our UK COR was up 0.6 percentage points to 97.9%, with solid results in commercial lines offset by weaker performance in personal lines. In Europe we maintained attractive profitability with a COR of 95.7% (2018: 93.5%2) despite adverse large loss experience. Weather had a favourable impact on our COR of 1.0 percentage point relative to long-term average (2018: 0.1% unfavourable) while prior year reserve development (PYD) had a favourable 1.7% impact (2018: 2.3% favourable).
In Europe Life, we have balanced long-term franchise value with the requirement to actively manage the current environment of very low, and in some cases, negative government bond yields. Own funds generation increased to £574 million (2018: £384 million) and included assumption changes of £181 million spread across our France, Italy and Ireland businesses. This in turn gave rise to an improvement in return on capital to 10.3% (2018: 6.9%). New business volumes (PVNBP) rose 9% to £13.8 billion (2018: £12.6 billion) demonstrating the strength of our distribution networks and customer appetite for our products. Strong volume growth was achieved in France (+32%) and Poland (+28%). However, the own funds contribution from new business declined to £167 million (2018: £253 million) due to low yields. We will continue to address the challenges from low yields through proactive balance sheet management and a constructive approach to distribution and product mix management.
In Asia Life, own funds generation increased 30% to £187 million (2018: £144 million) and return on capital rose to 12.7% (2018: 9.7%). Our businesses in Asia have continued to grow profitably in our larger markets while successfully narrowing losses elsewhere. New business volumes from our continuing operations in Asia increased 22% to £2.7 billion (2018: £2.2 billion) with double digit growth achieved in Singapore and China. This gave rise to VNB in Asia of £210 million (2018: £194 million), representing growth of 9%.
Corporate centre costs reduced to £183 million (2018: £216 million) as we commenced initiatives aimed at streamlining our head office and reducing project spending, while debt interest expense fell to £255 million (2018: £280 million). The loss from other operations narrowed to £26 million (2018: £212 million loss) primarily as a result of digital and other costs being realigned to our business units.
Total operating expenses were £4,119 million (2018: £4,138 million) with reductions in controllable costs‡ partly offset by an increase in levies and premium taxes to £180 million (2018: £170 million). Controllable costs fell to £3,939 million (2018: £3,968 million).
Savings of £72 million1 were mainly derived from our lean group centre initiative and reduced project spend, although we reinvested some of these savings in other areas including IT modernisation and proposition development. Implementation costs associated with the cost reduction programme and our spend on IFRS 17 was £59 million
Alternative Performance Measures continued
Aviva plc Preliminary announcement 2019 119
Overview Analysis of assets Other information
IFRS Income, expenses & capital
Spread margin The spread margin represents the return made on the Group’s annuity and other non-linked business, based on the expected investment return, less amounts credited to policyholders. While not a key performance metric of the Group, the spread margin is a useful indicator of the expected investment return arising on this business.
Underwriting margin The underwriting margin represents the release of reserves held to cover claims, surrenders and administrative expenses less the cost of actual claims and surrenders in the period.
Unit-linked margin The unit-linked margin represents the annual management charges on unit-linked business. This is an indicator of the return arising on this business.

Chief Financial Officer’s report continued
‡ Denotes Alternative Performance Measures (APMs) which are key performance indicators of the Group used to measure our performance and financial strength. Further details of this measure are included in the ‘Other information’ section of the Analyst Pack. # Denotes key performance indicators which are used by the Group to determine or modify remuneration. Further details of this measure are included in the ‘Other information’ section of the Analyst Pack. 1 Constant currency. 2 The estimated Solvency II position represents the shareholder view only. See section 3 of the Overview for more details. 3 Includes Group centre, debt costs and other items not allocated to the markets. 4 Group adjusted operating profit is a non-GAAP APM which is not bound by the requirements of IFRS. Further details of this measure are included in the ‘Other information’ section of the Analyst Pack. 5 Regulation was introduced in France that allows French insurers to place the Provision pour Participation aux Excedents (PPE) into Solvency II own funds. The PPE has been included in the France local regulatory own funds in 2019 but it is not
included in the Group regulatory own funds.
Aviva plc Preliminary Announcement 2019
Capital & liquidity At the end of 2019, our Solvency II surplus2 was £12.6 billion (2018: £12.0 billion), giving rise to cover ratio2,‡# of 206% (2018: 204%).
All of our principal operating entities are well capitalised and operating within their respective normal working ranges. In France, we added approximately 70 percentage points of solvency cover in the second half of 2019, including a 20 percentage point benefit from PPE5, following changes to regulations. This, combined with our active management of capital, including the purchase of interest rate and other hedges, gives us headroom to manage volatility from falling bond yields.
Solvency II net asset value (NAV)2 per share rose 31 pence to 423 pence (2018: 392 pence). During 2019, we redeemed £0.2 billion of hybrid capital as part of our overall £1.5 billion debt reduction target. Together with the increase in Solvency II own funds2,3, this has led to a reduction in our leverage ratio‡ to 31% (2018: 33%).
Cash remittances‡# were once more very strong in 2019 at £2.6 billion (2018: £3.1 billion). This represents approximately 30% of our four-year target for cash inflows to centre (of £8.5-£9.0 billion), underpinning our confidence in meeting this objective. At the end of February 2020, centre liquidity was £2.4 billion (February 2019: £1.6 billion).
Dividend Aviva has a progressive dividend policy, which means we aim to maintain or grow the dividend. In light of our 2019 performance and the continued strength of our capital and liquidity, the Board has declared a final dividend of 21.40 pence per share (2018: 20.75 pence), bringing the full year dividend for 2019 to 30.9 pence (2018: 30.0 pence).
Looking ahead As CFO of Aviva, my focus is on growing value of the company safely, by increasing sustainable return on equity2,3,‡, improving growth and avoiding volatility through prudent and proactive financial management. Our 2019 results show we are on the right path and I envisage significant upside in performance and value from delivering further progress.
So far 2020 has brought significant uncertainty, compounded by COVID-19, in relation to macro trends including the level of interest rates, investment market volatility and foreign exchange. However, we have a strong and resilient balance sheet that is designed to withstand volatility.
In the last three years, operating profit4,‡# and OCG2,‡# have benefited from large assumption changes and other actions, most notably a reduction of longevity reserves. We expect our results to benefit from some similar actions over the medium term, but from 2020, we expect this to be in a range of zero to £200 million per annum for IFRS and c.£200 million per annum for OCG, as we highlighted at our capital markets day in November.
We have set out our targets to improve returns, reduce debt leverage and enhance sustainable capital generation while continuing to invest wisely to grow the company. We are committed to achieving these targets, and furthermore, we expect to make progress in 2020, with an increase in underlying OCG.
Jason Windsor Chief Financial Officer
Alternative Performance Measures continued
Aviva plc Preliminary announcement 2019 119
Overview Analysis of assets Other information
IFRS Income, expenses & capital
Spread margin The spread margin represents the return made on the Group’s annuity and other non-linked business, based on the expected investment return, less amounts credited to policyholders. While not a key performance metric of the Group, the spread margin is a useful indicator of the expected investment return arising on this business.
Underwriting margin The underwriting margin represents the release of reserves held to cover claims, surrenders and administrative expenses less the cost of actual claims and surrenders in the period.
Unit-linked margin The unit-linked margin represents the annual management charges on unit-linked business. This is an indicator of the return arising on this business.

Notes to editors
Aviva plc Preliminary Announcement 2019
Notes to editors All comparators are for the full year 2018 position unless otherwise stated.
Income and expenses of foreign entities are translated at average exchange rates while their assets and liabilities are translated at the closing rates on 31 December 2019. The average rates employed in this announcement are 1 euro = £0.88 (2018: 1 euro = £0.88) and CAD$1 = £0.59 (2018: CAD$1 = £0.58).
Growth rates in the press release have been provided in sterling terms unless stated otherwise. The following supplement presents this information on both a sterling and constant currency basis.
Cautionary statements: This should be read in conjunction with the documents distributed by Aviva plc (the “Company” or “Aviva”) through the Regulatory News Service (RNS). This announcement contains, and we may make other verbal or written “forward-looking statements” with respect to certain of Aviva’s plans and current goals and expectations relating to future financial condition, performance, results, strategic initiatives and objectives. Statements containing the words “believes”, “intends”, “expects”, “projects”, “plans”, “will,” “seeks”, “aims”, “may”, “could”, “outlook”, “likely”, “target”, “goal”, “guidance”, “trends”, “future”, “estimates”, “potential” and “anticipates”, and words of similar meaning, are forward-looking. By their nature, all forward-looking statements involve risk and uncertainty. Accordingly, there are or will be important factors that could cause actual results to differ materially from those indicated in these statements. Aviva believes factors that could cause actual results to differ materially from those indicated in forward-looking statements in the announcement include, but are not limited to: the impact of ongoing difficult conditions in the global financial markets and the economy generally; the impact of simplifying our operating structure and activities; the impact of various local and international political, regulatory and economic conditions; market developments and government actions (including those arising from the outcome of the negotiations on the future economic relationship between the UK and the EU); the effect of credit spread volatility on the net unrealised value of the investment portfolio; the effect of losses due to defaults by counterparties, including potential sovereign debt defaults or restructurings, on the value of our investments; changes in interest rates that may cause policyholders to surrender their contracts, reduce the value of our portfolio and impact our asset and liability matching; the impact of changes in short or long-term inflation; the impact of changes in equity or property prices on our investment portfolio; fluctuations in currency exchange rates; the effect of market fluctuations on the value of options and guarantees embedded in some of our life insurance products and the value of the assets backing their reserves; the amount of allowances and impairments taken on our investments; the effect of adverse capital and credit market conditions on our ability to meet liquidity needs and our access to capital; changes in, or restrictions on, our ability to initiate capital management initiatives; changes in or inaccuracy of assumptions in pricing and reserving for insurance business (particularly with regard to mortality and morbidity trends, lapse rates and policy renewal rates), longevity and endowments; a cyclical downturn of the insurance industry; the impact of natural and man-made catastrophic events (including the impact of COVID-19) on our
business activities and results of operations; our reliance on information and technology and third-party service providers for our operations and systems; the inability of reinsurers to meet obligations or unavailability of reinsurance coverage; increased competition in the UK and in other countries where we have significant operations; the impact of actual experience differing from estimates used in valuing and amortising deferred acquisition costs (“DAC”) and acquired value of in-force business (“AVIF”); the impact of recognising an impairment of our goodwill or intangibles with indefinite lives; changes in valuation methodologies, estimates and assumptions used in the valuation of investment securities; the effect of legal proceedings and regulatory investigations; the impact of operational risks, including inadequate or failed internal and external processes, systems and human error or from external events (including cyber attack); risks associated with arrangements with third parties, including joint ventures; our reliance on third-party distribution channels to deliver our products; funding risks associated with our participation in defined benefit staff pension schemes; the failure to attract or retain the necessary key personnel; the effect of systems errors or regulatory changes on the calculation of unit prices or deduction of charges for our unit-linked products that may require retrospective compensation to our customers; the effect of fluctuations in share price as a result of general market conditions or otherwise; the effect of simplifying our operating structure and activities; the effect of a decline in any of our ratings by rating agencies on our standing among customers, broker-dealers, agents, wholesalers and other distributors of our products and services; changes to our brand and reputation; changes in government regulations or tax laws in jurisdictions where we conduct business, including decreased demand for annuities in the UK due to changes in UK law; the inability to protect our intellectual property; the effect of undisclosed liabilities, integration issues and other risks associated with our acquisitions; and the timing/regulatory approval impact, integration risk and other uncertainties, such as non-realisation of expected benefits or diversion of management attention and other resources, relating to announced acquisitions and pending disposals and relating to future acquisitions, combinations or disposals within relevant industries; the policies, decisions and actions of government or regulatory authorities in the UK, the EU, the US or elsewhere, including the implementation of key legislation and regulation. For a more detailed description of these risks, uncertainties and other factors, please see ‘Other information – Shareholder Information – Risks relating to our business’ in Aviva’s most recent Annual Report. Aviva undertakes no obligation to update the forward-looking statements in this announcement or any other forward-looking statements we may make. Forward-looking statements in this presentation are current only as of the date on which such statements are made.
Aviva plc is a company registered in England No. 2468686.
Registered office
St Helen's 1 Undershaft London EC3P 3DQ
Contacts
Investor contacts Media contacts Timings
Chris Esson +44 (0)20 7662 8115 Diane Michelberger +44 (0)20 7662 0911
Andrew Reid +44 (0)20 7662 3131 Sarah Swailes +44 (0)20 7662 6700
Presentation slides: 07:00 hrs GMT www.aviva.com Real time media conference call: 07:45 hrs & 11:00 GMT Analyst presentation: 0900 hrs GMT Live webcast: 0900hrs GMT https://www.aviva.com/
Alternative Performance Measures continued
Aviva plc Preliminary announcement 2019 119
Overview Analysis of assets Other information
IFRS Income, expenses & capital
Spread margin The spread margin represents the return made on the Group’s annuity and other non-linked business, based on the expected investment return, less amounts credited to policyholders. While not a key performance metric of the Group, the spread margin is a useful indicator of the expected investment return arising on this business.
Underwriting margin The underwriting margin represents the release of reserves held to cover claims, surrenders and administrative expenses less the cost of actual claims and surrenders in the period.
Unit-linked margin The unit-linked margin represents the annual management charges on unit-linked business. This is an indicator of the return arising on this business.

Aviva plc Preliminary announcement 2019 01
Overview Analysis of assets Other information
IFRS Income, expenses & capital
Contents
In this section
Overview Page Key financial metrics 02 1 Solvency II return on equity 03 2 Solvency II capital and cash 04 i Operating capital generation: Solvency II basis 04 ii Solvency II future surplus emergence 05 iii Cash remittances 06 iv Centre liquidity 06 3 Solvency II position 07 i Solvency II position (shareholder view) 07 ii Movement in Solvency II surplus 08 iii Diversified SCR analysis 09 iv Solvency II sensitivities 10 v Solvency II net asset value 11 vi Solvency II regulatory own funds and debt leverage 11 4 Controllable costs 12 5 Profit and earnings per share 13 6 Divisional performance 14 i UK Life and Investments, Savings & Retirement 14 ii General Insurance 18 iii Europe Life 23 iv Asia Life 25 7 Life business profit drivers 27 Financial supplement 28 A Income & expenses and IFRS capital 29 B IFRS financial statements and notes 38 C Analysis of assets 93 Other information 110 Alternative Performance Measures 111
As a reminder Throughout this report we use a range of financial metrics to measure our performance and financial strength. These metrics include Alternative Performance Measures (APMs), which are non-GAAP measures that are not bound by the requirements of IFRS and Solvency II. Further guidance in respect of the APM’s used by the Group, including a reconciliation to the financial statements (where possible), can be found within the Other Information section.
At our capital markets day in November 2019 we announced robust financial targets focussed on economic value and that we have simplified our operating model into five new business divisions (Investments, Savings & Retirement; UK Life; General Insurance; Europe Life; and Asia Life) from 2020. Investments, Savings & Retirement will bring together Aviva Investors and the UK Savings & Retirement business which is currently reported within UK Life. General Insurance will include our Europe and Asia general insurance operations as well as UK General Insurance and our Canadian general insurance business. Europe Life and Asia Life will only include our Europe and Asia life and health businesses. In the Overview section of this report, our 2019 performance against our new targets has been presented having regard to the new divisions. In section 6.i, UK Life and Investments, Savings & Retirement have been presented together for both the Solvency II operating capital generation and Solvency II return on capital metrics. This is consistent with the targets presented at the capital markets day. Other key performance indicators (KPIs) have been presented separately for UK Life and Aviva Investors within section 6.i. Sections 6.ii to 6.iv set out the performance of General Insurance, Europe Life and Asia Life respectively. In the 2019 Annual Report and Accounts (including IFRS financial statements), we continue to report the results of our businesses by market (UK Life; Aviva Investors; UK General Insurance; Canada; Europe and Asia) on the basis they were managed in 2019. Section A of the financial supplement in this report includes a reconciliation between Group adjusted operating profit as presented in the Overview (section 6 – Divisional performance) to Group adjusted operating profit as presented in B6(a) Segmental information. All references to ‘Operating profit’ represent ‘Group adjusted operating profit’.
# symbol denotes key financial performance indicators used as a base to determine or modify remuneration. ‡ denotes APMs which are key performance indicators. Following a review of the Group’s APMs in 2019, we have made certain changes to ensure that they remain relevant and useful to shareholders. These changes are outlined within the Other Information section. All percentages, including currency movements, are calculated on unrounded numbers so minor rounding differences may exist. A glossary explaining key terms used in this report is available on www.aviva.com/glossary

Key financial metrics
Aviva plc Preliminary announcement 2019 02
Overview Analysis of assets Other information
IFRS Income, expenses & capital
Profit
2019
£m
Restated1
2018 £m
Sterling % change
Operating profit2,‡# 3,184 3,004 6% Operating earnings per share2,3‡# 60.5p 56.2p 8% IFRS profit before tax attributable to shareholders’ profits 3,374 2,129 58% Basic earnings per share 63.8p 38.2p 67%
Capital Position
31 December 2019
31 December 2018 Change
Estimated shareholder Solvency II cover ratio4,‡# 206% 204% 2pp Estimated Solvency II surplus4 £12.6bn £12.0bn 5% Solvency II net asset value per share4 423p 392p 8% Solvency II debt leverage‡ 31% 33% (2)pp
Dividend 2019 2018
Sterling % change
Final dividend per share 21.40p 20.75p 3% Total dividend per share 30.90p 30.00p 3%
Solvency II basis: Operating capital generation (OCG)‡# and Cash remittances‡# Solvency II Operating capital generation Cash remittances
2019
£m 2018
£m Sterling %
change 2019
£m 2018
£m Change
Group 2,259 3,198 (29)% 2,597 3,137 (17)%
Solvency II basis: Operating own funds generation and Return on capital/equity‡ Solvency II Operating own funds generation Solvency II Return on capital/equity
2019
£m 2018
£m Sterling %
change 2019
% 2018
% Change
UK Life and Investments, Savings & Retirement 1,314 1,663 (21)% 9.5% 11.3% (1.8)pp General Insurance 628 532 18% 14.0% 11.7% 2.3pp Europe Life 574 384 50% 10.3% 6.9% 3.4pp Asia Life 187 144 30% 12.7% 9.7% 3.0pp Group5 2,257 2,022 12% 14.3% 12.5% 1.8pp
Expenses
2019
£m
Restated1 2018
£m Sterling %
change
Operating expenses‡ 4,119 4,138 — Controllable costs‡ 3,939 3,968 (1)%
Value of new business: Adjusted Solvency II basis (VNB)‡ and Present value of new business premiums (PVNBP)
VNB PVNBP
2019
£m 2018
£m Sterling %
change 2019
£m 2018
£m Sterling %
change
UK Life 592 481 23% 27,570 23,946 15% Europe Life 414 517 (20)% 13,772 12,641 9% Asia Life 206 189 9% 3,057 2,656 15% Other 12 15 (19)% 1,266 1,520 (17)% Total 1,224 1,202 2% 45,665 40,763 12%
General insurance combined operating ratio (COR)‡ and Net written premiums (NWP)
COR NWP
2019 Restated1
2018 Change 2019 2018 Change
United Kingdom 97.9% 94.6% 3.3pp 4,218 4,193 1% Canada 97.8% 103.1% (5.3)pp 3,061 2,928 5% Europe 95.7% 93.5% 2.2pp 2,017 1,985 2%
Group6 97.5% 97.2% 0.3pp 9,309 9,114 2% ‡ Denotes Alternative Performance Measures (APMs) which are key performance indicators of the Group. Further details of this measure are included in the ‘Other information’ section of the Analyst Pack. # Denotes key performance indicators which are used by the Group to determine or modify remuneration. Further details of this measure are included in the ‘Other information’ section of the Analyst Pack. 1 During 2019 the Group adjusted operating profit APM has been revised and now includes the amortisation and impairment of internally generated intangible assets to better reflect the operational nature of these assets (see
note B2(b)). Group adjusted operating profit continues to exclude amortisation and impairment of intangible assets acquired in business combinations. Comparative amounts have been restated resulting in a reduction in the prior period Group adjusted operating profit of £112 million. There is no impact on profit before tax attributable to shareholders’ profit. Following the change in the definition of Group adjusted operating profit, COR, operating expenses and operating earnings per share have also been restated to include the amortisation and impairment of internally generated intangible assets. Comparative amounts have been restated resulting in an increase in prior period COR of 0.6%, an increase in prior period operating expenses of £112 million and a reduction in prior period operating earnings per share of 2.2 pence.
2 Group adjusted operating profit is a non-GAAP APM which is not bound by the requirements of IFRS. Further details of this measure are included in the ‘Other information’ section of the Analyst Pack. 3 This measure is derived from the Group adjusted operating profit APM. Further details of this measure are included in the ‘Other information’ section of the Analyst Pack. 4 The estimated Solvency II position represents the shareholder view only. See section 3 for more details. 5 Includes Group centre, debt costs and other items not allocated to the markets. 6 Group includes Asia & Other net written premiums of £13 million (2018: £8 million).

Solvency II return on equity
Aviva plc Preliminary announcement 2019 03
Overview Analysis of assets Other information
IFRS Income, expenses & capital
1 – Solvency II return on capital/equity‡ At our Capital Markets Day in November 2019, we announced robust financial targets focused on economic value, to measure our progress in meeting our key strategic initiatives. Solvency II return on capital / equity was introduced to measure return generated on shareholder capital at business division and Group level and is used by the Group to assess performance and growth, as we look to deliver long-term value for our shareholders.
Operating own funds generation
2019
New business (life)
£m
Existing business (life)
£m
Non-life capital
generation £m
Other1 £m
Total £m
Opening own funds
£m
Return on capital/equity
%
UK Life and Investments, Savings & Retirement 381 194 70 669 1,314 13,835 9.5% General Insurance — — 548 80 628 4,498 14.0% Europe Life 167 240 — 167 574 5,548 10.3% Asia Life 111 57 — 19 187 1,470 12.7% Group centre costs and Other — 16 (187) 9 (162) (1,800) n/a
Solvency II return on capital (unlevered) at 31 December 659 507 431 944 2,541 23,551 10.8% Less: Senior debt (12) — — Subordinated debt (272) (6,979) —
Solvency II operating own funds generation at 31 December 2,257 Direct capital instrument and Tier 1 notes (34) (731) — Preference shares2 (38) (450) — Net deferred tax assets — (95) —
Solvency II return on equity‡ at 31 December 2,185 15,296 14.3% Less: Management actions and other1 (944) — (6.2)%
Solvency II return on equity (excl. management actions) 1,241 15,296 8.1% 1 Other includes the impact of capital actions and non-economic assumption changes. 2 Preference shares includes £21 million of dividends and £250 million of capital in respect of General Accident plc.
Operating own funds generation
2018
New business (life)
£m
Existing business (life)
£m
Non-life capital
generation £m
Other1
£m Total
£m
Opening own funds
£m
Return on capital/equity
%
UK Life and Investments, Savings & Retirement 347 472 111 733 1,663 14,689 11.3% General Insurance — — 532 — 532 4,535 11.7% Europe Life 253 256 — (125) 384 5,539 6.9% Asia Life 89 76 — (21) 144 1,477 9.7% Group centre costs and Other — 31 (344) (90) (403) (1,503) n/a Solvency II return on capital (unlevered) at 31 December 689 835 299 497 2,320 24,737 9.4% Less: Senior debt (3) — — Subordinated debt (295) (7,922) —
Solvency II operating own funds generation at 31 December 2,022 Direct capital instrument and Tier 1 notes (36) (731) — Preference shares2 (38) (450) — Net deferred tax assets — (84) —
Solvency II return on equity‡ at 31 December 1,948 15,550 12.5% Less: Management actions and other1 (497) — (3.2)%
Solvency II return on equity (excl. management actions) 1,451 15,550 9.3% 1 Other includes the impact of capital actions and non-economic assumption changes. 2 Preference shares includes £21 million of dividends and £250 million of capital in respect of General Accident plc.
In line with targets presented at Capital Markets Day, we have presented a combined Solvency II return on capital for the UK Life and Investments, Savings & Retirement business divisions.
Solvency II return on equity has increased by 1.8pp to 14.3% over 2019 (2018: 12.5%) mainly driven by: • In UK Life and Investments, Savings & Retirement, overall return on capital has reduced by 1.8pp to 9.5% largely due to adverse experience
on protection business and no benefit from transitional relief on new business. In 2018, new business written contributed to the calculation of transitional measures (in line with clarification issued by the PRA since 2017) but it is no longer applicable to the Group in 2019.
• In the General Insurance business division, return on capital increased by 2.3pp to 14.0% driven by Canada, where benefits from the extensive profit remediation plan put in place towards the end of 2017 are materialising.
• In the Europe Life business division, return on capital has increased by 3.4pp to 10.3%. This was primarily driven by modelling and assumption changes in Italy which are partly offset by a reduction from new business in France and Italy due to the impact of lower interest rates.

Solvency II capital and cash
Aviva plc Preliminary announcement 2019 04
Overview Analysis of assets Other information
IFRS Income, expenses & capital
2 – Solvency II capital and cash 2.i – Operating capital generation: Solvency II basis‡# Solvency II operating capital generation (OCG) measures the amount of Solvency II capital the Group generates from operating activities. Capital generated enhances Solvency II surplus which can be used to support sustainable cash remittances from our business, which in turn, supports the Group’s progressive dividend as well as funding investments that provide sustainable growth.
Operating capital generation‡# Of which:
2019 £m Impact of new business (life)
Earnings from existing
business (life)
Non-life capital
generation Other
OCG1 Total OCG
Own funds OCG
SCR OCG
UK Life and Investments, Savings & Retirement (45) 814 90 401 1,260 1,245 15 General Insurance — — 615 (41) 574 628 (54) Europe Life (189) 515 — 428 754 574 180 Asia Life (7) 64 — 3 60 187 (127)
Total market Solvency II operating capital generation (241) 1,393 705 791 2,648 2,634 14
Group centre, debt costs and Other — (5) (419) 35 (389) (377) (12)
Total Group Solvency II operating capital generation (241) 1,388 286 826 2,259 2,257 2 1 Other includes the impact of capital actions and non-economic assumption changes.
Operating capital generation‡# Of which:
2018 £m Impact of new business (life)
Earnings from existing
business (life) Non-life capital
generation Other
OCG1 Total OCG
Own funds OCG
SCR OCG
UK Life and Investments, Savings & Retirement (116) 1,096 126 841 1,947 1,606 341 General Insurance — — 647 — 647 532 115 Europe Life (69) 446 — 347 724 384 340 Asia Life 2 64 — (11) 55 144 (89) Total market Solvency II operating capital generation (183) 1,606 773 1,177 3,373 2,666 707
Group centre, debt costs and Other — (14) (717) 556 (175) (644) 469
Total Group Solvency II operating capital generation (183) 1,592 56 1,733 3,198 2,022 1,176 1 Other includes the impact of capital actions and non-economic assumption changes.
Solvency II OCG was £2,259 million for 2019 (2018: £3,198 million).
The UK Life and Investments, Savings & Retirement OCG has reduced by £687 million to £1,260 million. This is mainly due to adverse experience on the protection business, no benefit from the loss of transitional relief of new business and a reduction in Other OCG, partially offset by new business strain which has reduced over the year due to reinsurance actions taken even though volumes increased. In 2019, Other OCG includes the beneficial impact of longevity assumption changes which is partially offset by other non-economic assumption changes while 2018 primarily included the beneficial impact of both longevity assumption and other non-economic assumption changes.
The General Insurance OCG reduced by £73 million to £574 million. In Canada, there was an increase of £118 million as benefits from the extensive profit remediation plan put in place towards the end of 2017 are materialising. This is more than offset in the UK, where there has been a reduction of £151 million, primarily due to the alignment of UK digital business costs within the UK General Insurance business and continued investment in our IT infrastructure. Alignment of the UK digital business costs has resulted in an increase in the Solvency Capital Requirement (SCR) due to differential capital treatment for insurance and non-insurance entities.
The Europe Life OCG has increased by £30 million to £754 million as increases in Other OCG and returns on existing business have been partially offset by the increase in new business strain as a result of the low interest rate environment. In 2019, Other OCG includes the beneficial impact of modelling and assumption changes in Italy as well as increased hedging in France, while other OCG during 2018 was due to assumption changes and a benefit arising from the transfer of pensions business into a supplementary occupational pension fund (FRPS) in France.
Group centre, debt costs and Other has reduced by £214 million to £(389) million. There has been an increase in OCG due to the reduction of costs as a result of the alignment of UK digital business in UK General Insurance and UK Life and a reduction in programme spend at Group Centre. This has been offset by a reduction in Other OCG as 2018 included the benefit of a model change to vary the volatility adjustment (VA) on France business in the Group SCR.

Solvency II capital and cash continued
Aviva plc Preliminary announcement 2019 05
Overview Analysis of assets Other information
IFRS Income, expenses & capital
2.ii – Solvency II future surplus emergence
Emergence of future profits and release of Solvency II capital requirements – life business (undiscounted)
Total 2019 £bn
Total 2018 £bn
Year 1 1.5 1.4 Year 2 1.4 1.3 Year 3 1.3 1.1 Year 4 1.2 1.0 Year 5 1.1 1.0 Year 6 1.0 0.9 Year 7 0.9 0.8 Year 8 0.8 0.8 Year 9 0.7 0.7 Year 10 0.7 0.7 Year 11-15 3.5 3.4 Year 16-20 2.9 3.3 Year 20+ 7.2 8.2
Total net of non-controlling interests 24.2 24.6
The table above shows the expected future emergence of Solvency II surplus from the existing long-term in-force life business. It has been determined in line with previous periods.
For business subject to short contract boundaries under Solvency II, allowance has been made for the impact of renewal premiums as and when they are expected to occur. The cash flows have been split annually for the first ten years followed by five-year tranches thereafter.
The projected surplus, which is primarily expected to arise from the release of risk margin (net of transitional measures) and solvency capital requirement as the business runs off over time, is expected to emerge through OCG in future years.
The projection is a static analysis as at a point in time and hence it does not include future new business or the potential impact of active management of the business (for example, active management of market, demographic and expense risk through investment, hedging, risk transfer, operational risk and expense management), which may affect the actual amount of OCG earned from existing business in future periods.
Total cash flows have reduced by £0.4 billion to £24.2 billion over 2019 (2018: £24.6 billion). The reduction is primarily driven by the strengthening of Sterling against the Euro over 2019.

Solvency II capital and cash continued
Aviva plc Preliminary announcement 2019 06
Overview Analysis of assets Other information
IFRS Income, expenses & capital
2.iii – Cash remittances‡# Sustainable cash remittances to the Group from our businesses are a key financial priority. The table below reflects actual remittances received by the Group from our businesses, comprising dividends and interest on internal loans. Cash remittances are eliminated on consolidation and hence are not directly reconcilable to the Group’s IFRS statement of cash flows. Details of cash remittances are disclosed within the respective business division performance disclosures in sections 6.i to 6.iv.
2019
£m 2018
£m
UK Life and Investments, Savings & Retirement UK Life (Including Savings & Retirement)1 1,387 2,152 Aviva Investors 86 92
General Insurance1,2 584 536 Europe Life 414 336 Asia Life 51 6 Other 75 15
Total 2,597 3,137 1 We use a wholly-owned, UK domiciled reinsurance subsidiary for internal capital and cash management purposes. Some remittances otherwise attributable to the operating businesses arise from this internal reinsurance vehicle. 2 2019 General Insurance cash remittances include £83 million (2018: £331 million) received from UK General Insurance, £nil (2018: £17 million) received from Ireland and £141 million (2018: £nil) received from Canada in February
2020 in respect of 2019 activity.
UK Life includes a special remittance of £500 million (2018: £1,250 million), and in 2019 General Insurance and Europe Life include special remittances from Italy of £65 million (2018: £nil) and £107 million (2018: £nil) respectively following the disposal of Avipop in 2018. 2019 remittances from Europe Life include remittances from France of £141 million (2018: £176 million), which are shown after adjusting for a capital injection of £139 million (2018: £nil), as the net amount more appropriately reflects the overall remittances received from France during the year. Other includes excess cash remitted to Group on the winding down of Aviva Re.
2.iv – Centre liquidity Centre liquidity comprises cash and liquid assets. Excess centre cash flow represents cash remitted by our business divisions to the Group centre less central operating expenses and debt financing costs. It is an important measure of the cash that is available to pay dividends, reduce debt or invest back into our business divisions.
2019
£m 2018
£m
Cash remitted to Group 2,597 3,137 External interest paid (456) (507) Internal interest paid (58) (47) Central spend (115) (258) Other operating cash flows1 236 112
Excess centre cash flow 2,204 2,437 Ordinary dividend (1,184) (1,128) Share buy back — (600) Net reduction in borrowings (191) (948) Other non-operating cash flows2 (35) (217)
Movement in centre liquidity 794 (456)
Centre liquidity as at end of February 2,368 1,574 1 Other operating cash flows include central investment income and one-off group tax relief payments. 2 Other non-operating cash flows include capital injections, advances and repayments of internal debt and other investment cash flows. Capital injections do not include the capital injection to France Life of £139 million in 2019
(2018: £nil), which is included within cash remitted to Group as it more appropriately reflects the overall remittances received from France Life during the year.
The increase of £794 million in centre liquidity is primarily driven by lower debt repayments and no share buy back in 2019, offset by lower cash remitted to Group.

Solvency II position
Aviva plc Preliminary announcement 2019 07
Overview Analysis of assets Other information
IFRS Income, expenses & capital
3 – Solvency II position 3.i – Solvency II position (shareholder view)
Shareholder view 2019
£m 2018
£m
Own funds 24,548 23,551 Solvency capital requirement (11,910) (11,569)
Estimated Solvency II surplus at 31 December 12,638 11,982
Estimated Solvency II shareholder cover ratio‡# 206% 204%
The estimated Solvency II shareholder cover ratio is 206% at 31 December 2019. The Solvency II position disclosed is based on a ‘shareholder view’. The shareholder view is considered by management to be more representative of the shareholders’ risk exposure and the Group’s ability to cover the solvency capital requirement with eligible own funds and aligns with management’s approach to dynamically manage its capital position. In arriving at the shareholder position, the following adjustments are typically made to the regulatory Solvency II position: • The contribution to the Group’s SCR and own funds of the most material fully ring fenced with-profits funds of £2.5 billion at 31 December
2019 (2018: £2.6 billion) and staff pension schemes in surplus of £1.2 billion at 31 December 2019 (2018: £1.1 billion) are excluded. These exclusions have no impact on Solvency II surplus as these funds are self-supporting on a Solvency II capital basis with any surplus capital above SCR not recognised.
• A notional reset of the transitional measure on technical provisions (TMTP), calculated using the same method as used for formal TMTP resets. This presentation avoids step changes to the Solvency II position that arise only when the formal TMTP reset points are triggered. The 31 December 2019 position is based on a formal reset of the TMTP, in line with the requirement to reset the TMTP at least every two years and hence no adjustment is required. The 31 December 2018 Solvency II position includes a notional reset (£0.1 billion decrease in surplus). The TMTP is amortised on a straight-line basis over 16 years from 1 January 2016 in line with the Solvency II rules.
• The 31 December 2019 Solvency II position includes three pro forma adjustments. These relate to the disposal of Friends Provident International Limited (FPI) (£nil impact on surplus), the disposal of Hong Kong (£nil impact on surplus) and the potential impact of an expected change to Solvency II regulations on the treatment of equity release mortgages (£0.2 billion decrease in surplus as a result of an increase in SCR). The 31 December 2018 Solvency II position includes the pro forma impact of the disposals of FPI (£0.1 billion increase in surplus) and the potential impact of an expected change to Solvency II regulations on the treatment of equity release mortgages (£0.2 billion reduction in surplus as a result of an increase in SCR).
Own funds 2019
£m
SCR 2019
£m
Surplus 2019
£m
Own funds 2018
£m
SCR 2018
£m
Surplus 2018
£m
Estimated Solvency II regulatory surplus as at 31 December 28,347 (15,517) 12,830 27,567 (15,339) 12,228 Adjustments for: Fully ring-fenced with-profit funds (2,501) 2,501 — (2,634) 2,634 — Staff pension schemes in surplus (1,181) 1,181 — (1,142) 1,142 — Notional reset of TMTP — — — (127) — (127) Pro forma adjustments (117) (75) (192) (113) (6) (119)
Estimated Solvency II shareholder surplus at 31 December 24,548 (11,910) 12,638 23,551 (11,569) 11,982

Solvency II position continued
Aviva plc Preliminary announcement 2019 08
Overview Analysis of assets Other information
IFRS Income, expenses & capital
3.ii – Movement in Solvency II surplus
Shareholder view
Own funds 2019
£m
SCR 2019
£m
Surplus 2019
£m
Own funds 2018
£m
SCR 2018
£m
Surplus 2018
£m
Group Solvency II surplus at 1 January 23,551 (11,569) 11,982 24,737 (12,506) 12,231 Operating capital generation 2,257 2 2,259 2,022 1,176 3,198 Non-operating capital generation 178 (362) (184) (777) (231) (1,008) Dividends1 (1,222) — (1,222) (1,166) — (1,166) Share buy-back — — — (600) — (600) Hybrid debt repayments (210) — (210) (875) — (875) Acquired/divested business (6) 19 13 210 (8) 202
Estimated Solvency II surplus at 31 December 24,548 (11,910) 12,638 23,551 (11,569) 11,982 1 Dividends includes £17 million (2018: £17 million) of Aviva plc preference dividends and £21 million (2018: £21 million) of General Accident plc preference dividends.
The estimated Solvency II surplus is £12.6 billion at 31 December 2019 (2018: £12.0 billion), with a shareholder cover ratio of 206% (2018: 204%). The increase since 31 December 2018 is mainly due to the beneficial impact from capital generation partially offset by the payment of the Aviva plc dividend and the redemption of the hybrid debt in November 2019.
Non-operating capital generation is primarily due to the impact of a fall in interest rates, strengthening of Sterling against the Euro, employer contributions to the staff pension scheme and the impact of the transfer of the Ireland branch of the UK business to Ireland following the decision of the UK to leave the European Union partially offset by the narrowing of credit spreads and strong equity market performance in 2019.

Solvency II position continued
Aviva plc Preliminary announcement 2019 09
Overview Analysis of assets Other information
IFRS Income, expenses & capital
3.iii – Diversified SCR analysis
31 December 2019 £bn
31 December 2018 £bn
Credit risk 2.7 3.0 Equity risk 1.4 1.2 Interest rate risk 0.4 1.0 Other market risk 1.7 1.4 Life insurance risk 3.1 2.5 General insurance risk 0.8 0.8 Operational risk 1.1 1.1 Other risk 0.7 0.6
Total 11.9 11.6
The SCR has increased by £0.3 billion to £11.9 billion since 31 December 2018. The change in risk profile is predominantly driven by economic movements during 2019. Credit risk decreased by £0.3 billion due to the narrowing of sovereign bond spreads in Italy. Life insurance risk increased by £0.6 billion primarily due to increased longevity risk in the UK as a consequence of lower interest rates and narrowing of credit spreads reducing the impact of discounting. Interest rate risk has decreased by £0.6 billion primarily due to the re-assessment of the SCR interest rate stress.

Solvency II position continued
Aviva plc Preliminary announcement 2019 10
Overview Analysis of assets Other information
IFRS Income, expenses & capital
3.iv – Solvency II sensitivities Sensitivity analysis of Solvency II surplus The following sensitivity analysis of Solvency II surplus allows for any consequential impact on the assets and liability valuations. All other assumptions remain unchanged for each sensitivity, except where these are directly affected by the revised economic conditions or where a management action that is allowed for in the SCR calculation is applicable for that sensitivity. For example, future bonus rates are automatically adjusted to reflect sensitivity changes to future investment returns.
TMTP are assumed to be recalculated in all sensitivities where its impact would be material.
The table below shows the absolute change in cover ratio under each sensitivity, e.g. a 2% positive impact would result in a cover ratio of 208%.
Sensitivities
2019 Impact on
cover ratio %
Changes in economic assumptions 25 bps increase in interest rate 4% 50 bps increase in interest rate 6% 100 bps increase in interest rate 11% 25 bps decrease in interest rate (5%) 50 bps decrease in interest rate (11%) 50 bps increase in corporate bond spread1 (4%) 100 bps increase in corporate bond spread1 (10%) 50 bps decrease in corporate bond spread1 3% Credit downgrade on annuity portfolio2 (4%) 10% increase in market value of equity 2% 25% increase in market value of equity 5% 10% decrease in market value of equity (2%) 25% decrease in market value of equity (7%) 20% increase in value of commercial property 7% 20% decrease in value of commercial property (9%) 20% increase in value of residential property 4% 20% decrease in value of residential property (6%)
Changes in non-economic assumptions 10% increase in maintenance and investment expenses (9%) 10% increase in lapse rates (3%) 5% increase in mortality/morbidity rates – life assurance (2%) 5% decrease in mortality rates – annuity business (13%) 5% increase in gross loss ratios (3%) 1 Credit spread movement for corporate bonds with credit rating A at a 10 year duration, with the other ratings and durations stressed by the same proportion relative to the stressed capital requirement. 2 An immediate full letter downgrade on 20% of the annuity portfolio bonds (e.g. from AAA to AA, from AA to A).
The Group continues to keep under review the allowance in our assumptions for future property prices and rental income in relation to our commercial and equity release mortgages, for the possible adverse impact including but not limited to the ultimate arrangements regarding the UK’s exit from the European Union. At 31 December 2019, this allowance has been determined in line with previous periods and is estimated at £0.4 billion (2018: £0.4 billion). As more clarity is provided on the terms of the UK’s exit from the European Union, the Group will look to establish core property assumptions without an explicit allowance for Brexit uncertainty.
Limitations of sensitivity analysis The table above demonstrates the effect of a change in a key assumption while other assumptions remain unchanged. In reality, there is a correlation between the assumptions and other factors. It should also be noted that these sensitivities are non-linear, and larger or smaller impacts should not be interpolated or extrapolated from these results.
The sensitivity analysis does not take into consideration that the Group’s assets and liabilities are actively managed. Additionally, the Solvency II position of the Group may vary at the time that any actual market movement occurs. For example, the Group’s financial risk management strategy aims to manage the exposure to market fluctuations.
As investment markets move past various trigger levels, management actions could include selling investments, changing investment portfolio allocations, adjusting bonuses credited to policyholders and taking other protective action.
Other limitations in the above sensitivity analysis include the use of hypothetical market movements to demonstrate potential risk that only represent the Group’s view of possible near-term market changes that cannot be predicted with any certainty and the assumption that all interest rates move in an identical fashion.

Solvency II position continued
Aviva plc Preliminary announcement 2019 11
Overview Analysis of assets Other information
IFRS Income, expenses & capital
3.v – Solvency II net asset value
2019
£m pence per
share1 2018
£m pence per
share1
Solvency II shareholder unrestricted Tier 1 own funds at 1 January 15,296 392p 15,550 387p Operating capital generation 2,257 57p 2,022 50p Non-operating capital generation 178 4p (777) (19)p Dividends2 (1,222) (31)p (1,166) (29)p Share buy-back — — (600) (4)p Acquired/divested business (6) — 210 5p Impact of changes to the value of subordinated liabilities 59 1p 68 2p Impact of changes to the value of net deferred tax assets 17 — (11) — Estimated Solvency II shareholder unrestricted Tier 1 own funds at 31 December 16,579 423p 15,296 392p 1 Number of shares in issue as at 31 December 2019 was 3,921 million (2018: 3,902 million). 2 Dividends includes £17 million (2018: £17 million) of Aviva plc preference dividends and £21 million (2018: £21 million) of General Accident plc preference dividends.
Solvency II net asset value per share increased by 31 pence to 423 pence per share (2018: 392 pence) mainly as a result of operating capital generation partly offset by the payment of the external dividend.
3.vi – Solvency II regulatory own funds and debt leverage‡
Regulatory view 2019
£m 2018
£m
Solvency II regulatory debt1 7,892 8,160 Senior notes 1,052 1,113 Commercial paper 238 251
Total debt 9,182 9,524
Unrestricted Tier 1 20,377 19,312 Restricted Tier 1 1,839 2,096 Tier 2 5,794 5,811 Tier 32 337 348
Estimated total regulatory own funds3 28,347 27,567 Solvency II debt leverage4 31% 33% 1 Solvency II regulatory debt consists of Restricted Tier 1 and Tier 2 regulatory own funds, and Tier 3 subordinated debt. 2 Tier 3 regulatory own funds at 31 December 2019 consists of £259 million subordinated debt (2018: £253 million) plus £78 million net deferred tax assets (2018: £95 million). 3 Regulation was introduced in France that allows French insurers to place the Provision pour Participation aux Excedents (PPE) into Solvency II own funds. The PPE has been included in the France local regulatory own funds in
2019 but it is not included in the Group regulatory own funds. 4 Solvency II debt leverage is calculated as the total debt as a proportion of total regulatory own funds plus commercial paper and senior notes.
Solvency II debt leverage has reduced by 2pp to 31% (2018: 33%). This was due to a reduction in debt and an increase in Unrestricted Tier 1 own funds over 2019. The reduction in debt was driven by redemption of the Group’s 6.875% £210 million Tier 1 notes in November 2019. These instruments were classified as Restricted Tier 1 own funds.

Controllable costs
Aviva plc Preliminary announcement 2019 12
Overview Analysis of assets Other information
IFRS Income, expenses & capital
4 – Controllable costs‡
2019
£m
Restated1 2018
£m
UK Life and Investments, Savings & Retirement UK Life (including Savings & Retirement) 1,045 1,013 Aviva Investors 446 450
General Insurance 1,420 1,268 Europe Life 548 568 Asia Life 198 183 Other Group activities 282 486
Controllable costs2 3,939 3,968
Levies & premium taxes3 180 170
Operating expenses 4,119 4,138 1 Following the change in the definition of Group adjusted operating profit (see note B2(b)), operating expenses now include the amortisation and impairment of internally generated intangible assets to better reflect the
operational nature of these assets. Comparative amounts have been restated resulting in an increase in the prior period operating expenses of £112 million. 2 The controllable costs APM is a new APM based on operating expenses adjusted to exclude premium taxes, fees and levies that vary directly with premium volumes. The controllable costs APM provides more relevant information
by excluding costs which management cannot actively control other than by controlling premium volume. 3 Premium taxes, fees and levies that vary directly with premium volumes are excluded from controllable costs.
Controllable costs have decreased by 1% to £3,939 million (2018: £3,968 million) reflecting our focus on efficiency, partially offset by targeted spend on growth initiatives and IT simplification. The increase in controllable costs in UK Life and General Insurance partly reflects the alignment of the UK digital business with the UK Life and UK General Insurance businesses during the year, which is offset in other Group activities.

Profit and earnings per share
Aviva plc Preliminary announcement 2019 13
Overview Analysis of assets Other information
IFRS Income, expenses & capital
5 – Profit and earnings per share
2019
£m
Restated1 2018
£m
Operating profit before tax UK Life and Investments, Savings & Retirement
UK Life (including Savings & Retirement) 1,855 1,886 Aviva Investors 96 147
General Insurance 594 609 Europe Life 827 807 Asia Life 276 263 Other Group operations (note A1) (26) (212)
Market operating profit 3,622 3,500
Corporate centre (note A2) (183) (216) Group debt costs and other interest (note A3) (255) (280) Operating profit before tax‡# 3,184 3,004
Tax attributable to shareholders’ profit (668) (625) Non-controlling interests (98) (100) Preference dividends and other2 (51) (53)
Operating profit attributable to ordinary shareholders 2,367 2,226
Operating earnings per share‡# 60.5p 56.2p 1 During 2019 the Group adjusted operating profit APM has been revised and now includes the amortisation and impairment of internally generated intangible assets to better reflect the operational nature of these assets (see
note B2(b)). Group adjusted operating profit continues to exclude amortisation and impairment of intangible assets acquired in business combinations. Comparative amounts have been restated resulting in a reduction in the prior period Group adjusted operating profit of £112 million. There is no impact on profit before tax. Following the change in the definition of Group adjusted operating profit, operating earnings per share have also been restated to include the amortisation and impairment of internally generated intangible assets. Comparative amounts have been restated resulting in a reduction in prior period of 2.2 pence.
2 Other includes coupon payments in respect of the direct capital instrument (DCI) and tier 1 notes (net of tax).
IFRS profit after tax 2,663 1,687
Basic earnings per share 63.8p 38.2p
Operating profit increased by 6% to £3,184 million (2018: £3,004 million). During 2019, as part of our strategy to simplify our business, we aligned our UK digital business with our UK Life and UK General Insurance businesses. Whilst the effect of this is broadly neutral at Group level, it has had an impact on UK Life and UK General Insurance’s operating profit this year which is explained below.
UK Life operating profit decreased by 2% to £1,855 million, which includes the adverse impact of the UK digital alignment. Excluding this, operating profit was up 1% which includes higher profit in annuities and equity release and further benefits from changes in longevity assumptions, partly offset by lower profit in protection and the legacy book.
Aviva Investors operating profit decreased by £51 million, mainly driven by lower operating revenue in 2019.
In our General Insurance businesses, operating profit decreased to £594 million (2018: £609 million). In the UK, general insurance operating profit was down 35% to £250 million (2018: £383 million), which includes the adverse impact of the UK digital alignment of £113 million. Excluding this, operating profit was down 5% due to higher expenses reflecting continued investment in IT infrastructure and less favourable prior year reserve releases, partly offset by lower weather costs compared to 2018. In Canada, operating profit improved by £164 million as the benefits from the extensive profit remediation plans that were put in place from late 2017 earned through, as well as more favourable prior year development and weather costs compared to 2018. Excluding disposals, Europe general insurance operating profit reduced by 23% to £154 million (2018: £199 million) mainly driven by higher large losses and less favourable prior year development in France and the impact of a new motor levy in Ireland.
Europe Life operating profit increased by 2% to £827 million (2018: £807 million), mainly driven by higher positive inflows from our hybrid savings product in Italy and improved profit in Ireland, partly offset by lower protection profit in France and lower fee income on assets under management in Poland.
In our Asia Life businesses, operating profit has increased by 5% to £276 million (2018: £263 million). Excluding FPI and Hong Kong, operating profit increased by 32% to £157 million (2018: £119 million) driven by growth in Singapore and China.
Other Group operations include investment return on centrally held assets, the results of our internal reinsurance business and the results of other operations. Total net loss in relation to non-insurance activities was lower at £26 million (2018: net loss of £212 million) mainly reflecting the alignment of the UK digital business to UK Life and UK General Insurance and lower Group head office costs.
Operating earnings per share increased by 4.3p to 60.5p (2018: 56.2p) due mainly to the increase in operating profit.

Divisional performance
Aviva plc Preliminary announcement 2019 14
Overview Analysis of assets Other information
IFRS Income, expenses & capital
6 – Divisional performance 6.i – UK Life and Investments, Savings & Retirement In November 2019 we announced the creation of the Investments, Savings & Retirement (IS&R) business division, effective from 1 January 2020, which brings together Aviva Investors and the modern UK Savings and Retirement business to create a wealth and asset management business with a larger customer base, scale of assets and strong advisor relationships; this division is well positioned for growth. The division will be a leading provider of mass market savings and retirement solutions in the UK and the owner of a strong international asset management brand.
From 2020, our UK Life division incorporates three lines of business: annuities & equity release, protection & health, and heritage. This division is key in generating sustainable cash flows. This section summarises the performance of UK Life and Aviva Investors during 2019 on the basis on which they were managed during the year.
£m (unless otherwise stated) 2019
2018 Sterling %
change Constant
currency % 2019 Restated
2018 Sterling %
change Constant
currency %
UK Life and Investments, Savings & Retirement Solvency II operating own funds generation and return on
capital‡ Solvency II operating own funds generation Solvency II return on capital
UK Life (including UK Savings & Retirement) 1,244 1,552 (20)% (20)% 9.3% 10.9% (1.6)pp (1.6)pp Aviva Investors 70 111 (37)% (37)% 13.7% 22.7% (9.0)pp (9.0)pp
1,314 1,663 (21)% (21)% 9.5% 11.3% (1.8)pp (1.8)pp Solvency II operating capital generation‡# and cash
remittances‡# Solvency II operating capital generation Cash remittances
UK Life (including UK Savings & Retirement) 1,170 1,821 (36)% (36)% 1,387 2,152 (36)% (36)% Aviva Investors 90 126 (29)% (29)% 86 92 (7)% (7)%
1,260 1,947 (35)% (35)% 1,473 2,244 (34)% (34)% UK Life (including UK Savings & Retirement)
Operating profit1,‡# 1,855 1,886 (2)% (2)% Controllable costs‡ 1,045 1,013 3% 3% New business PVNBP 27,570 23,946 15% 15% VNB‡ 592 481 23% 23% Aviva Investors Revenue 542 597 (9)% (9)% Controllable costs‡ 446 450 (1)% (1)% Operating profit1,‡# 96 147 (35)% (35)% Assets under management £346bn £331bn 5% 5% 1 During 2019 the Group adjusted operating profit APM has been revised and now includes the amortisation and impairment of internally generated intangible assets to better reflect the operational nature of these assets (see
note B2(b)). Group adjusted operating profit continues to exclude amortisation and impairment of intangible assets acquired in business combinations. Comparative amounts have been restated. There is no impact on profit before tax.
UK Life (including UK Savings & Retirement) overview During 2019, UK Life operating capital generation and operating profit both decreased due to a reduction in management actions and the alignment of UK digital business costs to UK Life, which is broadly neutral at Group level. Excluding the impact of these, growth in the bulk purchase annuities (BPA) business has offset the impact of expected outflows of the legacy book and reduced protection profits.
Operating and financial performance Solvency II operating own funds generation and return on capital‡ UK Life (including UK Savings & Retirement) Solvency II return on capital reduced by 1.6pp to 9.3% (2018: 10.9%) and Solvency II own funds generation decreased to £1,244 million (2018: £1,552 million). This is largely due to no benefit from transitional relief on new business together with adverse experience on protection business. In 2018, new business written contributed to the calculation of transitional measures (in line with clarification issued by the PRA since 2017) but it is no longer applicable to the Group in 2019. 2018 own funds generation included £218 million of transitional benefits.
Operating capital generation‡# UK Life Solvency II operating capital generation (OCG) has reduced to £1,170 million (2018: £1,821 million). This is mainly due to the absence of transitional benefits on new business together with adverse experience variances and a reduction in assumption changes and management actions. These have been partially offset by lower new business strain which has significantly reduced due to reinsurance actions. The impacts of longevity assumption changes are broadly comparable in 2018 and 2019, but 2019 includes adverse impacts from persistency and other non-economic assumption changes. 2018 also included positive impacts from modelling changes and additional equity volatility hedging that did not re-occur in 2019.
Cash‡# Cash remitted to Group by UK Life was £1,387 million (2018: £2,152 million), including a £500 million special remittance following recent longevity developments. 2018 included £1,250 million of special remittances, £750 million due to positive longevity developments and management actions and the final Friends Life integration remittance of £500 million. # Symbol denotes key financial performance indicators used as a base to determine or modify remuneration. ‡ denotes APMs which are key performance indicators. There have been no changes to the APMs used by the Group during the period under review.
Divisional performance continued
Aviva plc Preliminary announcement 2019 15
Overview Analysis of assets Other information
IFRS Income, expenses & capital
6.i – UK Life and Investments, Savings & Retirement continued Operating profit1,‡#, new business and net flows
Operating profit‡# 2019
£m
Restated1
2018 £m
Sterling % change
Long-term savings2 211 187 13% Annuities and equity release 866 777 11% Protection 166 221 (25)% Legacy3 274 316 (13)% Health 35 38 (8)% Other4 303 347 (13)%
Total UK Life operating profit‡# 1,855 1,886 (2)% 1 During 2019 the Group adjusted operating profit APM has been revised and now includes the amortisation and impairment of internally generated intangible assets to better reflect the operational nature of these assets (see
note B2(b)). Group adjusted operating profit continues to exclude amortisation and impairment of intangible assets acquired in business combinations. Comparative amounts have been restated. There is no impact on profit before tax.
2 Includes workplace, platform, individual personal pensions and heritage pensions. 3 Legacy represents products no longer actively marketed, including with-profits and bonds. 4 Other life represents changes in assumptions and modelling, non-recurring items and non-product specific overheads.
UK Life & Health operating profit decreased by 2% to £1,855 million (2018: £1,886 million). Within this, lower profit in protection and our legacy book were offset by higher profit in annuities & equity release. There was a lower contribution from other items mainly due to the alignment of UK digital business costs within UK Life (which is neutral at Group level). More details are set out below.
PVNBP increased 15% to £27,570 million (2018: £23,946 million) as strong growth in BPA, workplace pensions, group protection and equity release was partly offset by lower platform and individual annuity volumes. VNB increased by 23% to £592 million (2018: £481 million), mainly reflecting growth in volumes and higher margins in annuities & equity release.
Managed assets and net flows Platform
£m
Pensions and other long-
term savings £m
Total long- term savings
£m
Annuities and equity release
£m
Other UK non-profit
£m
Total UK Life (excluding UK
with-profits) £m
With profits and other
£m Total UK Life
£m
Managed assets at 1 January 2019 22,643 93,060 115,703 61,554 22,814 200,071 48,167 248,238 Premiums and deposits, net of reinsurance 5,662 9,555 15,217 4,038 1,376 20,631 293 20,924 Claims and redemptions, net of reinsurance (2,206) (7,584) (9,790) (2,802) (2,559) (15,151) (4,232) (19,383) Net flows 3,456 1,971 5,427 1,236 (1,183) 5,480 (3,939) 1,541 Market and other movements 2,986 13,842 16,828 4,353 2,074 23,255 3,243 26,498 Managed assets at 31 December 2019 29,085 108,873 137,958 67,143 23,705 228,806 47,471 276,277
Managed assets increased 11% to £276 billion (2018: £248 billion). Overall net flows were positive at £1.5 billion mainly due to new business growth in long-term savings and annuities & equity release.
Long-term savings Long-term savings managed assets increased 19% to £138 billion (2018: £116 billion), with net fund inflows improving to £5.4 billion (2018: £5.0 billion). Within this, heritage pensions net outflows were £2.1 billion (2018: £1.9 billion). These were more than offset by workplace pension net fund flows which grew to £4.8 billion (2018: £3.7 billion), driven by new scheme wins with large corporates, the benefits of higher auto enrolment contributions and improved retention. Positive net fund flows of £3.5 billion (2018: £3.9 billion) along with market movements have resulted in platform managed assets growing 28% to £29.1 billion (2018: £22.6 billion).
Operating profit has increased by 13% to £211 million (2018: £187 million).
Long-term savings VNB increased 27% to £141 million (2018: £111 million) as a result of growth in workplace pensions VNB. Platform VNB has been impacted by lower volumes driven by uncertain investment markets.
PVNBP VNB‡ New Business Margin
Gross of tax and non controlling interests 2019
£m 2018
£m Sterling %
change 2019
£m 2018
£m Sterling %
change 2019
% 2018
%
Long-term savings 18,884 16,829 12% 141 111 27% 0.7% 0.7% Annuities and equity release 6,182 4,784 29% 284 196 45% 4.6% 4.1% Protection 1,875 1,799 4% 126 140 (10)% 6.7% 7.8% Health and Other 629 534 18% 41 34 21% 6.5% 6.4%
Total 27,570 23,946 15% 592 481 23% 2.1% 2.0%

Divisional performance continued
Aviva plc Preliminary announcement 2019 16
Overview Analysis of assets Other information
IFRS Income, expenses & capital
6.i – UK Life and Investments, Savings & Retirement continued Annuities & equity release Annuities & equity release operating profit increased to £866 million (2018: £777 million). Within this, new business profit increased to £506 million (2018: £363 million) as BPA volumes increased 55% to £4.0 billion (2018: £2.6 billion), including the partial buy-in of the Aviva staff pension scheme (£1.7 billion). Volumes in Individual annuities were 5% lower as we took a selective approach to trading to focus on margins. Existing business operating profit fell by £54 million to £360 million (2018: £414 million) as there has been no repeat of either the in-year favourable longevity experience in 2018 or the £24 million benefit seen in 2018 from asset mix optimisation.
Annuities & equity release VNB increased 45% to £284 million (2018: £196 million) despite the absence of new business transitional benefits in 2019. Growth has mainly been driven by higher BPA volumes written on a higher average margin due to pricing discipline, improved reinsurance rates and securing higher quality assets.
Protection Protection operating profit decreased by 25% to £166 million (2018: £221 million) reflecting continued competitive trading conditions in the market, including the impact of hardening reinsurance rates and adverse claims experiences in group protection.
Overall protection VNB decreased by 10% to £126 million (2018: £140 million) mainly due to hardening reinsurance rates with PVNBP up 4% to £1,875 million (2018: £1,799 million). Group protection volumes grew strongly driven by large corporates growth. Individual protection volumes were stable despite competitive trading pressures.
Legacy Legacy contributed operating profit of £274 million (2018: £316 million). 2019 fee income was impacted by lower asset values at the start of the year following weak investment markets towards the end of 2018. The fall in profit was broadly in line with the impact of expected net outflows.
Health UK Health operating profit decreased by 8% to £35 million (2018: £38 million). Health and Other VNB improved to £41 million (2018: £34 million), due to growth in health volumes.
Other Other operating profit is £303 million. During 2019, there was a net benefit from assumption changes of £574 million. Within this, continued net positive longevity and mortality developments, including adopting CMI 2018, gave a benefit of £751 million which was partly offset by updates to persistency (£126 million charge) and other assumptions. A benefit to reflect changes to our unitised with profit reserving approach (£167 million) was largely offset by a number of other modelling changes. We have recognised a £175 million provision to allow for certain pension policyholders that may not have been adequately informed of switching options available to them.
In 2018, Other of £347 million mainly included the benefit of continued positive longevity developments which led to a positive change to base mortality for individual annuities of £345 million. Updates to the rate of mortality improvements, including CMI 2017, had a benefit of £251 million and a refinement to BPA modelling together with changes to base mortality and improvements had a benefit of £132 million. Longevity benefits were partly offset by the recognition of an additional £175 million provision relating to potential redress for advised sales by Friends Provident (of which over 90% of cases relate to pre-2002) and a £119 million adverse impact in respect of the settlement of certain legacy reinsurance arrangements.
Controllable costs‡ Controllable costs increased 3% to £1,045 million (2018: £1,013 million), including the effect of realigning £52 million of UK digital business costs to UK Life. Excluding these costs, controllable costs reduced by 2%. We have benefited from a continued focus on efficiency while continuing to invest in growth and simplification initiatives, including improvements to customer experience.
Aviva Investors overview This was a challenging year for Aviva Investors leading to a reduction in revenue for the year. However, having invested in our investment capability and distribution in 2018, we have started to see the benefits of this investment in 2019, with net positive external clients flows in the year and a significant improvement in investment performance demonstrating the incremental value that we have achieved for our investors.
Cash‡# Cash remitted to Group was £86 million (2018: £92 million).
Controllable costs‡ Aviva Investors controllable costs decreased to £446 million (2018: £450 million). The decrease in expenses includes £11 million cost savings partly offset by £7 million non-recurring restructuring costs.
Operating profit‡# Fund management operating profit decreased by £51 million to £96 million (2018: £147 million). Revenue decreased by £55 million to £542 million (2018: £597 million) driven by high margin external outflows, the effect of the 2018 disposals of an indirect real estate multi-manager business and our interest in the management of a pan-European commercial property fund, reduced internal client demand for originating assets and lower fee income due to run-off of the legacy internal client book of business. Cost control by the business helped mitigate the impact on profitability.

Divisional performance continued
Aviva plc Preliminary announcement 2019 17
Overview Analysis of assets Other information
IFRS Income, expenses & capital
6.i – UK Life and Investments, Savings & Retirement continued Net flows and assets under management and under administration Assets under management represent all assets managed by Aviva Investors. These comprise assets which are included within the Group’s statement of financial position and those belonging to external clients outside the Group which are not included in the statement of financial position. Internal legacy relates to assets managed by Aviva Investors on behalf of the Group relating to products that are no longer actively marketed.
Internal legacy
£m Internal core
£m External
£m Total
£m
Aviva Investors Assets under management at 1 January 2019 83,615 183,011 64,080 330,706
Total inflows 10,328 42,605 10,590 63,523 Total outflows (18,143) (41,216) (8,250) (67,609)
Net flows (7,815) 1,389 2,340 (4,086) Net flows into liquidity funds and cash 845 266 188 1,299 Transfers out to external managers — — (3,223) (3,223) Market and foreign exchange movements 8,282 10,027 3,127 21,436
Assets under management at 31 December 2019 84,927 194,693 66,512 346,132 Externally managed assets under administration at 1 January 2019 29,104 Externally managed assets under administration net flows and other movements 7,188
Externally managed assets under administration at 31 December 2019 36,292 Assets under management and administration at 1 January 2019 359,810
Assets under management and administration at 31 December 2019 382,424
Assets under management increased by £15.4 billion to £346.1 billion (2018: £330.7 billion). This is due to £21.4 billion of favourable market and foreign exchange movements, external net inflows of £2.3 billion and £1.3 billion net flows into liquidity funds and cash, partly offset by outflows on our Aviva client of £6.4 billion and £3.2 billion of assets transferred to an external manager, which were previously managed by Aviva Investors under a legacy distribution agreement. Assets under management and administration at 31 December 2019 were £382.4 billion (2018: £359.8 billion).
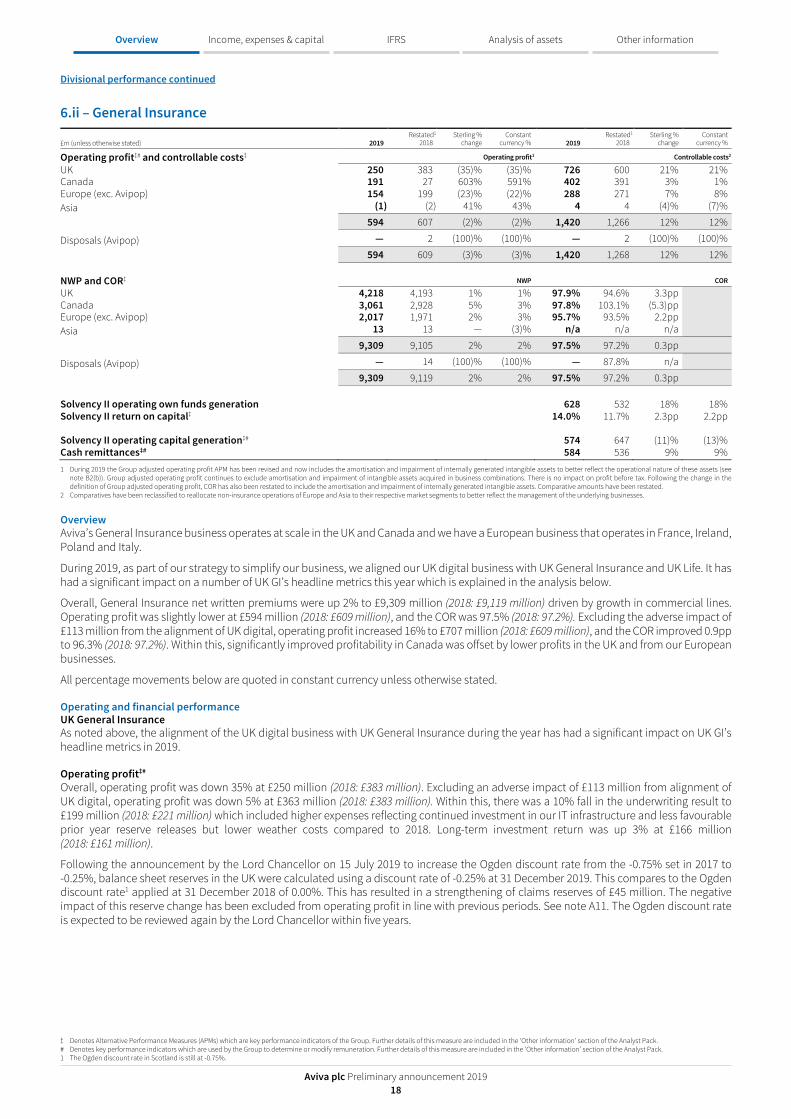
Divisional performance continued
Aviva plc Preliminary announcement 2019 18
Overview Analysis of assets Other information
IFRS Income, expenses & capital
6.ii – General Insurance
£m (unless otherwise stated) 2019 Restated1
2018 Sterling %
change Constant
currency % 2019 Restated1
2018 Sterling %
change Constant
currency %
Operating profit‡# and controllable costs‡ Operating profit1 Controllable costs2
UK 250 383 (35)% (35)% 726 600 21% 21% Canada 191 27 603% 591% 402 391 3% 1% Europe (exc. Avipop) 154 199 (23)% (22)% 288 271 7% 8% Asia (1) (2) 41% 43% 4 4 (4)% (7)%
594 607 (2)% (2)% 1,420 1,266 12% 12%
Disposals (Avipop) — 2 (100)% (100)% — 2 (100)% (100)%
594 609 (3)% (3)% 1,420 1,268 12% 12% NWP and COR‡ NWP COR
UK 4,218 4,193 1% 1% 97.9% 94.6% 3.3pp Canada 3,061 2,928 5% 3% 97.8% 103.1% (5.3)pp Europe (exc. Avipop) 2,017 1,971 2% 3% 95.7% 93.5% 2.2pp Asia 13 13 — (3)% n/a n/a n/a
9,309 9,105 2% 2% 97.5% 97.2% 0.3pp
Disposals (Avipop) — 14 (100)% (100)% — 87.8% n/a
9,309 9,119 2% 2% 97.5% 97.2% 0.3pp Solvency II operating own funds generation 628 532 18% 18% Solvency II return on capital‡ 14.0% 11.7% 2.3pp 2.2pp Solvency II operating capital generation‡# 574 647 (11)% (13)% Cash remittances‡# 584 536 9% 9% 1 During 2019 the Group adjusted operating profit APM has been revised and now includes the amortisation and impairment of internally generated intangible assets to better reflect the operational nature of these assets (see
note B2(b)). Group adjusted operating profit continues to exclude amortisation and impairment of intangible assets acquired in business combinations. There is no impact on profit before tax. Following the change in the definition of Group adjusted operating profit, COR has also been restated to include the amortisation and impairment of internally generated intangible assets. Comparative amounts have been restated.
2 Comparatives have been reclassified to reallocate non-insurance operations of Europe and Asia to their respective market segments to better reflect the management of the underlying businesses.
Overview Aviva’s General Insurance business operates at scale in the UK and Canada and we have a European business that operates in France, Ireland, Poland and Italy.
During 2019, as part of our strategy to simplify our business, we aligned our UK digital business with UK General Insurance and UK Life. It has had a significant impact on a number of UK GI’s headline metrics this year which is explained in the analysis below.
Overall, General Insurance net written premiums were up 2% to £9,309 million (2018: £9,119 million) driven by growth in commercial lines. Operating profit was slightly lower at £594 million (2018: £609 million), and the COR was 97.5% (2018: 97.2%). Excluding the adverse impact of £113 million from the alignment of UK digital, operating profit increased 16% to £707 million (2018: £609 million), and the COR improved 0.9pp to 96.3% (2018: 97.2%). Within this, significantly improved profitability in Canada was offset by lower profits in the UK and from our European businesses.
All percentage movements below are quoted in constant currency unless otherwise stated.
Operating and financial performance UK General Insurance As noted above, the alignment of the UK digital business with UK General Insurance during the year has had a significant impact on UK GI’s headline metrics in 2019.
Operating profit‡# Overall, operating profit was down 35% at £250 million (2018: £383 million). Excluding an adverse impact of £113 million from alignment of UK digital, operating profit was down 5% at £363 million (2018: £383 million). Within this, there was a 10% fall in the underwriting result to £199 million (2018: £221 million) which included higher expenses reflecting continued investment in our IT infrastructure and less favourable prior year reserve releases but lower weather costs compared to 2018. Long-term investment return was up 3% at £166 million (2018: £161 million).
Following the announcement by the Lord Chancellor on 15 July 2019 to increase the Ogden discount rate from the -0.75% set in 2017 to -0.25%, balance sheet reserves in the UK were calculated using a discount rate of -0.25% at 31 December 2019. This compares to the Ogden discount rate1 applied at 31 December 2018 of 0.00%. This has resulted in a strengthening of claims reserves of £45 million. The negative impact of this reserve change has been excluded from operating profit in line with previous periods. See note A11. The Ogden discount rate is expected to be reviewed again by the Lord Chancellor within five years.
‡ Denotes Alternative Performance Measures (APMs) which are key performance indicators of the Group. Further details of this measure are included in the ‘Other information’ section of the Analyst Pack. # Denotes key performance indicators which are used by the Group to determine or modify remuneration. Further details of this measure are included in the ‘Other information’ section of the Analyst Pack. 1 The Ogden discount rate in Scotland is still at -0.75%.

Divisional performance continued
Aviva plc Preliminary announcement 2019 19
Overview Analysis of assets Other information
IFRS Income, expenses & capital
6.ii – General Insurance continued UK General Insurance continued NWP and COR‡ NWP increased by 1% to £4,218 million (2018: £4,193 million). UK Personal lines NWP reduced 4% to £2,399 million (2018: £2,494 million) as we maintained our pricing discipline in Motor and targeted reductions in poor performing segments, combined with the continued run-off of the Creditor book. Home premiums were broadly stable. UK Commercial lines NWP increased 7% to £1,819 million (2018: £1,699 million) driven by a combination of volume and above inflation rate increases. There was an 8% increase in Commercial non-motor NWP to £1,264 million (2018: £1,167 million) with solid growth in SME and Global Corporate Specialty (GCS), while Commercial motor NWP increased 4% to £555 million (2018: £532 million).
Overall, UK GI COR was 97.9% (2018: 94.6%). Excluding the 2.7pp effect of the alignment of UK digital, COR was 0.6pp higher at 95.2% (2018: 94.6%) for the reasons described in relation to operating profit above.
Personal lines COR of 99.3% (2018: 92.9%) was 6.4pp higher year-on-year, of which 4.6pp reflects the UK digital alignment. Excluding this, Personal lines COR was 1.8pp higher reflecting higher expenses and lower prior year reserve releases, partly offset by lower weather costs. Commercial lines COR of 96.0% (2018: 97.3%) was 1.3pp better year-on-year, reflecting higher prior year reserve releases and lower weather costs.
Controllable costs‡ Controllable costs increased to £726 million (2018: £600 million). Excluding the impact from the alignment of UK digital, controllable costs were up 3% to £619 million (2018: £600 million) reflecting continued investment in our IT infrastructure, partly offset by savings in the underlying costs of running the business.
Canada Operating profit‡# During 2019, operating profit of £191 million (2018: £27 million) improved due to the extensive profit remediation plan put in place towards the end of 2017 with actions around pricing, indemnity management and risk selection.
In 2019, the underwriting result was a profit of £65 million (2018: loss of £90 million), mainly driven by premium rate increases, lower claims frequency and severity in our personal lines business, better weather conditions compared to the long-term average and favourable prior year reserve development, partly offset by higher commission. Long-term investment return improved 11% due to higher yields on short-duration securities and actions to optimise returns within our fixed income portfolio.
NWP and COR‡ Net written premiums were £3,061 million (2018: £2,928 million), up 3% on a constant currency basis. In personal lines, NWP was broadly stable at £2,100 million (2018: £2,107 million). Commercial lines NWP increased to £961 million (2018: £821 million) due to growth in Global Corporate and Specialty new business and rate increases put through during renewals.
The COR improved to 97.8% (2018: 103.1%) due to the improvement in the underwriting result described above.
Controllable costs‡ Controllable costs were 1% higher in constant currency at £402 million (2018: £391 million), reflecting increased investment in claims personnel and processes, investment in our pricing capabilities and the Global Corporate and Specialty business and continued investment in our IT infrastructure, mostly offset by lower real estate and other operating expenses.
Europe Operating profit‡# Excluding disposals, Europe general insurance operating profit reduced by 22% to £154 million (2018: £199 million). Dealing with each of the markets in turn: • In France, operating profit was £65 million (2018: £92 million), with growth in net earned premiums of 6%, particularly in commercial lines,
more than offset by higher large losses and less favourable prior year reserve development than 2018. • In Poland, operating profit was £20 million (2018: £21 million) with net earned premiums in line with 2018. • In Italy, excluding disposals, operating profit was down 23% to £22 million (2018: £30 million). Within this net earned premiums were down
3% as underwriting actions taken on the personal motor book during 2018 earned through and there were higher large losses in commercial lines and higher expenses.
• In Ireland, operating profit reduced to £47 million (2018: £56 million) driven by a soft market in personal lines with earned premiums 2% lower than 2018, and higher expenses (driven largely by the impact of the new motor levy of 2% applied to all motor policies since December 2018), partly offset by lower large losses and more benign weather than 2018.
NWP and COR‡ Excluding the disposal of Avipop, NWP increased by 3% to £2,017 million (2018: £1,971 million) with growth in France, Italy and Poland (particularly in commercial lines) partly offset by lower premiums in Ireland as we maintained strong underwriting discipline in a soft personal motor market.
COR has increased by 2.2pp to 95.7% (2018: 93.5%) for the reasons described in the operating profit section above.
Controllable costs‡ Controllable costs were up 8% to £288 million (2018: £271 million) excluding the disposal of Avipop, which includes investment in underwriting platforms in Italy. ‡ Denotes Alternative Performance Measures (APMs) which are key performance indicators of the Group. Further details of this measure are included in the ‘Other information’ section of the Analyst Pack. # Denotes key performance indicators which are used by the Group to determine or modify remuneration. Further details of this measure are included in the ‘Other information’ section of the Analyst Pack.

Divisional performance continued
Aviva plc Preliminary announcement 2019 20
Overview Analysis of assets Other information
IFRS Income, expenses & capital
6.ii – General Insurance continued Solvency II and cash remittances Solvency II operating own funds generation and return on capital‡ General Insurance Solvency II return on capital increased by 2.3pp to 14.0% (2018: 11.7%) and Solvency II own funds generation increased to £628 million (2018: £532 million). The increase is driven by Canada, where benefits from the extensive profit remediation plan put in place towards the end of 2017 are materialising. In the UK, own funds generation was broadly stable as the impacts of the alignment of UK digital business costs and continued investment in our IT infrastructure were offset by favourable weather experience and assumption changes. In Europe, there is a reduction due to large losses and less favourable prior year development releases in France and higher expenses in Ireland and Italy.
Operating capital generation‡# General Insurance Solvency II operating capital generation has reduced by £73 million to £574 million (2018: £647 million). In Canada, there was an increase of £122 million as benefits from the extensive profit remediation plan put in place towards the end of 2017 is materialising. This is offset in the UK, where there has been a reduction of £151 million, primarily due to the alignment of UK digital business costs within the UK General Insurance business, continued investment in our IT infrastructure and an increase in capital requirements due to volume growth in Commercial lines. Alignment of the UK digital business costs has resulted in an increase in the solvency capital requirement due to differential capital treatment for insurance and non-insurance entities. In Europe, there is a reduction is due to large losses and less favourable prior year development releases in France and higher expenses in Ireland and Italy.
Cash‡# Cash remitted to Group increased by £48 million to £584 million (2018: £536 million). In Canada, cash remitted increased to £156 million (2018: £28 million), reflecting improved underwriting performance. This was offset by a reduction in cash remitted from UK General Insurance which reduced to £248 million (2018: £361 million), reflecting lower Solvency II operating capital generation primarily due to the alignment of UK digital. Cash remitted from Europe was £180 million (2018: £147 million), which includes a £65 million special remittance following the disposal of Avipop in Italy in 2018.
‡ Denotes Alternative Performance Measures (APMs) which are key performance indicators of the Group. Further details of this measure are included in the ‘Other information’ section of the Analyst Pack. # Denotes key performance indicators which are used by the Group to determine or modify remuneration. Further details of this measure are included in the ‘Other information’ section of the Analyst Pack.

Divisional performance continued
Aviva plc Preliminary announcement 2019 21
Overview Analysis of assets Other information
IFRS Income, expenses & capital
6.ii – General Insurance continued
2019 UK Personal
£m
UK Commercial
£m Total UK
£m
Canada Personal
£m
Canada Commercial
£m
Total Canada
£m Europe
£m Asia £m
Total £m
General insurance Gross written premiums 2,470 2,154 4,624 2,134 1,070 3,204 2,121 15 9,964 Net written premiums 2,399 1,819 4,218 2,100 961 3,061 2,017 13 9,309 Net earned premiums 2,440 1,721 4,161 2,078 884 2,962 1,982 15 9,120 Net claims incurred (1,545) (1,049) (2,594) (1,421) (531) (1,952) (1,306) (12) (5,864) Of which claims handling costs (155) (116) (64) — (335) Earned commission (599) (364) (963) (378) (194) (572) (365) (2) (1,902) Earned expenses (279) (239) (518) (233) (140) (373) (225) (3) (1,119) Underwriting result 17 69 86 46 19 65 86 (2) 235 Long-term investment return (LTIR) 166 133 76 1 376 Other1 (2) (7) (8) — (17) Operating profit (GI) 250 191 154 (1) 594 General insurance combined operating ratio Claims ratio 63.3% 60.9% 62.3% 68.4% 60.0% 65.9% 65.9% 64.4% Of which:
Prior year reserve development (%) (2.6)% (0.6)% (1.8)% (1.7)% Weather claims (under)/over long-term average (%) (2.4)% (0.7)% 1.2% (1.0)%
Commission ratio 24.6% 21.2% 23.1% 18.2% 22.0% 19.3% 18.4% 20.8% Expense ratio 11.4% 13.9% 12.5% 11.2% 15.8% 12.6% 11.4% 12.3% Combined operating ratio 99.3% 96.0% 97.9% 97.8% 97.8% 97.8% 95.7% 97.5% Assets supporting general insurance business Debt securities 2,323 4,633 2,209 81 9,246 Equity securities 744 231 161 — 1,136 Investment property 414 — 170 — 584 Cash and cash equivalents 609 158 160 23 950 Other2 1,882 150 387 — 2,419 Assets at 31 December 2019 5,972 5,172 3,087 104 14,335 Debt securities 2,367 4,445 2,179 72 9,063 Equity securities 568 208 90 — 866 Investment property 380 — 148 — 528 Cash and cash equivalents 700 130 371 15 1,216 Other2 1,776 207 615 — 2,598 Assets at 31 December 2018 5,791 4,990 3,403 87 14,271 Average assets 5,882 5,081 3,245 96 14,304 LTIR as % of average assets 2.8% 2.6% 2.3% 1.0% 2.6% 1 Includes the result of non-insurance operations, unwind of discount rate, pension scheme net finance costs and IFRS 16 leases expense interest. 2 Includes loans and other financial investments.

Divisional performance continued
Aviva plc Preliminary announcement 2019 22
Overview Analysis of assets Other information
IFRS Income, expenses & capital
6.ii – General insurance continued
Restated1 2018 UK Personal
£m UK Commercial
£m Total UK
£m
Canada Personal
£m
Canada Commercial
£m
Total Canada
£m Europe
£m Asia6 £m
Total £m
General insurance Gross written premiums 2,562 1,942 4,504 2,143 904 3,047 2,075 14 9,640 Net written premiums 2,494 1,699 4,193 2,107 821 2,928 1,985 13 9,119
Net earned premiums 2,493 1,613 4,106 2,116 839 2,955 1,963 11 9,035 Net claims incurred (1,546) (1,019) (2,565) (1,609) (513) (2,122) (1,264) (7) (5,958) Of which claims handling costs (159) (110) (60) — (329)
Earned commission (601) (336) (937) (377) (172) (549) (368) (1) (1,855) Earned expenses (168) (215) (383) (234) (140) (374) (204) (5) (966) Underwriting result 178 43 221 (104) 14 (90) 127 (2) 256 Long-term investment return (LTIR) 161 120 82 — 363 Other2 1 (3) (8) — (10)
Operating profit (GI)3,4 383 27 201 (2) 609
General insurance combined operating ratio Claims ratio 62.0% 63.2% 62.5% 76.1% 61.1% 71.8% 64.4% 66.0% Of which:
Prior year reserve development (%) (2.5)% (1.3)% (2.8)% (2.3)% Weather claims (under)/over long-term average (%) (0.7)% 0.3% 1.7% 0.1%
Commission ratio 24.1% 20.8% 22.8% 17.8% 20.5% 18.6% 18.7% 20.5% Expense ratio 6.8% 13.3% 9.3% 11.1% 16.7% 12.7% 10.4% 10.7% Combined operating ratio3,4 92.9% 97.3% 94.6% 105.0% 98.3% 103.1% 93.5% 97.2%
Assets supporting general insurance business Debt securities 2,367 4,445 2,179 72 9,063 Equity securities 568 208 90 — 866 Investment property 380 — 148 — 528 Cash and cash equivalents 700 130 371 15 1,216 Other5 1,776 207 615 — 2,598
Assets at 31 December 2018 5,791 4,990 3,403 87 14,271
Debt securities 3,020 4,273 2,423 75 9,791 Equity securities 492 247 33 — 772 Investment property 323 — 176 — 499 Cash and cash equivalents 546 140 399 14 1,099 Other5 1,763 252 650 1 2,666
Assets at 31 December 2017 6,144 4,912 3,681 90 14,827
Average assets 5,968 4,951 3,542 89 14,550
LTIR as % of average assets 2.7% 2.4% 2.3% — 2.5% 1 Following a review of the Group’s presentation of consolidated investment funds, comparative amounts have been restated from those previously reported. The restatement has had no impact on the profit for the year or equity.
See note B1 for further information. 2 Includes the result of non-insurance operations, unwind of discount rate, pension scheme net finance costs and IFRS 16 leases expense interest. 3 During 2019 the Group adjusted operating profit APM has been revised and now includes the amortisation and impairment of internally generated intangible assets to better reflect the operational nature of these assets (see
note B2(b)). Group adjusted operating profit continues to exclude amortisation and impairment of intangible assets acquired in business combinations. There is no impact on profit before tax. Following the change in the definition of Group adjusted operating profit, COR has also been restated to include the amortisation and impairment of internally generated intangible assets. Comparative amounts have been restated.
4 Comparatives have been reclassified to reallocate non-insurance operations for Europe and Asia to their respective market segments to better reflect the management of the underlying businesses. 5 Includes loans and other financial investments. 6 Aviva Re is no longer included and comparative amounts have been restated from those previously reported.

Divisional performance continued
Aviva plc Preliminary announcement 2019 23
Overview Analysis of assets Other information
IFRS Income, expenses & capital
6.iii – Europe Life
£m (unless otherwise stated) 2019
2018 Sterling %
change Constant
currency % 2019 Restated1,2
2018 Sterling %
change Constant
currency %
Solvency II operating own funds generation 574 384 50% 53% Solvency II return on capital‡ 10.3% 6.9% 3.4pp 3.6pp Solvency II operating capital generation‡# 754 724 4% 6% Cash remittances‡# 414 336 23% 24% Operating profit‡#
France 408 418 (2)% (2)% Poland 174 177 (2)% — Italy (exc. Avipop) 173 147 17% 18% Other Europe (exc. Spain) 72 50 47% 51%
827 792 4% 6%
Disposals (Avipop, Spain) — 15 (100)% (100)%
827 807 2% 4% Controllable costs‡ 548 568 (4)% (2)% New business PVNBP VNB‡
France 5,702 4,335 32% 33% 168 210 (20)% (19)% Poland 624 486 28% 30% 64 58 10% 13% Italy (exc. Avipop) 5,537 6,263 (12)% (11)% 147 222 (34)% (33)% Other Europe 1,909 1,541 24% 28% 35 24 46% 56%
13,772 12,625 9% 10% 414 514 (19)% (18)%
Disposals (Avipop) — 16 (100)% (100)% — 3 (100)% (100)%
13,772 12,641 9% 10% 414 517 (20)% (19)%
1 During 2019 the Group adjusted operating profit APM has been revised and now includes the amortisation and impairment of internally generated intangible assets to better reflect the operational nature of these assets (see note B2(b)). Group adjusted operating profit continues to exclude amortisation and impairment of intangible assets acquired in business combinations. Comparative amounts have been restated. There is no impact on profit before tax.
2 Comparatives have also been reclassified to reallocate non-insurance operations to their respective market segments to better reflect the management of the underlying businesses.
Overview Aviva operates in a number of markets in Europe with insurance operations in France, Italy, Poland, Ireland and Turkey. During 2019 we have focused on the development and implementation of our market strategies for organic growth and the integration of Friends First in Ireland. In 2019, excluding disposals, operating profit increased by 4% to £827 million (2018: £792 million) with growth in Italy and higher profit in Ireland, partly offset by lower profits in France and Poland.
All percentage movements below are quoted in constant currency unless otherwise stated.
Operating and financial performance Solvency II operating own funds generation and return on capital‡ Europe Life Solvency II return on capital has increased by 3.4pp to 10.3% (2018: 6.9%) and Solvency II operating own funds generation increased to £574 million (2018: £384 million). This was primarily driven by modelling and assumption changes in Italy which are partly offset by a reduction in own funds generation from new business in France and Italy due to the impact of lower interest rates. 2018 included the adverse impact on own funds arising from the transfer of pensions business into a supplementary occupational pension fund (FRPS) in France (note the overall impact on capital generation was beneficial due to a significant reduction in solvency capital requirement).
Operating capital generation (OCG) ‡# Europe Life Solvency II operating capital generation has increased by £30 million to £754 million (2018: £724 million). Increases in management actions and higher returns on existing business have been partially offset by the increase in new business strain as a result of the low interest rate environment. In 2019, management actions included the beneficial impact of modelling and assumption changes in Italy as well as increased market risk hedging in France, while 2018 included the beneficial assumption changes and a benefit arising from the transfer of pensions business into a supplementary occupational pension fund (FRPS) in France.
Cash‡# Cash remitted to Group was £414 million (2018: £336 million). This includes a special remittance of £107 million following the disposal of Avipop in Italy in 2018. 2019 remittances from France are £141 million (2018: £176 million), which are shown after adjusting for a capital injection of £139 million (2018: £nil), as the net amount more appropriately reflects the overall remittances received from France during the year.
Operating profit‡# Excluding the impact of disposals, the operating profit of our life and health businesses grew by 6% to £827 million (2018: £792 million). Dealing with each of the markets in turn:
• In France, operating profit reduced by 2% to £408 million (2018: £418 million). Within this, the life result was down 5% to £387 million (2018: £408 million), mainly due to lower protection profit (including adverse claims experience in 2019), partly offset by an increase in savings business profit. The health result was £21 million (2018: £10 million) following actions to improve profitability.
• In Poland, operating profit was flat in constant currency terms at £174 million (2018: £177 million), with lower fee income on assets under management as a result of weak equity markets towards the end of 2018 offset by a more favourable mix of new business, and an improved result on protection business.
‡ Denotes Alternative Performance Measures (APMs) which are key performance indicators of the Group. Further details of this measure are included in the ‘Other information’ section of the Analyst Pack. # Denotes key performance indicators which are used by the Group to determine or modify remuneration. Further details of this measure are included in the ‘Other information’ section of the Analyst Pack.

Divisional performance continued
Aviva plc Preliminary announcement 2019 24
Overview Analysis of assets Other information
IFRS Income, expenses & capital
6.iii – Europe Life continued Operating profit‡# continued • In Italy, operating profit was £173 million (2018: £147 million), an increase of 18% with significant net inflows to our hybrid product in 2017
and 2018 driving higher revenue on assets under management and an increase in profit from existing business. • In Ireland, operating profit increased to £59 million (2018: £40 million), an increase of 49% mainly driven by a one-off benefit from
methodology and assumption changes and the inclusion of a full year of Friends First in 2019. • In Turkey, operating profit was £13 million (2018: £10 million), mainly driven by strong growth in our protection business.
Managed assets and net flows
2019
£m 2018
£m
Managed assets at 1 January 118,502 114,068 Premiums and deposits, net of reinsurance 12,474 11,746 Claims and redemptions, net of reinsurance (7,992) (7,547) Net flows 4,482 4,199 Market and other movements 2,596 235
Managed assets at 31 December 125,580 118,502
Net inflows in Europe of £4.5 billion (2018: £4.2 billion) include the growth in sales of our hybrid savings product in Italy and strong inflows into savings products in France. Favourable market and other movements in Europe were £2.6 billion (2018: £0.2 billion).
Controllable costs‡ Controllable costs for Europe Life reduced by 2% to £548 million (2018: £568 million). Excluding disposals, controllable costs were down 3% to £548 million (2018: £562 million) mainly due to a reduction in project spend in France partly offset by increased marketing and IT spend in Italy.
New business Excluding disposals, PVNBP was up 10% to £13,772 million (2018: £12,625 million). VNB decreased by 18% to £414 million (2018: £514 million).
In France, PVNBP was up 33% reflecting growth in sales of with-profits savings products and the acquisition of a significant collective pension scheme with EDF. VNB was down 19% primarily due to an adverse margin impact from lower interest rates. In Poland PVNBP increased by 30% driven by the performance of our new protection product and pensions transfers. In Italy, PVNBP was down by 11% due to a reduction in standalone with-profits and unit-linked volumes, partially offset by further growth in our hybrid product whilst VNB margins were adversely impacted by lower interest rates.
‡ Denotes Alternative Performance Measures (APMs) which are key performance indicators of the Group. Further details of this measure are included in the ‘Other information’ section of the Analyst Pack. # Denotes key performance indicators which are used by the Group to determine or modify remuneration. Further details of this measure are included in the ‘Other information’ section of the Analyst Pack.

Divisional performance continued
Aviva plc Preliminary announcement 2019 25
Overview Analysis of assets Other information
IFRS Income, expenses & capital
6.iv – Asia Life
£m (unless otherwise stated) 2019
2018 Sterling %
change Constant
currency % 2019 Restated1,2
2018 Sterling %
change Constant
currency %
Solvency II operating own funds generation 187 144 30% 27% Solvency II return on capital‡ 12.7% 9.7% 3.0pp 3.0pp Solvency II operating capital generation‡# 60 55 9% 7% Cash remittances‡# 51 6 — — Operating profit‡#
Singapore 145 123 17% 14% China 25 22 18% 18% Other Asia (exc.FPI & Hong Kong) (13) (26) 52% 54% 157 119 33% 29% FPI 128 151 (16)% (16)% Hong Kong (9) (7) (26)% (21)%
276 263 5% 4% Controllable costs‡ 198 183 9% 6% New business PVNBP VNB‡
Singapore 1,580 1,279 24% 19% 159 152 5% 2% China 718 650 10% 10% 43 42 1% 1% Other Asia (exc.FPI & Hong Kong) 406 279 45% 41% 8 — — —
2,704 2,208 22% 20% 210 194 9% 6% FPI 351 448 (22)% (22)% (1) (2) 7% 7% Hong Kong 2 — — — (3) (3) — —
3,057 2,656 15% 13% 206 189 9% 6%
1 During 2019 the Group adjusted operating profit APM has been revised and now includes the amortisation and impairment of internally generated intangible assets to better reflect the operational nature of these assets (see note B2(b)). Group adjusted operating profit continues to exclude amortisation and impairment of intangible assets acquired in business combinations. Comparative amounts have been restated. There is no impact on profit before tax.
2 Comparatives have also been reclassified to reallocate non-insurance operations to their respective market segments to better reflect the management of the underlying.
Overview We are focused on high potential markets in Singapore and China. All of our markets provide access to a combined population of over 3 billion people, with relatively low insurance penetration compared to Western markets. We currently provide life and health insurance solutions to over 5 million individuals across our markets in Asia.
During 2019, Asia Life delivered growth in VNB and operating profit whilst continuing to expand and strengthen its multi-channel platform. Singapore grew its distribution network with a total of 1,819 advisers as of 31 December 2019. Aviva-COFCO, our joint venture in China, continued to focus on its core agency channel, made a positive recovery from regulatory tightening in 2018 and paid its first dividend to Group.
Our FPI business and our business in Hong Kong are classified as held for sale at 31 December 2019.
All percentage movements below are quoted in constant currency unless otherwise stated.
Operating and financial performance Operating own funds generation, return on capital and operating capital generation‡ Asia Life Solvency II return on capital has increased by 3.0pp to 12.7% (2018: 9.7%), Solvency II own funds generation increased by £43 million to £187 million (2018: £144 million) and Solvency II operating capital generation has increased by £5 million to £60 million (2018: £55 million). The increase is primarily due to growth and beneficial non-economic assumption changes in Singapore.
Cash‡# Cash remitted to Group in 2019 has increased to £51 million (2018: £6 million), mainly attributable to improved performance in Singapore. China paid its first dividend to Group of £5 million (2018: £nil) in 2019.
Operating profit‡# Operating profit from our life and health businesses was £276 million (2018: £263 million). Excluding FPI and Hong Kong, operating profit increased by 29% to £157 million (2018: £119 million). Within this, Singapore’s result improved 14% to £145 million (2018: £123 million), with continued growth in our financial advisory channel, increasing new business volumes and improved profitability in health insurance. China’s profit improved by 18% to £25 million (2018: £22 million). Due to run-off of its existing business, operating profit for FPI was £128 million (2018: £151 million).

Divisional performance continued
Aviva plc Preliminary announcement 2019 26
Overview Analysis of assets Other information
IFRS Income, expenses & capital
6.iv – Asia Life continued Managed assets and net flows
2019
£m 2018
£m
Managed assets at 1 January 14,775 14,526 Premiums and deposits, net of reinsurance 927 898 Claims and redemptions, net of reinsurance (838) (431) Net flows 89 467 Market and other movements 274 (218)
Managed assets at 31 December 15,138 14,775
Singapore is the major contributor to Asia’s managed assets, which overall increased to £15,138 million (2018: £14,775 million) in 2019. Net inflows were £89 million (2018: £467 million) with higher sales and higher net claims and redemptions compared to 2018, mainly driven by Singapore. Following increased sales through the financial advisers distribution channel, Singapore also paid out more claims, mostly from product maturities during the year.
Controllable costs‡ Total controllable costs for Asia Life subsidiaries was £198 million (2018: £183 million). Excluding Hong Kong and FPI, controllable costs were £155 million (2018: £140 million). The increase was mainly to support Singapore’s financial adviser development initiative and organic channel growth across Asia.
New business Excluding Hong Kong and FPI, PVNBP increased by 20% to £2,704 million (2018: £2,208 million), and VNB increased by 6% to £210 million (2018: £194 million). The increases were led by double digit PVNBP growth in Singapore and China.

Life business profit drivers
Aviva plc Preliminary announcement 2019 27
Overview Analysis of assets Other information
IFRS Income, expenses & capital
7 – Life business profit drivers UK Life Europe Life Asia Life Total
2019
£m
Restated1
2018 £m
2019 £m
Restated1
2018 £m
2019 £m
Restated1 2018
£m 2019
£m
Restated1 2018
£m
New business income 919 772 299 309 317 300 1,535 1,381 Underwriting margin 287 382 250 196 97 103 634 681 Investment return 1,321 1,406 1,231 1,131 251 233 2,803 2,770
Total income 2,527 2,560 1,780 1,636 665 636 4,972 4,832 Acquisition expenses (407) (425) (302) (335) (250) (217) (959) (977) Administration expenses1 (797) (821) (588) (525) (115) (101) (1,500) (1,447)
Total expenses (1,204) (1,246) (890) (860) (365) (318) (2,459) (2,424) Other2 497 534 (84) 21 (17) (41) 396 514 Life business operating profit 1,820 1,848 806 797 283 277 2,909 2,922 Health business operating profit 35 38 21 10 (7) (14) 49 34
Total divisional operating profit 1,855 1,886 827 807 276 263 2,958 2,956 1 During 2019 the Group adjusted operating profit APM has been revised and now includes the amortisation and impairment of internally generated intangible assets to better reflect the operational nature of these assets (see
note B2(b)). Group adjusted operating profit continues to exclude amortisation and impairment of intangible assets acquired in business combinations. Comparative amounts have been restated. There is no impact on profit before tax.
2 Other represents DAC, changes in assumptions and modelling, non-recurring items and non-product specific items and excludes the total profit of £27 million (2018: loss of £3 million) for Aviva Investors’ Pooled Pensions and Aviva Life Reinsurance. Additionally, comparatives have been reclassified to reallocate non-insurance operations for Europe and Asia to their respective market segments to better reflect the management of the underlying businesses.
Income: New business income and underwriting margin
UK Life Europe Life Asia Life Total
2019
£m 2018
£m 2019
£m 2018
£m 2019
£m 2018
£m 2019
£m 2018
£m
New business income 919 772 299 309 317 300 1,535 1,381 Acquisition expenses (407) (425) (302) (335) (250) (217) (959) (977)
Net contribution 512 347 (3) (26) 67 83 576 404 APE (£m)1 4,056 3,444 1,495 1,381 429 359 5,980 5,184 As margin on APE (%) 13% 10% — (2)% 16% 23% 10% 8% Underwriting margin (£m) 287 382 250 196 97 103 634 681 Analysed by: Expenses 62 63 64 67 77 75 203 205 Mortality and longevity 225 319 157 122 34 30 416 471 Persistency — — 29 7 (14) (2) 15 5 1 APE excludes Retail Fund Management and Health business in Asia.
Income: Investment return
UK Life Europe Life Asia Life Total
2019
£m 2018
£m 2019
£m 2018
£m 2019
£m 2018
£m 2019
£m 2018
£m
Unit-linked margin (£m) 835 903 592 581 213 204 1,640 1,688 As annual management charge on average reserves (bps) 57 66 136 136 245 217 83 89 Average reserves (£bn)1 146.1 137.6 43.6 42.8 8.7 9.4 198.4 189.8 Participating business (£m)2 132 165 549 461 4 4 685 630 As bonus on average reserves (bps) 33 39 77 68 9 10 59 55 Average reserves (£bn)1 40.4 42.4 71.3 67.5 4.3 4.1 116.0 114.0 Spread margin (£m) 286 266 2 2 7 7 295 275 As spread margin on average reserves (bps) 42 40 4 4 33 37 39 38 Average reserves (£bn)1 67.7 65.8 4.9 4.5 2.1 1.9 74.7 72.2
Expected return on shareholder assets (£m)3 68 72 88 87 27 18 183 177
Total (£m) 1,321 1,406 1,231 1,131 251 233 2,803 2,770
Total average reserves (£bn)1 254.2 245.8 119.8 114.8 15.1 15.4 389.1 376.0 1 An average of the insurance or investment contract liabilities over the reporting period, including managed pension business which is not consolidated within the statement of financial position. 2 The shareholders’ share of the return on with- profits and other participating business. 3 The expected investment return based on opening economic assumptions applied to expected surplus assets over the reporting period that are not backing policyholder liabilities.
Expenses
UK Life Europe Life Asia Life Total
2019
£m
Restated1 2018
£m 2019
£m
Restated1
2018 £m
2019 £m
Restated1
2018 £m
2019 £m
Restated1 2018
£m
Acquisition expenses (£m) (407) (425) (302) (335) (250) (217) (959) (977) APE (£m)2 4,056 3,444 1,495 1,381 429 359 5,980 5,184 As acquisition expense ratio on APE (%) 10% 12% 20% 24% 58% 60% 16% 19%
Administration expenses (£m) (797) (821) (588) (525) (115) (101) (1,500) (1,447) As existing business expense ratio on average reserves (bps) 31 33 49 46 76 66 39 38 Total average reserves (£bn)3 254.2 245.8 119.8 114.8 15.1 15.4 389.1 376.0 1 During 2019 the Group adjusted operating profit APM has been revised and now includes the amortisation and impairment of internally generated intangible assets to better reflect the operational nature of these assets (see
note B2(b)). Group adjusted operating profit continues to exclude amortisation and impairment of intangible assets acquired in business combinations. There is no impact on profit before tax. Following the change in the definition of Group adjusted operating profit, administration expenses have also been restated to include the amortisation and impairment of internally generated intangible assets. Comparative amounts have been restated
2 APE excludes Retail Fund Management and Health business in Asia. 3 An average of the insurance or investment contract liabilities over the reporting period, including managed pension business which is not consolidated within the statement of financial position.
Aviva plc Preliminary announcement 2019 28
Overview Analysis of assets Other information
IFRS Income, expenses & capital
Financial supplement
Page A Income & expenses and IFRS capital 29 B IFRS financial statements and notes 38 C Analysis of assets 93 In this section A Income & expenses and IFRS capital Group adjusted operating profit Reconciliation of Group adjusted operating profit to profit for the year
29 29
A1 Other operations 30 A2 Corporate centre 30 A3 Group debt costs and other interest 30 A4 Life business: Investment variances
and economic assumption changes 31
A5 Non-life business: Short-term fluctuation in return on investments
33
A6 General insurance and health business: Economic assumption changes
34
A7 Impairment of goodwill, joint ventures , associates and other amounts expensed
34
A8 Amortisation and impairment of intangibles acquired in business combinations
34
A9 Amortisation and impairment of acquired value of in-force business
34
A10 Profit/loss on the disposal and remeasurement of subsidiaries, joint ventures and associates
34
A11 Other 34 A12 Net asset value 35 A13 Analysis of return on equity 36 A14 Group capital under IFRS basis 37

Income, expenses & capital
Aviva plc Preliminary announcement 2019 29
Overview Analysis of assets Other information
IFRS Income, expenses & capital
Group adjusted operating profit‡# For the year ended 31 December 2019
The table below reconciles Group adjusted operating profit as presented in Overview section 6 Divisional performance to Group adjusted operating profit as presented in note B6(a) Segmental information.
United Kingdom Europe
UK Life
£m UK GI
£m Canada
£m France
£m Poland
£m
Italy, Ireland &
Other £m
Asia £m
Aviva Investors
£m
Other Group
Activities £m
Total 2019
£m
Group adjusted operating profit before tax attributable to shareholders’ profits
UK Life and Investments, Savings & Retirement 1,855 — — — — — — 96 — 1,951 General Insurance — 250 191 65 20 69 (1) — — 594 Europe Life — — — 408 174 245 — — — 827 Asia Life — — — — — — 276 — — 276 Other Group operations (note A1) — — — — — — — — (26) (26) 1,855 250 191 473 194 314 275 96 (26) 3,622 Corporate centre (note A2) (183) Group debt costs and other interest (note A3) (255) Group adjusted operating profit before tax attributable to
shareholders’ profits 3,184
For the year ended 31 December 2018 – restated1,2
United Kingdom Europe
UK Life
£m UK GI
£m Canada
£m France
£m Poland
£m
Italy, Ireland,
Spain & Other
£m Asia £m
Aviva Investors
£m
Other Group
Activities £m
Total 2018
£m
Group adjusted operating profit before tax attributable to shareholders’ profits
UK Life and Investments, Savings & Retirement 1,886 — — — — — — 147 — 2,033 General Insurance — 383 27 92 21 88 (2) — — 609 Europe Life — — — 418 177 212 — — — 807 Asia Life — — — — — — 263 — — 263 Other Group operations (note A1) — — — — — — — 1 (213) (212)
1,886 383 27 510 198 300 261 148 (213) 3,500
Corporate centre (note A2) (216) Group debt costs and other interest (note A3) (280) Group adjusted operating profit before tax attributable to
shareholders’ profits 3,004 1 During 2019 the Group adjusted operating profit APM has been revised and now includes the amortisation and impairment of internally generated intangible assets to better reflect the operational nature of these assets (see
note B2(b)). Group adjusted operating profit continues to exclude amortisation and impairment of intangible assets acquired in business combinations. Comparative amounts have been restated resulting in a reduction in the prior period Group adjusted operating profit of £112 million. There is no impact on profit before tax.
2 Comparatives have been reclassified to reallocate non-insurance operations of Europe and Asia to their respective market segments to better reflect the management of the underlying businesses consistent with the segmental analysis shown in note B6(a).
Reconciliation of Group adjusted operating profit‡# to profit for the year
2019
£m
Restated1
2018 £m
Group adjusted operating profit before tax attributable to shareholders’ profits 3,184 3,004
Adjusted for the following: Life business: Investment variances and economic assumption changes (note A4) 654 (197) Non-life business: Short-term fluctuation in return on investments (note A5) 167 (476) General insurance and health business: Economic assumption changes (note A6) (54) 1 Impairment of goodwill, joint ventures, associates and other amounts expensed (note A7) (15) (13) Amortisation and impairment of intangibles acquired in business combinations (note A8) (87) (97) Amortisation and impairment of acquired value of in-force business (note A9) (406) (426) (Loss)/profit on the disposal and remeasurement of subsidiaries, joint ventures and associates (note A10) (22) 102 Other (note A11) (47) 231
Adjusting items before tax 190 (875)
Profit before tax attributable to shareholders’ profits 3,374 2,129 Tax on Group adjusted operating profit (668) (625) Tax on other activities (43) 183 (711) (442)
Profit for the year 2,663 1,687 1 During 2019 the Group adjusted operating profit APM has been revised and now includes the amortisation and impairment of internally generated intangible assets to better reflect the operational nature of these assets (see
note B2(b)). Group adjusted operating profit continues to exclude amortisation and impairment of intangible assets acquired in business combinations. Comparative amounts have been restated resulting in a reduction in the prior period Group adjusted operating profit of £112 million. There is no impact on profit before tax.

Income, expenses & capital continued
Aviva plc Preliminary announcement 2019 30
Overview Analysis of assets Other information
IFRS Income, expenses & capital
Other Group adjusted operating profit items A1 – Other operations
2019
£m
Restated1,2 2018
£m
Other Group operations (26) (212)
Total (26) (212) 1 During 2019 the Group adjusted operating profit APM has been revised and now includes the amortisation and impairment of internally generated intangible assets to better reflect the operational nature of these assets (see
note B2(b)). Group adjusted operating profit continues to exclude amortisation and impairment of intangible assets acquired in business combinations. Comparative amounts have been restated resulting in a reduction in the prior period other Group operations operating profit of £30 million. There is no impact on profit before tax.
2 Non-insurance operations relating to Europe and Asia have been reclassified to Europe Life, Asia Life and General Insurance to better reflect the management of the underlying businesses.
Other Group operations includes investment return on centrally held assets, the results of our internal reinsurance businesses and the results of other operations. Total loss in relation to other operations was £26 million (2018: £212 million).
Other Group operations includes net expenses of £15 million (2018 restated: £180 million) in relation to the Group’s UK digital business. The reduction of £165 million from 2018 reflects the alignment of the UK digital business with the UK Life and UK General Insurance businesses during the year.
A2 – Corporate centre
2019
£m 2018
£m
Project spend (30) (80) Central spend and share award costs (153) (136)
Total (183) (216)
Corporate centre costs of £183 million (2018: £216 million) decreased by £33 million mainly due to lower Group led project costs partly offset by an increase in central spend and share award costs.
A3 – Group debt costs and other interest
2019
£m 2018
£m
External debt Subordinated debt (336) (364) Other (15) (4)
Total external debt (351) (368) Internal lending arrangements 16 13 Net finance income on main UK pension scheme 80 75
Total (255) (280)
The reduction in subordinated debt costs is due to the redemption of two subordinated debt instruments in full at their first call date in 2018. The increase in other external debt costs is due to the issuance of new senior notes in the last quarter of 2018.

Income, expenses & capital continued
Aviva plc Preliminary announcement 2019 31
Overview Analysis of assets Other information
IFRS Income, expenses & capital
Non-operating profit items A4 – Life business: Investment variances and economic assumption changes (a) Definitions Group adjusted operating profit for life business is based on expected long-term investment returns on financial investments backing shareholder funds over the period, with consistent allowance for the corresponding expected movements in liabilities. Group adjusted operating profit includes the effect of variance in experience for operating items, such as mortality, persistency and expenses, and the effect of changes in operating assumptions. Changes due to economic items, such as market value movements and interest rate changes, which give rise to variances between actual and expected investment returns, and the impact of changes in economic assumptions on liabilities, are disclosed separately outside Group adjusted operating profit, in investment variances and economic assumption changes.
(b) Methodology The expected investment returns and corresponding expected movements in life business liabilities are calculated separately for each principal life business unit.
The expected return on investments for both policyholders’ and shareholders’ funds is based on opening economic assumptions applied to the expected funds under management over the reporting period. Expected investment return assumptions are derived actively, based on market yields on risk-free fixed interest assets at the end of each financial year. The same margins are applied on a consistent basis across the Group to gross risk-free yields, to obtain investment return assumptions for equity and property. Expected funds under management are equal to the opening value of funds under management, adjusted for sales and purchases during the period arising from expected operating experience.
The actual investment return is affected by differences between the actual and expected funds under management and changes in asset mix, as well as movements in interest rates. To the extent that these differences arise from the operating experience of the life business, or management decisions to change asset mix, the effect is included in the Group adjusted operating profit. The residual difference between actual and expected investment return is included in investment variances, outside Group adjusted operating profit but included in profit before tax.
The movement in liabilities included in Group adjusted operating profit reflects both the change in liabilities due to the expected return on investments and the impact of experience variances and assumption changes for non-economic items. This would include movements in liabilities due to changes in the discount rate arising from discretionary management decisions that impact on product profitability over the lifetime of products.
The effect of differences between actual and expected economic experience on liabilities, and changes to economic assumptions used to value liabilities, are taken outside Group adjusted operating profit. For many types of life business, including unit-linked and with-profits funds, movements in asset values are offset by corresponding changes in liabilities, limiting the net impact on profit. The profit impact of economic volatility on other life business depends on the degree of matching of assets and liabilities, and exposure to financial options and guarantees.
(c) Assumptions The expected rate of investment return is determined using consistent assumptions at the start of the period between operations, having regard to local economic and market forecasts of investment return and asset classification under IFRS.
The principal assumptions underlying the calculation of the expected investment return for equity and property are:
Equity Property
2019 2018 2019 2018
United Kingdom 4.9% 4.8% 3.4% 3.3% Eurozone 4.3% 4.4% 2.8% 2.9%
The expected return on equity and property has been calculated by reference to the ten-year mid-price swap rate for an AA rated bank in the relevant currency plus a risk premium. The use of risk premium reflects management’s long-term expectations of asset return in excess of the swap yield from investing in different asset classes. The asset risk premiums are set out in the table below:
All territories 2019 2018
Equity risk premium 3.5% 3.5% Property risk premium 2.0% 2.0%
The ten-year mid-price swap rates at the start of the period are set out in the table below:
Territories 2019 2018
United Kingdom 1.4% 1.3% Eurozone 0.8% 0.9%
For fixed interest securities classified as fair value through profit or loss, the expected investment returns are based on average prospective yields for the actual assets held less an adjustment for credit risk (assessed on a best estimate basis). This includes an adjustment for credit risk on all eurozone sovereign debt. Where such securities are classified as available for sale, the expected investment return comprises the expected interest or dividend payments and amortisation of the premium or discount at purchase.

Income, expenses & capital continued
Aviva plc Preliminary announcement 2019 32
Overview Analysis of assets Other information
IFRS Income, expenses & capital
Non-operating profit items continued (d) Investment variances and economic assumption changes The investment variances and economic assumption changes excluded from the life adjusted operating profit are as follows:
Life business 2019
£m 2018
£m
Investment variances and economic assumptions 654 (197)
Investment variances and economic assumption changes were £654 million (2018: £197 million negative). This is primarily due to the UK where there was a positive variance as a result of a reduction in yields, a narrowing of fixed income spreads and a consequent impact from economic assumption changes, including an alignment of methodology across the UK, partially offset by the impact of increases in equities. The impact of yields and equities reflect the fact that we hedge on an economic rather than on an IFRS basis.
The Group continues to keep under review the allowance in our assumptions for future property prices and rental income in relation to our commercial and equity release mortgages, and for the possible adverse impact including but not limited to the ultimate arrangements regarding the UK’s exit from the European Union. At 31 December 2019 this allowance has been determined in line with previous periods and is estimated at £0.4 billion. As more clarity is provided on the terms of the UK’s exit from the European Union, the Group will look to establish core property assumptions without an explicit allowance for Brexit uncertainty.
The variance in 2018 was primarily due to negative variances in the UK and Italy. In the UK, these variances were mainly due to an increase in yields, the widening of corporate bond spreads and an increase in the allowance for the possible adverse impact of the decision for the UK to leave the European Union, partially offset by the beneficial impact of our equity hedges. The negative variance in Italy was primarily driven by a widening of sovereign credit spreads and a fall in equity markets.

Income, expenses & capital continued
Aviva plc Preliminary announcement 2019 33
Overview Analysis of assets Other information
IFRS Income, expenses & capital
A5 – Non-life business: Short-term fluctuation in return on investments (a) Definitions Group adjusted operating profit for non-life business is based on an expected long-term investment return over the period. Any variance between the total investment return (including realised and unrealised gains) and the expected return over the period is disclosed separately outside Group adjusted operating profit, in short-term fluctuations.
(b) Methodology The long-term investment return is calculated separately for each principal non-life market. In respect of equities and investment properties, the return is calculated by multiplying the opening market value of the investments, adjusted for sales and purchases during the year, by the long-term rate of investment return.
The long-term rate of investment return is determined using consistent assumptions between operations, having regard to local economic and market forecasts of investment return. The allocated long-term return for other investments (including debt securities) is the actual income receivable for the year. Actual income and long-term investment return both contain the amortisation of the discounts/premium arising on the acquisition of fixed income securities. For other operations, the long-term return reflects assets backing non-life business held in Group centre investments.
Market value movements which give rise to variances between actual and long-term investment returns are disclosed separately in short-term fluctuations outside Group adjusted operating profit.
The impact of realised and unrealised gains and losses on Group centre investments, including the centre hedging programme which is designed to economically protect the total Group’s capital against adverse equity and foreign exchange movements, is included in short-term fluctuations on other operations.
(c) Assumptions The principal assumptions underlying the calculation of the long-term investment return are:
The long-term rates of return on equities and properties have been calculated by reference to the ten-year mid-price swap rate for an AA rated bank in the relevant currency plus a risk premium. The underlying reference rates and risk premiums for the United Kingdom and Eurozone are shown in note A4(c).
(d) Analysis of investment return The total investment income on our non-life business, including short-term fluctuations, are as follows:
General Insurance and health 2019
£m 2018
£m
Analysis of investment income: – Net investment income 622 63 – Foreign exchange gains/(losses) and other charges 55 (8)
677 55
Analysed between: – Long-term investment return, reported within Group adjusted operating profit 381 370 – Short-term fluctuations in investment return, reported outside Group adjusted operating profit 296 (315) 677 55
Short-term fluctuations: – General insurance and health 296 (315) – Other operations1 (129) (161) Total short-term fluctuations 167 (476) 1 Other operations represents short-term fluctuations on assets backing non-life business in Group centre investments, including the centre hedging programme.
The short-term fluctuations during 2019 of £167 million favourable is primarily due to strong market conditions across all our major markets. This resulted in significant gains on equities plus gains on fixed income securities driven by interest rates falling and a narrowing of credit spreads. These gains are partly offset by losses on hedges held by the Group, including the Group centre hedging programme, and other adverse movements on centre holdings. The short-term fluctuations during 2018 of £476 million adverse were primarily due to adverse market conditions across most of our major markets. This resulted in losses on fixed income securities driven by interest rate increases and widening credit spreads plus significant falls in equities and other adverse market movements on Group centre holdings.
Long-term rate of return on equities
Long-term rate of return on property
2019 2018 2019 2018
United Kingdom 4.9% 4.8% 3.4% 3.3% Eurozone 4.3% 4.4% 2.8% 2.9% Canada 6.0% 5.9% 4.5% 4.4%

Income, expenses & capital continued
Aviva plc Preliminary announcement 2019 34
Overview Analysis of assets Other information
IFRS Income, expenses & capital
A6 – General insurance and health business: Economic assumption changes In the general insurance and health business, there is a negative impact of £54 million (2018: £1 million positive) primarily as a result of a decrease in interest rates used to discount claims reserves for both periodic payment orders and latent claims.
A7 – Impairment of goodwill, joint ventures, associates and other amounts expensed Impairment of goodwill, associates and joint ventures and other amounts expensed in the year is a charge of £15 million (2018: £13 million charge). This includes a £9 million impairment charge relating to the Group’s associate in India.
A8 – Amortisation and impairment of intangibles acquired in business combinations Following a change in the definition of the Group adjusted operating profit APM, Group adjusted operating profit now excludes only the amortisation and impairment of intangible assets acquired in business combinations. The amortisation and impairment of intangible assets acquired in business combinations decreased to a charge of £87 million (2018: £97 million charge) due to intangible assets which were amortised in full in 2018.
A9 – Amortisation and impairment of acquired value of in-force business Amortisation of acquired value of in-force business (AVIF) is a charge of £406 million (2018: £426 million charge), which relates solely to amortisation in respect of the Group’s subsidiaries and joint ventures. Impairment charges of £28 million in relation to Friends Provident International Limited (FPI) remeasurement losses are recorded within profit/loss on disposal and remeasurement of subsidiaries, joint ventures and associates. See note A10.
A10 – Profit/loss on the disposal and remeasurement of subsidiaries, joint ventures and associates The total Group loss on disposal and remeasurement of subsidiaries, joint ventures and associates is £22 million (2018: £102 million profit). This consists of £6 million gains on small disposals, and a £28 million remeasurement loss in relation to FPI. Further details of these items are provided in note B5.
A11 – Other Other items are those items that, in the directors’ view, are required to be separately disclosed by virtue of their nature or incidence to enable a full understanding of the Group’s financial performance. At 31 December 2019, other items is a charge of £47 million (2018: £231 million gain), which comprises the following: • A charge of £45 million in relation to a change in the discount rate used for estimating lump sum payments in settlement of bodily injury
claims. Following the announcement by the Lord Chancellor on 15 July 2019 to increase the Ogden discount rate from the -0.75% set in 2017 to -0.25% (rate retained at -0.75% in Scotland), balance sheet reserves in the UK have been calculated using a discount rate of -0.25% at 31 December 2019. At 31 December 2018, balance sheet reserves were calculated using a rate of 0.00%. See note B11; and
• A charge of £2 million relating to the negative goodwill which arose on the acquisition of Friends First on 1 June 2018. An adjustment to the acquisition balance sheet of £2 million has been made in 2019, resulting in a corresponding decrease in the negative goodwill previously recognised.

Income, expenses & capital continued
Aviva plc Preliminary announcement 2019 35
Overview Analysis of assets Other information
IFRS Income, expenses & capital
IFRS capital A12 – Net asset value
2019
£m pence per
share2
Restated 2018
£m
Restated pence
per share2
Equity attributable to shareholders of Aviva plc at 1 January1 16,558 424p 16,969 423p Adjustment at 1 January for adoption of IFRS 163 (110) (3)p — —
Equity attributable to shareholders of Aviva plc at 1 January restated1 16,448 421p 16,969 423p Group adjusted operating profit 3,184 80p 3,004 77p Investment return variances and economic assumption changes on life and non-life business 767 19p (672) (17)p Profit on the disposal and remeasurements of subsidiaries, joint ventures and associates (22) (1)p 102 2p Goodwill impairment and amortisation of intangibles (102) (3)p (110) (3)p Amortisation and impairment of acquired value of in-force business (406) (10)p (426) (11)p Other4 (47) (1)p 231 6p Tax on operating profit and on other activities (711) (18)p (442) (11)p Non-controlling interests (115) (3)p (119) (3)p
Profit after tax attributable to shareholders of Aviva plc 2,548 63p 1,568 40p AFS securities fair value and other reserve movements 41 1p (24) (1)p Ordinary dividends (1,184) (30)p (1,128) (29)p Direct capital instrument and tier 1 notes interest and preference share dividend (51) (1)p (53) (1)p Foreign exchange rate movements (170) (4)p (2) — Remeasurements of pension schemes (763) (19)p (236) (6)p Shares purchased in buy-back — — (600) (15)p Other net equity movements 139 3p 64 13p
Equity attributable to shareholders of Aviva plc at 31 December1 17,008 434p 16,558 424p 1 Excluding preference shares of £200 million (2018: £200 million). 2 Number of shares as at 31 December 2019: 3,921 million (2018: 3,902 million). 3 The Group has adopted IFRS 16 Leases from 1 January 2019. In line with the transition options available, prior period comparatives have not been restated and the impact of the adoption has been shown as an adjustment
to opening retained earnings. See note B1 for further information. 4 Other in 2019 relates to a charge of £45 million in relation to a change in the discount rate used for estimating lump sum payments in settlement of bodily injury claims (see note B11) and a charge of £2 million relating to negative
goodwill which arose on the acquisition of Friends First (see note A11). Other in 2018 includes a movement in the discount rate used for estimating lump sum payments in the settlement of bodily injury claims which resulted in a gain of £190 million, a provision release of £78 million relating to the sale of Aviva USA in 2013, a gain of £36 million relating to negative goodwill on the acquisition of Friends First, a charge of £63 million relating to the UK defined benefit pension scheme as a result of the requirements to equalise members’ benefits of the effects of Guaranteed Minimum Pension and a charge of £10 million relating to goodwill payments to preference shareholders, which was announced on the 30 April 2018, and associated administration costs.
At 31 December 2019, IFRS net asset value per share was 434 pence (2018: 424 pence). The increase was mainly due to operating profit and favourable investment return variances (see notes A4 and A5), partly offset by dividend payments to shareholders and higher pension scheme remeasurements (see note B18).
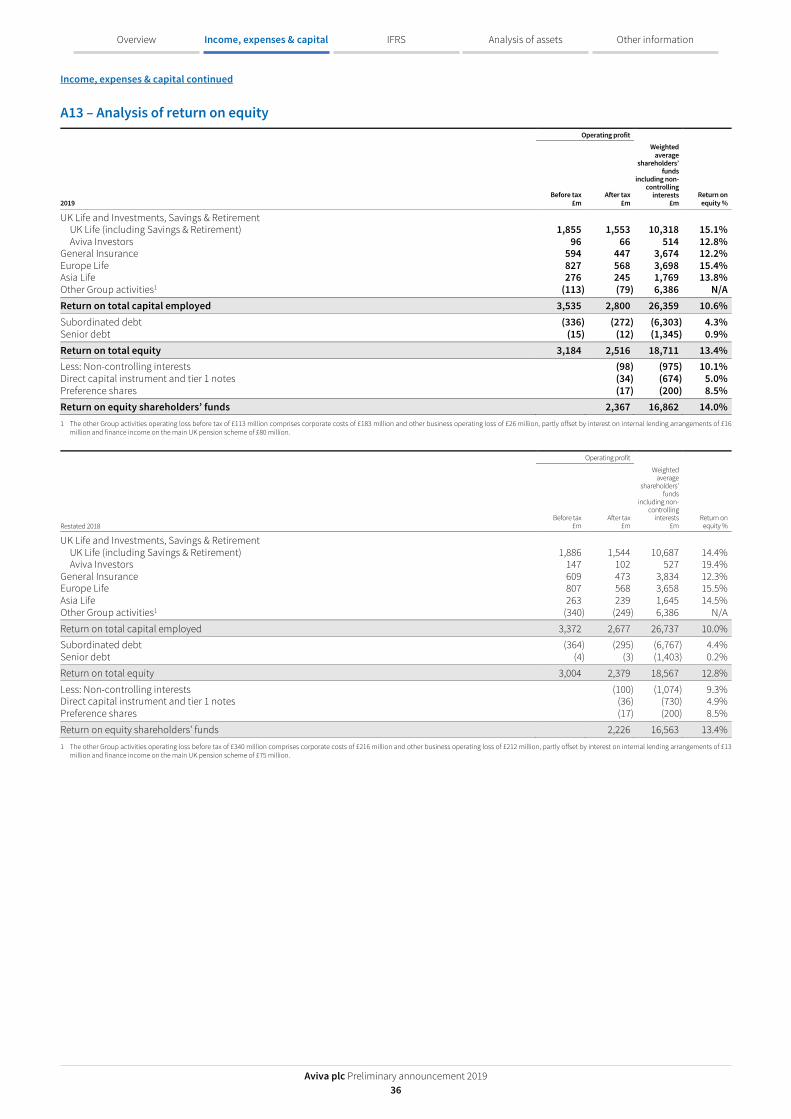
Income, expenses & capital continued
Aviva plc Preliminary announcement 2019 36
Overview Analysis of assets Other information
IFRS Income, expenses & capital
A13 – Analysis of return on equity Operating profit
2019 Before tax
£m After tax
£m
Weighted average
shareholders’ funds
including non-controlling
interests £m
Return on equity %
UK Life and Investments, Savings & Retirement UK Life (including Savings & Retirement) 1,855 1,553 10,318 15.1% Aviva Investors 96 66 514 12.8%
General Insurance 594 447 3,674 12.2% Europe Life 827 568 3,698 15.4% Asia Life 276 245 1,769 13.8% Other Group activities1 (113) (79) 6,386 N/A Return on total capital employed 3,535 2,800 26,359 10.6% Subordinated debt (336) (272) (6,303) 4.3% Senior debt (15) (12) (1,345) 0.9% Return on total equity 3,184 2,516 18,711 13.4% Less: Non-controlling interests (98) (975) 10.1% Direct capital instrument and tier 1 notes (34) (674) 5.0% Preference shares (17) (200) 8.5% Return on equity shareholders’ funds 2,367 16,862 14.0% 1 The other Group activities operating loss before tax of £113 million comprises corporate costs of £183 million and other business operating loss of £26 million, partly offset by interest on internal lending arrangements of £16
million and finance income on the main UK pension scheme of £80 million.
Operating profit
Restated 2018 Before tax
£m After tax
£m
Weighted average
shareholders’ funds
including non-controlling
interests £m
Return on equity %
UK Life and Investments, Savings & Retirement UK Life (including Savings & Retirement) 1,886 1,544 10,687 14.4% Aviva Investors 147 102 527 19.4%
General Insurance 609 473 3,834 12.3% Europe Life 807 568 3,658 15.5% Asia Life 263 239 1,645 14.5% Other Group activities1 (340) (249) 6,386 N/A
Return on total capital employed 3,372 2,677 26,737 10.0% Subordinated debt (364) (295) (6,767) 4.4% Senior debt (4) (3) (1,403) 0.2%
Return on total equity 3,004 2,379 18,567 12.8%
Less: Non-controlling interests (100) (1,074) 9.3% Direct capital instrument and tier 1 notes (36) (730) 4.9% Preference shares (17) (200) 8.5%
Return on equity shareholders’ funds 2,226 16,563 13.4% 1 The other Group activities operating loss before tax of £340 million comprises corporate costs of £216 million and other business operating loss of £212 million, partly offset by interest on internal lending arrangements of £13
million and finance income on the main UK pension scheme of £75 million.

Income, expenses & capital continued
Aviva plc Preliminary announcement 2019 37
Overview Analysis of assets Other information
IFRS Income, expenses & capital
A14 – Group capital under IFRS basis The table below shows how our capital is deployed by market and how that capital is funded.
31 December 2019 Capital
employed £m
31 December 2018 Capital
employed £m
UK Life and Investments, Savings & Retirement UK Life (including Savings & Retirement) 10,751 10,388 Aviva Investors 512 541
General Insurance1 3,603 3,754 Europe Life 3,663 3,665 Asia Life 1,749 1,702 Other Group activities1,2 5,903 6,104
Total capital employed 26,181 26,154
Financed by Equity shareholders’ funds 17,008 16,558 Non-controlling interests 977 966 Direct capital instrument and tier 1 notes 500 731 Preference shares 200 200 Subordinated debt3 6,206 6,335 Senior debt 1,290 1,364 Total capital employed4 26,181 26,154 1 Capital employed for United Kingdom General Insurance excludes c.£0.9 billion (2018: c.£0.9 billion) of goodwill which does not support the general insurance business for capital purposes and is included in other Group activities. 2 Other Group activities include centrally held tangible net assets, the main UK staff pension scheme surplus and also reflect internal lending arrangements. These internal lending arrangements, which net out on consolidation,
include the formal loan arrangement between Aviva Group Holdings Limited and Aviva Insurance Limited. 3 Subordinated debt excludes amounts held by Group companies of £nil (2018: £5 million). 4 Goodwill, AVIF and other intangibles are maintained within the capital base. Goodwill includes goodwill in subsidiaries of £1,855 million (2018: £1,872 million) and goodwill in joint ventures of £11 million (2018: £13 million).
AVIF and other intangibles comprise £2,800 million (2018: £3,201 million) of intangibles in subsidiaries and £27 million (2018: £33 million) of intangibles in joint ventures, net of deferred tax liabilities of £(413) million (2018: £(475) million) and the non-controlling interest share of intangibles of £(28) million (2018: £(31) million).
Total capital employed is financed by a combination of equity shareholders’ funds, preference capital, subordinated debt and other borrowings.
On 21 November 2019, the Group redeemed its £210 million 6.875% Step-up Tier One Capital Securities (STICS) in full at the first call date.
At 31 December 2019 the market value of our external debt (subordinated debt and senior debt), preference shares (including both Aviva plc preference shares of £200 million and General Accident plc preference shares, within non-controlling interests, of £250 million), and direct capital instrument and Tier 1 notes was £9,764 million (2018: £9,278 million).
Aviva plc Preliminary announcement 2019 38
Overview Analysis of assets Other information
IFRS Income, expenses & capital
IFRS financial statements
In this section Page Consolidated financial statements Consolidated income statement 39 Consolidated statement of comprehensive income 40 Consolidated statement of changes in equity 41 Consolidated statement of financial position 42 Consolidated statement of cash flows 43 Notes to the consolidated financial statements
B1 Basis of preparation 44 B2 Changes to the comparative amounts 47 B3 Exchange rates 48 B4 Subsidiaries, joint ventures and associates –
acquisitions 48
B5 Subsidiaries, joint ventures and associates – disposals and held for sale
48
B6 Segmental information 50 B7 Tax 55 B8 Earnings per share 57 B9 Dividends and appropriations 58 B10 Contracted liabilities and associated reinsurance 59 B11 Insurance liabilities 60 B12 Insurance liabilities methodology and assumptions 65 B13 Liability for investment contracts 69 B14 Reinsurance assets 71 B15 Effect of changes in assumptions and estimates
during the year 73
B16 Unallocated divisible surplus 74 B17 Borrowings 74 B18 Pension obligations 75 B19 Related party transactions 77
B20 Risk management 78 B21 Direct capital instrument and tier 1 notes 90 B22 Cash and cash equivalents 90 B23 Contingent liabilities and other risk factors 91 B24 Acquired value of in-force business and intangible
assets 92
B25 Subsequent events 92

Consolidated financial statements
Aviva plc Preliminary announcement 2019 39
Overview Analysis of assets Other information
IFRS Income, expenses & capital
Consolidated income statement For the year ended 31 December 2019
Note 2019
£m
Restated1 2018
£m
Income Gross written premiums 31,243 28,659 Premiums ceded to reinsurers (3,563) (2,326)
Premiums written net of reinsurance 27,680 26,333 Net change in provision for unearned premiums (209) (81)
Net earned premiums 27,471 26,252 Fee and commission income 2,141 2,178 Net investment income/(expense) 40,577 (10,912) Share of profit after tax of joint ventures and associates 85 112 (Loss)/profit on the disposal and remeasurement of subsidiaries, joint ventures and associates B5(a) (22) 102
70,252 17,732
Expenses Claims and benefits paid, net of recoveries from reinsurers (23,096) (23,142) Change in insurance liabilities, net of reinsurance B10(b) (5,702) 6,246 Change in investment contract provisions (24,095) 5,321 Change in unallocated divisible surplus B16 (3,985) 3,237 Fee and commission expense (5,536) (3,326) Other expenses (3,329) (3,843) Finance costs (576) (573) (66,319) (16,080)
Profit before tax 3,933 1,652
Tax attributable to policyholders’ returns B7(d) (559) 477
Profit before tax attributable to shareholders’ profits 3,374 2,129 Tax (expense)/credit B7(d) (1,270) 35 Less: tax attributable to policyholders’ returns B7(d) 559 (477) Tax attributable to shareholders’ profits B7(d) (711) (442)
Profit for the year 2,663 1,687 Attributable to: Equity holders of Aviva plc 2,548 1,568 Non-controlling interests 115 119
Profit for the year 2,663 1,687
Earnings per share B8 Basic (pence per share) 63.8 38.2 Diluted (pence per share) 63.1 37.8 1 Following a review of the Group’s presentation of consolidated investment funds, comparative amounts have been restated from those previously reported. The restatement has had no impact on the profit for the year or equity.
See note B2(a) for further information.

Consolidated financial statements continued
Aviva plc Preliminary announcement 2019 40
Overview Analysis of assets Other information
IFRS Income, expenses & capital
Consolidated statement of comprehensive income For the year ended 31 December 2019
Note 2019
£m 2018
£m
Profit for the year 2,663 1,687 Other comprehensive income: Items that may be reclassified subsequently to income statement Investments classified as available for sale
Fair value gains 39 57 Fair value gains transferred to profit on disposals (19) (78)
Share of other comprehensive income/(loss) of joint ventures and associates 22 (10) Foreign exchange rate movements (219) 5 Aggregate tax effect – shareholder tax on items that may be reclassified subsequently to income statement B7(b) 6 8 Items that will not be reclassified to income statement
Owner-occupied properties – fair value gains 3 1 Remeasurements of pension schemes (867) (279) Aggregate tax effect – shareholder tax on items that will not be reclassified subsequently to income statement B7(b) 103 43
Total other comprehensive income, net of tax (932) (253)
Total comprehensive income for the year 1,731 1,434
Attributable to: Equity holders of Aviva plc 1,655 1,310 Non-controlling interests 76 124
1,731 1,434

Consolidated financial statements continued
Aviva plc Preliminary announcement 2019 41
Overview Analysis of assets Other information
IFRS Income, expenses & capital
Consolidated statement of changes in equity For the year ended 31 December 2019
Ordinary share
capital £m
Preference share
capital £m
Capital reserves1
£m
Treasury shares
£m
Currency translation
reserve £m
Other reserves
£m
Retained earnings
£m
DCI and tier 1
notes £m
Total equity
excluding non-
controlling interests
£m
Non-controlling
interests £m
Total equity
£m
Balance at 1 January 975 200 10,232 (15) 1,122 (279) 4,523 731 17,489 966 18,455 Adjustment at 1 January for adoption of IFRS 162 — — — — — — (110) — (110) — (110) Balance at 1 January restated2 975 200 10,232 (15) 1,122 (279) 4,413 731 17,379 966 18,345 Profit for the year — — — — — — 2,548 — 2,548 115 2,663 Other comprehensive income — — — — (308) 178 (763) — (893) (39) (932) Total comprehensive income for the year — — — — (308) 178 1,785 — 1,655 76 1,731 Dividends and appropriations — — — — — — (1,244) — (1,244) — (1,244) Non-controlling interests share of dividends declared in the
year — — — — — — — — — (63) (63) Reclassification of tier 1 notes to financial liabilities3 — — — — — — 21 (231) (210) — (210) Reserves credit for equity compensation plans — — — — — 62 — — 62 — 62 Shares issued under equity compensation plans 5 — 25 (5) — (62) 55 — 18 — 18 Treasury shares held by subsidiary companies — — — 13 — — — — 13 — 13 Forfeited dividend income — — — — — — 4 — 4 — 4 Changes in non-controlling interests in subsidiaries — — — — — — — — — (2) (2) Change in equity accounted option — — — — — — 22 — 22 — 22 Shares purchased in buy-back — — — — — — — — — — — Transfer to profit on disposal of subsidiaries, joint ventures
and associates — — — — — — — — — — — Capital contributions from non-controlling interests — — — — — — — — — — — Aggregate tax effect – shareholder tax — — — — — — 9 — 9 — 9 Balance at 31 December 980 200 10,257 (7) 814 (101) 5,065 500 17,708 977 18,685 1 Capital reserves consist of share premium of £1,239 million, a capital redemption reserve of £44 million and a merger reserve of £8,974 million. 2 The Group adopted IFRS 16 Leases from 1 January 2019. In line with the transition options available, prior period comparatives have not been restated and the impact of the adoption has been shown as an adjustment to opening
retained earnings. See note B1(a) for further information. 3 On 17 October 2019, notification was given that the Group would redeem the 6.875% £210 million tier 1 notes. At that date, the instrument was reclassified as a financial liability of £210 million, representing its fair value at that
date. On 21 November 2019, the instrument was redeemed in full at a cost of £210 million. The difference between its carrying amount of £231 million and fair value of £210 million has been charged to retained earnings.
For the year ended 31 December 2018
Ordinary share
capital £m
Preference share
capital £m
Capital reserves1
£m
Treasury shares
£m
Currency translation
reserve £m
Other reserves
£m
Retained earnings
£m
DCI and tier 1
notes £m
Total equity
excluding non-
controlling interests
£m
Non-controlling
interests £m
Total equity
£m
Balance at 1 January 1,003 200 10,195 (14) 1,141 (274) 4,918 731 17,900 1,235 19,135 Profit for the year — — — — — — 1,568 — 1,568 119 1,687 Other comprehensive income — — — — 28 (50) (236) — (258) 5 (253) Total comprehensive income for the year — — — — 28 (50) 1,332 — 1,310 124 1,434 Dividends and appropriations — — — — — — (1,189) — (1,189) — (1,189) Non-controlling interests share of dividends declared in the
year — — — — — — — — — (90) (90) Reclassification of tier 1 notes to financial liabilities — — — — — — — — — — — Reserves credit for equity compensation plans — — — — — 64 — — 64 — 64 Shares issued under equity compensation plans 2 — 7 (1) — (55) 49 — 2 — 2 Treasury shares held by subsidiary companies — — — — — — — — — — — Forfeited dividend income — — — — — — 4 — 4 — 4 Changes in non-controlling interests in subsidiaries — — — — (7) — 1 — (6) (306) (312) Change in equity accounted option — — — — — — — — — — — Shares purchased in buy-back2 (30) — 30 — — — (600) — (600) — (600) Transfer to profit on disposal of subsidiaries, joint ventures
and associates — — — — (40) 36 — — (4) — (4) Capital contributions from non-controlling interests — — — — — — — — — 3 3 Aggregate tax effect – shareholder tax — — — — — — 8 — 8 — 8
Balance at 31 December 975 200 10,232 (15) 1,122 (279) 4,523 731 17,489 966 18,455 1 Capital reserves consist of share premium of £1,214 million, a capital redemption reserve of £44 million and a merger reserve of £8,974 million. 2 On 1 May 2018, the Group announced a share buy-back of ordinary shares for an aggregate purchase price of up to £600 million. On completion in 2018 of this buy-back, £600 million of shares had been purchased and shares
with a nominal value of £30 million have been cancelled, giving rise to an additional capital redemption reserve of an equivalent amount.

Consolidated financial statements continued
Aviva plc Preliminary announcement 2019 42
Overview Analysis of assets Other information
IFRS Income, expenses & capital
Consolidated statement of financial position As at 31 December 2019
Note 2019
£m
Restated1 2018
£m
Restated1 1 January
2018 £m
Assets Goodwill 1,855 1,872 1,876 Acquired value of in-force business and intangible assets B24 2,800 3,201 3,455 Interests in, and loans to, joint ventures 1,227 1,214 1,221 Interests in, and loans to, associates 304 304 421 Property and equipment 889 548 509 Investment property 11,203 11,482 10,797 Loans 38,579 36,184 37,227 Financial investments 343,418 319,825 331,690 Reinsurance assets B14 12,356 11,755 13,492 Deferred tax assets 151 185 144 Current tax assets 132 76 94 Receivables 8,995 8,639 8,151 Deferred acquisition costs 3,156 2,965 2,906 Pension surpluses and other assets 2,799 3,341 3,468 Prepayments and accrued income 3,143 3,149 3,117 Cash and cash equivalents 19,524 15,926 13,377 Assets of operations classified as held for sale B5(b) 9,512 8,855 10,871
Total assets 460,043 429,521 442,816
Equity Capital
Ordinary share capital 980 975 1,003 Preference share capital 200 200 200
1,180 1,175 1,203 Capital reserves
Share premium 1,239 1,214 1,207 Capital redemption reserve 44 44 14 Merger reserve 8,974 8,974 8,974
10,257 10,232 10,195 Treasury shares (7) (15) (14) Currency translation reserve 814 1,122 1,141 Other reserves (101) (279) (274) Retained earnings 5,065 4,523 4,918 Equity attributable to shareholders of Aviva plc 17,208 16,758 17,169 Direct capital instrument and tier 1 notes B21 500 731 731
Equity excluding non-controlling interests 17,708 17,489 17,900 Non-controlling interests 977 966 1,235
Total equity 18,685 18,455 19,135 Liabilities Gross insurance liabilities B11 149,338 144,077 148,650 Gross liabilities for investment contracts B13 222,127 202,468 203,986 Unallocated divisible surplus B16 9,597 5,949 9,082 Net asset value attributable to unitholders 16,610 16,338 18,176 Pension deficits and other provisions 1,565 1,399 1,429 Deferred tax liabilities 2,155 1,885 2,377 Current tax liabilities 569 254 290 Borrowings B17 9,039 9,420 10,286 Payables and other financial liabilities 18,138 17,681 16,676 Other liabilities 3,094 3,074 2,856 Liabilities of operations classified as held for sale B5(b) 9,126 8,521 9,873
Total liabilities 441,358 411,066 423,681
Total equity and liabilities 460,043 429,521 442,816 1 Following a review of the Group’s presentation of consolidated investment funds, comparative amounts have been restated from those previously reported. The restatement has had no impact on the profit for the year or equity.
See note B2(a) for further information.

Consolidated financial statements continued
Aviva plc Preliminary announcement 2019 43
Overview Analysis of assets Other information
IFRS Income, expenses & capital
Consolidated statement of cash flows For the year ended 31 December 2019
The cash flows presented in this statement cover all the Group’s activities and include flows from both policyholder and shareholder activities. All cash and cash equivalents are available for use by the Group.
Note 2019
£m
Restated1 2018
£m
Cash flows from operating activities2 Cash generated from operating activities 6,517 5,848 Tax paid (549) (447)
Total net cash from operating activities 5,968 5,401 Cash flows from investing activities Acquisitions of, and additions to, subsidiaries, joint ventures and associates, net of cash acquired (19) 192 Disposals of subsidiaries, joint ventures and associates, net of cash transferred 12 381 Purchases of property and equipment (84) (87) Proceeds on sale of property and equipment 4 15 Purchases of intangible assets (63) (64)
Total net cash (used in)/from investing activities (150) 437
Cash flows from financing activities Proceeds from issue of ordinary shares 27 8 Shares purchased in buy-back — (600) Treasury shares purchased for employee trusts (9) (4) New borrowings drawn down, net of expenses 580 3,148 Repayment of borrowings3 (927) (4,181) Net repayment of borrowings B17(b) (347) (1,033) Interest paid on borrowings (553) (551) Preference dividends paid B9 (17) (17) Ordinary dividends paid B9 (1,184) (1,128) Forfeited dividend income 4 4 Coupon payments on direct capital instrument and tier 1 notes B9 (43) (44) Capital contributions from non-controlling interests of subsidiaries — 3 Dividends paid to non-controlling interests of subsidiaries (63) (90) Other4 (5) (13) Total net cash used in financing activities (2,190) (3,465)
Total net increase in cash and cash equivalents 3,628 2,373 Cash and cash equivalents at 1 January 16,051 13,617 Effect of exchange rate changes on cash and cash equivalents (245) 61
Cash and cash equivalents at 31 December 19,434 16,051 1 Following a review of the Group’s presentation of consolidated investment funds, comparative amounts have been restated from those previously reported. The restatement has had no impact on the profit for the year or equity.
See note B2(a) for further information. 2 Cash flows from operating activities include interest received of £5,834 million (2018 restated: £5,758 million) and dividends received of £5,614 million (2018 restated: £4,880 million). 3 2019 includes the redemption of 6.875% £210 million tier 1 notes. 2018 includes the redemption of €500 million 6.875% subordinated notes and $575 million 7.875% undated subordinated notes in full at first call dates and the
maturity of €350 million 0.100% senior notes. 4 2019 includes a £5 million (2018: £3 million) donation of forfeited dividend income to a charitable foundation. 2018 also includes £10 million related to goodwill payments to preference shareholders, which was announced on 30
April 2018, and associated administration costs.

Notes to the consolidated financial statements
Aviva plc Preliminary announcement 2019 44
Overview Analysis of assets Other information
IFRS Income, expenses & capital
B1 (i) Basis of preparation (a) The results in this preliminary announcement have been taken from the Group’s 2019 Annual report and accounts which will be available on the Company’s website on 25 March 2020. The consolidated financial statements have been prepared and approved by the directors in accordance with International Financial Reporting Standards (IFRS) as adopted by the European Union (EU), and those parts of the Companies Act 2006 applicable to those reporting under IFRS.
The basis of preparation and summary of accounting policies applicable to the Group’s consolidated financial statements can be found in the Accounting policies section of the 2019 Annual report and accounts. The comparative figures have been restated for the adjustments detailed in note B2. The Group has adopted IFRS 16 Leases as described in B1(ii). In addition, the Group has adopted new amendments to published standards as described in B1(ii).
The preliminary announcement for the year ended 31 December 2019 does not constitute statutory accounts as defined in Section 434 of the Companies Act 2006. The results on an IFRS basis for full year 2019 and 2018 have been audited by PricewaterhouseCoopers LLP (PwC). PwC have reported on the 2019 and 2018 consolidated financial statements. Both reports were unqualified and neither contained a statement under section 498 (2) or (3) of the Companies Act 2006. The Group’s 2018 annual report and accounts have been filed with the Registrar of Companies.
After making enquiries, the directors have a reasonable expectation that the Group as a whole has adequate resources to continue in operational existence over a period of at least 12 months from the date of approval of the financial statements. For this reason, they continue to adopt the going concern basis in preparing the financial statements.
(b) Items included in the financial statements of each of the Group’s entities are measured in the currency of the primary economic environment in which that entity operates (the functional currency). The consolidated financial statements are stated in pounds sterling, which is the Company’s functional and presentational currency. Unless otherwise noted, the amounts shown in these financial statements are in millions of pounds sterling (£m).
(c) The long-term nature of much of the Group’s operations means that, for management’s decision-making and internal performance management of our operating segments, the Group focuses on Group adjusted operating profit, a non-GAAP alternative performance measure (APM), that incorporates an expected return on investments supporting its long-term and non long-term businesses.
Group adjusted operating profit for long-term business is based on expected investment returns on financial investments backing shareholder and policyholder funds over the reporting period, with allowance for the corresponding expected movements in liabilities. Variances between actual and expected investment returns, and the impact of changes in economic assumptions on liabilities, are disclosed separately outside Group adjusted operating profit. For non long-term business, the total investment income, including realised and unrealised gains, is analysed between that calculated using a longer-term return and short-term fluctuations from that level. The exclusion of short-term realised and unrealised investment gains and losses from the Group adjusted operating profit APM reflects the long-term nature of much of our business and presents separately the operating profit APM which is used in managing the performance of our operating segments from the impact of economic factors.
Group adjusted operating profit excludes impairment of goodwill, associates and joint ventures; amortisation and impairment of intangible assets acquired in business combinations; amortisation and impairment of acquired value of in-force business; and the profit or loss on disposal and remeasurement of subsidiaries, joint ventures and associates. These items principally relate to mergers and acquisition activity which we view as strategic in nature, hence they are excluded from the Group adjusted operating profit APM as this is principally used to manage the performance of our operating segments when reporting to the Group’s chief decision maker. For 2019, the Group adjusted operating profit APM has been amended and now includes the amortisation and impairment of internally generated intangible assets to provide more relevant information by better reflecting their operational nature. 2018 comparative figures have been restated (see note B2(b)).
Group adjusted operating profit also excludes Other items, which are those items that, in the directors’ view, are required to be separately disclosed by virtue of their nature or incidence to enable a full understanding of the Group’s financial performance. Details of these items, including an explanation of the rationale for their exclusion, are provided in the relevant notes.
The Group adjusted operating profit APM should be viewed as complementary to IFRS GAAP measures. It is important to consider Group adjusted operating profit and profit before tax together to understand the performance of the business in the year.

Notes to the consolidated financial statements continued
Aviva plc Preliminary announcement 2019 45
Overview Analysis of assets Other information
IFRS Income, expenses & capital
B1(ii) New standards, interpretations and amendments to published standards that have been adopted by the Group The Group has adopted IFRS 16 which became effective for the annual reporting period beginning on 1 January 2019: (i) IFRS 16 Leases In January 2016, the IASB published IFRS 16 Leases. This standard replaces IAS 17 Leases and applies to annual reporting periods beginning on or after 1 January 2019. The standard has been endorsed by the EU.
The adoption of IFRS 16 has resulted in an update to the Group’s stated accounting policy for leases. The standard has introduced a definition of a lease with a single lessee accounting model, eliminating the previous classification of either operating or finance leases. Lessees are required to recognise lease assets and liabilities on the statement of financial position for all leases, with the exception of short-term and low-value leases. Further information can be found in accounting policy Z in the Group’s annual report and accounts.
The Group has chosen to adopt the modified retrospective approach on transition permitted by IFRS 16. This approach does not require prior year comparatives to be restated, and the impact of adoption of the standard on retained earnings is shown as an adjustment to opening retained earnings. On transition, and where applicable, the Group has applied the following practical expedients: • Applied a single discount rate to a portfolio of leases with reasonably similar characteristics; • Relied on existing assessments on whether leases are onerous as an alternative to performing an impairment review. Where such leases
existed, the onerous lease provision held at 31 December 2018 was offset against the initial right-of-use asset at the date of initial application as permitted by IFRS 16;
• Excluded initial direct costs for the measurement of the right-of-use asset at the date of initial application; and • Used hindsight in determining the lease term where the contract contains options to extend or terminate the lease.
The Group has reviewed existing service and outsourcing contracts to determine whether they are either a lease or contain a lease at the date of initial application. This has not resulted in any additional contracts being recognised as leases in the statement of financial position.
Application of the modified retrospective approach on transition has resulted in a reduction of retained earnings of £110 million at 1 January 2019. This reflects the fact that the right-of-use assets and lease liabilities amortise to nil at different rates over the lease term. A higher initial amortisation of the right-of-use asset compared to the lease liability results in the asset value being lower than the lease liability during the lease term, with the difference between the two generally converging to nil as the lease term ends. There have been corresponding increases in the value of assets (£434 million) and liabilities (£544 million), representing the right-of-use assets and liabilities, net of any tax impacts, not previously recognised on the consolidated statement of financial position in accordance with IAS 17. There has been no material impact on profit before tax.
The weighted average discount rate applied to the lease liabilities recognised at 1 January 2019 was 2.95%.
Future contractual aggregate minimum lease payments under non-cancellable operating leases, as disclosed in note 56 of the Group’s 2018 annual report and accounts, were £728 million at 31 December 2018. Lease liabilities in respect of operating leases brought on to the consolidated statement of financial position at 1 January 2019 following the adoption of IFRS 16 were £544 million. The balance shown at 1 January 2019 represents a present value of lease payments, whereas the figure disclosed at 31 December 2018 is the aggregated undiscounted payments. Other differences between the commitments disclosed and the opening IFRS 16 lease liabilities recognised relate primarily to amounts paid under service contracts that were included as a commitment in prior years, but do not meet the definition of a lease under IFRS 16.
Lessor accounting remains similar to the previous approach set out in IAS 17. The Group’s lessor accounting policies have not changed as a result of the introduction of IFRS 16.
Leased property classified as investment property is held at fair value and measured in accordance with IAS 40 Investment Property. This is consistent with the approach adopted under IAS 17.
The introduction of IFRS 16 has had no impact on the Company’s financial statements.
The following amendments to existing standards and IFRIC interpretations have been issued, and are effective from 1 January 2019 or earlier, and do not have an impact on the Group’s consolidated financial statements.
(ii) IFRIC 23 Uncertainty over Income Tax Treatments In June 2017, the IASB published IFRIC 23 Uncertainty over Income Tax Treatments. The standard is effective for annual reporting beginning on or after 1 January 2019.
(iii) Amendments to IAS 19: Plan Amendment, Curtailment or Settlement In February 2018, the IASB published Plan Amendment, Curtailment or Settlement (Amendments to IAS 19). The amendments are effective for annual reporting beginning on or after 1 January 2019.
(iv) Amendments to IAS 28: Long-term Interests in Associates and Joint Ventures In October 2017, the IASB published Long-term Interests in Associates and Joint Ventures (Amendments to IAS 28). The amendments are effective for annual reporting beginning on or after 1 January 2019.

Notes to the consolidated financial statements continued
Aviva plc Preliminary announcement 2019 46
Overview Analysis of assets Other information
IFRS Income, expenses & capital
B1(ii) New standards, interpretations and amendments to published standards that have been adopted by the Group continued (v) Annual Improvements to IFRS Standards 2015-2017 Cycle These improvements consist of amendments to four IFRSs including IFRS 3 Business Combinations, IFRS 11 Joint Arrangements, IAS 12 Income Taxes and IAS 23 Borrowing Costs. The amendments are effective for annual reporting beginning on or after 1 January 2019.
In addition, the Group has continued to apply the deferral approach to IFRS 9 which enables eligible insurers to apply a temporary exemption from applying IFRS 9 prior to applying IFRS 17. In November 2018 the IASB recommended an amendment to IFRS 17 to defer the effective date to 1 January 2022. At the same time, they recommended an extension to the fixed expiry date for the temporary exemption for insurers from applying IFRS 9 until 1 January 2022. These amendments are subject to the IASB’s due process and were included in an exposure draft published in July 2019, with final amendments expected to be published mid-2020.
Eligibility for the deferral approach was based on assessment of the Group’s liabilities as at 31 December 2015, in accordance with the date specified in the amendments to IFRS 4. At this date the Group’s liabilities connected with insurance exceeded 90% of the carrying value of the Group’s total liabilities.

Notes to the consolidated financial statements continued
Aviva plc Preliminary announcement 2019 47
Overview Analysis of assets Other information
IFRS Income, expenses & capital
B2 – Changes to comparative amounts (a) Presentation of consolidated investment funds Following a review of the Group’s presentation of consolidated investment funds, corrections to previous reported values on the consolidated statement of financial position and consolidated income statement have been identified (with corresponding impacts on the consolidated statement of cash flows) and comparative amounts have been restated. There has been no impact on profit for the period or equity for any of the periods presented. The nature of the restatements are as follows: • Fixed maturity securities, loans, derivatives and receivables held indirectly through certain majority-owned fund investments in the UK and
France, which in 2018 were presented as cash and cash equivalents, are now presented as financial investments, loans, receivables and payables and other financial liabilities which reflect the classification of the underlying holdings;
• Corrections to the calculation of minority ownership of certain fund investments have resulted in a restatement of net asset value attributable to unitholders and an adjustment to de-consolidate two investment funds where the Group was incorrectly deemed to have been the controlling entity in 2018;
• Corrections to the calculation of minority ownership have resulted in a restatement of the investment income attributable to minority shareholders recorded in fee and commission expense, net investment expense and fee and commission income for the period ending 31 December 2018; and
• Accrued interest on certain fixed maturity securities held indirectly through certain majority-owned funds, which in 2018 was presented within financial investments, is now presented in prepayments and accrued income (consistent with accrued interest on the Group’s directly held fixed maturity securities).
The impact of the changes above on the following captions in the income statement for the prior period presented is shown below:
31 December 2018
As reported
£m
Effect of changes
£m Restated
£m
Fee and commission income 2,180 (2) 2,178 Net investment expense (10,847) (65) (10,912) Fee and commission expense (3,393) 67 (3,326)
The impact of the changes above on the statement of financial position for the prior periods presented is shown below: 31 December 2018 1 January 2018
As reported
£m
Effect of changes
£m Restated
£m As reported
£m
Effect of changes
£m Restated
£m
Assets Loans 28,785 7,399 36,184 27,857 9,370 37,227 Financial investments 297,585 22,240 319,825 311,082 20,608 331,690 Receivables 8,879 (240) 8,639 8,285 (134) 8,151 Prepayments and accrued income 2,947 202 3,149 2,860 257 3,117 Cash and cash equivalents 46,484 (30,558) 15,926 43,347 (29,970) 13,377 Other 45,798 — 45,798 49,254 — 49,254 Total assets 430,478 (957) 429,521 442,685 131 442,816 Liabilities Net asset value attributable to unit holders 18,125 (1,787) 16,338 18,327 (151) 18,176 Payables and other financial liabilities 16,882 799 17,681 16,459 217 16,676 Other liabilities 3,043 31 3,074 2,791 65 2,856 Other 373,973 — 373,973 385,973 — 385,973
Total liabilities 412,023 (957) 411,066 423,550 131 423,681 Total equity 18,455 — 18,455 19,135 — 19,135
The impact of the changes above on the following captions in the statement of cash flows for the prior period presented is shown below:
31 December 2018
As reported
£m
Effect of changes
£m Restated
£m
Cash generated from operating activities 6,405 (557) 5,848
Total net cash from operating activities 5,958 (557) 5,401 Total net increase in cash and cash equivalents 2,930 (557) 2,373 Cash and cash equivalents at 1 January1 43,587 (29,970) 13,617 Effect of exchange rate changes on cash and cash equivalents 92 (31) 61 Cash and cash equivalents at 31 December1 46,609 (30,558) 16,051 1 Cash and cash equivalents shown in the statement of cash flows above include cash and cash equivalents of operations classified as held for sale and bank overdrafts.
The above items have also resulted in a number of corresponding reclassifications in the Group’s fair value hierarchy level disclosures included in note C4.1. The primary changes reflect: • The inclusion of fixed maturity securities in level 2 and loans in amortised cost (the assets were previously classified as cash and cash
equivalents and therefore not included in the fair value hierarchy); and • A reduction in financial investments reflecting the de-consolidation of two investment funds where the Group was incorrectly deemed to
have been the controlling entity.

Notes to the consolidated financial statements continued
Aviva plc Preliminary announcement 2019 48
Overview Analysis of assets Other information
IFRS Income, expenses & capital
B2 – Changes to comparative amounts continued Additionally, following the review, £33,050 million of fixed maturity securities previously included within level 1 have been reclassified to level 2 at 31 December 2018.
(b) Amendment to Group adjusted operating profit For 2019, the Group adjusted operating profit APM has been amended and now includes amortisation and impairment of internally generated intangible assets to provide more relevant information by better reflecting their operational nature. These assets include advisor platforms, digital distribution channels and claims and policy administration systems which are used to support operational activities. Group adjusted operating profit continues to exclude amortisation and impairment of intangible assets acquired in business combinations as these items principally relate to merger and acquisition activity which we view as strategic in nature. The effect of this change is to move £112 million relating to amortisation of internally generated intangible assets into Group adjusted operating profit for 2018. The 2018 comparative figures have been restated in the Reconciliation of Group adjusted operating profit to profit for the year and the Segmental income statement. The relevant EPS metrics (operating EPS and diluted operating EPS) for 2018 have also been restated (see note B8). There is no impact from this change on profit before tax.
B3 – Exchange rates The Group’s principal overseas operations during the year were located within the eurozone, Canada and Poland. The results and cash flows of these operations have been translated into sterling at the average rates for the year, and the assets and liabilities have been translated at the year end rates as follows:
2019 2018
Eurozone Average rate (€1 equals) £0.88 £0.88 Year end rate (€1 equals) £0.85 £0.90 Canada Average rate ($CAD1 equals) £0.59 £0.58 Year end rate ($CAD1 equals) £0.58 £0.57 Poland Average rate (PLN1 equals) £0.20 £0.21 Year end rate (PLN1 equals) £0.20 £0.21
B4 – Subsidiaries, joint ventures and associates – acquisitions The Group completed minor acquisitions in Canada, the UK and France in 2019. The aggregate consideration paid in these transactions was £20 million. With the exception of the acquisition of an associate in Canada, the acquired entities are all consolidated subsidiaries. During 2019, an adjustment of £2 million was made to the acquisition balance sheet of Friends Life Assurance Company DAC (Friends First), which became a wholly owned subsidiary on 1 June 2018. This resulted in a corresponding decrease in the negative goodwill previously recognised.
B5 – Subsidiaries, joint ventures and associates – disposals and held for sale This note provides details of the disposals of subsidiaries, joint ventures and associates that the Group has made during the year, together with details of businesses held for sale at the year end.
(a) Summary The profit on the disposal and remeasurement of subsidiaries, joint ventures and associates comprises:
2019
£m 2018
£m
Disposals 6 113 Held for sale remeasurements (28) (13) Remeasurements due to change in control status — 2
Total (loss)/profit on disposal and remeasurements (22) 102
The loss on the disposal and remeasurement of subsidiaries, joint ventures and associates during the year of £22 million (2018: £102 million gain) consists of £6 million of gains relating to small disposals and a £28 million remeasurement loss relating to Friends Provident International Limited (FPI), see note B5(b) for further details. In 2018, the profit on disposal of £113 million primarily related to the disposals of Avipop Assicurazioni S.p.A. (Italy Avipop) and three businesses in Spain and the remeasurement loss of £13 million was related to FPI.

Notes to the consolidated financial statements continued
Aviva plc Preliminary announcement 2019 49
Overview Analysis of assets Other information
IFRS Income, expenses & capital
B5 – Subsidiaries, joint ventures and associates – disposals and held for sale continued (b) Assets and liabilities of operations classified as held for sale The assets and liabilities of operations classified as held for sale as at 31 December 2019 are as follows:
2019
£m 2018
£m
Assets Acquired value of in-force business and intangible assets 526 660 Interests in, and loans to, joint ventures and associates 8 — Property and equipment 8 5 Loans 1 — Financial investments 7,824 7,251 Reinsurance assets 75 45 Other assets 290 206 Cash and cash equivalents 780 688
Total assets 9,512 8,855
Liabilities Gross insurance liabilities 687 121 Gross liabilities for investment contracts 8,324 8,341 External borrowings 28 — Other liabilities 87 59
Total liabilities 9,126 8,521
Net assets 386 334
Assets and liabilities of operations classified as held for sale as at 31 December 2019 relate primarily to the expected disposal of the international operations of FPI and also include Group’s operations in Hong Kong. See below for further details. Assets and liabilities of operations classified as held for sale during 2018 relate entirely to FPI.
(i) FPI On 19 July 2017, Aviva announced the sale of FPI to RL360 Holding Company Limited, a subsidiary of International Financial Group Limited, for a total consideration of £340 million, and FPI has been reported as held for sale by the Group since 31 December 2017. The conditions defined in IFRS 5 for a subsidiary to be classified as held for sale include the presumption that the sale will be completed within 12 months of the date of reclassification. However, if events or circumstances extend the period to complete the sale beyond 12 months, a held for sale classification continues to be appropriate if certain conditions are met.
The transaction remains subject to regulatory approvals. The delays to receiving these approvals have been beyond the control of the Group and both the Group and RL360 have continued to cooperate with the regulatory approval process throughout. The Group remains committed to completing the transaction and now expects it to complete in 2020. As such, the subsidiary continues to be classified as held for sale and has been remeasured at fair value less costs to sell of £334 million, based on the agreed price. This resulted in a total loss on remeasurement of £28 million in 2019 (2018: £13 million) (see note B24). The business remains a consolidated subsidiary of Aviva at the balance sheet date.
(ii) Hong Kong joint venture On 20 November 2019, Aviva announced the sale of its entire 40% shareholding in its Hong Kong joint venture (Blue) to Hillhouse AV Holdings Limited for 450 million HKD (approximately £44 million). In addition to the investment in the joint venture, Aviva retained control of certain activities under the previous sale agreement reached in 2018, which remain fully consolidated at the balance sheet date, and which form part of the sale agreement to Hillhouse AV Holding Limited. No remeasurement loss has been recognised on reclassification to held for sale.
(c) Significant restrictions In certain jurisdictions the ability of subsidiaries to transfer funds to the Group in the form of cash dividends or to repay loans and advances is subject to local corporate or insurance laws and regulations and solvency requirements. There are no protective rights of non-controlling interests which significantly restrict the Group’s ability to access or use the assets and settle the liabilities of the Group.

Notes to the consolidated financial statements continued
Aviva plc Preliminary announcement 2019 50
Overview Analysis of assets Other information
IFRS Income, expenses & capital
B6 – Segmental information The Group’s results can be segmented either by activity or by geography. Our primary reporting format is along market reporting lines, with supplementary information being given by business activity. This note provides segmental information on the consolidated income statement. In November 2019 the Group announced the creation of new divisions. From 2020 UK Life will focus on three product lines – annuities and equity release, protection and health and heritage. The Investments, Savings and Retirement division, will bring together Aviva Investors and the modern UK Savings and Retirement business that is currently reported in UK Life. The global General Insurance division will report the results of the UK, Canada and our European and Asian general insurance businesses. Europe Life and Asia Life will no longer include the results of the European and Asian general insurance businesses. The following segments represent how the business has been managed in 2019 and are consistent with the segments presented in 2018.
(a) Operating segments United Kingdom The United Kingdom comprises two operating segments – Life and General Insurance. The principal activities of our UK Life operations are life insurance, long-term health and accident insurance, savings, pensions and annuity business. UK General Insurance provides insurance cover to individuals and businesses, for risks associated mainly with motor vehicles, property and liability (such as employers’ liability and professional indemnity liability) and medical expenses.
Canada The principal activity of our operation in Canada is general insurance. In particular it provides personal and commercial lines insurance products principally distributed through insurance brokers.
France The principal activities of our operations in France are long-term business and general insurance. The long-term business offers a range of long-term insurance and savings products, primarily for individuals, with a focus on the unit-linked market. The general insurance business predominantly sells personal and small commercial lines insurance products through agents and a direct insurer.
Poland Activities in Poland comprise long-term business and general insurance and includes our long-term business in Lithuania.
Italy, Ireland and Other These countries are not individually significant at a Group level, so have been aggregated into a single reporting segment in line with IFRS 8 Operating Segments. The principal activities of our operations in Italy and Ireland are long-term business and general insurance. Our ‘Other’ operations include our life operations in Turkey. This segment also includes Friends First, which was acquired on 1 June 2018. The comparative results include our operations within Spain up to the date of disposal (Caja Murcia Vida and Caja Granada Vida on 11 July 2018 and Pelayo Vida on 1 October 2018), the principal activity of which was the sale of accident and health insurance and a selection of savings products. The comparative results also include Avipop, part of our operations in Italy, up to the date of disposal on 29 March 2018.
Asia Our activities in Asia principally comprise our long-term business operations in China, India, Singapore, Hong Kong (see note B5(b)), Vietnam, Indonesia, and FPI (see note B5(b)). This segment also includes general insurance and health operations in Singapore and health operations in Indonesia.
Aviva Investors Aviva Investors operates in most of the markets in which the Group operates, in particular the UK, France, North America and Asia Pacific. Aviva Investors manages policyholders’ and shareholders’ invested funds, provides investment management services for institutional pension fund mandates and manages a range of retail investment products. These include investment funds, unit trusts, open-ended investment companies and individual savings accounts.
Other Group activities Investment return on centrally held assets and head office expenses, such as Group treasury and finance functions, together with certain taxes and financing costs arising on central borrowings are included in ‘Other Group activities’. The results of our internal reinsurance operations and the Group’s interest in Wealthify are also included in this segment, as are the elimination entries for certain inter-segment transactions and group consolidation adjustments.

Notes to the consolidated financial statements continued
Aviva plc Preliminary announcement 2019 51
Overview Analysis of assets Other information
IFRS Income, expenses & capital
B6 – Segmental information continued Measurement basis The accounting policies of the segments are the same as those for the Group as a whole. Any transactions between the business segments are subject to normal commercial terms and market conditions. The Group evaluates performance of operating segments on the basis of: (i) profit or loss from operations before tax attributable to shareholders (ii) profit or loss from operations before tax attributable to shareholders, adjusted for items outside the segment management’s control,
including investment market performance and fiscal policy changes.
(a) (i) Segmental income statement for the year ended 31 December 2019
United Kingdom Europe
Life £m
GI £m
Canada £m
France £m
Poland £m
Italy, Ireland
and Other £m
Asia £m
Aviva Investors
£m
Other Group
activities2 £m
Total £m
Gross written premiums 8,596 4,624 3,204 6,883 643 5,761 1,532 — — 31,243 Premiums ceded to reinsurers (2,271) (406) (143) (86) (12) (264) (381) — — (3,563) Internal reinsurance revenue — — — — — — 1 — (1) — Premiums written net of reinsurance 6,325 4,218 3,061 6,797 631 5,497 1,152 — (1) 27,680 Net change in provision for unearned premiums (2) (57) (99) (28) 2 (9) (16) — — (209)
Net earned premiums 6,323 4,161 2,962 6,769 633 5,488 1,136 — (1) 27,471 Fee and commission income 951 113 24 305 99 123 205 320 1 2,141
7,274 4,274 2,986 7,074 732 5,611 1,341 320 — 29,612 Net investment income 27,070 254 171 6,267 155 4,352 967 61 1,280 40,577 Inter-segment revenue — — — — — — — 247 — 247 Share of profit of joint ventures and associates 20 — — 48 — 12 33 — (28) 85 Profit/(loss) on the disposal and remeasurement of subsidiaries, joint
ventures and associates — — 6 — — — (28) — — (22) Segmental income1 34,364 4,528 3,163 13,389 887 9,975 2,313 628 1,252 70,499
Claims and benefits paid, net of recoveries from reinsurers (9,569) (2,614) (1,938) (4,751) (380) (2,820) (1,003) — (21) (23,096) Change in insurance liabilities, net of reinsurance (3,428) (53) (16) (1,112) (49) (1,062) (32) — 50 (5,702) Change in investment contract provisions (16,411) — — (4,041) 1 (3,365) (216) (63) — (24,095) Change in unallocated divisible surplus 162 — — (2,010) (4) (1,764) (369) — — (3,985) Fee and commission expense (669) (1,265) (823) (816) (156) (352) (257) (27) (1,171) (5,536) Other expenses (1,332) (298) (162) (246) (95) (230) (283) (447) (236) (3,329) Inter-segment expenses (218) (6) (6) (2) (5) (10) — — — (247) Finance costs (159) (4) (7) (1) (1) (6) (8) — (390) (576)
Segmental expenses (31,624) (4,240) (2,952) (12,979) (689) (9,609) (2,168) (537) (1,768) (66,566)
Profit/(loss) before tax 2,740 288 211 410 198 366 145 91 (516) 3,933 Tax attributable to policyholders’ returns (487) — — — — (14) (58) — — (559)
Profit/(loss) before tax attributable to shareholders’ profits 2,253 288 211 410 198 352 87 91 (516) 3,374 Adjusting items: Reclassification of corporate costs and unallocated interest — (8) 33 46 — — — 5 (76) — Life business: Investment variances and economic assumption
changes (695) — — 84 (4) (42) 10 — (7) (654) Non-life business: Short-term fluctuation in return on investments — (102) (64) (95) (5) (33) — — 132 (167) General insurance and health business: Economic assumption
changes — 27 2 24 — — — — 1 54 Impairment of goodwill, joint ventures, associates and other
amounts expensed — — 2 — — — 13 — — 15 Amortisation and impairment of intangibles acquired in business
combinations 54 — 13 2 5 2 11 — — 87 Amortisation and impairment of AVIF 243 — — 2 — 33 126 — 2 406 (Profit)/loss on the disposal and remeasurement of subsidiaries,
joint ventures and associates — — (6) — — — 28 — — 22 Other3 — 45 — — — 2 — — — 47 Group adjusted operating profit/(loss) before tax attributable to
shareholders’ profits 1,855 250 191 473 194 314 275 96 (464) 3,184 1 Total reported income, excluding inter-segment revenue, includes £39,041 million from the United Kingdom (Aviva plc’s country of domicile). Income is attributed on the basis of geographical origin which does not differ materially
from revenue by geographical destination, as most risks are located in the countries where the contracts were written. 2 Other Group activities include internal reinsurance and net expenses of £15 million in relation to the UK digital business. The reduction of £165 million from 2018 reflects the alignment of the UK digital business with the UK Life
and UK GI businesses during the year. 3 Other includes a charge of £45 million in relation to a change in the discount rate used for estimating lump sum payments in settlement of bodily injury claims and a charge of £2 million relating to the negative goodwill that
arose on acquisition of Friends First (see note B4).

Notes to the consolidated financial statements continued
Aviva plc Preliminary announcement 2019 52
Overview Analysis of assets Other information
IFRS Income, expenses & capital
B6 – Segmental information continued (a) (ii) Segmental income statement for the year ended 31 December 2018 – restated1,2
United Kingdom Europe
Life £m
GI £m
Canada £m
France £m
Poland £m
Italy, Ireland,
Spain and Other
£m Asia £m
Aviva Investors4
£m
Other Group
activities5
£m Total
£m
Gross written premiums 7,302 4,504 3,047 5,584 616 6,504 1,102 — — 28,659 Premiums ceded to reinsurers (1,666) (317) (119) (77) (12) (113) (20) — (2) (2,326) Internal reinsurance revenue — 6 — — — (2) (7) — 3 — Premiums written net of reinsurance 5,636 4,193 2,928 5,507 604 6,389 1,075 — 1 26,333 Net change in provision for unearned premiums 14 (87) 27 (38) 7 9 (13) — — (81)
Net earned premiums 5,650 4,106 2,955 5,469 611 6,398 1,062 — 1 26,252 Fee and commission income 939 122 24 313 94 113 202 368 3 2,178 6,589 4,228 2,979 5,782 705 6,511 1,264 368 4 28,430 Net investment (expense)/income (6,771) 16 51 (2,302) (73) (1,111) (286) 37 (473) (10,912) Inter-segment revenue — — — — — — — 259 — 259 Share of profit of joint ventures and associates 144 — 1 9 — 10 14 — (66) 112 Profit/(loss) on the disposal and remeasurement of subsidiaries, joint
ventures and associates — — — — — 89 (5) 27 (9) 102
Segmental income3 (38) 4,244 3,031 3,489 632 5,499 987 691 (544) 17,991
Claims and benefits paid, net of recoveries from reinsurers (10,184) (2,731) (1,989) (4,659) (356) (2,595) (570) — (58) (23,142) Change in insurance liabilities, net of reinsurance 6,184 351 (133) 557 148 (872) (40) — 51 6,246 Change in investment contract provisions 7,540 — — 27 — (2,249) 42 (39) — 5,321 Change in unallocated divisible surplus 270 — — 1,754 12 1,063 138 — — 3,237 Fee and commission expense (738) (1,225) (791) (484) (146) (343) (199) (33) 633 (3,326) Other expenses (1,663) (220) (182) (256) (106) (188) (272) (449) (507) (3,843) Inter-segment expenses (232) (5) (6) (1) (6) (7) — — (2) (259) Finance costs (172) (1) (5) (1) — (5) (3) — (386) (573)
Segmental expenses 1,005 (3,831) (3,106) (3,063) (454) (5,196) (904) (521) (269) (16,339)
Profit/(loss) before tax 967 413 (75) 426 178 303 83 170 (813) 1,652 Tax attributable to policyholders’ returns 469 — — — — 1 7 — — 477 Profit/(loss) before tax attributable to shareholders’ profits 1,436 413 (75) 426 178 304 90 170 (813) 2,129
Adjusting items: Reclassification of corporate costs and unallocated interest — (16) 31 48 — (1) — 5 (67) — Life business: Investment variances and economic assumption
changes 115 — — (6) 10 57 21 — — 197 Non-life business: Short-term fluctuation in return on investments — 172 45 44 2 57 — — 156 476 General insurance and health business: Economic assumption
changes — 4 — (5) — — — — — (1) Impairment of goodwill, joint ventures, associates and other
amounts expensed — — — — 2 — 3 — 8 13 Amortisation and impairment of intangibles acquired in business
combinations 50 — 26 1 6 2 12 — — 97 Amortisation and impairment of AVIF 285 — — 2 — 6 130 — 3 426 (Profit)/loss on the disposal and remeasurement of subsidiaries,
joint ventures and associates — — — — — (89) 5 (27) 9 (102) Other6 — (190) — — — (36) — — (5) (231) Group adjusted operating profit/(loss) before tax attributable to
shareholders’ profits 1,886 383 27 510 198 300 261 148 (709) 3,004 1 Following a review of the Group’s presentation of consolidated investment funds, comparative amounts have been restated from those previously reported. The restatement has had no impact on the profit for the year or equity.
As a result of the review, there have been reclassifications between operating segments to ensure a consistent presentation of investment fund consolidation entries in the Other Group activities segment. These consolidation adjustment reclassifications relate to UK property funds (£66 million reclassified to Other Group activities, which predominately includes net investment expense (£78 million), other expenses (£24 million credit) and finance costs (£15 million)). This segmental restatement has had no impact on the consolidated income statement. See note B2(a) for further information.
2 During 2019 the Group adjusted operating profit APM has been revised and now includes the amortisation and impairment of internally generated intangible assets to better reflect the operational nature of these assets (see note B2(b)). Group adjusted operating profit continues to exclude amortisation and impairment of intangible assets acquired in business combinations. Comparative amounts have been restated resulting in a reduction in the prior period Group adjusted operating profit of £112 million. There is no impact on profit before tax attributable to shareholders’ profit.
3 Total reported income, excluding inter-segment revenue, includes £4,412 million from the United Kingdom (Aviva plc’s country of domicile). Income is attributed on the basis of geographical origin which does not differ materially from revenue by geographical destination, as most risks are located in the countries where the contracts were written.
4 Aviva Investors adjusted operating profit includes £1 million profit relating to the Aviva Investors Pensions Limited business. 5 Other Group activities include internal reinsurance and net expenses of £180 million (restated) in relation to the UK digital business. 6 Other includes a movement in the discount rate used for estimating lump sum payments in settlement of bodily injury claims which resulted in a gain of £190 million, a provision release of £78 million relating to the sale of Aviva
USA in 2013, a gain of £36 million relating to negative goodwill on the acquisition of Friends First, a charge of £63 million relating to the UK defined benefit pension scheme as a result of the requirement to equalise members’ benefits for the effects of Guaranteed Minimum Pension and a charge of £10 million relating to the goodwill payments to preference shareholders, which was announced on 30 April 2018, and associated administration costs.

Notes to the consolidated financial statements continued
Aviva plc Preliminary announcement 2019 53
Overview Analysis of assets Other information
IFRS Income, expenses & capital
B6 – Segmental information continued (b) Further analysis by products and services The Group’s results can be further analysed by products and services which comprise long-term business, general insurance and health, fund management and other activities.
Long-term business Our long-term business comprises life insurance, long-term health and accident insurance, savings, pensions and annuity business written by our life insurance subsidiaries, including managed pension fund business. Long-term business also includes our share of the other life and related business written in our associates and joint ventures, as well as lifetime mortgage business written in the UK.
General insurance and health Our general insurance and health business provides insurance cover to individuals and to small and medium-sized businesses, for risks associated mainly with motor vehicles, property and liability, such as employers’ liability and professional indemnity liability, and medical expenses.
Fund management Our fund management business invests policyholders’ and shareholders’ funds and provides investment management services for institutional pension fund mandates. It manages a range of retail investment products, including investment funds, unit trusts, open-ended investment companies and individual savings accounts. Clients include Aviva Group businesses and third-party financial institutions, pension funds, public sector organisations, investment professionals and private investors.
Other ‘Other’ includes service companies, head office expenses, such as Group treasury and finance functions, and certain financing costs and taxes not allocated to business segments and elimination entries for certain inter-segment transactions and group consolidation adjustments.
(b) (i) Segmental income statement – products and services for the year ended 31 December 2019
Long-term business
£m
General insurance
and health2 £m
Fund management
£m Other3
£m Total
£m
Gross written premiums1 20,335 10,908 — — 31,243 Premiums ceded to reinsurers (2,879) (684) — — (3,563) Premiums written net of reinsurance 17,456 10,224 — — 27,680 Net change in provision for unearned premiums — (209) — — (209) Net earned premiums 17,456 10,015 — — 27,471 Fee and commission income 1,490 126 319 206 2,141 18,946 10,141 319 206 29,612 Net investment income/(expense) 38,722 622 (1) 1,234 40,577 Inter-segment revenue — — 250 — 250 Share of profit of joint ventures and associates 113 — — (28) 85 (Loss)/profit on the disposal and remeasurement of subsidiaries, joint ventures and associates (28) 6 — — (22) Segmental income 57,753 10,769 568 1,412 70,502 Claims and benefits paid, net of recoveries from reinsurers (16,612) (6,484) — — (23,096) Change in insurance liabilities, net of reinsurance (5,566) (136) — — (5,702) Change in investment contract provisions (24,095) — — — (24,095) Change in unallocated divisible surplus (3,985) — — — (3,985) Fee and commission expense (1,546) (2,672) (27) (1,291) (5,536) Other expenses (1,850) (649) (453) (377) (3,329) Inter-segment expenses (237) (13) — — (250) Finance costs (170) (10) — (396) (576) Segmental expenses (54,061) (9,964) (480) (2,064) (66,569) Profit/(loss) before tax 3,692 805 88 (652) 3,933 Tax attributable to policyholders’ returns (559) — — — (559) Profit/(loss) before tax attributable to shareholders’ profits 3,133 805 88 (652) 3,374 Adjusting items (133) (161) 4 100 (190) Group adjusted operating profit/(loss) before tax attributable to shareholders’ profits 3,000 644 92 (552) 3,184 1 Gross written premiums include inward reinsurance premiums assumed from other companies amounting to £62 million, which all relates to property and liability insurance. 2 General insurance and health business segment includes gross written premiums of £944 million relating to health business. The remaining business relates to property and liability insurance. 3 Other includes net expenses of £15 million in relation to the UK digital business. The reduction of £165 million from 2018 reflects the alignment of the UK digital business with the UK long-term and general insurance businesses
during the year.
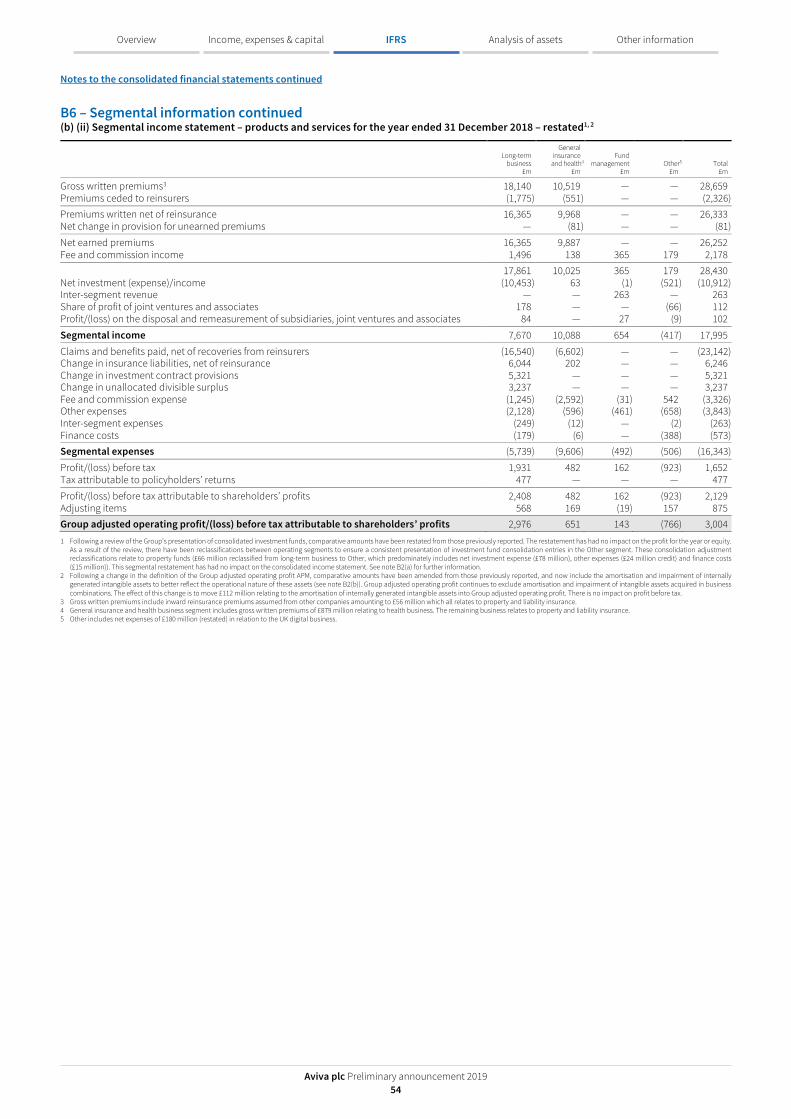
Notes to the consolidated financial statements continued
Aviva plc Preliminary announcement 2019 54
Overview Analysis of assets Other information
IFRS Income, expenses & capital
B6 – Segmental information continued (b) (ii) Segmental income statement – products and services for the year ended 31 December 2018 – restated1, 2
Long-term business
£m
General insurance
and health4
£m
Fund management
£m Other5
£m Total
£m
Gross written premiums3 18,140 10,519 — — 28,659 Premiums ceded to reinsurers (1,775) (551) — — (2,326) Premiums written net of reinsurance 16,365 9,968 — — 26,333 Net change in provision for unearned premiums — (81) — — (81)
Net earned premiums 16,365 9,887 — — 26,252 Fee and commission income 1,496 138 365 179 2,178 17,861 10,025 365 179 28,430 Net investment (expense)/income (10,453) 63 (1) (521) (10,912) Inter-segment revenue — — 263 — 263 Share of profit of joint ventures and associates 178 — — (66) 112 Profit/(loss) on the disposal and remeasurement of subsidiaries, joint ventures and associates 84 — 27 (9) 102
Segmental income 7,670 10,088 654 (417) 17,995
Claims and benefits paid, net of recoveries from reinsurers (16,540) (6,602) — — (23,142) Change in insurance liabilities, net of reinsurance 6,044 202 — — 6,246 Change in investment contract provisions 5,321 — — — 5,321 Change in unallocated divisible surplus 3,237 — — — 3,237 Fee and commission expense (1,245) (2,592) (31) 542 (3,326) Other expenses (2,128) (596) (461) (658) (3,843) Inter-segment expenses (249) (12) — (2) (263) Finance costs (179) (6) — (388) (573) Segmental expenses (5,739) (9,606) (492) (506) (16,343)
Profit/(loss) before tax 1,931 482 162 (923) 1,652 Tax attributable to policyholders’ returns 477 — — — 477
Profit/(loss) before tax attributable to shareholders’ profits 2,408 482 162 (923) 2,129 Adjusting items 568 169 (19) 157 875 Group adjusted operating profit/(loss) before tax attributable to shareholders’ profits 2,976 651 143 (766) 3,004 1 Following a review of the Group’s presentation of consolidated investment funds, comparative amounts have been restated from those previously reported. The restatement has had no impact on the profit for the year or equity.
As a result of the review, there have been reclassifications between operating segments to ensure a consistent presentation of investment fund consolidation entries in the Other segment. These consolidation adjustment reclassifications relate to property funds (£66 million reclassified from long-term business to Other, which predominately includes net investment expense (£78 million), other expenses (£24 million credit) and finance costs (£15 million)). This segmental restatement has had no impact on the consolidated income statement. See note B2(a) for further information.
2 Following a change in the definition of the Group adjusted operating profit APM, comparative amounts have been amended from those previously reported, and now include the amortisation and impairment of internally generated intangible assets to better reflect the operational nature of these assets (see note B2(b)). Group adjusted operating profit continues to exclude amortisation and impairment of intangible assets acquired in business combinations. The effect of this change is to move £112 million relating to the amortisation of internally generated intangible assets into Group adjusted operating profit. There is no impact on profit before tax.
3 Gross written premiums include inward reinsurance premiums assumed from other companies amounting to £56 million which all relates to property and liability insurance. 4 General insurance and health business segment includes gross written premiums of £879 million relating to health business. The remaining business relates to property and liability insurance. 5 Other includes net expenses of £180 million (restated) in relation to the UK digital business.

Notes to the consolidated financial statements continued
Aviva plc Preliminary announcement 2019 55
Overview Analysis of assets Other information
IFRS Income, expenses & capital
B7 – Tax This note analyses the tax charge for the year and explains the factors that affect it.
(a) Tax charged/(credited) to the income statement (i) The total tax charge/(credit) comprises:
2019
£m 2018
£m
Current tax For the period 1,062 559 Prior period adjustments (179) (49) Total current tax 883 510
Deferred tax Origination and reversal of temporary differences 402 (531) Changes in tax rates or tax laws (6) (13) Write back of deferred tax assets (9) (1)
Total deferred tax 387 (545)
Total tax charged/(credited) to income statement 1,270 (35)
(ii) The Group, as a proxy for policyholders in the UK, Ireland and Singapore, is required to record taxes on investment income and gains each year. Accordingly, the tax benefit or expense attributable to UK, Ireland and Singapore life insurance policyholder returns is included in the tax charge. The tax charge attributable to policyholder returns included in the charge above is £559 million (2018: credit of £477 million).
(iii) The tax charge/(credit) above, comprising current and deferred tax, can be analysed as follows:
2019
£m 2018
£m
UK tax 851 (236) Overseas tax 419 201
1,270 (35)
(iv) Unrecognised tax losses and temporary differences of previous years were used to reduce the current tax expense and deferred tax charge by £nil and £11 million (2018: £nil and £nil), respectively.
(v) Deferred tax charged/(credited) to the income statement represents movements on the following items:
2019
£m 2018
£m
Long-term business technical provisions and other insurance items (1,185) 907 Deferred acquisition costs 4 3 Unrealised gains/(losses) on investments 1,554 (1,453) Pensions and other post-retirement obligations 21 2 Unused losses and tax credits 4 7 Subsidiaries, associates and joint ventures 4 (7) Intangibles and additional value of in-force long-term business (63) (64) Provisions and other temporary differences 48 60
Total deferred tax charged/(credited) to income statement 387 (545)
(b) Tax credited to other comprehensive income (i) The total tax credit comprises:
2019
£m 2018
£m
Current tax In respect of pensions and other post-retirement obligations (49) (59) In respect of foreign exchange movements (10) (1)
(59) (60)
Deferred tax In respect of pensions and other post-retirement obligations (56) 16 In respect of fair value gains on owner-occupied properties 1 — In respect of unrealised gains/(losses) on investments 5 (7)
(50) 9
Total tax credited to other comprehensive income (109) (51)
(ii) There is no tax charge/(credit) attributable to policyholders’ return included above in either 2019 or 2018.

Notes to the consolidated financial statements continued
Aviva plc Preliminary announcement 2019 56
Overview Analysis of assets Other information
IFRS Income, expenses & capital
B7 – Tax continued (c) Tax credited to equity Tax credited directly to equity in the year in respect of coupon payments on the direct capital instrument and tier 1 notes amounted to £9 million (2018: £8 million).
(d) Tax reconciliation The tax on the Group’s profit before tax differs from the theoretical amount that would arise using the tax rate of the home country of the Company as follows:
Shareholder
£m Policyholder
£m 2019
£m Shareholder
£m Policyholder
£m 2018
£m
Total profit before tax 3,374 559 3,933 2,129 (477) 1,652
Tax calculated at standard UK corporation tax rate of 19.00% (2018: 19.00%) 641 106 747 405 (91) 314 Reconciling items
Different basis of tax – policyholders — 454 454 — (385) (385) Adjustment to tax charge in respect of prior periods 5 — 5 (16) — (16) Non-assessable income and items not taxed at the full statutory rate (51) — (51) (4) — (4) Non-taxable profit on sale of subsidiaries and associates (1) — (1) (59) — (59) Disallowable expenses 41 — 41 50 — 50 Different local basis of tax on overseas profits 98 (1) 97 71 (1) 70 Change in future local statutory tax rates (6) — (6) — — — Movement in deferred tax not recognised (4) — (4) (3) — (3) Tax effect of profit from joint ventures and associates (8) — (8) (6) — (6) Other (4) — (4) 4 — 4
Total tax charged/(credited) to income statement 711 559 1,270 442 (477) (35)
The tax charge/(credit) attributable to policyholder returns is removed from the Group’s total profit before tax in arriving at the Group’s profit before tax attributable to shareholders’ profits. As the net of tax profits attributable to with-profits and unit-linked policyholders is zero, the Group’s pre-tax profit attributable to policyholders is an amount equal and opposite to the tax charge/(credit) attributable to policyholders included in the total tax charge.
Finance Act 2016 introduced legislation reducing the UK corporation tax rate from 1 April 2020 to 17%. In addition, in France the rate of corporation tax was reduced from 34.43% to 32.02% from 1 January 2019, to 27.37% from 1 January 2021 and 25.83% from 1 January 2022. These reduced rates were used in the calculation of the Group’s deferred tax assets and liabilities as at 31 December 2018.
During 2019 changes were made in France to alter the reduction in corporation tax rates, delaying the reduction to 32.02% to 1 January 2020 and amending the rate to take effect from 1 January 2021 to 28.41%. These revised rates have been used in the calculation of France’s deferred tax assets and liabilities as at 31 December 2019.
During 2019, the UK Government indicated that it would reverse the reduction in corporation tax rate to 17% due from 1 April 2020. As of the 31 December 2019, this measure had not been substantively enacted and therefore no impact is reflected in the calculation of the UK’s deferred tax assets and liabilities as at 31 December 2019. Were this measure to be introduced, it would increase the Group’s deferred tax liability by approximately £73 million.

Notes to the consolidated financial statements continued
Aviva plc Preliminary announcement 2019 57
Overview Analysis of assets Other information
IFRS Income, expenses & capital
B8 – Earnings per share This note shows how to calculate earnings per share on profit attributable to ordinary shareholders, based both on the present shares in issue (the basic earnings per share) and the potential future shares in issue, including conversion of share options granted to employees (the diluted earnings per share). We have also shown the same calculations based on our Group adjusted operating profit as we believe this gives an important indication of operating performance. Consideration of both these measures gives a full picture of the performance of the business in the period.
(a) Basic earnings per share (i) The profit attributable to ordinary shareholders is:
2019 Restated1
2018
Group adjusted
operating profit
£m
Adjusting items
£m Total
£m
Group adjusted operating
profit £m
Adjusting items
£m Total
£m
Profit before tax attributable to shareholders’ profits 3,184 190 3,374 3,004 (875) 2,129 Tax attributable to shareholders’ profit (668) (43) (711) (625) 183 (442) Profit for the year 2,516 147 2,663 2,379 (692) 1,687 Amount attributable to non-controlling interests (98) (17) (115) (100) (19) (119) Cumulative preference dividends for the year (17) — (17) (17) — (17) Coupon payments in respect of the direct capital instrument (DCI) and tier 1 notes
(net of tax) (34) — (34) (36) — (36) Profit attributable to ordinary shareholders 2,367 130 2,497 2,226 (711) 1,515 1 Following a change in the definition of the Group adjusted operating profit APM, comparative amounts have been amended from those previously reported, and now exclude only the amortisation and impairment of intangible
assets acquired in business combinations (see note B1(b)). This change has been made to better reflect the operational nature of the Group’s internally generated intangible assets. The effect of this change is to move £112 million relating to amortisation of internally generated intangible assets into Group adjusted operating profit.
(ii) Basic earnings per share is calculated as follows:
2019 Restated2
2018
Before tax
£m
Net of tax, NCI, preference
dividends and DCI1
£m Per share
p Before tax
£m
Net of tax, NCI, preference dividends
and DCI1 £m
Per share p
Group adjusted operating profit attributable to ordinary shareholders 3,184 2,367 60.5 3,004 2,226 56.2 Adjusting items:
Life business: Investment variances and economic assumption changes 654 535 13.7 (197) (198) (5.0) Non-life business: Short-term fluctuation in return on investments 167 129 3.3 (476) (378) (9.6) General insurance and health business: Economic assumption changes (54) (33) (0.8) 1 (1) — Impairment of goodwill, joint ventures, associates and other amounts expensed (15) (15) (0.4) (13) (13) (0.3) Amortisation and impairment of intangibles acquired in business combinations2 (87) (61) (1.6) (97) (82) (2.1) Amortisation and impairment of acquired value of in-force business (406) (356) (9.1) (426) (371) (9.4) Profit on disposal and remeasurement of subsidiaries, joint ventures and associates (22) (23) (0.6) 102 102 2.6 Other3 (47) (46) (1.2) 231 230 5.8
Profit attributable to ordinary shareholders 3,374 2,497 63.8 2,129 1,515 38.2 1 DCI includes the direct capital instrument and tier 1 notes. 2 Following a change in the definition of the Group adjusted operating profit APM, comparative amounts have been amended from those previously reported, and now exclude only the amortisation and impairment of intangible
assets acquired in business combinations (see note B1(b)). This change has been made to better reflect the operational nature of the Group’s internally generated intangible assets. The effect of this change is to move £112 million relating to amortisation of internally generated intangible assets into Group adjusted operating profit.
3 Other in 2019 relates to a charge of £45 million in relation to a change in the discount rate used for estimating lump sum payments in settlement of bodily injury claims (see B12(b)) and a charge of £2 million relating to negative goodwill which arose on the acquisition of Friends First (see note A7). Other in 2018 includes a movement in the discount rate used for estimating lump sum payments in the settlement of bodily injury claims which resulted in a gain of £190 million, a provision release of £78 million relating to the sale of Aviva USA in 2013, a gain of £36 million relating to negative goodwill on the acquisition of Friends First, a charge of £63 million relating to the UK defined benefit pension scheme as a result of the requirements to equalise members’ benefits of the effects of Guaranteed Minimum Pension and a charge of £10 million relating to goodwill payments to preference shareholders, which was announced on 30 April 2018, and associated administration costs.
(iii) The calculation of basic earnings per share uses a weighted average of 3,911 million (2018: 3,963 million) ordinary shares in issue, after deducting treasury shares. The actual number of shares in issue at 31 December 2019 was 3,921 million (2018: 3,902 million) and 3,919 million (2018: 3,899 million) excluding treasury shares.
(iv) On 1 May 2018 the Group announced a share buy-back of ordinary shares for an aggregate purchase price of up to £600 million, which was carried out in full during the period from 1 May 2018 to 17 September 2018. The number of shares in issue reduced by 119 million as at 31 December 2018 in respect of shares acquired and cancelled under the buy-back programme.

Notes to the consolidated financial statements continued
Aviva plc Preliminary announcement 2019 58
Overview Analysis of assets Other information
IFRS Income, expenses & capital
B8 – Earnings per share continued (b) Diluted earnings per share (i) Diluted earnings per share is calculated as follows:
2019 2018
Total
£m
Weighted average
number of shares million
Per share p
Total £m
Weighted average
number of shares million
Per share p
Profit attributable to ordinary shareholders 2,497 3,911 63.8 1,515 3,963 38.2 Dilutive effect of share awards and options — 45 (0.7) — 47 (0.4)
Diluted earnings per share 2,497 3,956 63.1 1,515 4,010 37.8
(ii) Diluted earnings per share on Group adjusted operating profit attributable to ordinary shareholders is calculated as follows:
2019 Restated1
2018
Total
£m
Weighted average
number of shares million
Per share p
Total £m
Weighted average
number of shares million
Per share p
Group adjusted operating profit attributable to ordinary shareholders 2,367 3,911 60.5 2,226 3,963 56.2 Dilutive effect of share awards and options — 45 (0.7) — 47 (0.7)
Diluted group adjusted operating profit per share 2,367 3,956 59.8 2,226 4,010 55.5 1 Following a change in the definition of the Group adjusted operating profit APM, comparative amounts have been amended from those previously reported, and now exclude only the amortisation and impairment of intangible
assets acquired in business combinations (see note B1(b)). This change has been made to better reflect the operational nature of the Group’s internally generated intangible assets. The effect of this change is to move £112 million relating to amortisation of internally generated intangible assets into Group adjusted operating profit.
B9 – Dividends and appropriations This note analyses the total dividends and other appropriations paid during the year. The table below does not include the final dividend proposed after the year end because it is not accrued in these financial statements.
2019
£m 2018
£m
Ordinary dividends declared and charged to equity in the period Final 2018 – 20.75 pence per share, paid on 30 May 2019 812 — Final 2017 – 19.00 pence per share, paid on 17 May 2018 — 764 Interim 2019 – 9.50 pence per share, paid on 26 September 2019 372 — Interim 2018 – 9.25 pence per share, paid on 24 September 2018 — 364
1,184 1,128 Preference dividends declared and charged to equity in the period 17 17 Coupon payments on DCI and tier 1 notes 43 44
1,244 1,189
Subsequent to 31 December 2019, the directors proposed a final dividend for 2019 of 21.40 pence per ordinary share (2018: 20.75 pence), amounting to £839 million (2018: £812 million) in total. Subject to approval by shareholders at the AGM, the dividend will be paid on 2 June 2020 and will be accounted for as an appropriation of retained earnings in the year ending 31 December 2020.
Interest on the direct capital instrument and tier 1 notes is treated as an appropriation of retained profits and, accordingly, is accounted for when paid. This year’s tax relief is obtained at a rate of 19% (2018: 19%).

Notes to the consolidated financial statements continued
Aviva plc Preliminary announcement 2019 59
Overview Analysis of assets Other information
IFRS Income, expenses & capital
B10 – Contract liabilities and associated reinsurance The Group’s liabilities for insurance and investment contracts it has sold, and the associated reinsurance, is covered in the following notes: • Note B11 covers insurance liabilities; • Note B12 covers the methodology and assumptions used in calculating the insurance liabilities; • Note B13 covers liabilities for investment contracts; • Note B14 details the associated reinsurance assets on these liabilities; and • Note B15 shows the effects of changes in the assumptions on the liabilities.
(a) Carrying amount The following is a summary of the contract liabilities and related reinsurance assets as at 31 December.
2019 2018
Gross provisions
£m
Reinsurance assets
£m Net £m
Gross provisions
£m
Reinsurance assets
£m Net £m
Long-term business Insurance liabilities (131,182) 6,369 (124,813) (125,829) 5,836 (119,993) Liabilities for participating investment contracts (92,762) 1 (92,761) (90,455) 1 (90,454) Liabilities for non-participating investment contracts (137,689) 4,006 (133,683) (120,354) 4,009 (116,345)
(361,633) 10,376 (351,257) (336,638) 9,846 (326,792) Outstanding claims provisions (2,187) 93 (2,094) (2,001) 89 (1,912)
(363,820) 10,469 (353,351) (338,639) 9,935 (328,704) General insurance and health Outstanding claims provisions (8,831) 683 (8,148) (9,046) 789 (8,257) Provisions for claims incurred but not reported (2,672) 1,004 (1,668) (2,360) 822 (1,538)
(11,503) 1,687 (9,816) (11,406) 1,611 (9,795) Provision for unearned premiums (5,138) 275 (4,863) (4,946) 254 (4,692) Provision arising from liability adequacy tests1 (15) — (15) (16) — (16)
(16,656) 1,962 (14,694) (16,368) 1,865 (14,503)
Total (380,476) 12,431 (368,045) (355,007) 11,800 (343,207)
Less: Liabilities classified as held for sale 9,011 (75) 8,936 8,462 (45) 8,417
(371,465) 12,356 (359,109) (346,545) 11,755 (334,790) 1 Provision arising from liability adequacy tests relates to general insurance business only. Liability adequacy test provisions for life operations, where applicable, are included in other line items. At 31 December 2019 this provision
is £nil (2018: £nil) for the life operations.
(b) Change in contract liabilities, net of reinsurance, recognised as an expense The purpose of the following table is to reconcile the change in insurance liabilities, net of reinsurance, shown on the consolidated income statement, to the change in insurance liabilities recognised as an expense in the relevant movement tables in the following notes. The components of the reconciliation are the change in provision for outstanding claims on long-term business (which is not included in a separate movement table), and the unwind of discounting on general insurance reserves (which is included within finance costs in the income statement). For general insurance and health, the change in the provision for unearned premiums is not included in the reconciliation as, within the income statement, this is included within earned premiums.
2019 Gross
£m Reinsurance
£m Net £m
Long-term business Change in insurance liabilities (note B11(b)(iii)) 6,600 (1,030) 5,570 Change in provision for outstanding claims 4 (8) (4) 6,604 (1,038) 5,566 General insurance and health Change in insurance liabilities (note B11(c)(iv) and B14(c)(ii))1 234 (94) 140 Less: Unwind of discount (14) 10 (4) 220 (84) 136 Total change in insurance liabilities 6,824 (1,122) 5,702 1 Includes £45 million in the UK General Insurance and Health business relating to a change in the discount rate used for estimating lump sum payments of bodily injury claims from 0.00% to -0.25%.
2018 Gross
£m Reinsurance
£m Net £m
Long-term business Change in insurance liabilities (note B11(b)(iii)) (6,284) 61 (6,223) Change in provision for outstanding claims 190 (11) 179 (6,094) 50 (6,044)
General insurance and health Change in insurance liabilities (note B11(c)(iv) and B14(c)(ii))1 (313) 111 (202) Less: Unwind of discount (8) 8 —
(321) 119 (202)
Total change in insurance liabilities (6,415) 169 (6,246) 1 Includes £(190) million in the UK General Insurance and Health business relating to a change in the discount rate used for estimating lump sum payments of bodily injury claims from -0.75% to 0.00%.

Notes to the consolidated financial statements continued
Aviva plc Preliminary announcement 2019 60
Overview Analysis of assets Other information
IFRS Income, expenses & capital
B10 – Contract liabilities and associated reinsurance continued For non-participating investment contracts, deposits collected and amounts withdrawn are not shown on the income statement, but are accounted for directly through the statement of financial position as an adjustment to the gross liabilities for investment contracts. The associated change in investment contract provisions shown on the income statement consists of the attributed investment return. For participating investment contracts, the change in investment contract provisions on the income statement primarily consists of the movement in participating investment contract liabilities (net of reinsurance) over the reporting period.
B11 – Insurance liabilities This note analyses the Group’s gross insurance contract liabilities for the long-term and general insurance and health business, describes how the Group calculates these liabilities and presents the movement in these liabilities during the year.
(a) Carrying amount Insurance liabilities (gross of reinsurance) at 31 December comprised:
2019
£m
Restated1
2018 £m
Long-term business Participating insurance liabilities1 47,344 46,768 Unit-linked non-participating insurance liabilities 14,707 14,480 Other non-participating insurance liabilities1 69,131 64,581
131,182 125,829 Outstanding claims provisions 2,187 2,001
133,369 127,830
General insurance and health Outstanding claims provisions 8,831 9,046 Provision for claims incurred but not reported 2,672 2,360
11,503 11,406 Provision for unearned premiums 5,138 4,946 Provision arising from liability adequacy tests2 15 16
16,656 16,368
Total 150,025 144,198
Less: Liabilities classified as held for sale (687) (121)
149,338 144,077 1 Comparative amounts at full year 2018 have been revised. In the UK, £5,928 million has been reclassified from other non-participating insurance liabilities to participating insurance liabilities. 2 Provision arising from liability adequacy tests relates to general insurance business only. Liability adequacy test provisions for life operations, where applicable, are included in other line items. At 31 December 2019 this provision
is £nil (2018: £nil) for the life operations.
(b) Long-term business liabilities (i) Business description The Group underwrites long-term business in a number of countries as follows: • In the UK, long-term business is mainly written in the ‘Non-Profit’ fund and in a number of ‘With-Profits’ sub-funds. In the ‘Non-Profit’ fund
shareholders are entitled to 100% of the distributed profits. In the ‘With-Profits’ sub-funds the with-profits policyholders are entitled to between 40% and 100% of distributed profits, depending on the fund rules. There is also the Reattributed Inherited Estate External Support Account (RIEESA), which does not itself underwrite any business, but provides capital support to one of the with-profits sub-funds and receives any surplus or deficit emerging from it. In the RIEESA, shareholders are entitled to 100% of the distributed profits, but these cannot be distributed until the ‘lock-in’ criteria set by the Reattribution Scheme have been met;
• In France, the majority of policyholders’ benefits are determined by investment performance, subject to certain guarantees, and shareholders’ profits are derived largely from management fees. In addition, a substantial number of policies participate in investment returns, with the balance being attributable to shareholders; and
• In other operations in Europe and Asia, a range of long-term insurance and savings products are written.
(ii) Group practice The long-term business liabilities are calculated separately for each of the Group’s life operations. The provisions for overseas subsidiaries have generally been included on the basis of local regulatory requirements, modified where necessary to reflect the requirements of the Companies Act 2006.
Material judgement is required in calculating the liabilities and is exercised particularly through the choice of assumptions where discretion is permitted. In turn, the assumptions used depend on the circumstances prevailing in each of the life operations. Provisions are most sensitive to assumptions regarding discount rates, mortality and morbidity rates. Where discount rate assumptions are based on current market yields on fixed interest securities, allowance is made for default risk implicit in the yields on the underlying assets.
Bonuses paid during the year are reflected in claims paid, whereas those allocated as part of the bonus declaration are included in the movements in the long-term business liabilities.
A description of the main methodology and most material valuation assumptions has been provided (see note B12).

Notes to the consolidated financial statements continued
Aviva plc Preliminary announcement 2019 61
Overview Analysis of assets Other information
IFRS Income, expenses & capital
B11 – Insurance liabilities continued (iii) Movements in long-term business liabilities The following movements have occurred in the gross long-term business liabilities during the year:
2019
£m 2018
£m
Carrying amount at 1 January 125,829 130,972 Liabilities in respect of new business 6,988 6,190 Expected change in existing business (6,452) (7,952) Variance between actual and expected experience 3,212 (1,844) Impact of operating assumption changes (961) (1,456) Impact of economic assumption changes 3,766 (959) Other movements recognised as an expense1 47 (263) Change in liability recognised as an expense (note B10(b)) 6,600 (6,284) Effect of portfolio transfers, acquisitions and disposals2 — 788 Foreign exchange rate movements (1,775) 413 Other movements3 528 (60)
Carrying amount at 31 December 131,182 125,829 1 Other movements recognised as an expense during 2019 relate primarily to: a special bonus distribution to with-profits policyholders and model changes in UK Life; the reclassification of health liabilities in Singapore;
and methodology changes in Ireland. The movement in 2018 relates to a special bonus distribution to with-profits policyholders in UK Life. 2 The movement during 2018 includes the acquisition of Friends First in Ireland offset by the disposal of Spain and Avipop in Italy. 3 Other movements during 2019 mainly relate to the reclassification in UK from participating investment contracts to insurance contracts (£972 million) and following a review of the presentation of negative reinsurance assets in
the UK, £(427) million of negative reinsurance assets have been reclassified from insurance liabilities to reinsurance assets. 2018 includes the reclassification in France from insurance to participating investment contracts (£(56) million).
For many types of long-term business, including unit-linked and participating insurance liabilities, movements in asset values are offset by corresponding changes in liabilities, limiting the net impact on profit. The gross long-term business liabilities increased by £5.4 billion during 2019 (2018: £5.1 billion decrease) mainly driven by: • Variance between actual and expected experience of £3.2 billion, which was mainly due to higher than expected equity returns in the UK
and France; • Impact of non-economic assumption changes of £(1.0) billion mainly due to updates to longevity assumptions (with the impact on profit
partially offset by a corresponding reduction in reinsurance assets) in the UK; and • Economic assumption changes of £3.8 billion, which reflects a reduction in valuation interest rates in response to decreasing interest rates
and narrowing of credit spreads, primarily in respect of annuity contracts in the UK.
For participating insurance liabilities, a movement in liabilities is generally offset by a corresponding adjustment to the unallocated divisible surplus and does not impact profit. Where assumption changes impact profit, these are included in the effect of changes in assumptions and estimates during the year (see note B15), together with the impact of movements in related non-financial assets.
(c) General insurance and health liabilities (i) Business description The Group underwrites general insurance and health business in a number of countries as follows: • In the UK, providing individual and corporate customers with a wide range of insurance products; • In Canada, providing a range of personal and commercial lines products; and • In Europe and Asia, providing a range of general insurance and health products.
(ii) Group practice Delays occur in the notification and settlement of claims and a substantial measure of experience and judgement is involved in assessing outstanding liabilities, the ultimate cost of which cannot be known with certainty at the statement of financial position date. The liabilities for general insurance and health business are based on information currently available. However, it is inherent in the nature of the business written that the ultimate liabilities may vary as a result of subsequent developments.
Provisions for outstanding claims are established to cover the outstanding expected ultimate liability for losses and loss adjustment expenses (LAE) in respect of all claims that have already occurred. The provisions established cover reported claims and associated LAE, as well as claims incurred but not yet reported and associated LAE.
The Group only establishes reserves for losses that have already occurred. The Group therefore does not establish catastrophe equalisation reserves that defer a share of income in respect of certain lines of business from years in which a catastrophe does not occur to future periods in which catastrophes may occur. When calculating reserves, the Group takes into account estimated future recoveries from salvage and subrogation, and a separate asset is recorded for expected future recoveries from reinsurers after considering their collectability.

Notes to the consolidated financial statements continued
Aviva plc Preliminary announcement 2019 62
Overview Analysis of assets Other information
IFRS Income, expenses & capital
B11 – Insurance liabilities continued (iii) Provisions for Outstanding Claims The table below shows the total general insurance and health liabilities split by outstanding claim provisions and provision for claims incurred but not reported (IBNR provisions), gross of reinsurance, by major line of business.
As at 31 December 2019 As at 31 December 2018
Outstanding claim
provisions £m
IBNR provisions
£m
Total claim provisions
£m
Outstanding claim
provisions £m
IBNR provisions
£m
Total claim provisions
£m
Motor 4,836 1,115 5,951 5,019 963 5,982 Property 1,823 155 1,978 1,833 104 1,937 Liability 1,864 1,277 3,141 1,856 1,164 3,020 Creditor 5 6 11 4 7 11 Other 303 119 422 334 122 456
8,831 2,672 11,503 9,046 2,360 11,406
The gross outstanding claims provision before discounting was £11,205 million (2018: £10,955 million). Details of the range of discount rates used along with other material assumptions are available (see note B12(b)).
(iv) Movements in general insurance and health claims liabilities The following changes have occurred in the general insurance and health claims liabilities during the year:
2019
£m 2018
£m
Carrying amount at 1 January 11,406 11,801 Impact of changes in assumptions 126 (22) Claim losses and expenses incurred in the current year 7,045 7,158 Decrease in estimated claim losses and expenses incurred in prior periods (186) (544) Incurred claims losses and expenses 6,985 6,592 Less:
Payments made on claims incurred in the current year (3,834) (3,927) Payments made on claims incurred in prior periods (3,327) (3,343) Recoveries on claim payments 396 357
Claims payments made in the period, net of recoveries (6,765) (6,913) Unwind of discounting 14 8
Changes in claims reserve recognised as an expense (note B10(b)) 234 (313) Effect of portfolio transfers, acquisitions and disposals1 — (29) Foreign exchange rate movements (138) (53) Other movements 1 —
Carrying amount at 31 December 11,503 11,406 1 The movement during 2018 relates to the disposal of Avipop in Italy.
(v) Movements in general insurance and health unearned premiums The following changes have occurred in the liabilities for unearned premiums (UPR) during the year:
2019
£m 2018
£m
Carrying amount at 1 January 4,946 4,980 Premiums written during the year 10,908 10,519 Less: Premiums earned during the year (10,677) (10,421)
Changes in UPR recognised as an expense 231 98 Gross portfolio transfers and acquisitions1 — (103) Foreign exchange rate movements (39) (29)
Carrying amount at 31 December 5,138 4,946 1 The movement during 2018 relates to the disposal of Avipop in Italy.

Notes to the consolidated financial statements continued
Aviva plc Preliminary announcement 2019 63
Overview Analysis of assets Other information
IFRS Income, expenses & capital
B11 – Insurance liabilities continued (vi) Analysis of general insurance and health claims development The tables that follow present the development of claims payments and the estimated ultimate cost of claims for the accident years 2010 to 2019. The upper half of the tables shows the cumulative amounts paid during successive years related to each accident year, while the lower section of the tables shows the original estimated ultimate cost of claims and how these original estimates have increased or decreased, as more information becomes known about the individual claims and overall claim frequency and severity.
Key elements of the development of prior accident year general insurance and health net provisions during 2019 were: • £134 million release from the UK due to favourable claims experience in personal and commercial motor partly offset by a strengthening
in commercial property and a change in the discount rate used for estimating lump sum payments in settlement of bodily injury claims (for further details see note B12);
• £58 million release from Canada primarily due to favourable claims experience on personal and commercial motor and large reinsurance recoverable on two catastrophe events from August 2018 in personal and commercial property lines; and
• £83 million release from Europe mainly due to favourable claims development in France.
Key elements of the development of prior accident year general insurance and health net provisions during 2018 were: • £372 million release from the UK due to a change in the discount rate used for estimating lump sum payments in settlement of bodily injury
claims (for further details see note B12) and favourable claims experience in personal and commercial motor; • £78 million release from Canada primarily due to favourable claims experience on personal motor and aligning RBC claims practices with
that of the Aviva book; and • £127 million release from Europe mainly due to continued favourable development in France.
Gross of reinsurance Before the effect of reinsurance, the loss development table is:
Accident year All prior years
£m 2010
£m 2011
£m 2012
£m 2013
£m 2014
£m 2015
£m 2016
£m 2017
£m 2018
£m 2019
£m Total
£m
Gross cumulative claim payments At end of accident year (3,502) (3,420) (3,055) (3,068) (3,102) (2,991) (3,534) (3,517) (3,769) (3,617) One year later (5,466) (4,765) (4,373) (4,476) (4,295) (4,285) (4,972) (4,952) (5,239) Two years later (5,875) (5,150) (4,812) (4,916) (4,681) (4,710) (5,435) (5,388) Three years later (6,163) (5,457) (5,118) (5,221) (4,974) (4,997) (5,781) Four years later (6,405) (5,712) (5,376) (5,467) (5,244) (5,198) Five years later (6,564) (5,864) (5,556) (5,645) (5,406) Six years later (6,649) (5,978) (5,635) (5,739) Seven years later (6,690) (6,032) (5,718) Eight years later (6,718) (6,078) Nine years later (6,740)
Estimate of gross ultimate claims At end of accident year 6,911 6,428 6,201 6,122 5,896 5,851 6,947 6,894 7,185 6,979 One year later 7,006 6,330 6,028 6,039 5,833 5,930 6,931 6,796 7,175 Two years later 6,950 6,315 6,002 6,029 5,865 5,912 6,864 6,756 Three years later 6,914 6,292 5,952 6,067 5,842 5,814 6,817 Four years later 6,912 6,262 6,002 6,034 5,772 5,785 Five years later 6,906 6,265 5,979 5,996 5,756 Six years later 6,926 6,265 5,910 5,956 Seven years later 6,913 6,223 5,902 Eight years later 6,877 6,205 Nine years later 6,861
Estimate of gross ultimate claims 6,861 6,205 5,902 5,956 5,756 5,785 6,817 6,756 7,175 6,979 Cumulative payments (6,740) (6,078) (5,718) (5,739) (5,406) (5,198) (5,781) (5,388) (5,239) (3,617)
2,341 121 127 184 217 350 587 1,036 1,368 1,936 3,362 11,629 Effect of discounting (280) (18) (1) — 1 — — — — — — (298) Present value 2,061 103 126 184 218 350 587 1,036 1,368 1,936 3,362 11,331 Cumulative effect of foreign exchange
movements — (3) (2) 1 4 19 71 (16) (23) (19) — 32 Effect of acquisitions 8 1 7 9 12 23 42 38 — — — 140 Present value recognised in the
statement of financial position 2,069 101 131 194 234 392 700 1,058 1,345 1,917 3,362 11,503

Notes to the consolidated financial statements continued
Aviva plc Preliminary announcement 2019 64
Overview Analysis of assets Other information
IFRS Income, expenses & capital
B11 – Insurance liabilities continued Net of reinsurance After the effect of reinsurance, the loss development table is:
Accident year All prior years
£m 2010
£m 2011
£m 2012
£m 2013
£m 2014
£m 2015
£m 2016
£m 2017
£m 2018
£m 2019
£m Total
£m
Net cumulative claim payments At end of accident year (3,386) (3,300) (2,925) (2,905) (2,972) (2,867) (3,309) (3,483) (3,718) (3,565) One year later (5,242) (4,578) (4,166) (4,240) (4,079) (4,061) (4,591) (4,843) (5,117) Two years later (5,637) (4,963) (4,575) (4,649) (4,432) (4,452) (5,012) (5,255) Three years later (5,905) (5,263) (4,870) (4,918) (4,720) (4,725) (5,329) Four years later (6,137) (5,485) (5,110) (5,159) (4,973) (4,919) Five years later (6,278) (5,626) (5,289) (5,324) (5,132) Six years later (6,361) (5,740) (5,371) (5,417) Seven years later (6,411) (5,798) (5,439) Eight years later (6,440) (5,842) Nine years later (6,458)
Estimate of net ultimate claims At end of accident year 6,650 6,202 5,941 5,838 5,613 5,548 6,489 6,714 6,997 6,774 One year later 6,751 6,103 5,765 5,745 5,575 5,635 6,458 6,591 6,944 Two years later 6,685 6,095 5,728 5,752 5,591 5,608 6,377 6,569 Three years later 6,644 6,077 5,683 5,733 5,559 5,517 6,334 Four years later 6,634 6,034 5,717 5,689 5,490 5,495 Five years later 6,614 6,005 5,680 5,653 5,472 Six years later 6,624 6,003 5,631 5,612 Seven years later 6,615 5,967 5,600 Eight years later 6,590 5,952 Nine years later 6,569
Estimate of net ultimate claims 6,569 5,952 5,600 5,612 5,472 5,495 6,334 6,569 6,944 6,774 Cumulative payments (6,458) (5,842) (5,439) (5,417) (5,132) (4,919) (5,329) (5,255) (5,117) (3,565) 922 111 110 161 195 340 576 1,005 1,314 1,827 3,209 9,770 Effect of discounting (121) (15) 3 (1) 5 — — — — — — (129) Present value 801 96 113 160 200 340 576 1,005 1,314 1,827 3,209 9,641 Cumulative effect of foreign exchange
movements — (3) (2) 1 4 18 70 (15) (23) (17) — 33 Effect of acquisitions 10 1 7 9 12 23 42 38 — — — 142 Present value recognised in the
statement of financial position 811 94 118 170 216 381 688 1,028 1,291 1,810 3,209 9,816
In the loss development tables shown above, the cumulative claim payments and estimates of cumulative claims for each accident year are translated into sterling at the exchange rates that applied at the end of that accident year. The impact of using varying exchange rates is shown at the bottom of each table. Disposals are dealt with by treating all outstanding and IBNR claims of the disposed entity as ‘paid’ at the date of disposal.
The loss development tables above include information on asbestos and environmental pollution claims provisions from business written more than 10 years ago. The undiscounted claim provisions, net of reinsurance, in respect of this business at 31 December 2019 were £88 million (2018: £94 million). The movement in the year reflects a reduction of £7 million due to favourable claims development, claim payments net of reinsurance recoveries and foreign exchange movements.

Notes to the consolidated financial statements continued
Aviva plc Preliminary announcement 2019 65
Overview Analysis of assets Other information
IFRS Income, expenses & capital
B12 – Insurance liabilities methodology and assumptions (a) Long-term business The main method used for the actuarial valuation of long-term insurance liabilities is the gross premium method which involves the discounting of projected future cash flows. The cash flows are calculated using the contractual premiums payable together with explicit assumptions for investment returns, discount rates, inflation, mortality, morbidity, persistency and future expenses. These assumptions can vary by contract type and reflect current and expected future experience with an allowance for prudence.
The methodology and assumptions described below relate to the UK and France insurance businesses only.
(i) UK Non-profit business The valuation of non-profit business is based on grandfathered regulatory requirements under IFRS 4 prior to the adoption of Solvency II, adjusted to remove certain regulatory reserves and margins in assumptions, notably for annuity business. Conventional non-profit contracts, including those written in the with-profits funds, are valued using the gross premium method. For non-profit business in the ex. Friends Life with-profits funds, the liabilities are measured on a realistic basis with implicit recognition of the present value of future profits.
For unit-linked and some unitised with-profits business, the provisions are valued by adding a prospective non-unit reserve to the bid value of units. The prospective non-unit reserve is calculated by projecting the future non-unit cash flows using prudent assumptions and on the assumption that future premiums cease, unless it is more onerous to assume that they continue.
Discount rates Valuation discount rate assumptions are set with regard to yields on the supporting assets and the general level of long-term interest rates as measured by gilt yields. An explicit allowance for risk is included by making a deduction from the yields on corporate bonds, mortgages and deposits, based on historical default experience of each asset class. For equity release assets, the risk allowances are consistent with those used in the fair value asset methodology. A further margin for risk is then deducted for all asset classes.
Valuation discount rates for business in the non-profit funds are as follows:
Valuation discount rates (Gross of investment expenses) 2019 2018
Assurances Life conventional non-profit 0.5% to 2.1% 0.9% to 2.6% Pensions conventional non-profit 0.6% to 1.6% 1.1% to 2.1%
Annuities Conventional immediate and deferred annuities 0.9% to 2.3% 1.2% to 3.0%
Non-unit reserves on unit-linked business Life 0.9% 0.9% to 1.3% Pensions 1.1% 0.9% to 1.6%
Income Protection Active lives 0.6% to 2.1% 1.1% to 2.6% Claims in payment (level and index linked) 1.1% 1.3% to 1.6%
The valuation discount rates are after a reduction for risk, but before allowance for investment expenses. For conventional immediate annuity business, the allowance for risk comprises long-term assumptions on a prudent basis for defaults or, in the case of equity release assets, expected losses arising from the No-Negative-Equity Guarantee. These allowances vary by asset category and for some asset classes by rating.
The risk allowances made for corporate bonds (including overseas government bonds and structured finance assets), mortgages (including healthcare mortgages, commercial mortgages and infrastructure assets), and equity release equated to 45-47 bps, 31-35 bps, and 124 bps respectively at 31 December 2019 (2018: 50 bps, 39-41 bps, and 112 bps respectively).
The total valuation allowance in respect of corporate bonds and mortgages, including healthcare mortgages but excluding equity release, was £1.8 billion (2018: £1.9 billion) over the remaining term of the portfolio at 31 December 2019. The total valuation allowance in respect of equity release assets was £1.5 billion at 31 December 2019 (2018: £1.3 billion). Total liabilities for the annuity business were £57.6 billion at 31 December 2019 (2018: £53.7 billion).
Expenses Maintenance expense assumptions for non-profit business are generally expressed as a per policy charge set with regards to an allocation of current year expense levels by broad category of business and using the policy counts for in-force business. The assumptions also include an allowance for prudence and increase by future expense inflation over the lifetime of each contract. Expense inflation is assumed to be in line with RPI, and in line with external agreements for business administered externally. An additional liability is held if projected per-policy expenses in future years are expected to exceed current assumptions. Further, explicit project expense liabilities are held for non-discretionary project costs that typically relate to mandatory requirements. Expense-related liabilities are only held where expenses are not covered by anticipated future profits in the liability methodology, notably for unit-linked contracts. Investment expense assumptions are generally expressed as a proportion of the assets backing the liabilities.

Notes to the consolidated financial statements continued
Aviva plc Preliminary announcement 2019 66
Overview Analysis of assets Other information
IFRS Income, expenses & capital
B12 – Insurance liabilities methodology and assumptions continued Mortality Mortality assumptions for non-profit business are set with regard to recent Company experience and general industry trends. The mortality tables used in the valuation are summarised below:
Mortality tables used 2019 2018
Assurances Non-profit AM00/AF00 or TM08/TF08 adjusted for
smoker status and age/sex specific factors
AM00/AF00 or TM08/TF08 adjusted for smoker status and age/sex specific
factors Pure endowments and deferred annuities before vesting AM00/AF00 adjusted AM00/AF00 adjusted Annuities in payment Pensions business and general annuity business PMA08 HAMWP /PFA08 HAMWP
adjusted plus allowance for future mortality improvement
PMA08 HAMWP /PFA08 HAMWP adjusted plus allowance for future
mortality improvement Bulk purchase annuities CV3 CV2
For the largest portfolio of pensions annuity business, the underlying mortality assumptions for males are 105.4% of PMA08 HAMWP adjusted (2018: 105.8% of PMA08 HAMWP adjusted) with base year 2008; for females the underlying mortality assumptions are 99.5% of PFA08 HAMWP adjusted (2018: 99.0% of PFA08 HAMWP adjusted) with base year 2008.
Improvements are based on ‘CMI_2018 (S=7.25) Advanced with adjustments’ (2018: ‘CMI_2017 (S=7.5) Advanced with adjustments’) with a long-term improvement rate of 1.75% (2018: 1.75%) for males and 1.5% (2018: 1.5%) for females, both with an additional improvement for prudence of 0.5% (2018: 0.5%) to all future annual improvement adjustments. The CMI_2018 tables have been adjusted by adding 0.25% (2018: 0.25%) and 0.35% (2018: 0.35%) to the initial rate of mortality improvements for males and females respectively (to allow for greater mortality improvements in the annuitant population relative to the general population on which CMI_2018 is based), and uses the advanced parameters to taper the long-term improvement rates to zero between ages 90 and 115 (the ‘core’ parameters taper the long-term improvement rates to zero between ages 85 and 110). The tapering approach is unchanged from that used at 2018. In addition, on a significant proportion of individual annuity business, year-specific adjustments are made to allow for potential selection effects due to the development of the Enhanced Annuity market and covering possible selection effects from pension freedom reforms.
With-profits business The Group’s UK with-profits funds are evaluated by reference to FRS 27, which was grandfathered under IFRS 4, prior to the adoption of Solvency II. This uses an approach of calculating the realistic liabilities for the contracts. The realistic liabilities include the with-profits benefit reserve (WPBR), and an additional provision for the expected cost of any guarantees and options in excess of the WPBR.
The WPBR for an individual contract is generally calculated on a retrospective basis, and represents the accumulation of the premiums paid on the contract, allowing for investment return, taxation, expenses and any other charges levied on the contract.
Provisions for guarantees and options within realistic liabilities are measured using market-consistent stochastic models. A stochastic approach includes measuring the time value of guarantees and options, which represents the additional cost arising from uncertainty surrounding future economic conditions. Non-market-related assumptions (for example, persistency, mortality and expenses) are assessed on a best estimate basis with reference to Company and wider industry experience, adjusted to take into account future trends.
The with-profits business is valued by adjusting Solvency II Best Estimate Liabilities and results in a valuation in accordance with FRS 27.
Future investment return A risk-free rate equal to the spot yield on UK swaps is used for the valuation of with-profits business. The rates vary according to the outstanding term of the policy, with a typical rate as at 31 December 2019 of 1.02% (2018: 1.44%) for a policy with ten years outstanding.
Volatility of investment return Volatility assumptions are set with reference to implied volatility data on traded market instruments, where available, or on a best estimate basis where not.
Volatility 2019 2018
Equity returns 16.2% 18.0% Property returns 15.8% 15.8%
The equity volatility used depends on term, money-ness and region. The figure shown is for a sample UK equity, at the money, with a ten-year term.

Notes to the consolidated financial statements continued
Aviva plc Preliminary announcement 2019 67
Overview Analysis of assets Other information
IFRS Income, expenses & capital
B12 – Insurance liabilities methodology and assumptions continued Future regular bonuses Annual bonus assumptions for 2020 have been set consistently with the year-end 2019 declaration. Future annual bonus rates reflect the principles and practices of each fund. In particular, the level is set with regard to the projected margin for final bonus and the change from one year to the next is limited to a level consistent with past practice.
Mortality Mortality assumptions for with-profits business are set with regard to recent Company experience and general industry trends. The mortality tables used in the valuation are summarised below:
Mortality table used 2019 2018
Assurances, pure endowments and deferred annuities before vesting Nil or Axx00 adjusted Nil or Axx00 adjusted
Pensions business after vesting and pensions annuities in payment
PMA08 HAMWP/PFA08 HAMWP adjusted plus allowance for future
mortality improvement
PMA08 HAMWP/PFA08 HAMWP adjusted plus allowance for future
mortality improvement
Allowance for future mortality improvement is in line with the rates for non-profit business.
Expenses Maintenance fee assumptions for with-profits business are generally expressed as a fixed per policy charge in line with a memorandum of understanding between the with-profits funds and the non-profit fund within the company. The memorandum of understanding specifies the charges for a five-year period ending in 2023, and specifies a level of charge inflation during that period of CPI+2% or CPI+3% depending on the product type. After the end of the period covered by the memorandum of understanding we assume that the charges will remain unchanged, and a level of charge inflation of RPI+1% for all products will apply. Any excess of expenses charged by Aviva Life Services UK Limited (UKLS) to Aviva Life & Pensions UK Limited (AVLAP) over the charges specified by the memorandum of understanding is borne by the non-profit fund.
At 31 December 2018 maintenance expense assumptions for with-profits business were generally expressed as a fixed per policy charge in line with agreements between UKLS and AVLAP. The assumptions increased by a future inflation charge over the lifetime of each contract, which was 50% RPI, 100% RPI or 100% RPI + 1% depending on product type. Any excess of expenses charged by UKLS to AVLAP over the charges specified by the agreements was borne by the non-profit business.
Guarantees and options The provisions held in respect of guaranteed annuity options for the with-profits and the non-profit business are a prudent assessment of the additional liability incurred under the option on a basis and method consistent with that used to value basic policy liabilities, and includes a prudent assessment of the proportion of policyholders who will choose to exercise the option.
(ii) France The majority of reserves arise from single premium savings products and are based on the accumulated fund values, adjusted to maintain consistency with the value of the assets backing the policyholder liabilities. For traditional business, the net premium method is used for prospective valuations, in accordance with local regulation, where the valuation assumptions depend on the date of issue of the contract. The valuation discount rate also depends on the original duration of the contract and mortality rates are based on industry tables.
Valuation discount rates Mortality tables used
2019 2018 2019 and 2018
TD73-77,TD88-90,TH00-02 TF00-02,
H_AVDBS,F_AVDBS Life assurances 0% to 4.5% 0% to 4.5% H_SSDBS, F_SSDBS Annuities 0% to 1.5% 0% to 2% TGF05/TGH05
(b) General insurance and health Outstanding claims provisions are estimated based on known facts at the date of estimation. Case estimates are set by skilled claims technicians and established case setting procedures. Claims above certain limits are referred to senior claims handlers for estimate authorisation.
No adjustments are made to the claims technicians’ case estimates included in booked claim provisions, except for rare occasions when the estimated ultimate cost of individual large or unusual claims may be adjusted, subject to internal reserve committee approval, to allow for uncertainty regarding, for example, the outcome of a court case. The ultimate cost of outstanding claims is then estimated by using a range of standard actuarial claims projection techniques, such as the Chain Ladder and Bornhuetter-Ferguson methods. Historical claims development is mainly analysed by accident period, although underwriting or notification period is also used where this is considered appropriate.
The assumptions used in most non-life actuarial projection techniques, including future rates of claims inflation or loss ratio assumptions, are implicit in the historical claims development data on which the projections are based. Additional qualitative judgement is used to assess the extent to which past trends may not apply in the future in order to arrive at a point estimate for the ultimate cost of claims that represents the likely outcome, from a range of possible outcomes, taking account of all the uncertainties involved. The range of possible outcomes does not, however, result in the quantification of a reserve range.
The following explicit assumptions are made which could materially impact the level of booked net reserves:

Notes to the consolidated financial statements continued
Aviva plc Preliminary announcement 2019 68
Overview Analysis of assets Other information
IFRS Income, expenses & capital
B12 – Insurance liabilities methodology and assumptions continued Discounting Outstanding claims provisions are based on undiscounted estimates of future claim payments, except for the following classes of business for which discounted provisions are held:
Discount rate Mean term of liabilities
Class 2019 2018 2019 2018
Reinsured London Market business 0.8% to 2.2% 1.0% to 2.9% 9 years 10 years Latent claims 0.8% to 2.2% 1.0% to 2.6% 10 to 12 years 11 to 18 years Structured settlements -0.2% to 2.7% 1.0% to 3.0% 11 to 35 years 9 to 37 years
The period of time which will elapse before the liabilities are settled has been estimated by modelling the settlement patterns of the underlying claims.
The discount rate that has been applied to latent claims reserves, structured settlements and reinsured London Market business is based on the swap curve in the relevant currency at the reporting date, having regard to the duration of the expected settlement dates of the claims. The range of discount rates used depends on the duration of the claims and is given in the table above. The duration of the claims span over 35 years, with the average duration being between 9 and 12 years depending on the geographical region.
At 31 December 2019, it is estimated that a 1% fall in the discount rates used would increase net claim reserves by approximately £120 million (2018: £100 million), excluding the offsetting effect on asset values as assets are not hypothecated across classes of business.
UK mesothelioma claims The level of uncertainty associated with latent claims is considerable due to the relatively small number of claims and the long-tail nature of the liabilities. UK mesothelioma claims account for a large proportion of the Group’s latent claims. The key assumptions underlying the estimation of these claims include claim numbers, the base average cost per claim, future inflation in the average cost of claims and legal fees.
The best estimate of the liabilities reflects the latest available market information and studies. Many different scenarios can be derived by flexing these key assumptions and applying different combinations of these assumptions. An upper and lower scenario can be derived by making reasonably likely changes to these assumptions, resulting in an estimate of £25 million (2018: £20 million) greater than the best estimate, or £35 million (2018: £30 million) lower than the best estimate. These scenarios do not, however, constitute an upper or lower bound on these liabilities.
Allowance for risk and uncertainty The uncertainties involved in estimating loss reserves are allowed for in the reserving process and by the estimation of explicit reserve uncertainty distributions. The reserve estimation basis requires all non-life businesses to calculate booked claim provisions as the best estimate of the cost of future claim payments, plus an explicit allowance for risk and uncertainty. The allowance for risk and uncertainty is calculated by each business unit in accordance with the requirements of the Group non-life reserving policy, taking into account the risks and uncertainties specific to each line of business and type of claim in that territory. The requirements of the Group non-life reserving policy also seek to ensure that the allowance for risk and uncertainty is set consistently across both business units and reporting periods.
Lump sum payments in settlement of bodily injury claims that are decided by the UK courts are calculated in accordance with the Ogden Tables and discount rate. The Ogden discount rate is set by the Lord Chancellor and is applied when calculating the present value of future care costs and loss of earnings for claims settlement purposes. Following the announcement by the Lord Chancellor on 15 July 2019 to increase the Ogden discount rate from the -0.75% set in 2017 to -0.25% (rate retained at -0.75% in Scotland), balance sheet reserves in the UK have been calculated using a discount rate of -0.25% at 31 December 2019. This has resulted in a strengthening of claims reserves in the UK of £45 million. At December 2018, balance sheet reserves were calculated using a rate of 0.00%. The Ogden discount rate is expected to be reviewed by the Lord Chancellor within five years.

Notes to the consolidated financial statements continued
Aviva plc Preliminary announcement 2019 69
Overview Analysis of assets Other information
IFRS Income, expenses & capital
B13 – Liabilities for investment contracts This note analyses our gross liabilities for investment contracts by type of product and describes the calculation of these liabilities.
(a) Carrying amount The liabilities for investment contracts (gross of reinsurance) at 31 December comprised:
2019
£m 2018
£m
Long-term business Liabilities for participating investment contracts 92,762 90,455 Liabilities for non-participating investment contracts 137,689 120,354 Total 230,451 210,809
Less: Liabilities classified as held for sale (8,324) (8,341)
222,127 202,468
(b) Group practice Investment contracts are those that do not transfer significant insurance risk from the contract holder to the issuer, and are therefore treated as financial instruments under IFRS.
Many investment contracts contain a discretionary participation feature in which the contract holder has a contractual right to receive additional benefits as a supplement to guaranteed benefits. These are referred to as participating contracts and are measured according to the methodology for long-term business liabilities (see note B12). They are not measured at fair value as there is currently no agreed definition of fair valuation for discretionary participation features under IFRS. In the absence of such a definition, it is not possible to provide a range of estimates within which a fair value is likely to fall. The IASB deferred consideration of participating contracts to the IFRS 17 insurance standard, which is expected to apply to annual reporting periods beginning on or after 1 January 2022.
For participating business, the discretionary participation feature is recognised separately from the guaranteed element and is classified as a liability, referred to as unallocated divisible surplus, except for the with-profits sub-fund supported by the RIEESA.
Investment contracts that do not contain a discretionary participation feature are referred to as non-participating contracts and the liability is measured at either fair value or amortised cost. We currently have no non-participating investment contracts measured at amortised cost.
Of the non-participating investment contracts measured at fair value, £137,040 million at 31 December 2019 (2018: £119,402 million) are unit-linked in structure and the fair value liability is equal to the current unit fund value, including any unfunded units, plus if required, additional non-unit reserves based on a discounted cash flow analysis. These contracts are generally classified as Level 1 in the fair value hierarchy, as the unit reserve is calculated as the publicly quoted unit price multiplied by the number of units in issue, and any non-unit reserve is insignificant.
For unit-linked business, a deferred acquisition cost asset and deferred income reserve liability are recognised in respect of transaction costs and front-end fees respectively, that relate to the provision of investment management services, and which are amortised on a systematic basis over the contract term.
For non-participating investment contracts acquired in a business combination, an acquired value of in-force business asset is recognised in respect of the fair value of the investment management services component of the contracts, which is amortised on a systematic basis over the useful lifetime of the related contracts. The amount of the acquired value of in-force business asset is shown in note B24, which relates primarily to the acquisition of Friends Life in 2015 and Friends First in 2018.
(c) Movements in the year The following movements have occurred in the gross provisions for investment contracts in the year:
(i) Participating investment contracts
2019
£m 2018
£m
Carrying amount at 1 January 90,455 87,654 Liabilities in respect of new business 6,991 6,301 Expected change in existing business (4,857) (4,491) Variance between actual and expected experience 4,751 (1,441) Impact of operating assumption changes 173 59 Impact of economic assumption changes 204 (40) Other movements recognised as an expense1 103 152 Change in liability recognised as an expense2 7,365 540 Effect of portfolio transfers, acquisitions and disposals3 — 427 Foreign exchange rate movements (4,054) 774 Other movements4 (1,004) 1,060
Carrying amount at 31 December 92,762 90,455 1 Other movements recognised as an expense during 2019 relate primarily to a special bonus distribution to with-profits policyholders and the recognition of unitised with-profits annual management charges in UK Life. The
movement in 2018 primarily relates to a special bonus distribution to with-profits policyholders in UK Life. 2 Total interest expense for participating investment contracts recognised in profit or loss is £5,269 million (2018: £(419) million). 3 The movement during 2018 relates to the acquisition of Friends First in Ireland. 4 Other movements during 2019 include the reclassification in UK from participating investment to insurance contracts (£(972) million) and from participating investment to outstanding claims reserves (£(32) million). The
movement during 2018 relates to the reclassification in France from non-participating investment contracts to participating investment contracts (£151 million) and from insurance to participating investment contracts (£56 million) and to a reclassification from non-participating investment contracts to participating investment contracts in the UK (£853 million).

Notes to the consolidated financial statements continued
Aviva plc Preliminary announcement 2019 70
Overview Analysis of assets Other information
IFRS Income, expenses & capital
B13 – Liabilities for investment contracts continued For many types of long-term business, including unit-linked and participating funds, movements in asset values are offset by corresponding changes in liabilities, limiting the net impact on profit.
The variance between actual and expected experience in 2019 of £4.8 billion is primarily the result of the impact of strong global equity performance.
The impact of assumption changes in the analysis shows the resulting movement in the carrying value of participating investment contract liabilities. For participating business, a movement in liabilities is generally offset by a corresponding adjustment to the unallocated divisible surplus and does not impact profit. Where assumption changes do impact profit, these are included in the effect of changes in assumptions and estimates during the year shown in note B15, together with the impact of movements in related non-financial assets.
(ii) Non-participating investment contracts
2019
£m 2018
£m
Carrying amount at 1 January 120,354 124,995 Liabilities in respect of new business 5,520 4,869 Expected change in existing business (3,742) (5,509) Variance between actual and expected experience 16,345 (5,539) Impact of operating assumption changes (22) (10) Impact of economic assumption changes (1) (81) Other movements recognised as an expense 2 6 Change in liability 18,102 (6,264) Effect of portfolio transfers, acquisitions and disposals1 — 2,494 Foreign exchange rate movements (575) 133 Other movements2 (192) (1,004)
Carrying amount at 31 December 137,689 120,354 1 The movement during 2018 relates to the acquisition of Friends First in Ireland. 2 Other movements during 2019 mainly relate to the reclassification in UK from non-participating investment to outstanding claims reserves (£(180) million). Other movements during 2018 relates to the reclassification in
France from non-participating investment contracts to participating investment contracts (£(151) million) and to a reclassification from non-participating investment contracts to participating investment contracts in the UK (£(853) million).
For unit-linked investment contracts, movements in asset values are offset by corresponding changes in liabilities, limiting the net impact on profit. The variance between actual and expected experience in 2019 of £16.3 billion is primarily the result of the impact of strong global equity performance.
The impact of assumption changes in the above analysis shows the resulting movement in the carrying value of non-participating investment contract liabilities. The impacts of assumption changes on profit are included in the effect of changes in assumptions and estimates during the year shown in note B15, which combines participating and non-participating investment contracts together with the impact of movements in related non-financial assets.
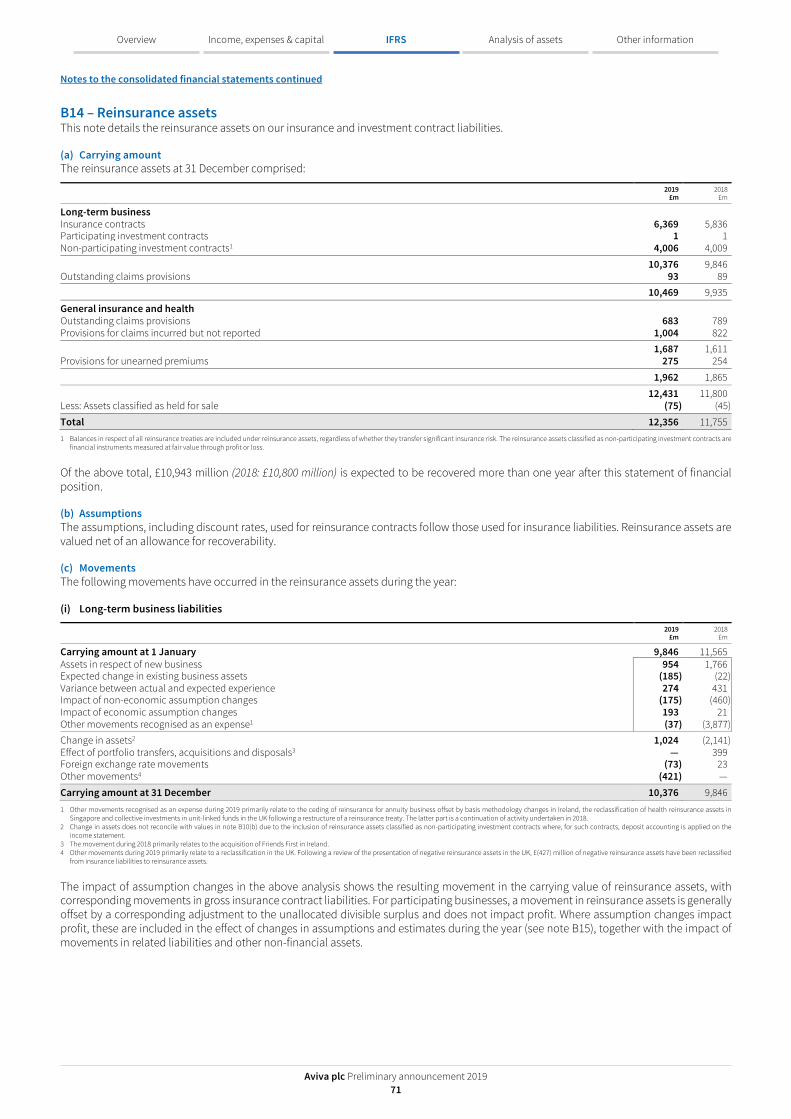
Notes to the consolidated financial statements continued
Aviva plc Preliminary announcement 2019 71
Overview Analysis of assets Other information
IFRS Income, expenses & capital
B14 – Reinsurance assets This note details the reinsurance assets on our insurance and investment contract liabilities.
(a) Carrying amount The reinsurance assets at 31 December comprised:
2019
£m 2018
£m
Long-term business Insurance contracts 6,369 5,836 Participating investment contracts 1 1 Non-participating investment contracts1 4,006 4,009
10,376 9,846 Outstanding claims provisions 93 89 10,469 9,935
General insurance and health Outstanding claims provisions 683 789 Provisions for claims incurred but not reported 1,004 822 1,687 1,611 Provisions for unearned premiums 275 254
1,962 1,865
12,431 11,800 Less: Assets classified as held for sale (75) (45)
Total 12,356 11,755 1 Balances in respect of all reinsurance treaties are included under reinsurance assets, regardless of whether they transfer significant insurance risk. The reinsurance assets classified as non-participating investment contracts are
financial instruments measured at fair value through profit or loss.
Of the above total, £10,943 million (2018: £10,800 million) is expected to be recovered more than one year after this statement of financial position.
(b) Assumptions The assumptions, including discount rates, used for reinsurance contracts follow those used for insurance liabilities. Reinsurance assets are valued net of an allowance for recoverability.
(c) Movements The following movements have occurred in the reinsurance assets during the year:
(i) Long-term business liabilities
2019
£m 2018
£m
Carrying amount at 1 January 9,846 11,565 Assets in respect of new business 954 1,766 Expected change in existing business assets (185) (22) Variance between actual and expected experience 274 431 Impact of non-economic assumption changes (175) (460) Impact of economic assumption changes 193 21 Other movements recognised as an expense1 (37) (3,877) Change in assets2 1,024 (2,141) Effect of portfolio transfers, acquisitions and disposals3 — 399 Foreign exchange rate movements (73) 23 Other movements4 (421) —
Carrying amount at 31 December 10,376 9,846 1 Other movements recognised as an expense during 2019 primarily relate to the ceding of reinsurance for annuity business offset by basis methodology changes in Ireland, the reclassification of health reinsurance assets in
Singapore and collective investments in unit-linked funds in the UK following a restructure of a reinsurance treaty. The latter part is a continuation of activity undertaken in 2018. 2 Change in assets does not reconcile with values in note B10(b) due to the inclusion of reinsurance assets classified as non-participating investment contracts where, for such contracts, deposit accounting is applied on the
income statement. 3 The movement during 2018 primarily relates to the acquisition of Friends First in Ireland. 4 Other movements during 2019 primarily relate to a reclassification in the UK. Following a review of the presentation of negative reinsurance assets in the UK, £(427) million of negative reinsurance assets have been reclassified
from insurance liabilities to reinsurance assets.
The impact of assumption changes in the above analysis shows the resulting movement in the carrying value of reinsurance assets, with corresponding movements in gross insurance contract liabilities. For participating businesses, a movement in reinsurance assets is generally offset by a corresponding adjustment to the unallocated divisible surplus and does not impact profit. Where assumption changes impact profit, these are included in the effect of changes in assumptions and estimates during the year (see note B15), together with the impact of movements in related liabilities and other non-financial assets.

Notes to the consolidated financial statements continued
Aviva plc Preliminary announcement 2019 72
Overview Analysis of assets Other information
IFRS Income, expenses & capital
B14 – Reinsurance assets continued (ii) General insurance and health claims liabilities
2019
£m 2018
£m
Carrying amount at 1 January 1,611 1,729 Impact of changes in assumptions 73 (22) Reinsurers’ share of claim losses and expenses
Incurred in current year 195 176 Incurred in prior years 96 40
Reinsurers’ share of incurred claim losses and expenses 291 216 Less: Reinsurance recoveries received on claims
Incurred in current year (53) (54) Incurred in prior years (227) (259)
Reinsurance recoveries received in the year (280) (313) Unwind of discounting 10 8
Change in reinsurance asset recognised as income (note B10(b)) 94 (111) Effect of portfolio transfers, acquisitions and disposals1 — (9) Foreign exchange rate movements (15) 2 Other movements (3) —
Carrying amount at 31 December 1,687 1,611 1 The movement during 2018 relates to the proportion of reinsurance assets held by Avipop which was sold by Italy in 2018.
(iii) General insurance and health unearned premiums
2019
£m 2018
£m
Carrying amount at 1 January 254 257 Premiums ceded to reinsurers in the year 683 392 Less: Reinsurers’ share of premiums earned during the year (661) (375) Changes in reinsurance asset recognised as income 22 17 Reinsurers’ share of portfolio transfers and acquisitions1 — (21) Foreign exchange rate movements (1) 1
Carrying amount at 31 December 275 254 1 The movement during 2018 relates to the proportion of Avipop sold by Italy in 2018 that was ceded to reinsurers.

Notes to the consolidated financial statements continued
Aviva plc Preliminary announcement 2019 73
Overview Analysis of assets Other information
IFRS Income, expenses & capital
B15 – Effect of changes in assumptions and estimates during the year This note analyses the impact of changes in estimates and assumptions from 2018 to 2019, on liabilities for insurance and investment contracts, and related assets and liabilities, such as unallocated divisible surplus, reinsurance, deferred acquisition costs and acquired value of in-force business and does not allow for offsetting movements in the value of backing financial assets.
Effect on profit 2019
£m
Effect on profit 2018
£m
Assumptions Long-term insurance business Interest rates (2,978) 1,061 Expenses (47) 9 Persistency rates (124) 23 Mortality and morbidity for assurance contracts (38) 24 Mortality for annuity contracts 830 780 Tax and other assumptions 9 18 Long-term investment business Expenses — (1) General insurance and health business Change in discount rate assumptions (54) 1
Total (2,402) 1,915
The impact of interest rates on long-term business relates primarily to annuities in the UK (including any change in credit default and reinvestment risk provisions), where a reduction in the discount rate, in response to decreasing interest rates and narrowing credit spreads, has increased liabilities.
The impact of expenses on long-term business relates primarily to the UK and Ireland, where reserves have increased by £55 million following a review of recent experience including the margin for prudence. This has been offset slightly by £8 million due to favourable expense experience in Singapore.
The impact of persistency on long-term business relates primarily to the UK. Reserves have increased by £127 million following a review of recent experience, driven by the introduction of age-dependent retirement rates for pension business and unfavourable lapse experience.
The impact of mortality for annuitant contracts on long-term business relates primarily to the UK. In 2019, there has been a reduction in reserves due to longevity assumptions and modelling which include: • Updates to base mortality to reflect recent experience for individual annuities of £81 million; • Updates to the rate of mortality improvements for individual annuities, including CMI 2018 and a change in smoothing parameter, of
£410 million; • Refinements to modelling of bulk purchase annuities together with a change to base mortality, improvements and a change in smoothing
parameter, of £231 million; • Refinements to modelling of enhanced annuities of £58 million; and • Other less significant movements of £19 million.
In Ireland there was a slight reduction in the reserves of £31 million following a review of recent experience.
In 2018 the impact of mortality for annuitant contracts on long-term business relates primarily to the UK. This resulted in a reduction in reserves due to longevity assumptions and modelling which included: • Updates to base mortality to reflect recent experience including the 2008 series tables for individual annuities of £345 million; • Updates to the rate of mortality improvements including CMI 2017 of £251 million; • Refinements to modelling of bulk purchase annuities together with a change to base mortality and improvements of £132 million; and • Other less significant movements of £24 million.
In Ireland and Singapore there was a slight reduction in the reserves of £28 million following a review of recent experience.
In the general insurance and health business, a negative impact of £(54) million (2018: £1 million positive) has arisen primarily as a result of a decrease in the interest rates used to discount claim reserve for both periodic payment orders and latent claims.

Notes to the consolidated financial statements continued
Aviva plc Preliminary announcement 2019 74
Overview Analysis of assets Other information
IFRS Income, expenses & capital
B16 – Unallocated divisible surplus An unallocated divisible surplus (UDS) is established where the nature of policy benefits is such that the division between shareholder reserves and policyholder liabilities is uncertain at the reporting date. Therefore, the expected duration for settlement of the UDS is undefined.
This note shows the movements in the UDS during the year.
2019
£m 2018
£m
Carrying amount at 1 January 5,949 9,101 Change in participating fund assets 9,411 (4,139) Change in participating fund liabilities (5,426) 902 Change in liability recognised as an expense 3,985 (3,237) Effect of portfolio transfers, acquisition and disposals1 — 48 Foreign exchange rate movements (337) 37
Carrying amount at 31 December 9,597 5,949 1 The movement during 2018 relates to the acquisition of Friends First (£66 million), and the disposal of the remainder of the Spanish business (£18 million).
The amount of UDS at 31 December 2019 has increased to £9.6 billion (2018: £5.9 billion). The increase is mainly due to market movements in Europe as a result of decreasing interest rates, narrowing credit spreads and increasing equity returns.
Where the aggregate amount of participating assets is less than the participating liabilities within a fund then the shortfall may be held as negative UDS, subject to recoverability testing as part of the liability adequacy requirements of IFRS 4. There are no material negative UDS balances at the participating fund-level within each life entity in the current period (2018: £355 million negative UDS within five funds in Italy).
B17 – Borrowings Our borrowings are classified as either core structural borrowings, which are included within the Group’s capital employed, or operational borrowings drawn by operating subsidiaries. This note shows the carrying values of each type, and movements during the year.
(a) Analysis of total borrowings Total borrowings comprise:
2019
£m 2018
£m
Core structural borrowings, at amortised cost 7,496 7,699 Operational borrowings, at amortised cost 338 496 Operational borrowings, at fair value 1,233 1,225 1,571 1,721
9,067 9,420 Less: Liabilities classified as held for sale (28) — 9,039 9,420
(b) Movements during the year Movements in borrowings during the year were:
2019 2018
Core Structural
£m Operational
£m Total
£m
Core Structural
£m Operational
£m Total
£m
New borrowings drawn down, excluding commercial paper, net of expenses — 75 75 649 126 775 Repayment of borrowings, excluding commercial paper1 (210) (231) (441) (1,178) (211) (1,389) Movement in commercial paper2 19 — 19 (419) — (419) Net cash outflow (191) (156) (347) (948) (85) (1,033) Foreign exchange rate movements (204) (28) (232) 42 6 48 Borrowings reclassified/(loans repaid) for non-cash consideration1 210 (4) 206 — 65 65 Fair value movements — 38 38 — 89 89 Amortisation of discounts and other non-cash items (23) — (23) (35) — (35) Movements in debt held by Group companies3 5 — 5 — — —
Movements in the year (203) (150) (353) (941) 75 (866) Balance at 1 January 7,699 1,721 9,420 8,640 1,646 10,286
Balance at 31 December 7,496 1,571 9,067 7,699 1,721 9,420 1 On 17 October 2019, notification was given that the Group would redeem the 6.875% £210 million tier 1 notes. At that date, the instruments were reclassified as a financial liability of £210 million, representing the fair value at
that date. On 21 November 2019 the instruments were redeemed in full at a cost of £210 million. The difference of £21 million between the carrying amount of £231 million and fair value of £210 million has been charged to retained earnings.
2 Gross issuances of commercial paper were £505 million in 2019 (2018: £2,372 million), offset by repayments of £486 million (2018: £2,791 million). 3 Certain subsidiary companies have purchased subordinated notes and securitised loan notes issued by Group companies as part of their investment portfolios. In the consolidated statement of financial position, borrowings
are shown net of these holdings but movements in such holdings over the year are reflected in the tables above.
All movements in fair value in 2018 and 2019 on securitised mortgage loan notes designated as fair value through profit or loss were attributable to changes in market conditions.

Notes to the consolidated financial statements continued
Aviva plc Preliminary announcement 2019 75
Overview Analysis of assets Other information
IFRS Income, expenses & capital
B18 – Pension obligations The Group operates a number of defined benefit and defined contribution pension schemes. The material defined benefit schemes are in the UK, Ireland and Canada. The assets and liabilities of these defined benefit schemes as at 31 December 2019 are shown below.
2019 2018
UK £m
Ireland £m
Canada £m
Total £m
UK £m
Ireland £m
Canada £m
Total £m
Total fair value of scheme assets (see b(ii) below) 17,671 833 264 18,768 17,059 775 249 18,083 Present value of defined benefit obligation (15,416) (1,035) (341) (16,792) (14,246) (950) (324) (15,520)
Net IAS 19 surpluses/(deficits) in the schemes 2,255 (202) (77) 1,976 2,813 (175) (75) 2,563
Surpluses included in other assets 2,746 — — 2,746 3,256 — — 3,256 Deficits included in provisions (491) (202) (77) (770) (443) (175) (75) (693)
Net IAS 19 surpluses/(deficits) in the schemes 2,255 (202) (77) 1,976 2,813 (175) (75) 2,563
Movements in the scheme surpluses and deficits Movements in the pension schemes’ surpluses and deficits comprise:
2019
Fair Value of scheme assets
£m
Present Value of defined
benefit obligation
£m
IAS 19 Pensions net
surplus/ (deficits)
£m
Net IAS 19 surplus in the schemes at 1 January 18,083 (15,520) 2,563 Administrative expenses1 — (19) (19) Total pension cost charged to net operating expenses — (19) (19) Net interest credited/(charged) to investment income/(finance costs)2 479 (406) 73 Total recognised in income 479 (425) 54 Remeasurements: Actual return on these assets 1,141 — 1,141 Less: Interest income on scheme assets (479) — (479) Return on scheme assets excluding amounts in interest income 662 — 662 Losses from change in financial assumptions — (1,824) (1,824) Gains from change in demographic assumptions — 165 165 Experience gains — 130 130 Total recognised in other comprehensive income 662 (1,529) (867) Employer contributions 215 — 215 Plan participant contributions 4 (4) — Benefits paid (612) 612 — Administrative expenses paid from scheme assets1 (19) 19 — Foreign exchange rate movements (44) 55 11 Net IAS 19 surplus in the schemes at 31 December 18,768 (16,792) 1,976 1 Administrative expenses are expensed as incurred. 2 Net interest income of £96 million has been credited to investment income and net interest expense of £23 million has been charged to finance costs.
During the period the ASPS completed a bulk annuity buy-in transaction with Aviva Life & Pensions UK Limited, a Group Company. Due to different measurement bases applying for accounting purposes, the premium paid by the scheme exceeded the valuation of the plan asset recognised. This is the primary reason for the reduction in the scheme surplus over the year and has been recognised as an actuarial loss in the actual return on assets within other comprehensive income. The plan asset recognised is transferable and so has not been subject to consolidation within the Group’s financial statements.

Notes to the consolidated financial statements continued
Aviva plc Preliminary announcement 2019 76
Overview Analysis of assets Other information
IFRS Income, expenses & capital
B18 – Pension obligations continued
2018
Fair Value of scheme assets
£m
Present Value of defined
benefit obligation
£m
IAS 19 Pensions net
surplus/ (deficits)
£m
Net IAS 19 surplus in the schemes at 1 January 18,678 (16,043) 2,635 Past service costs – amendments1 — (63) (63) Administrative expenses2 — (19) (19) Total pension cost charged to net operating expenses — (82) (82) Net interest credited/(charged) to investment income/(finance costs)3 442 (375) 67
Total recognised in income 442 (457) (15)
Remeasurements: Actual return on these assets (182) — (182) Less: Interest income on scheme assets (442) — (442) Return on scheme assets excluding amounts in interest income (624) — (624) Gains from change in financial assumptions — 622 622 Losses from change in demographic assumptions — (185) (185) Experience losses — (93) (93)
Total recognised in other comprehensive income (624) 344 (280)
Acquisitions 87 (96) (9) Employer contributions 236 — 236 Plan participant contributions 9 (9) — Benefits paid (724) 724 — Administrative expenses paid from scheme assets2 (23) 19 (4) Foreign exchange rate movements 2 (2) —
Net IAS 19 surplus in the schemes at 31 December 18,083 (15,520) 2,563 1 Past service costs include a charge of £63 million relating to the estimated additional liability arising in the UK defined benefit pension schemes as a result of the requirement to equalise members’ benefits for the effects of
Guaranteed Minimum Pension (GMP). This additional liability has arisen following the High Court judgement in October 2018 in the case involving Lloyds Banking Group. 2 Administrative expenses are expensed as incurred. 3 Net interest income of £89 million has been credited to investment income and net interest expense of £22 million has been charged to finance costs.

Notes to the consolidated financial statements continued
Aviva plc Preliminary announcement 2019 77
Overview Analysis of assets Other information
IFRS Income, expenses & capital
B19 – Related party transactions This note gives details of the transactions between Group companies and related parties which comprise our joint ventures, associates and staff pension schemes.
The Group undertakes transactions with related parties in the normal course of business. Loans to related parties are made on normal arm’s-length commercial terms.
Services provided to, and by related parties
2019 2018
Income earned in
the year £m
Expenses incurred in
the year £m
Payable at year end
£m
Receivable at year end
£m
Income earned in
the year £m
Expenses incurred in
the year £m
Payable at year end
£m
Receivable at year end
£m
Associates 1 — — 4 1 — — 2 Joint ventures 54 — — 4 49 — (1) 2 Employee pension schemes 9 — — 6 10 — — 7
64 — — 14 60 — (1) 11
Transactions with joint ventures in the UK relate to the property management undertakings. The Group has equity interests in these joint ventures, together with the provision of administration services and financial management to many of them. Our fund management companies also charge fees to these joint ventures for administration services and for arranging external finance.
Key management personnel of the Company may from time to time purchase insurance, savings, asset management or annuity products marketed by group companies on equivalent terms to those available to all employees of the Group. In 2019, other transactions with key management personnel were not deemed to be significant either by size or in the context of their individual financial positions.
Our UK fund management companies manage most of the assets held by the Group’s main UK staff pension scheme, for which they charge fees based on the level of funds under management. The main UK scheme holds investments in Group-managed funds and insurance policies with other group companies. As at 31 December 2019, the Friends Provident Pension Scheme (‘FPPS’), acquired in 2015 as part of the acquisition of the Friends Life business, held an insurance policy of £646 million (2018: £620 million) issued by a group company, which eliminates on consolidation.
The related parties’ receivables are not secured and no guarantees were received in respect thereof. The receivables will be settled in accordance with normal credit terms.
During the period, the ASPS completed a bulk annuity buy-in transaction with Aviva Life & Pensions UK Limited (AVLAP), a Group company. At inception, the buy-in insured approximately 4,300 deferred and 1,500 current pensioner liabilities. A premium of £1,665 million was paid by the scheme to AVLAP, with AVLAP recognising gross insurance liabilities of £1,334 million. The difference between the premium and the gross liabilities implies a profit of £331 million, which does not include costs incurred by the Group associated with the transaction, and is driven primarily by differences between the measurement bases used to calculate the premium and the accounting value of the associated gross liabilities. The ASPS recognised a plan asset of £1,126 million, with the difference between the plan asset recognised and the premium paid being recognised as an actuarial loss through Other Comprehensive Income. As at 31 December 2019, AVLAP recognised technical provisions of £1,243 million in relation to the buy-in which have been included within the Group’s gross insurance liabilities, and the ASPS held a transferable plan asset of £1,144 million which does not eliminate on consolidation.

Notes to the consolidated financial statements continued
Aviva plc Preliminary announcement 2019 78
Overview Analysis of assets Other information
IFRS Income, expenses & capital
B20 – Risk management This note sets out the major risks our businesses and our shareholders face and describes the Group’s approach to managing these. It also gives sensitivity analysis around the major economic and non-economic assumptions that can cause volatility in the Group’s earnings and capital position.
(a) Risk management framework The risk management framework in Aviva forms an integral part of the management and Board processes and decision-making framework across the Group. The key elements of our risk management framework comprise risk appetite; risk governance, including risk policies and business standards, risk oversight committees and roles and responsibilities; and the processes we use to identify, measure, manage, monitor and report risks, including the use of our risk models and stress and scenario testing.
For the purposes of risk identification and measurement, and aligned to Aviva’s risk policies, risks are usually grouped by risk type: credit, market, liquidity, life insurance (including long-term health), general insurance (including short-term health), asset management and operational risk. Risks falling within these types may affect a number of metrics including those relating to balance sheet strength, liquidity and profit. They may also affect the performance of the products we deliver to our customers and the service to our customers and distributors, which can be categorised as risks to our brand and reputation or as conduct risk.
To promote a consistent and rigorous approach to risk management across all businesses we have a set of risk policies and business standards which set out the risk strategy, appetite, framework and minimum requirements for the Group’s worldwide operations. The business chief executive officers make an annual declaration supported by an opinion from the business chief risk officers that the system of governance and internal controls was effective and fit for purpose for their business throughout the year.
A regular top-down key risk identification and assessment process is carried out by the risk function. This includes the consideration of emerging risks and is supported by deeper thematic reviews. This process is replicated at the business unit level. The risk assessment processes are used to generate risk reports which are shared with the relevant risk committees.
Risk models are an important tool in our measurement of risks and are used to support the monitoring and reporting of the risk profile and in the consideration of the risk management actions available. We carry out a range of stress (where one risk factor, such as equity returns, is assumed to vary) and scenario (where combinations of risk factors are assumed to vary) tests to evaluate their impact on the business and the management actions available to respond to the conditions envisaged. For those risk types managed through the holding of capital, being our principal risk types except for liquidity risk, we measure and monitor our risk profile on the basis of the Solvency II solvency capital requirement.
Roles and responsibilities for risk management in Aviva are based around the ‘three lines of defence model’ where ownership for risk is taken at all levels in the Group. Line management in the business is accountable for risk management, including the implementation of the risk management framework and embedding of the risk culture. The risk function is accountable for quantitative and qualitative oversight and challenge of the risk identification, measurement, monitoring, management and reporting processes and for developing the risk management framework. Internal Audit provides an independent assessment of the risk framework and internal control processes.
Board oversight of risk and risk management across the Group is maintained on a regular basis through its Risk Committee and Customer, Conduct and Reputation Committee. The Board has overall responsibility for determining risk appetite, which is an expression of the risk the business is willing to take. Risk appetites are set relative to capital and liquidity at Group and in the business units.
Risk appetites, requiring management action if breached, are also set for interest rate and foreign exchange risk (calculated on the basis of the Solvency II solvency capital requirement), and liquidity risk (based on stressing forecast central liquid assets and cash inflows and outflows over a specified time horizon). For other risk types the Group sets Solvency II capital tolerances. The Group’s position against risk appetite and capital tolerances is monitored and reported to the Board on a regular basis. Long-term sustainability depends upon the protection of franchise value and good customer relationships. As such, Aviva has a risk preference that we will not accept risks that materially impair the reputation of the Group and requires that customers are always treated with integrity. The oversight of risk and risk management at the Group level is supported by the Asset Liability Committee, which focuses on business and financial risks, and the Operational Risk Committee which focuses on operational and reputational risks. Similar committee structures with equivalent terms of reference exist in the business units.
The risk management framework of a small number of our joint ventures and strategic equity holdings differs from the Aviva framework outlined in this note. We work with these entities to understand how their risks are managed and to align them, where possible, with Aviva’s framework.
Further information on the types and management of specific risk types is given in sections (b) to (h) below.
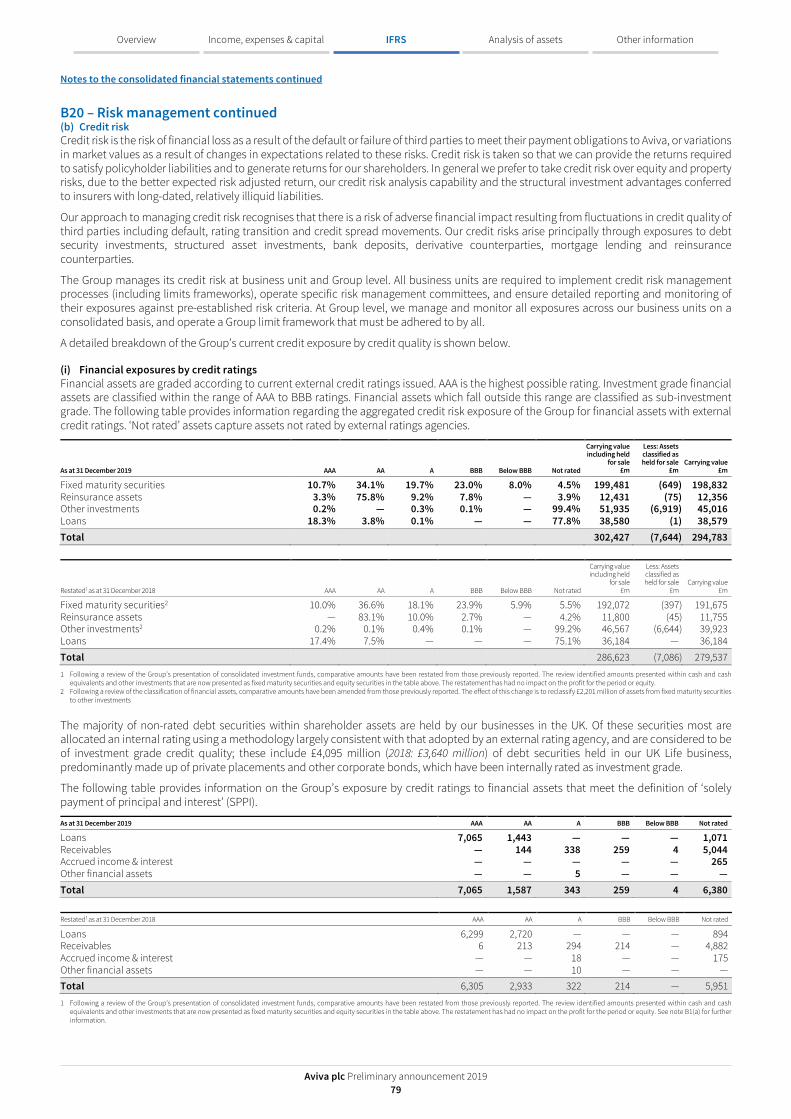
Notes to the consolidated financial statements continued
Aviva plc Preliminary announcement 2019 79
Overview Analysis of assets Other information
IFRS Income, expenses & capital
B20 – Risk management continued (b) Credit risk Credit risk is the risk of financial loss as a result of the default or failure of third parties to meet their payment obligations to Aviva, or variations in market values as a result of changes in expectations related to these risks. Credit risk is taken so that we can provide the returns required to satisfy policyholder liabilities and to generate returns for our shareholders. In general we prefer to take credit risk over equity and property risks, due to the better expected risk adjusted return, our credit risk analysis capability and the structural investment advantages conferred to insurers with long-dated, relatively illiquid liabilities.
Our approach to managing credit risk recognises that there is a risk of adverse financial impact resulting from fluctuations in credit quality of third parties including default, rating transition and credit spread movements. Our credit risks arise principally through exposures to debt security investments, structured asset investments, bank deposits, derivative counterparties, mortgage lending and reinsurance counterparties.
The Group manages its credit risk at business unit and Group level. All business units are required to implement credit risk management processes (including limits frameworks), operate specific risk management committees, and ensure detailed reporting and monitoring of their exposures against pre-established risk criteria. At Group level, we manage and monitor all exposures across our business units on a consolidated basis, and operate a Group limit framework that must be adhered to by all.
A detailed breakdown of the Group’s current credit exposure by credit quality is shown below.
(i) Financial exposures by credit ratings Financial assets are graded according to current external credit ratings issued. AAA is the highest possible rating. Investment grade financial assets are classified within the range of AAA to BBB ratings. Financial assets which fall outside this range are classified as sub-investment grade. The following table provides information regarding the aggregated credit risk exposure of the Group for financial assets with external credit ratings. ‘Not rated’ assets capture assets not rated by external ratings agencies.
As at 31 December 2019 AAA AA A BBB Below BBB Not rated
Carrying value including held
for sale £m
Less: Assets classified as held for sale
£m Carrying value
£m
Fixed maturity securities 10.7% 34.1% 19.7% 23.0% 8.0% 4.5% 199,481 (649) 198,832 Reinsurance assets 3.3% 75.8% 9.2% 7.8% — 3.9% 12,431 (75) 12,356 Other investments 0.2% — 0.3% 0.1% — 99.4% 51,935 (6,919) 45,016 Loans 18.3% 3.8% 0.1% — — 77.8% 38,580 (1) 38,579 Total 302,427 (7,644) 294,783
Restated1 as at 31 December 2018 AAA AA A BBB Below BBB Not rated
Carrying value including held
for sale £m
Less: Assets classified as held for sale
£m Carrying value
£m
Fixed maturity securities2 10.0% 36.6% 18.1% 23.9% 5.9% 5.5% 192,072 (397) 191,675 Reinsurance assets — 83.1% 10.0% 2.7% — 4.2% 11,800 (45) 11,755 Other investments2 0.2% 0.1% 0.4% 0.1% — 99.2% 46,567 (6,644) 39,923 Loans 17.4% 7.5% — — — 75.1% 36,184 — 36,184
Total 286,623 (7,086) 279,537 1 Following a review of the Group’s presentation of consolidated investment funds, comparative amounts have been restated from those previously reported. The review identified amounts presented within cash and cash
equivalents and other investments that are now presented as fixed maturity securities and equity securities in the table above. The restatement has had no impact on the profit for the period or equity. 2 Following a review of the classification of financial assets, comparative amounts have been amended from those previously reported. The effect of this change is to reclassify £2,201 million of assets from fixed maturity securities
to other investments
The majority of non-rated debt securities within shareholder assets are held by our businesses in the UK. Of these securities most are allocated an internal rating using a methodology largely consistent with that adopted by an external rating agency, and are considered to be of investment grade credit quality; these include £4,095 million (2018: £3,640 million) of debt securities held in our UK Life business, predominantly made up of private placements and other corporate bonds, which have been internally rated as investment grade.
The following table provides information on the Group’s exposure by credit ratings to financial assets that meet the definition of ‘solely payment of principal and interest’ (SPPI).
As at 31 December 2019 AAA AA A BBB Below BBB Not rated
Loans 7,065 1,443 — — — 1,071 Receivables — 144 338 259 4 5,044 Accrued income & interest — — — — — 265 Other financial assets — — 5 — — — Total 7,065 1,587 343 259 4 6,380 Restated1 as at 31 December 2018 AAA AA A BBB Below BBB Not rated
Loans 6,299 2,720 — — — 894 Receivables 6 213 294 214 — 4,882 Accrued income & interest — — 18 — — 175 Other financial assets — — 10 — — — Total 6,305 2,933 322 214 — 5,951 1 Following a review of the Group’s presentation of consolidated investment funds, comparative amounts have been restated from those previously reported. The review identified amounts presented within cash and cash
equivalents and other investments that are now presented as fixed maturity securities and equity securities in the table above. The restatement has had no impact on the profit for the period or equity. See note B1(a) for further information.

Notes to the consolidated financial statements continued
Aviva plc Preliminary announcement 2019 80
Overview Analysis of assets Other information
IFRS Income, expenses & capital
B20 – Risk management continued At the period end, the Group held cash and cash equivalents of £15,344 million (2018 restated: £11,249 million) that met the SPPI criteria, of which £15,322 million (2018 restated: £11,234 million) is placed with financial institutions with issuer ratings within the range of AAA to BBB. Further information on the extent to which unrated receivables, including those that meet the SPPI criteria, are past due may be found in section (ix) of this note. The Group continues to hold a series of macro credit hedges to reduce the overall credit risk exposure. The Group’s maximum exposure to credit risk of financial assets, without taking collateral or these hedges into account, is represented by the carrying value of the financial instruments in the statement of financial position. These comprise debt securities, reinsurance assets, derivative assets, loans and receivables.
(ii) Other investments Other investments (including assets of operations classified as held for sale) include unit trusts and other investment vehicles; derivative financial instruments, representing positions to mitigate the impact of adverse market movements; and other assets, including deposits with credit institutions and minority holdings in property management undertakings.
The credit quality of the underlying debt securities within investment vehicles is managed by the safeguards built into the investment mandates for these funds which determine the funds’ risk profiles. At the Group level, we also monitor the asset quality of unit trusts and other investment vehicles against Group set limits.
A proportion of the assets underlying these investments are represented by equities and so credit ratings are not generally applicable. Equity exposures are managed against agreed benchmarks that are set with reference to overall appetite for market risk.
(iii) Loans The Group loan portfolio principally comprises: • Policy loans which are generally collateralised by a lien or charge over the underlying policy; • Loans and advances to banks which primarily relate to loans of cash collateral received in stock lending transactions. These loans are fully
collateralised by other securities; • Healthcare, infrastructure and PFI loans secured against healthcare, education, social housing and emergency services related premises;
and • Mortgage loans collateralised by property assets.
We use loan to value, interest and debt service cover, and diversity and quality of the tenant base metrics to internally monitor our exposures to mortgage loans. We use credit quality, based on dynamic market measures, and collateralisation rules to manage our stock lending activities. Policy loans are loans and advances made to policyholders, and are collateralised by the underlying policies.
(iv) Credit concentration risk The long-term and general insurance businesses are generally not individually exposed to significant concentrations of credit risk due to the regulations applicable in most markets and the Group credit policy and limits framework, which limit investments in individual assets and asset classes. Credit concentrations are monitored as part of the regular credit monitoring process and are reported to the Group Asset Liability Committee (ALCO). With the exception of government bonds the largest aggregated counterparty exposure within shareholder assets is to the Swiss Reinsurance Company Ltd (including subsidiaries), representing approximately 2.4% of the total shareholder assets.
(v) Reinsurance credit exposures The Group is exposed to concentrations of risk with individual reinsurers due to the nature of the reinsurance market and the restricted range of reinsurers that have acceptable credit ratings. The Group operates a policy to manage its reinsurance counterparty exposures, by limiting the reinsurers that may be used and applying strict limits to each reinsurer. Reinsurance exposures are aggregated with other exposures to ensure that the overall risk is within appetite. The Group Capital and Group Risk teams have an active monitoring role with escalation to the Chief Financial Officer (CFO), Chief Risk Officer (CRO), Group ALCO and the Board Risk Committee as appropriate.
The Group’s largest reinsurance counterparty is Swiss Reinsurance Company Ltd (including subsidiaries). At 31 December 2019, the reinsurance asset recoverable, including debtor balances, from Swiss Reinsurance Company Ltd was £3,097 million (2018: £2,835 million).
(vi) Securities finance The Group has significant securities financing operations within the UK and smaller operations in some other businesses. The risks within this activity are mitigated by collateralisation and minimum counterparty credit quality requirements.
(vii) Derivative credit exposures The Group is exposed to counterparty credit risk through derivative trades. This risk is generally mitigated through holding collateral for most trades. Residual exposures are captured within the Group’s credit management framework.
(viii) Unit-linked business In unit-linked business the policyholder bears the direct market risk and credit risk on investment assets in the unit funds and the shareholders’ exposure to credit risk is limited to the extent of the income arising from asset management charges based on the value of assets in the fund.

Notes to the consolidated financial statements continued
Aviva plc Preliminary announcement 2019 81
Overview Analysis of assets Other information
IFRS Income, expenses & capital
B20 – Risk management continued (ix) Impairment of financial assets In assessing whether financial assets carried at amortised cost or classified as available for sale are impaired, due consideration is given to the factors outlined in accounting policies (T) and (V). The following table provides information regarding the carrying value of financial assets subject to impairment testing that have been impaired and the ageing of those assets that are past due but not impaired. The table excludes assets carried at fair value through profit or loss and held for sale.
Neither past due nor
impaired £m
Financial assets that are past due but not impaired
As at 31 December 2019 0–3 months
£m 3–6 months
£m
6 months– 1 year
£m
Greater than 1 year
£m
Financial assets that have been
impaired £m
Carrying value £m
Fixed maturity securities 1,455 — — 6 — — 1,461 Reinsurance assets 8,361 — — — — — 8,361 Other investments 2 — — — — — 2 Loans 10,260 — — — — — 10,260 Receivables and other financial assets 8,911 51 14 10 9 — 8,995
Neither past due nor
impaired £m
Financial assets that are past due but not impaired
Restated1 as at 31 December 2018 0–3 months
£m 3–6 months
£m
6 months– 1 year
£m
Greater than 1 year
£m
Financial assets that have been
impaired £m
Carrying value £m
Fixed maturity securities 1,675 — — 5 — — 1,680 Reinsurance assets 7,791 — — — — — 7,791 Other investments 1 — — — — — 1 Loans 10,658 — — — — — 10,658 Receivables and other financial assets 8,536 74 16 11 2 — 8,639 1 Following a review of the Group’s presentation of consolidated investment funds, comparative amounts have been restated from those previously reported. The review identified amounts presented within cash and cash
equivalents and other investments that are now presented as fixed maturity securities and equity securities in the table above. The restatement has had no impact on the profit for the period or equity. See note B1(a) for further information.
Excluded from the tables above are financial and reinsurance assets carried at fair value through profit or loss that are not subject to impairment testing, as follows: £198.0 billion of debt securities (2018 restated: £190.3 billion), £44.8 billion of other investments (2018 restated: £41.2 billion), £28.3 billion of loans (2018: £25.5 billion) and £4.0 billion of reinsurance assets (2018: £4.0 billion).
Where assets have been classed as ‘past due and impaired’, an analysis is made of the risk of default and a decision is made whether to seek to mitigate the risk. There were no material financial assets that would have been past due or impaired had the terms not been renegotiated.
(c) Market risk Market risk is the risk of adverse financial impact resulting, directly or indirectly from fluctuations in interest rates, inflation, foreign currency exchange rates, equity and property prices. Market risk arises in business units due to fluctuations in both the value of liabilities and the value of investments held. At Group level, it also arises in relation to the overall portfolio of international businesses and in the value of investment assets owned directly by the shareholders. We actively seek some market risks as part of our investment and product strategy. However, we have limited appetite for interest rate risk as we do not believe it is adequately rewarded.
The management of market risk is undertaken at business unit and at Group level. Businesses manage market risks locally using the Group market risk framework and within local regulatory constraints. Group Capital is responsible for monitoring and managing market risk at Group level and has established criteria for matching assets and liabilities to limit the impact of mismatches due to market movements.
In addition, where the Group’s long-term savings businesses have written insurance and investment products where the majority of investment risks are borne by its policyholders, these risks are managed in line with local regulations and marketing literature, in order to satisfy the policyholders’ risk and reward objectives. The Group writes unit-linked business in a number of its operations. The shareholders’ exposure to market risk on this business is limited to the extent that income arising from asset management charges is based on the value of assets in the fund.
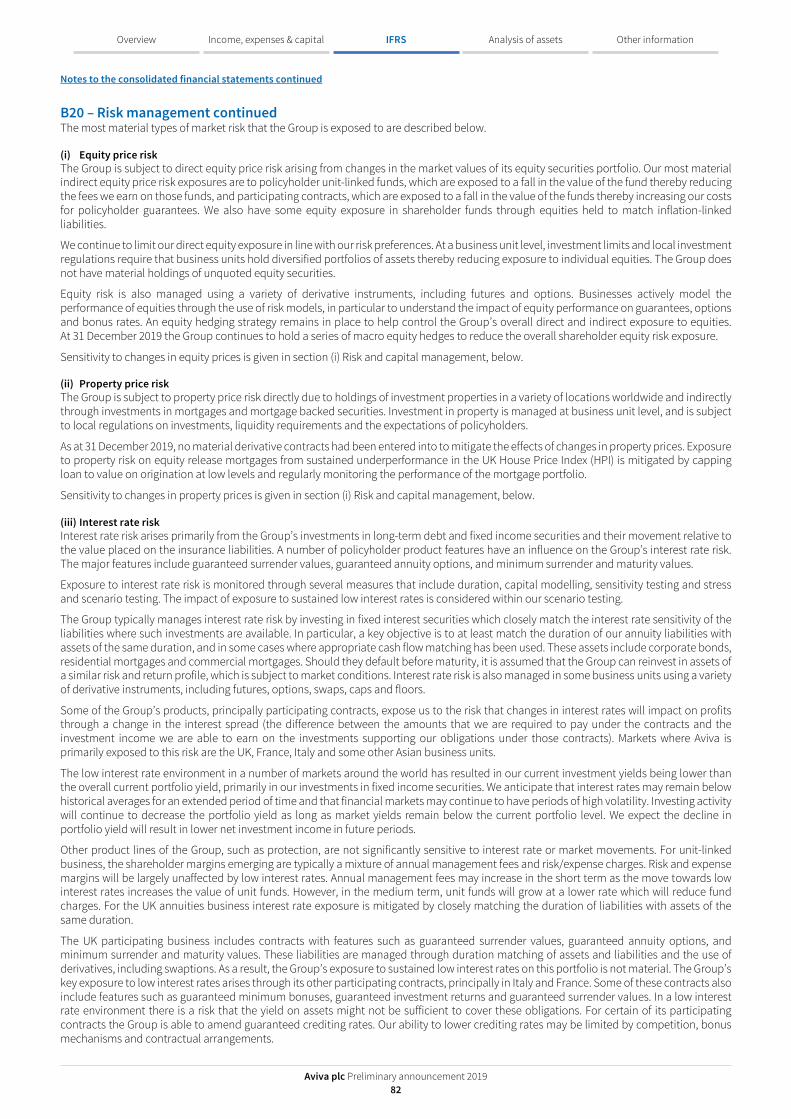
Notes to the consolidated financial statements continued
Aviva plc Preliminary announcement 2019 82
Overview Analysis of assets Other information
IFRS Income, expenses & capital
B20 – Risk management continued The most material types of market risk that the Group is exposed to are described below.
(i) Equity price risk The Group is subject to direct equity price risk arising from changes in the market values of its equity securities portfolio. Our most material indirect equity price risk exposures are to policyholder unit-linked funds, which are exposed to a fall in the value of the fund thereby reducing the fees we earn on those funds, and participating contracts, which are exposed to a fall in the value of the funds thereby increasing our costs for policyholder guarantees. We also have some equity exposure in shareholder funds through equities held to match inflation-linked liabilities.
We continue to limit our direct equity exposure in line with our risk preferences. At a business unit level, investment limits and local investment regulations require that business units hold diversified portfolios of assets thereby reducing exposure to individual equities. The Group does not have material holdings of unquoted equity securities.
Equity risk is also managed using a variety of derivative instruments, including futures and options. Businesses actively model the performance of equities through the use of risk models, in particular to understand the impact of equity performance on guarantees, options and bonus rates. An equity hedging strategy remains in place to help control the Group’s overall direct and indirect exposure to equities. At 31 December 2019 the Group continues to hold a series of macro equity hedges to reduce the overall shareholder equity risk exposure.
Sensitivity to changes in equity prices is given in section (i) Risk and capital management, below.
(ii) Property price risk The Group is subject to property price risk directly due to holdings of investment properties in a variety of locations worldwide and indirectly through investments in mortgages and mortgage backed securities. Investment in property is managed at business unit level, and is subject to local regulations on investments, liquidity requirements and the expectations of policyholders.
As at 31 December 2019, no material derivative contracts had been entered into to mitigate the effects of changes in property prices. Exposure to property risk on equity release mortgages from sustained underperformance in the UK House Price Index (HPI) is mitigated by capping loan to value on origination at low levels and regularly monitoring the performance of the mortgage portfolio.
Sensitivity to changes in property prices is given in section (i) Risk and capital management, below.
(iii) Interest rate risk Interest rate risk arises primarily from the Group’s investments in long-term debt and fixed income securities and their movement relative to the value placed on the insurance liabilities. A number of policyholder product features have an influence on the Group’s interest rate risk. The major features include guaranteed surrender values, guaranteed annuity options, and minimum surrender and maturity values.
Exposure to interest rate risk is monitored through several measures that include duration, capital modelling, sensitivity testing and stress and scenario testing. The impact of exposure to sustained low interest rates is considered within our scenario testing.
The Group typically manages interest rate risk by investing in fixed interest securities which closely match the interest rate sensitivity of the liabilities where such investments are available. In particular, a key objective is to at least match the duration of our annuity liabilities with assets of the same duration, and in some cases where appropriate cash flow matching has been used. These assets include corporate bonds, residential mortgages and commercial mortgages. Should they default before maturity, it is assumed that the Group can reinvest in assets of a similar risk and return profile, which is subject to market conditions. Interest rate risk is also managed in some business units using a variety of derivative instruments, including futures, options, swaps, caps and floors.
Some of the Group’s products, principally participating contracts, expose us to the risk that changes in interest rates will impact on profits through a change in the interest spread (the difference between the amounts that we are required to pay under the contracts and the investment income we are able to earn on the investments supporting our obligations under those contracts). Markets where Aviva is primarily exposed to this risk are the UK, France, Italy and some other Asian business units.
The low interest rate environment in a number of markets around the world has resulted in our current investment yields being lower than the overall current portfolio yield, primarily in our investments in fixed income securities. We anticipate that interest rates may remain below historical averages for an extended period of time and that financial markets may continue to have periods of high volatility. Investing activity will continue to decrease the portfolio yield as long as market yields remain below the current portfolio level. We expect the decline in portfolio yield will result in lower net investment income in future periods.
Other product lines of the Group, such as protection, are not significantly sensitive to interest rate or market movements. For unit-linked business, the shareholder margins emerging are typically a mixture of annual management fees and risk/expense charges. Risk and expense margins will be largely unaffected by low interest rates. Annual management fees may increase in the short term as the move towards low interest rates increases the value of unit funds. However, in the medium term, unit funds will grow at a lower rate which will reduce fund charges. For the UK annuities business interest rate exposure is mitigated by closely matching the duration of liabilities with assets of the same duration.
The UK participating business includes contracts with features such as guaranteed surrender values, guaranteed annuity options, and minimum surrender and maturity values. These liabilities are managed through duration matching of assets and liabilities and the use of derivatives, including swaptions. As a result, the Group’s exposure to sustained low interest rates on this portfolio is not material. The Group’s key exposure to low interest rates arises through its other participating contracts, principally in Italy and France. Some of these contracts also include features such as guaranteed minimum bonuses, guaranteed investment returns and guaranteed surrender values. In a low interest rate environment there is a risk that the yield on assets might not be sufficient to cover these obligations. For certain of its participating contracts the Group is able to amend guaranteed crediting rates. Our ability to lower crediting rates may be limited by competition, bonus mechanisms and contractual arrangements.
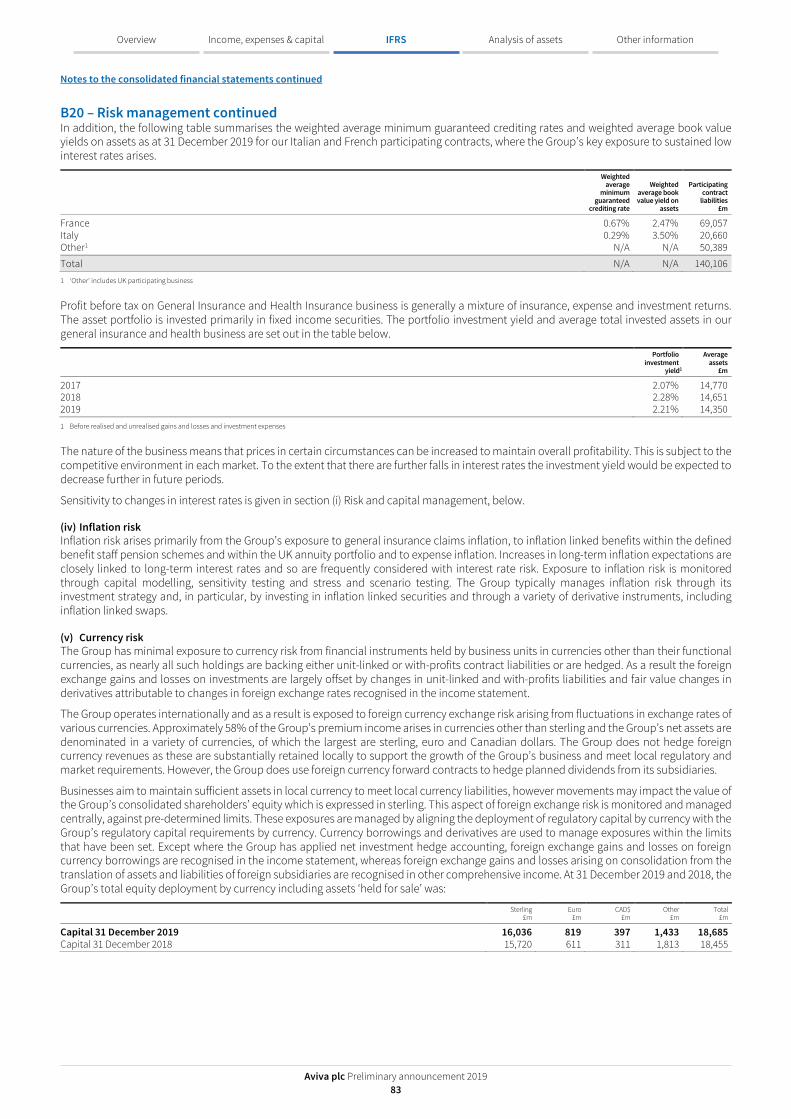
Notes to the consolidated financial statements continued
Aviva plc Preliminary announcement 2019 83
Overview Analysis of assets Other information
IFRS Income, expenses & capital
B20 – Risk management continued In addition, the following table summarises the weighted average minimum guaranteed crediting rates and weighted average book value yields on assets as at 31 December 2019 for our Italian and French participating contracts, where the Group’s key exposure to sustained low interest rates arises.
Weighted average
minimum guaranteed
crediting rate
Weighted average book value yield on
assets
Participating contract
liabilities £m
France 0.67% 2.47% 69,057 Italy 0.29% 3.50% 20,660 Other1 N/A N/A 50,389
Total N/A N/A 140,106 1 ‘Other’ includes UK participating business
Profit before tax on General Insurance and Health Insurance business is generally a mixture of insurance, expense and investment returns. The asset portfolio is invested primarily in fixed income securities. The portfolio investment yield and average total invested assets in our general insurance and health business are set out in the table below.
Portfolio investment
yield1
Average assets
£m
2017 2.07% 14,770 2018 2.28% 14,651 2019 2.21% 14,350 1 Before realised and unrealised gains and losses and investment expenses
The nature of the business means that prices in certain circumstances can be increased to maintain overall profitability. This is subject to the competitive environment in each market. To the extent that there are further falls in interest rates the investment yield would be expected to decrease further in future periods.
Sensitivity to changes in interest rates is given in section (i) Risk and capital management, below.
(iv) Inflation risk Inflation risk arises primarily from the Group’s exposure to general insurance claims inflation, to inflation linked benefits within the defined benefit staff pension schemes and within the UK annuity portfolio and to expense inflation. Increases in long-term inflation expectations are closely linked to long-term interest rates and so are frequently considered with interest rate risk. Exposure to inflation risk is monitored through capital modelling, sensitivity testing and stress and scenario testing. The Group typically manages inflation risk through its investment strategy and, in particular, by investing in inflation linked securities and through a variety of derivative instruments, including inflation linked swaps.
(v) Currency risk The Group has minimal exposure to currency risk from financial instruments held by business units in currencies other than their functional currencies, as nearly all such holdings are backing either unit-linked or with-profits contract liabilities or are hedged. As a result the foreign exchange gains and losses on investments are largely offset by changes in unit-linked and with-profits liabilities and fair value changes in derivatives attributable to changes in foreign exchange rates recognised in the income statement.
The Group operates internationally and as a result is exposed to foreign currency exchange risk arising from fluctuations in exchange rates of various currencies. Approximately 58% of the Group’s premium income arises in currencies other than sterling and the Group’s net assets are denominated in a variety of currencies, of which the largest are sterling, euro and Canadian dollars. The Group does not hedge foreign currency revenues as these are substantially retained locally to support the growth of the Group’s business and meet local regulatory and market requirements. However, the Group does use foreign currency forward contracts to hedge planned dividends from its subsidiaries.
Businesses aim to maintain sufficient assets in local currency to meet local currency liabilities, however movements may impact the value of the Group’s consolidated shareholders’ equity which is expressed in sterling. This aspect of foreign exchange risk is monitored and managed centrally, against pre-determined limits. These exposures are managed by aligning the deployment of regulatory capital by currency with the Group’s regulatory capital requirements by currency. Currency borrowings and derivatives are used to manage exposures within the limits that have been set. Except where the Group has applied net investment hedge accounting, foreign exchange gains and losses on foreign currency borrowings are recognised in the income statement, whereas foreign exchange gains and losses arising on consolidation from the translation of assets and liabilities of foreign subsidiaries are recognised in other comprehensive income. At 31 December 2019 and 2018, the Group’s total equity deployment by currency including assets ‘held for sale’ was:
Sterling
£m Euro
£m CAD$
£m Other
£m Total
£m
Capital 31 December 2019 16,036 819 397 1,433 18,685 Capital 31 December 2018 15,720 611 311 1,813 18,455

Notes to the consolidated financial statements continued
Aviva plc Preliminary announcement 2019 84
Overview Analysis of assets Other information
IFRS Income, expenses & capital
B20 – Risk management continued A 10% change in sterling to euro/Canada$ (CAD$) period-end foreign exchange rates would have had the following impact on total equity.
10% increase in sterling /
euro rate £m
10% decrease in sterling /
euro rate £m
10% increase in sterling /
CAD$ rate £m
10% decrease in sterling /
CAD$ rate £m
Net assets at 31 December 2019 (82) 82 (40) 40 Net assets at 31 December 2018 (61) 77 (31) 31
A 10% change in sterling to euro/Canada$ (CAD$) average foreign exchange rates applied to translate foreign currency profits would have had the following impact on profit before tax, including resulting gains and losses on foreign exchange hedges.
10% increase in sterling /
euro rate £m
10% decrease in sterling /
euro rate £m
10% increase in sterling /
CAD$ rate £m
10% decrease in sterling /
CAD$ rate £m
Impact on profit before tax 31 December 2019 (67) 82 (18) 22 Impact on profit before tax 31 December 2018 (60) 85 8 (9)
The balance sheet changes arise from retranslation of business unit statements of financial position from their functional currencies into sterling, with above movements being taken through the currency translation reserve. These balance sheet movements in exchange rates therefore have no impact on profit. Net asset and profit before tax figures are stated after taking account of the effect of currency hedging activities.
(vi) Derivatives risk Derivatives are used by a number of the businesses. Derivatives are primarily used for efficient investment management, risk hedging purposes, or to structure specific retail savings products. Activity is overseen by the Group Capital and Group Risk teams, which monitor exposure levels and approve large or complex transactions.
The Group applies strict requirements to the administration and valuation processes it uses, and has a control framework that is consistent with market and industry practice for the activity that is undertaken.
(vii) Correlation risk The Group recognises that lapse behaviour and potential increases in consumer expectations are sensitive to and interdependent with market movements and interest rates. These interdependencies are taken into consideration in the internal capital model and in scenario analysis.
(d) Liquidity risk Liquidity risk is the risk of not being able to make payments as they become due because there are insufficient assets in cash form. The relatively illiquid nature of insurance liabilities is a potential source of additional investment return by allowing us to invest in higher yielding, but less liquid assets such as commercial mortgages and infrastructure loans. The Group seeks to ensure that it maintains sufficient financial resources to meet its obligations as they fall due through the application of a Group liquidity risk policy and business standard and through the development of its liquidity risk management plan. At Group and business unit level, there is a liquidity risk appetite which requires that sufficient liquid resources be maintained to cover net outflows in a stress scenario. In addition to the existing liquid resources and expected inflows, the Group maintains significant undrawn committed borrowing facilities (£1,650 million) from a range of leading international banks to further mitigate this risk.
Maturity analyses The following tables show the maturities of our insurance and investment contract liabilities, and of the financial and reinsurance assets held to meet them.
(i) Analysis of maturity of insurance and investment contract liabilities For non-linked insurance business, the following table shows the gross liability at 31 December 2019 and 2018 analysed by remaining duration. The total liability is split by remaining duration in proportion to the cash-flows expected to arise during that period, as permitted under IFRS 4, Insurance Contracts.
Almost all linked business and non-linked investment contracts may be surrendered or transferred on demand. For such contracts, the earliest contractual maturity date is therefore the current statement of financial position date, for a surrender amount approximately equal to the current statement of financial position liability. However, we expect surrenders, transfers and maturities to occur over many years, and therefore the tables below reflect the expected cash flows for these contracts, rather than their contractual maturity date. This table includes amounts held for sale.
As at 31 December 2019 Total
£m
On demand or within 1 year
£m 1-5 years
£m 5-15 years
£m Over 15 years
£m
Long-term business Insurance contracts – non-linked 111,731 8,811 27,184 41,728 34,008 Investment contracts – non-linked 74,641 5,978 19,532 28,313 20,818 Linked business 177,448 16,226 26,002 58,601 76,619 General insurance and health 16,656 7,136 6,665 2,258 597 Total contract liabilities 380,476 38,151 79,383 130,900 132,042

Notes to the consolidated financial statements continued
Aviva plc Preliminary announcement 2019 85
Overview Analysis of assets Other information
IFRS Income, expenses & capital
B20 – Risk management continued
Restated1 as at 31 December 2018 Total
£m
On demand or within 1 year
£m 1-5 years
£m 5-15 years
£m Over 15 years
£m
Long-term business Insurance contracts – non-linked 106,622 8,421 25,940 40,548 31,713 Investment contracts – non-linked 75,158 5,547 19,199 28,572 21,840 Linked business 156,859 15,559 23,901 52,656 64,743 General insurance and health 16,368 6,859 6,758 2,217 534
Total contract liabilities 355,007 36,386 75,798 123,993 118,830 1 Following a review of the Group’s presentation of consolidated investment funds, comparative amounts have been restated from those previously reported. The review identified amounts presented within cash and cash
equivalents and other investments that are now presented as fixed maturity securities and equity securities in the table above. The restatement has had no impact on the profit for the period or equity. See Note B1(a) for further information.
(ii) Analysis of maturity of financial assets The following table provides an analysis, by maturity date of the principal, of the carrying value of financial assets which are available to fund the repayment of liabilities as they crystallise. This table excludes assets held for sale.
As at 31 December 2019 Total
£m
On demand or within 1 year
£m 1-5 years
£m Over 5 years
£m
No fixed term (perpetual)
£m
Fixed maturity securities 198,832 42,644 47,983 106,981 1,224 Equity securities 99,570 — — — 99,570 Other investments 45,016 38,817 25 5,365 809 Loans 38,579 9,641 4,643 24,293 2 Cash and cash equivalents 19,524 19,524 — — — 401,521 110,626 52,651 136,639 101,605
Restated1 as at 31 December 2018 Total
£m
On demand or within 1 year
£m 1-5 years
£m Over 5 years
£m
No fixed term (perpetual)
£m
Fixed maturity securities2 191,675 42,764 47,936 99,670 1,305 Equity securities 88,227 — — — 88,227 Other investments2 39,923 34,782 77 4,301 763 Loans 36,184 9,488 4,236 22,457 3 Cash and cash equivalents 15,926 15,926 — — — 371,935 102,960 52,249 126,428 90,298 1 Following a review of the Group’s presentation of consolidated investment funds, comparative amounts have been restated from those previously reported. The review identified amounts presented within cash and cash
equivalents and other investments that are now presented as fixed maturity securities and equity securities in the table above. The restatement has had no impact on the profit for the period or equity. See Note B1(a). 2 Following a review of the classification of financial assets, comparative amounts have been amended from those previously reported. The effect of this change is to reclassify £2,201 million of assets from fixed maturity securities
to other investments
The assets above are analysed in accordance with the earliest possible redemption date of the instrument at the initiation of the Group. Where an instrument is transferable back to the issuer on demand, such as most unit trusts or similar types of investment vehicle, it is included in the ‘On demand or within 1 year’ column. Debt securities with no fixed contractual maturity date are generally callable at the option of the issuer at the date the coupon rate is reset under the contractual terms of the instrument. The terms for resetting the coupon are such that we expect the securities to be redeemed at this date, as it would be uneconomic for the issuer not to do so, and for liquidity management purposes we manage these securities on this basis. The first repricing and call date is normally ten years or more after the date of issuance. Most of the Group’s investments in equity securities and fixed maturity securities are market traded and therefore, if required, can be liquidated for cash at short notice.
(e) Life and health insurance risk Life insurance risk in the Group arises through its exposure to mortality risk and exposure to worse than anticipated operating experience on factors such as persistency levels, exercising of policyholder options and management and administration expenses. The Group’s health insurance business (including private health insurance, critical illness cover, income protection and personal accident insurance, as well as a range of corporate healthcare products) exposes the Group to morbidity risk (the proportion of our customers falling sick) and medical expense inflation. The Group chooses to take measured amounts of life and health insurance risk provided that the relevant business has the appropriate core skills to assess and price the risk and adequate returns are available. The Group’s underwriting strategy and appetite is communicated via specific policy statements, related business standards and guidelines. Life insurance risk is managed primarily at business unit level with oversight at the Group level.
The underlying risk profile of our life and health insurance risks, primarily persistency, longevity, mortality and expense risk, has remained stable during 2019. We are also exposed to longevity risk through the Aviva Staff Pension Scheme, to which our economic exposure has been reduced since 2014 by entering into a longevity swap covering approximately £5 billion of pensioner in payment scheme liabilities. Longevity risk remains the Group’s most significant life insurance risk, while persistency risk remains significant and continues to have a volatile outlook with underlying performance linked to some degree to economic conditions. We purchased reinsurance for longevity risk for our annuity business, including the bulk annuity buy-in transaction with the Aviva Staff Pension scheme. Group has continued to write considerable volumes of life protection business, and to utilise reinsurance to reduce exposure to potential losses. More generally, life insurance risks are believed to provide a significant diversification against other risks in the portfolio. Life insurance risks are modelled within the internal capital model and subject to sensitivity and stress and scenario testing.

Notes to the consolidated financial statements continued
Aviva plc Preliminary announcement 2019 86
Overview Analysis of assets Other information
IFRS Income, expenses & capital
B20 – Risk management continued The assumption and management of life and health insurance risks is governed by the Group-wide business standards covering underwriting, pricing, product design and management, in-force management, claims handling, and reinsurance. The individual life and health insurance risks are managed as follows: • Mortality and morbidity risks are mitigated by use of reinsurance. The Group allows businesses to select reinsurers, from those approved
by the Group, based on local factors, but retains oversight of the overall exposures and monitors that the aggregation of risk ceded is within credit risk appetite.
• Longevity risk and internal experience analysis are monitored against the latest external industry data and emerging trends. While individual businesses are responsible for reserving and pricing for annuity business, the Group monitors the exposure to this risk and any associated capital implications. The Group has used reinsurance solutions to reduce the risks from longevity and continually monitors and evaluates emerging market solutions to mitigate this risk further.
• Persistency risk is managed at a business unit level through frequent monitoring of company experience, and benchmarked against local market information. Generally, persistency risk arises from customers lapsing their policies earlier than has been assumed. Where possible the financial impact of lapses is reduced through appropriate product design. Businesses also implement specific initiatives to improve the retention of policies which may otherwise lapse. The Group has developed guidelines on persistency management.
• Expense risk is primarily managed by the business units through the assessment of business unit profitability and frequent monitoring of expense levels.
Embedded derivatives The Group is exposed to the risk of changes in policyholder behaviour due to the exercise of options, guarantees and other product features embedded in its long-term savings products. These product features offer policyholders varying degrees of guaranteed benefits at maturity or on early surrender, along with options to convert their benefits into different products on pre-agreed terms. The extent of the impact of these embedded derivatives differs considerably between business units and exposes Aviva to changes in policyholder behaviour in the exercise of options as well as market risk.
Examples of each type of embedded derivative affecting the Group are: • Options: call, put, surrender and maturity options, guaranteed annuity options, options to cease premium payment, options for
withdrawals free of market value adjustment, annuity options, and guaranteed insurability options. • Guarantees: embedded floor (guaranteed return), maturity guarantee, guaranteed death benefit, and guaranteed minimum rate of annuity
payment. • Other: indexed interest or principal payments, maturity value, loyalty bonus.
The impact of these is reflected in the capital model and managed as part of the asset liability framework. Further disclosure on financial guarantees and options embedded in contracts and their inclusion in insurance and investment contract liabilities is provided in note B13.
(f) General insurance risk Types of risk General insurance risk in the Group arises from: • Fluctuations in the timing, frequency and severity of claims and claim settlements relative to expectations; • Unexpected claims arising from a single source or cause; • Inaccurate pricing of risks or inappropriate underwriting of risks when underwritten; and • Inadequate reinsurance protection or other risk transfer techniques.
The majority of the general insurance business underwritten by the Group continues to be short tail in nature such as motor, household and commercial property insurances. The Group’s underwriting strategy and appetite is communicated via specific policy statements, related business standards and guidelines. General insurance risk is managed primarily at business unit level with oversight at the Group level. Claims reserving is undertaken by local actuaries in the various general insurance businesses and is also subject to periodic external reviews. Reserving processes are further detailed in note B11 Insurance liabilities.
The vast majority of the Group’s general insurance business is managed and priced in the same country as the domicile of the customer.
Management of general insurance risks Significant insurance risks will be reported under the risk management framework. Additionally, the capital model is used to assess the risks that each general insurance business unit, and the Group as a whole, is exposed to, quantifying their impact and calculating appropriate capital requirements.
Business units have developed mechanisms that identify, quantify and manage accumulated exposures to contain them within the limits of the appetite of the Group. The business units are assisted by the General Insurance Council which provides technical input for major decisions which fall outside individual delegated limits or escalations outside group risk preferences, group risk accumulation, concentration and profitability limits.
Reinsurance strategy Significant reinsurance purchases are reviewed annually at both business unit and Group level to verify that the levels of protection being bought reflect any developments in exposure and the risk appetite of the Group. The basis of these purchases is underpinned by analysis of capital, earnings and capital volatility, cash flow and liquidity and the Group’s franchise value.
Detailed actuarial analysis is used to calculate the Group’s extreme risk profile and then design cost and capital efficient reinsurance programmes to mitigate these risks to within agreed appetites. For businesses writing general insurance we analyse the natural catastrophe exposure using our own internal probabilistic catastrophe model which is benchmarked against external catastrophe models widely used by the rest of the (re)insurance industry.

Notes to the consolidated financial statements continued
Aviva plc Preliminary announcement 2019 87
Overview Analysis of assets Other information
IFRS Income, expenses & capital
B20 – Risk management continued The Group cedes much of its worldwide catastrophe risk to third-party reinsurers through excess of loss and aggregate excess of loss structures. The Group purchases a Group-wide catastrophe reinsurance programme to protect against catastrophe losses exceeding a 1 in 200 year return period. The total Group potential retained loss from its most concentrated catastrophe exposure peril (Northern Europe Windstorm) is approximately £150 million on a per occurrence basis and £175 million on an annual aggregate basis. Any losses above these levels are covered by the group-wide catastrophe reinsurance programme to a level in excess of a 1 in 200 year return period. In addition the Group purchases a number of GI business line specific reinsurance programmes with various retention levels to protect both capital and earnings, and has reinsured 100% of its latent exposures to its historic UK employers’ liability and public liability business written prior to 31 December 2000.
(g) Asset management risk Aviva is directly exposed to the risks associated with operating an asset management business through its ownership of Aviva Investors. The underlying risk profile of our asset management risk is derived from investment performance, specialist investment professionals and leadership, product development capabilities, fund liquidity, margin, client retention, regulatory developments, fiduciary and contractual responsibilities. Funds invested in illiquid assets such as commercial property are particularly exposed to liquidity risk. The risk profile is regularly monitored.
A client relationship team is in place to manage client retention risk, while all new asset management products undergo a review and approval process at each stage of the product development process, including approvals from legal, compliance and risk functions. Investment performance against client objectives relative to agreed benchmarks is monitored as part of our investment performance and risk management process, and subject to further independent oversight and challenge by a specialist risk team, reporting directly to the Aviva Investors’ Chief Risk Officer.
(h) Operational risk Operational risk is the risk of direct or indirect loss, arising from inadequate or failed internal processes, people and systems, or external events including changes in the regulatory environment. We have limited appetite for operational risk and aim to reduce these risks as far as is commercially sensible.
Our business units are primarily responsible for identifying and managing operational risks within their businesses, within the Group-wide operational risk framework including the risk and control self-assessment process. Businesses must be satisfied that all material risks falling outside our risk tolerances are being mitigated, monitored and reported to an appropriate level. Any risks with a high potential impact are monitored centrally on a regular basis. Businesses use key indicator data to help monitor the status of the risk and control environment. They also identify and capture loss events, taking appropriate action to address actual control breakdowns and promote internal learning.
The importance of digital interaction with our customers and advanced data analytics, the conduct, data protection and financial crime agenda of the European institutions, the FCA and other regulators, as well as the increasing cyber security threat, as evidenced by continuing instances of high profile cyber security breaches for other corporates in the UK and elsewhere, mean the Group has inherent risk exposure to data theft, conduct regulatory breaches (including financial crime) and customer service interruption due to IT systems failure. During 2019 we have continued to take action to reduce our residual exposure to these risks and improve our operational resilience through our conduct risk management framework, financial crime risk mitigation programme and significant investment in upgrading our IT infrastructure and security.
We are exposed to the risk that litigation, employee misconduct, operational failures, the outcome of regulatory investigations, media speculation and negative publicity, disclosure of confidential client information, inadequate services, whether or not founded, could impact our brands or reputation. Any of our brands or our reputation could also be affected if products or services recommended by us (or any of our intermediaries) do not perform as expected (whether or not the expectations are founded) or customers’ expectations for the product change. We seek to reduce this risk to as low a level as commercially sensible.
The FCA regularly considers whether we are meeting the requirement to treat our customers fairly and we make use of various metrics to assess our own performance, including customer advocacy, retention and complaints. Failure to meet these requirements could also impact our brands or reputation.
If we do not manage the perception of our brands and reputation successfully, it could cause existing customers or agents to withdraw from our business and potential customers or agents to choose not to do business with us.
(i) Risk and capital management (i) Sensitivity test analysis The Group uses a number of sensitivity tests to understand the volatility of earnings, the volatility of its capital requirements, and to manage its capital more efficiently. Sensitivities to economic and operating experience are regularly produced on the Group’s key financial performance metrics to inform the Group’s decision making and planning processes, and as part of the framework for identifying and quantifying the risks to which each of its business units, and the Group as a whole, are exposed.
(ii) Life insurance and investment contracts The nature of long-term business is such that a number of assumptions are made in compiling these financial statements. Assumptions are made about investment returns, expenses, mortality rates and persistency in connection with the in-force policies for each business unit. Assumptions are best estimates based on historic and expected experience of the business. A number of the key assumptions for the Group’s central scenario are disclosed elsewhere in these statements.
(iii) General insurance and health business General insurance and health claim liabilities are estimated by using standard actuarial claims projection techniques. These methods extrapolate the claims development for each accident year based on the observed development of earlier years. In most cases, no explicit assumptions are made as projections are based on assumptions implicit in the historic claims.

Notes to the consolidated financial statements continued
Aviva plc Preliminary announcement 2019 88
Overview Analysis of assets Other information
IFRS Income, expenses & capital
B20 – Risk management continued (iv) Sensitivity test results Illustrative results of sensitivity testing for long-term business, general insurance and health business and the fund management and non-insurance business are set out below. For each sensitivity test the impact of a reasonably possible change in a single factor is shown, with other assumptions left unchanged. Each test allows for any consequential impact on the asset and liability valuations.
Long-term business sensitivities as at 31 December 2019
31 December 2019 Impact on profit before tax £m Interest rates
+1% Interest rates
-1% Credit spreads
+0.5%
Equity/ property
+10%
Equity/ property
-10% Expenses
+10%
Assurance mortality
+5%
Annuitant mortality
-5%
Insurance participating — 5 (10) (65) 60 (50) 10 (5) Insurance non-participating (985) 1,265 (800) (120) 105 (240) (145) (955) Investment participating (85) 55 (5) (5) 5 (25) — — Investment non-participating — 5 — 5 (5) (5) — — Assets backing life shareholders’ funds (150) 170 (35) (35) 30 — — — Total (1,220) 1,500 (850) (220) 195 (320) (135) (960)
31 December 2019 Impact on shareholders’ equity before tax £m Interest rates
+1% Interest rates
-1% Credit spreads
+0.5%
Equity/ property
+10%
Equity/ property
-10% Expenses
+10%
Assurance mortality
+5%
Annuitant mortality
-5%
Insurance participating — 5 (10) (65) 60 (50) 10 (5) Insurance non-participating (985) 1,265 (800) (120) 105 (240) (145) (955) Investment participating (85) 55 (5) (5) 5 (25) — — Investment non-participating — 5 — 5 (5) (5) — — Assets backing life shareholders’ funds (190) 205 (30) (30) 30 — — — Total (1,260) 1,535 (845) (215) 195 (320) (135) (960)
Sensitivities as at 31 December 2018
31 December 2018 Impact on profit before tax £m Interest rates
+1% Interest rates
-1% Credit spreads
+0.5%
Equity/ property
+10%
Equity/ property
-10% Expenses
+10%
Assurance mortality
+5%
Annuitant mortality
-5%
Insurance participating (75) 35 (15) (105) 70 (20) (5) (5) Insurance non-participating (975) 1,130 (695) (125) 105 (210) (115) (865) Investment participating (40) 40 (10) (15) (15) (15) — — Investment non-participating — — — 10 (25) (20) — — Assets backing life shareholders’ funds (95) 105 (25) 20 (20) — — — Total (1,185) 1,310 (745) (215) 115 (265) (120) (870)
31 December 2018 Impact on shareholders’ equity before tax £m Interest rates
+1% Interest rates
-1% Credit spreads
+0.5%
Equity/ property
+10%
Equity/ property
-10% Expenses
+10%
Assurance mortality
+5%
Annuitant mortality
-5%
Insurance participating (75) 35 (15) (105) 70 (20) (5) (5) Insurance non-participating (975) 1,130 (695) (125) 105 (210) (115) (865) Investment participating (40) 40 (10) (15) (15) (15) — — Investment non-participating — — — 10 (25) (20) — — Assets backing life shareholders’ funds (145) 150 (25) 25 (25) — — —
Total (1,235) 1,355 (745) (210) 110 (265) (120) (870)
Changes in sensitivities between 2019 and 2018 reflect underlying movements in the value of assets and liabilities, the relative duration of assets and liabilities and asset liability management actions. The sensitivities to economic and demographic movements relate mainly to business in the UK.
Sensitivity factor Description of sensitivity factor applied
Interest rate and investment return The impact of a change in market interest rates by a 1% increase or decrease. The test allows consistently for similar changes to investment returns and movements in the market value of backing fixed interest securities.
Credit spreads The impact of a 0.5% increase in credit spreads over risk-free interest rates on corporate bonds and other non-sovereign credit assets.
Equity/property market values The impact of a change in equity/property market values by ± 10%. Expenses The impact of an increase in maintenance expenses by 10%. Assurance mortality/morbidity (life insurance only) The impact of an increase in mortality/morbidity rates for assurance contracts by 5%. Annuitant mortality (long-term insurance only) The impact of a reduction in mortality rates for annuity contracts by 5%. Gross loss ratios (non-long-term insurance only) The impact of an increase in gross loss ratios for general insurance and health business by 5%.

Notes to the consolidated financial statements continued
Aviva plc Preliminary announcement 2019 89
Overview Analysis of assets Other information
IFRS Income, expenses & capital
B20 – Risk management continued General insurance and health business sensitivities as at 31 December 2019
31 December 2019 Impact on profit before tax £m Interest rates
+1% Interest rates
-1% Credit spreads
+0.5%
Equity/ property
+10%
Equity/ property
-10% Expenses
+10%
Gross loss ratios
+5%
Gross of reinsurance (210) 165 (115) 185 (175) (140) (315) Net of reinsurance (270) 215 (115) 185 (175) (140) (300)
31 December 2019 Impact on shareholders’ equity before tax £m Interest rates
+1% Interest rates
-1% Credit spreads
+0.5%
Equity/ property
+10%
Equity/ property
-10% Expenses
+10%
Gross loss ratios
+5%
Gross of reinsurance (210) 165 (115) 185 (175) (25) (315) Net of reinsurance (270) 215 (115) 185 (175) (25) (300)
Sensitivities as at 31 December 2018
31 December 2018 Impact on profit before tax £m Interest rates
+1% Interest rates
-1% Credit spreads
+0.5%
Equity/ property
+10%
Equity/ property
-10% Expenses
+10%
Gross loss ratios
+5%
Gross of reinsurance (240) 235 (115) 165 (165) (120) (325)
Net of reinsurance (305) 295 (115) 165 (165) (120) (315)
31 December 2018 Impact on shareholders’ equity before tax £m Interest rates
+1% Interest rates
-1% Credit spreads
+0.5%
Equity/ property
+10%
Equity/ property
-10% Expenses
+10%
Gross loss ratios
+5%
Gross of reinsurance (240) 235 (115) 170 (170) (25) (325)
Net of reinsurance (305) 295 (115) 170 (170) (25) (315)
For general insurance and health, the impact of the expense sensitivity on profit also includes the increase in ongoing administration expenses, in addition to the increase in the claims handling expense provision.
Fund management and non-insurance business sensitivities as at 31 December 2019
31 December 2019 Impact on profit before tax £m Interest rates
+1% Interest rates
-1% Credit spreads
+0.5%
Equity/ property
+10%
Equity/ property
-10%
Total (20) 15 40 (10) 15
31 December 2019 Impact on shareholders’ equity before tax £m Interest rates
+1% Interest rates
-1% Credit spreads
+0.5%
Equity/ property
+10%
Equity/ property
-10%
Total (15) 15 40 (10) 15
Sensitivities as at 31 December 2018
31 December 2018 Impact on profit before tax £m Interest rates
+1% Interest rates
-1% Credit spreads
+0.5%
Equity/ property
+10%
Equity/ property
-10%
Total (25) 20 30 (20) 35
31 December 2018 Impact on shareholders’ equity before tax £m Interest rates
+1% Interest rates
-1% Credit spreads
+0.5%
Equity/ property
+10%
Equity/ property
-10%
Total (20) 15 30 (20) 30
Limitations of sensitivity analysis The above tables demonstrate the effect of a change in a key assumption while other assumptions remain unchanged. In reality, there is a correlation between the assumptions and other factors. It should also be noted that these sensitivities are non-linear, and larger or smaller impacts should not be interpolated or extrapolated from these results.
The sensitivity analyses do not take into consideration that the Group’s assets and liabilities are actively managed. Additionally, the financial position of the Group may vary at the time that any actual market movement occurs. For example, the Group’s financial risk management strategy aims to manage the exposure to market fluctuations.
As investment markets move past various trigger levels, management actions could include selling investments, changing investment portfolio allocation, adjusting bonuses credited to policyholders, and taking other protective action.
A number of the business units use passive assumptions to calculate their long-term business liabilities. Consequently, a change in the underlying assumptions may not have any impact on the liabilities, whereas assets held at market value in the statement of financial position will be affected. In these circumstances, the different measurement bases for liabilities and assets may lead to volatility in shareholder equity. Similarly, for general insurance liabilities, the interest rate sensitivities only affect profit and equity where explicit assumptions are made regarding interest (discount) rates or future inflation.
Other limitations in the above sensitivity analyses include the use of hypothetical market movements to demonstrate potential risk that only represent the Group’s view of possible near-term market changes that cannot be predicted with any certainty, and the assumption that all interest rates move in an identical fashion.

Notes to the consolidated financial statements continued
Aviva plc Preliminary announcement 2019 90
Overview Analysis of assets Other information
IFRS Income, expenses & capital
B21 – Direct capital instrument and tier 1 notes
Notional amount 2019
£m 2018
£m
5.9021% £500 million direct capital instrument – Issued November 2004 500 500 6.875% £210 million STICS – Issued November 2003 — 231
Total 500 731
The direct capital instrument (the DCI) was issued on 25 November 2004. The DCI has no fixed redemption date but the Company may, at its sole option, redeem all (but not part) of the principal amount on 27 July 2020, at which date the interest rate changes to a variable rate, or on any respective coupon payment date thereafter. The variable rate will be the six month sterling deposit rate plus margin.
The Step-up Tier one Insurance Capital Securities (‘STICS’) were issued on 21 November 2003 by Friends Life Holdings plc, substituted as issuer by Aviva plc on 1 October 2015. These had no fixed redemption date, however, on 17 October 2019 notification was given that the Group would redeem the tier one notes at the first call date on 21 November 2019. On the notification date the instruments were reclassified as a financial liability of £210 million, representing the fair value and redemption cost at that date. The resulting difference of £21 million between the carrying amount of £231 million and fair value of £210 million has been charged to retained earnings. The instruments were cancelled on 25 November 2019.
The Company has the option to defer coupon payments on the DCI on any relevant payment date. Deferred coupons shall only be satisfied should the Company exercise its sole option to redeem the instruments.
No interest will accrue on any deferred coupon on the DCI. Deferred coupons on the DCI will be satisfied by the issue and sale of ordinary shares in the Company at their prevailing market value, to a sum as near as practicable to (and at least equal to) the relevant deferred coupons. In the event of any coupon deferral, the Company will not declare or pay any dividend on its ordinary or preference share capital. These instruments have been treated as equity. Please refer to accounting policy AE.
At the end of 2019 the fair value of the DCI was £514 million (2018 DCI: £506 million, STICS: £216 million).
B22 – Cash and cash equivalents Cash and cash equivalents in the statement of cash flows at 31 December comprised:
2019
£m
Restated1 2018
£m
Cash and cash equivalents 19,524 15,926 Cash and cash equivalents of operations classified as held for sale 780 688 Bank overdrafts (870) (563)
Net cash and cash equivalents at 31 December 19,434 16,051 1 Following a review of the Group’s presentation of consolidated investment funds, comparative amounts have been restated from those previously reported. The restatement has had no impact on the profit for the year or equity.
See note B2(a) for further information.

Notes to the consolidated financial statements continued
Aviva plc Preliminary announcement 2019 91
Overview Analysis of assets Other information
IFRS Income, expenses & capital
B23 – Contingent liabilities and other risk factors This note sets out the main areas of uncertainty over the calculation of our liabilities.
(a) Uncertainty over claims provisions Note B12 gives details of the estimation techniques used by the Group to determine the general insurance business outstanding claims provisions and of the methodology and assumptions used in determining the long-term business provisions. These approaches are designed to allow for the appropriate cost of policy-related liabilities, with a degree of prudence, to give a result within the normal range of outcomes. However, the actual cost of settling these liabilities may differ, for example because experience may be worse than that assumed, or future general insurance business claims inflation may differ from that expected, and hence there is uncertainty in respect of these liabilities.
(b) Asbestos, pollution and social environmental hazards In the course of conducting insurance business, various companies within the Group receive general insurance liability claims, and become involved in actual or threatened related litigation arising therefrom, including claims in respect of pollution and other environmental hazards. Amongst these are claims in respect of asbestos production and handling in various jurisdictions, including Europe, Canada and Australia. Given the significant delays that are experienced in the notification of these claims, the potential number of incidents they cover and the uncertainties associated with establishing liability, the ultimate cost cannot be determined with certainty. However, on the basis of current information having regard to the level of provisions made for general insurance claims and substantial reinsurance cover now in place, the directors consider that any additional costs arising are not likely to have a material impact on the financial position of the Group.
(c) Guarantees on long-term savings products As a normal part of their operating activities, various Group companies have given guarantees and options, including interest rate guarantees, in respect of certain long-term insurance and investment products. In providing these guarantees and options, the Group’s capital position is sensitive to fluctuations in financial variables including foreign currency exchange rates, interest rates, property values and equity prices. Interest rate guaranteed returns, such as those available on guaranteed annuity options, are sensitive to interest rates falling below the guaranteed level. Other guarantees, such as maturity value guarantees and guarantees in relation to minimum rates of return, are sensitive to fluctuations in the investment return below the level assumed when the guarantee was made. The directors continue to believe that the existing provisions for such guarantees and options are sufficient.
(d) Regulatory compliance The Group’s insurance and investment business is subject to local regulation in each of the countries in which it operates. A number of the Group’s UK subsidiaries are dual regulated (directly authorised by both the PRA (for prudential regulation) and the FCA (for conduct regulation)) while others are solo regulated (regulated solely by the FCA for both prudential and conduct regulation). Between them, the PRA and FCA have broad powers including the authority to grant, vary the terms of, or cancel a regulated firm’s authorisation; to investigate marketing and sales practices; and to require the maintenance of adequate financial resources. The Group’s regulators outside the UK typically have similar powers, but in some cases they also operate a system of ‘prior product approval’.
The Group’s regulated businesses have compliance resources to respond to regulatory enquiries in a constructive way, and take corrective action when warranted. However, all regulated financial services companies face the risk that their regulator could find that they have failed to comply with applicable regulations or have not undertaken corrective action as required.
The impact of any such finding (whether in the UK or overseas) could have a negative impact on the Group’s reported results or on its relations with current and potential customers. Regulatory action against a member of the Group could result in adverse publicity for, or negative perceptions regarding, the Group, or could have a material adverse effect on the business of the Group, its results, operations and/or financial condition and divert management’s attention from the day-to-day management of the business.
(e) Structured settlements The Group has purchased annuities from licensed Canadian life insurers to provide for fixed and recurring payments to claimants. As a result of these arrangements, the Group is exposed to credit risk to the extent that any of the life insurers fail to fulfill their obligations. The Group’s maximum exposure to credit risk for these types of arrangements is approximately £707 million as at 31 December 2019 (2018: £710 million). Credit risk is managed by acquiring annuities from a diverse portfolio of life insurers with proven financial stability. This risk is reduced to the extent of coverage provided by Assuris, the Canadian life insurance industry compensation plan. As at 31 December 2019, no information has come to the Group’s attention that would suggest any weakness or failure in life insurers from which it has purchased annuities and consequently no provision for credit risk is required.
(f) Other In the course of conducting insurance and investment business, various Group companies receive liability claims, and become involved in actual or threatened related litigation. In the opinion of the directors, adequate provisions have been established for such claims and no material loss will arise in this respect.
In addition, in line with standard business practice, various Group companies have given guarantees, indemnities and warranties in connection with disposals in recent years of subsidiaries and associates to parties outside the Aviva Group. In the opinion of the directors, no material unprovisioned loss will arise in respect of these guarantees, indemnities and warranties.
There are a number of charges registered over the assets of Group companies in favour of other Group companies or third parties. In addition, certain of the Company’s assets are charged in favour of certain of its subsidiaries as security for intra-Group loans.

Notes to the consolidated financial statements continued
Aviva plc Preliminary announcement 2019 92
Overview Analysis of assets Other information
IFRS Income, expenses & capital
B24 – Acquired value of in-force business and intangible assets Acquired value of in-force business and intangible assets presented in the statement of financial position is comprised of:
2019
£m 2018
£m
Acquired value of in-force business on insurance contracts1 1,235 1,418 Acquired value of in-force business on investment contracts2 1,244 1,498 Intangible assets 847 945
3,326 3,861
Less: Assets classified as held for sale (526) (660)
Total 2,800 3,201 1 On insurance and participating investment contracts. 2 On non-participating investment contracts.
The acquired value of in-force (AVIF) business on insurance and investment contracts has reduced in the year primarily due to an amortisation charge of £406 million (2018: £426 million charge). There was also an impairment of AVIF on investment contracts of £28 million in the year relating to FPI (2018: £13 million) recorded as a remeasurement loss as FPI is held for sale (see note B5(b)(i)).
The decrease in intangible assets primarily relates to the amortisation charge of £212 million (2018: £209 million charge), partially offset by additions of £136 million largely relating to computer software.
B25 – Subsequent events 2020 has begun with the outbreak of a new strain of the Coronavirus (COVID-19) in China, with confirmed cases in more than 50 countries, including all of those in which Aviva has material businesses. There is a risk of a significant global pandemic and economic disruption. We have reviewed the exposure of our balance sheet and are taking actions to further reduce our sensitivity to economic shocks. Notwithstanding our robust capital and liquidity position and the operational and financial actions that we are taking, a deterioration in the situation would have adverse implications for our businesses arising from the potential impacts on financial markets, our insurance exposures and our operations. As the situation is rapidly evolving it is not practicable to quantify the potential financial impact of the outbreak on the Group.

Aviva plc Preliminary announcement 2019 93
Overview Analysis of assets Other information
IFRS Income, expenses & capital
Analysis of assets
In this section Page C Analysis of assets C1 Summary of total assets by fund 94 C2 Summary of total assets by valuation bases 95 C3 Analysis of financial investments by fund 97 C4 Analysis of debt securities 98 C5 Analysis of loans 104 C6 Analysis of equity securities 106 C7 Analysis of investment property 107 C8 Analysis of other financial investments 107 C9 Analysis of available for sale investments 108 C10 Summary of exposure to peripheral European countries 108 C11 Reinsurance assets 109

Analysis of assets
Aviva plc Preliminary announcement 2019 94
Overview Analysis of assets Other information
IFRS Income, expenses & capital
As an insurance business, the Group holds a variety of assets to match the characteristics and duration of its insurance liabilities. Appropriate and effective asset liability matching (on an economic basis) is the principal way in which Aviva manages its investments. To support this, we use a variety of hedging and other risk management strategies to mitigate any residual mismatch risk that is outside of our risk appetite.
C1 – Summary of total assets by fund
2019
Policyholder assets
£m
Participating fund assets
£m
Shareholder assets
£m
Total assets analysed
£m
Less: Assets classified as held for sale
£m
Balance sheet total
£m
Goodwill and acquired value of in-force business and intangible assets — — 5,181 5,181 (526) 4,655 Interests in joint ventures and associates 93 895 551 1,539 (8) 1,531 Property and equipment — 183 714 897 (8) 889 Investment property 7,050 3,466 687 11,203 — 11,203 Loans 2,111 5,231 31,238 38,580 (1) 38,579 Financial investments
Debt securities 42,350 100,574 56,557 199,481 (649) 198,832 Equity securities 83,035 14,959 1,832 99,826 (256) 99,570 Other investments 37,822 10,722 3,391 51,935 (6,919) 45,016
Reinsurance assets 4,003 437 7,991 12,431 (75) 12,356 Deferred tax assets — — 162 162 (11) 151 Current tax assets — — 132 132 — 132 Receivables and other financial assets 744 1,739 6,581 9,064 (69) 8,995 Deferred acquisition costs and other assets 229 646 5,282 6,157 (202) 5,955 Prepayments and accrued income 392 1,278 1,481 3,151 (8) 3,143 Cash and cash equivalents 8,353 6,096 5,855 20,304 (780) 19,524 Assets classified as held for sale — — — — 9,512 9,512 Total 186,182 146,226 127,635 460,043 — 460,043 Total % 40.5% 31.8% 27.7% 100.0% — 100.0% 2018 Total1 164,858 142,609 122,054 429,521 — 429,521
2018 Total %1 38.4% 33.2% 28.4% 100.0% — 100.0% 1 Following a review of the Group’s presentation of consolidated investment funds, comparative amounts have been restated from those previously reported. The restatement has had no impact on the profit for the year or equity.
See note B2(a) for further information.

Analysis of assets continued
Aviva plc Preliminary announcement 2019 95
Overview Analysis of assets Other information
IFRS Income, expenses & capital
C2 – Summary of total assets by valuation bases
Total assets – 2019 Fair value
£m
Amortised cost
£m
Equity accounted/
tax assets1 £m
Total £m
Goodwill and acquired value of in-force business and intangible assets — 5,181 — 5,181 Interests in joint ventures and associates — — 1,539 1,539 Property and equipment 392 505 — 897 Investment property 11,203 — — 11,203 Loans 28,319 10,261 — 38,580 Financial Investments
Debt securities 199,481 — — 199,481 Equity securities 99,826 — — 99,826 Other investments 51,935 — — 51,935
Reinsurance assets 4,006 8,425 — 12,431 Deferred tax assets — — 162 162 Current tax assets — — 132 132 Receivables and other financial assets — 9,064 — 9,064 Deferred acquisition costs and other assets — 6,157 — 6,157 Prepayments and accrued income — 3,151 — 3,151 Cash and cash equivalents 20,304 — — 20,304 Total 415,466 42,744 1,833 460,043 Total % 90.3% 9.3% 0.4% 100.0% Less: Assets classified as held for sale (8,619) (874) (19) (9,512) Total 406,847 41,870 1,814 450,531 Total % 90.3% 9.3% 0.4% 100.0% 2018 Total2 385,133 42,609 1,779 429,521
2018 Total %2 89.7% 9.9% 0.4% 100.0% 1 Within the Group’s statement of financial position, assets are recognised for deferred tax and current tax. The valuation basis of these assets does not directly fall within any of the categories outlined above. As such, these assets
have been reported together with equity accounted items within the analysis of the Group’s assets. 2 Following a review of the Group’s presentation of consolidated investment funds, comparative amounts have been restated from those previously reported. The restatement has had no impact on the profit for the year or equity.
See note B2(a) for further information.
Total assets – Policyholder assets 2019 Fair value
£m
Amortised cost
£m
Equity accounted/
tax assets1 £m
Total £m
Goodwill and acquired value of in-force business and intangible assets — — — — Interests in joint ventures and associates — — 93 93 Property and equipment — — — — Investment property 7,050 — — 7,050 Loans — 2,111 — 2,111 Financial Investments
Debt securities 42,350 — — 42,350 Equity securities 83,035 — — 83,035 Other investments 37,822 — — 37,822
Reinsurance assets 3,995 8 — 4,003 Deferred tax assets — — — — Current tax assets — — — — Receivables and other financial assets — 744 — 744 Deferred acquisition costs and other assets — 229 — 229 Prepayments and accrued income — 392 — 392 Cash and cash equivalents 8,353 — — 8,353 Total 182,605 3,484 93 186,182 Total % 98.1% 1.9% — 100.0% Less: Assets classified as held for sale (8,001) (169) — (8,170) Total 174,604 3,315 93 178,012 Total % 98.1% 1.9% — 100.0% 2018 Total2 161,720 3,138 — 164,858
2018 Total %2 98.1% 1.9% — 100.0% 1 Within the Group’s statement of financial position, assets are recognised for deferred tax and current tax. The valuation basis of these assets does not directly fall within any of the categories outlined above. As such, these assets
have been reported together with equity accounted items within the analysis of the Group’s assets. 2 Following a review of the Group’s presentation of consolidated investment funds, comparative amounts have been restated from those previously reported. The restatement has had no impact on the profit for the year or equity.
See note B2(a) for further information.

Analysis of assets continued
Aviva plc Preliminary announcement 2019 96
Overview Analysis of assets Other information
IFRS Income, expenses & capital
C2 – Summary of total assets by valuation bases continued
Total assets – Participating fund assets 2019 Fair value
£m
Amortised cost
£m
Equity accounted/
tax assets1 £m
Total £m
Goodwill and acquired value of in-force business and intangible assets — — — — Interests in joint ventures and associates — — 895 895 Property and equipment 168 15 — 183 Investment property 3,466 — — 3,466 Loans 42 5,189 — 5,231 Financial Investments
Debt securities 100,574 — — 100,574 Equity securities 14,959 — — 14,959 Other investments 10,722 — — 10,722
Reinsurance assets — 437 — 437 Deferred tax assets — — — — Current tax assets — — — — Receivables and other financial assets — 1,739 — 1,739 Deferred acquisition costs and other assets — 646 — 646 Prepayments and accrued income — 1,278 — 1,278 Cash and cash equivalents 6,096 — — 6,096 Total 136,027 9,304 895 146,226 Total % 93.0% 6.4% 0.6% 100.0% Less: Assets classified as held for sale (206) — — (206) Total 135,821 9,304 895 146,020 Total % 93.0% 6.4% 0.6% 100.0% 2018 Total2 131,992 9,618 999 142,609
2018 Total %2 92.6% 6.7% 0.7% 100.0% 1 Within the Group’s statement of financial position, assets are recognised for deferred tax and current tax. The valuation basis of these assets does not directly fall within any of the categories outlined above. As such, these assets
have been reported together with equity accounted items within the analysis of the Group’s assets. 2 Following a review of the Group’s presentation of consolidated investment funds, comparative amounts have been restated from those previously reported. The restatement has had no impact on the profit for the year or equity.
See note B2(a) for further information.
Total assets – Shareholder assets 2019 Fair value
£m
Amortised cost
£m
Equity accounted/
tax assets1 £m
Total £m
Goodwill and acquired value of in-force business and intangible assets — 5,181 — 5,181 Interests in joint ventures and associates — — 551 551 Property and equipment 224 490 — 714 Investment property 687 — — 687 Loans 28,277 2,961 — 31,238 Financial Investments
Debt securities 56,557 — — 56,557 Equity securities 1,832 — — 1,832 Other investments 3,391 — — 3,391
Reinsurance assets 11 7,980 — 7,991 Deferred tax assets — — 162 162 Current tax assets — — 132 132 Receivables and other financial assets — 6,581 — 6,581 Deferred acquisition costs and other assets — 5,282 — 5,282 Prepayments and accrued income — 1,481 — 1,481 Cash and cash equivalents 5,855 — — 5,855 Total 96,834 29,956 845 127,635 Total % 75.8% 23.5% 0.7% 100.0% Less: Assets classified as held for sale (412) (705) (19) (1,136) Total 96,422 29,251 826 126,499 Total % 76.2% 23.1% 0.7% 100.0% 2018 Total2 91,421 29,853 780 122,054
2018 Total %2 74.9% 24.5% 0.6% 100.0% 1 Within the Group’s statement of financial position, assets are recognised for deferred tax and current tax. The valuation basis of these assets does not directly fall within any of the categories outlined above. As such, these assets
have been reported together with equity accounted items within the analysis of the Group’s assets. 2 Following a review of the Group’s presentation of consolidated investment funds, comparative amounts have been restated from those previously reported. The restatement has had no impact on the profit for the year or equity.
See note B2(a) for further information.

Analysis of assets continued
Aviva plc Preliminary announcement 2019 97
Overview Analysis of assets Other information
IFRS Income, expenses & capital
C3 – Analysis of financial investments by fund The asset allocation as at 31 December 2019 across the Group, split according to the type of the liability the assets are backing, is shown in the table below.
Shareholder business assets Participating fund assets
Carrying value in the statement of financial position
General insurance &
health & other1
£m
Annuity and non-profit
£m
Total shareholder
assets £m
Policyholder (unit-linked
assets) £m
UK style with-profits
£m
Continental European-
style participating
funds £m
Total assets analysed
£m
Less: Assets classified as held for sale
£m
Carrying value in the
statement of financial position
£m
Debt securities (note C4) Government bonds 6,499 17,566 24,065 18,099 13,762 33,022 88,948 (125) 88,823 Corporate bonds 3,759 21,916 25,675 16,736 11,380 34,823 88,614 (525) 88,089 Other 2,096 4,721 6,817 7,515 5,039 2,548 21,919 1 21,920 12,354 44,203 56,557 42,350 30,181 70,393 199,481 (649) 198,832 Loans (note C5) Mortgage loans — 21,508 21,508 — 41 — 21,549 — 21,549 Other loans 1,329 8,401 9,730 2,111 4,071 1,119 17,031 (1) 17,030 1,329 29,909 31,238 2,111 4,112 1,119 38,580 (1) 38,579 Equity securities (note C6) 1,292 540 1,832 83,035 11,137 3,822 99,826 (256) 99,570 Investment property (note C7) 520 167 687 7,050 1,957 1,509 11,203 — 11,203 Other investments (note C8) 1,317 2,074 3,391 37,822 5,736 4,986 51,935 (6,919) 45,016 Total 16,812 76,893 93,705 172,368 53,123 81,829 401,025 (7,825) 393,200 2018 Total2 16,673 72,556 89,229 152,158 54,549 78,806 374,742 (7,251) 367,491 1 Of the £16,812 million of assets 26% relates to other shareholder business assets. 2 Following a review of the Group’s presentation of consolidated investment funds, comparative amounts have been restated from those previously reported. The restatement has had no impact on the profit for the year or equity.
See note B2(a) for further information.

Analysis of assets continued
Aviva plc Preliminary announcement 2019 98
Overview Analysis of assets Other information
IFRS Income, expenses & capital
C4 – Analysis of debt securities C4.1 Fair value hierarchy To provide further information on the valuation techniques we use to measure assets carried at fair value, we have categorised the measurement basis for assets carried at fair value into a ‘fair value hierarchy’ described as follows, based on the lowest level input that is significant to the valuation as a whole: • Inputs to Level 1 fair values are quoted prices (unadjusted) in active markets for identical assets. • Inputs to Level 2 fair values are inputs other than quoted prices included within Level 1 that are observable for the asset, either directly or
indirectly. If the asset has a specified (contractual) term, a Level 2 input must be observable for substantially the full term of the asset. • Inputs to Level 3 fair values are unobservable inputs for the asset. Unobservable inputs may have been used to measure fair value to the
extent that observable inputs are not available, thereby allowing for situations in which there is little, if any, market activity for the asset at the measurement date. However, the fair value measurement objective remains the same, i.e. an exit price at the measurement date from the perspective of a market participant that holds the asset. Unobservable inputs reflect the assumptions the business unit considers that market participants would use in pricing the asset. Examples are investment property and commercial and equity release mortgage loans.
Fair value hierarchy
Debt securities – Total 2019 Level 1
£m Level 2
£m Level 3
£m Total
£m
UK Government 24,485 2,132 629 27,246 Non-UK government 36,463 20,859 4,380 61,702
Europe 35,207 7,605 3,691 46,503 North America 308 5,811 445 6,564 Asia Pacific & Other 948 7,443 244 8,635
Corporate bonds – Public utilities 686 7,965 1,615 10,266 Other corporate bonds 6,199 61,857 10,292 78,348 Other 3 20,836 1,080 21,919 Total 67,836 113,649 17,996 199,481 Total % 34.0% 57.0% 9.0% 100.0% Less: Assets classified as held for sale (198) (50) (401) (649) Total 67,638 113,599 17,595 198,832 Total % 34.0% 57.2% 8.8% 100.0% 2018 Total1,2 66,016 109,194 16,862 192,072
2018 Total %1,2 34.3% 56.9% 8.8% 100.0% 1 Following a review of the Group’s presentation of consolidated investment funds, comparative amounts have been restated from those previously reported. The review identified amounts presented within cash and cash
equivalents and other investments that are now presented as debt securities in the table above. The restatement has had no impact on the profit for the year or equity. See note B2(a) for further information. 2 Following a review of the classification of financial assets, comparative amounts have been amended from those previously reported. The effect of this change is to reclassify £2,201 million of assets from fixed maturity securities
to other investments.
Fair value hierarchy
Debt securities – Policyholder assets 2019 Level 1
£m Level 2
£m Level 3
£m Total
£m
UK Government 8,787 1 — 8,788 Non-UK government 3,318 5,986 7 9,311
Europe 3,076 1,526 — 4,602 North America 30 1,730 5 1,765 Asia Pacific & Other 212 2,730 2 2,944
Corporate bonds – Public utilities 10 1,370 1 1,381 Other corporate bonds 91 14,559 705 15,355 Other 2 7,513 — 7,515 Total 12,208 29,429 713 42,350 Total % 28.8% 69.5% 1.7% 100.0% Less: Assets classified as held for sale (39) (26) (401) (466) Total 12,169 29,403 312 41,884 Total % 29.1% 70.2% 0.7% 100.0% 2018 Total1,2 10,674 25,881 626 37,181
2018 Total %1,2 28.7% 69.6% 1.7% 100.0% 1 Following a review of the Group’s presentation of consolidated investment funds, comparative amounts have been restated from those previously reported. The review identified amounts presented within cash and cash
equivalents and other investments that are now presented as debt securities in the table above. The restatement has had no impact on the profit for the year or equity. See note B2(a) for further information. 2 Following a review of the classification of financial assets, comparative amounts have been amended from those previously reported. The effect of this change is to reclassify £1,444 million from other investments to fixed maturity
securities.

Analysis of assets continued
Aviva plc Preliminary announcement 2019 99
Overview Analysis of assets Other information
IFRS Income, expenses & capital
C4 – Analysis of debt securities continued C4.1 Fair value hierarchy continued
Fair value hierarchy
Debt securities – Participating fund assets 2019 Level 1
£m Level 2
£m Level 3
£m Total
£m
UK Government 6,451 810 115 7,376 Non-UK government 30,152 7,334 1,922 39,408
Europe 29,357 2,872 1,898 34,127 North America 204 407 24 635 Asia Pacific & Other 591 4,055 — 4,646
Corporate bonds – Public utilities 648 2,760 43 3,451 Other corporate bonds 5,836 30,713 6,203 42,752 Other 1 6,741 845 7,587 Total 43,088 48,358 9,128 100,574 Total % 42.8% 48.1% 9.1% 100.0% Less: Assets classified as held for sale — — — — Total 43,088 48,358 9,128 100,574 Total % 42.8% 48.1% 9.1% 100.0% 2018 Total1,2 42,135 47,782 9,478 99,395
2018 Total %1,2 42.4% 48.1% 9.5% 100.0% 1 Following a review of the Group’s presentation of consolidated investment funds, comparative amounts have been restated from those previously reported. The review identified amounts presented within cash and cash
equivalents and other investments that are now presented as debt securities in the table above. The restatement has had no impact on the profit for the year or equity. See note B2(a) for further information. 2 Following a review of the classification of financial assets, comparative amounts have been amended from those previously reported. The effect of this change is to reclassify £3,408 million from fixed maturity securities to other
investments.
Fair value hierarchy
Debt securities – Shareholder assets 2019 Level 1
£m Level 2
£m Level 3
£m Total
£m
UK Government 9,247 1,321 514 11,082 Non-UK government 2,993 7,539 2,451 12,983
Europe 2,774 3,207 1,793 7,774 North America 74 3,674 416 4,164 Asia Pacific & Other 145 658 242 1,045
Corporate bonds – Public utilities 28 3,835 1,571 5,434 Other corporate bonds 272 16,585 3,384 20,241 Other — 6,582 235 6,817 Total 12,540 35,862 8,155 56,557 Total % 22.2% 63.4% 14.4% 100.0% Less: Assets classified as held for sale (159) (24) — (183) Total 12,381 35,838 8,155 56,374 Total % 22.0% 63.5% 14.5% 100.0% 2018 Total1,2 13,207 35,531 6,758 55,496
2018 Total %1,2 23.8% 64.0% 12.2% 100.0% 1 Following a review of the Group’s presentation of consolidated investment funds, comparative amounts have been restated from those previously reported. The review identified amounts presented within cash and cash
equivalents and other investments that are now presented as debt securities in the table above. The restatement has had no impact on the profit for the year or equity. See note B2(a) for further information. 2 Following a review of the classification of financial assets, comparative amounts have been amended from those previously reported. The effect of this change is to reclassify £237 million from fixed maturity securities to other
investments.
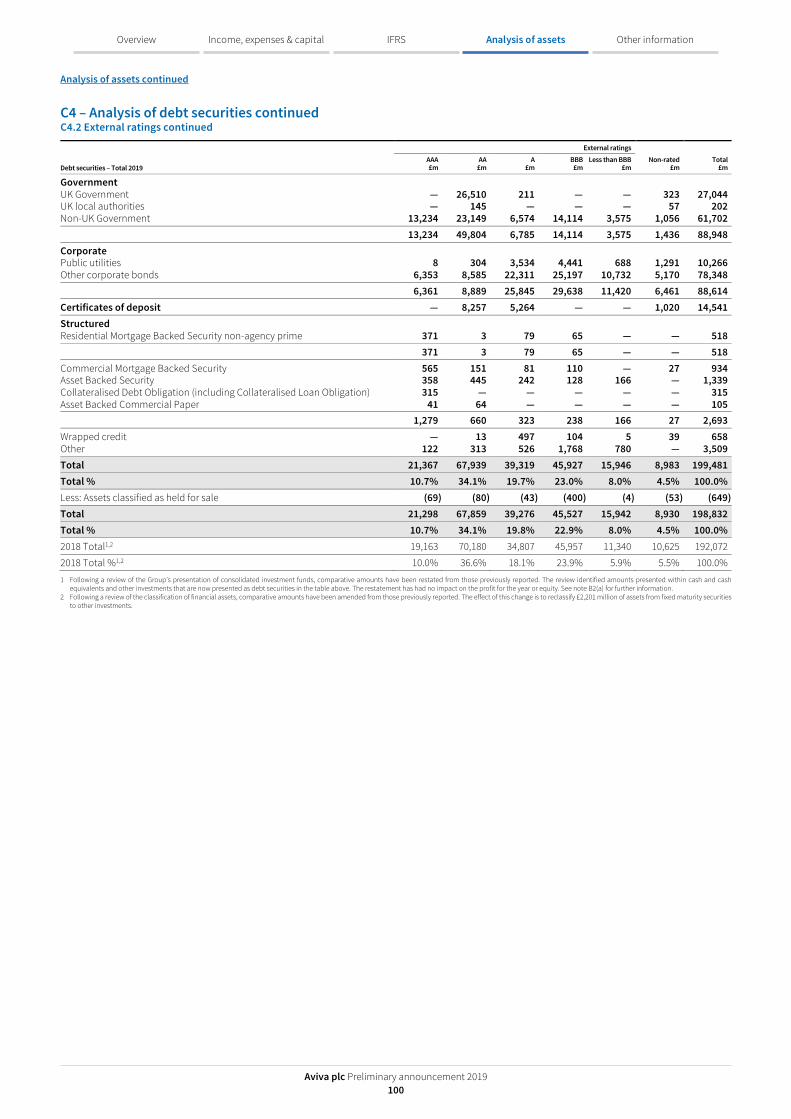
Analysis of assets continued
Aviva plc Preliminary announcement 2019 100
Overview Analysis of assets Other information
IFRS Income, expenses & capital
C4 – Analysis of debt securities continued C4.2 External ratings continued
External ratings
Debt securities – Total 2019 AAA £m
AA £m
A £m
BBB £m
Less than BBB £m
Non-rated £m
Total £m
Government UK Government — 26,510 211 — — 323 27,044 UK local authorities — 145 — — — 57 202 Non-UK Government 13,234 23,149 6,574 14,114 3,575 1,056 61,702 13,234 49,804 6,785 14,114 3,575 1,436 88,948 Corporate Public utilities 8 304 3,534 4,441 688 1,291 10,266 Other corporate bonds 6,353 8,585 22,311 25,197 10,732 5,170 78,348 6,361 8,889 25,845 29,638 11,420 6,461 88,614 Certificates of deposit — 8,257 5,264 — — 1,020 14,541 Structured Residential Mortgage Backed Security non-agency prime 371 3 79 65 — — 518 371 3 79 65 — — 518 Commercial Mortgage Backed Security 565 151 81 110 — 27 934 Asset Backed Security 358 445 242 128 166 — 1,339 Collateralised Debt Obligation (including Collateralised Loan Obligation) 315 — — — — — 315 Asset Backed Commercial Paper 41 64 — — — — 105 1,279 660 323 238 166 27 2,693 Wrapped credit — 13 497 104 5 39 658 Other 122 313 526 1,768 780 — 3,509 Total 21,367 67,939 39,319 45,927 15,946 8,983 199,481 Total % 10.7% 34.1% 19.7% 23.0% 8.0% 4.5% 100.0% Less: Assets classified as held for sale (69) (80) (43) (400) (4) (53) (649) Total 21,298 67,859 39,276 45,527 15,942 8,930 198,832 Total % 10.7% 34.1% 19.8% 22.9% 8.0% 4.5% 100.0% 2018 Total1,2 19,163 70,180 34,807 45,957 11,340 10,625 192,072
2018 Total %1,2 10.0% 36.6% 18.1% 23.9% 5.9% 5.5% 100.0% 1 Following a review of the Group’s presentation of consolidated investment funds, comparative amounts have been restated from those previously reported. The review identified amounts presented within cash and cash
equivalents and other investments that are now presented as debt securities in the table above. The restatement has had no impact on the profit for the year or equity. See note B2(a) for further information. 2 Following a review of the classification of financial assets, comparative amounts have been amended from those previously reported. The effect of this change is to reclassify £2,201 million of assets from fixed maturity securities
to other investments.

Analysis of assets continued
Aviva plc Preliminary announcement 2019 101
Overview Analysis of assets Other information
IFRS Income, expenses & capital
C4 – Analysis of debt securities continued C4.2 External ratings continued
External ratings
Debt securities – Policyholder assets 2019 AAA £m
AA £m
A £m
BBB £m
Less than BBB £m
Non-rated £m
Total £m
Government UK Government — 8,739 4 — — 44 8,787 UK local authorities — 1 — — — — 1 Non-UK Government 2,650 684 1,854 2,335 1,742 46 9,311 2,650 9,424 1,858 2,335 1,742 90 18,099 Corporate Public utilities 7 35 681 479 164 15 1,381 Other corporate bonds 637 1,502 3,817 4,672 3,617 1,110 15,355 644 1,537 4,498 5,151 3,781 1,125 16,736 Certificates of deposit — 2,738 2,478 — — 873 6,089 Structured Residential Mortgage Backed Security non-agency prime 104 2 — 25 — — 131 104 2 — 25 — — 131 Commercial Mortgage Backed Security 89 51 1 29 — — 170 Asset Backed Security 104 42 11 — 26 — 183 Collateralised Debt Obligation (including Collateralised Loan Obligation) — — — — — — — Asset Backed Commercial Paper 12 40 — — — — 52 205 133 12 29 26 — 405 Wrapped credit — — — 4 — — 4 Other 31 79 133 446 197 — 886 Total 3,634 13,913 8,979 7,990 5,746 2,088 42,350 Total % 8.6% 32.8% 21.2% 18.9% 13.6% 4.9% 100.0% Less: Assets classified as held for sale (14) (15) (10) (384) (4) (39) (466) Total 3,620 13,898 8,969 7,606 5,742 2,049 41,884 Total % 8.6% 33.2% 21.4% 18.2% 13.7% 4.9% 100.0% 2018 Total1,2 2,096 14,121 6,534 6,772 4,495 3,163 37,181
2018 Total %1,2 5.6% 38.0% 17.6% 18.2% 12.1% 8.5% 100.0% 1 Following a review of the Group’s presentation of consolidated investment funds, comparative amounts have been restated from those previously reported. The review identified amounts presented within cash and cash
equivalents and other investments that are now presented as debt securities in the table above. The restatement has had no impact on the profit for the year or equity. See note B2(a) for further information. 2 Following a review of the classification of financial assets, comparative amounts have been amended from those previously reported. The effect of this change is to reclassify £1,444 million from other investments to fixed maturity
securities.

Analysis of assets continued
Aviva plc Preliminary announcement 2019 102
Overview Analysis of assets Other information
IFRS Income, expenses & capital
C4 – Analysis of debt securities continued C4.2 External ratings continued
External ratings
Debt securities – Participating fund assets 2019 AAA £m
AA £m
A £m
BBB £m
Less than BBB £m
Non-rated £m
Total £m
Government UK Government — 7,246 2 — — 121 7,369 UK local authorities — 7 — — — — 7 Non-UK Government 4,694 18,158 3,296 11,351 1,781 128 39,408 4,694 25,411 3,298 11,351 1,781 249 46,784 Corporate Public utilities 1 133 984 1,754 516 63 3,451 Other corporate bonds 3,597 4,267 10,803 15,450 6,818 1,817 42,752 3,598 4,400 11,787 17,204 7,334 1,880 46,203 Certificates of deposit — 2,497 1,346 — — 134 3,977 Structured Residential Mortgage Backed Security non-agency prime 126 1 17 39 — — 183 126 1 17 39 — — 183 Commercial Mortgage Backed Security 130 25 3 24 — 11 193 Asset Backed Security 115 59 122 13 45 — 354 Collateralised Debt Obligation (including Collateralised Loan Obligation) 315 — — — — — 315 Asset Backed Commercial Paper 13 23 — — — — 36 573 107 125 37 45 11 898 Wrapped credit — — 33 4 — 2 39 Other 87 222 373 1,255 553 — 2,490 Total 9,078 32,638 16,979 29,890 9,713 2,276 100,574 Total % 9.0% 32.4% 16.9% 29.7% 9.7% 2.3% 100.0% Less: Assets classified as held for sale — — — — — — — Total 9,078 32,638 16,979 29,890 9,713 2,276 100,574 Total % 9.0% 32.4% 16.9% 29.7% 9.7% 2.3% 100.0% 2018 Total1,2 8,886 34,300 16,030 30,659 6,444 3,076 99,395
2018 Total %1,2 8.9% 34.6% 16.1% 30.8% 6.5% 3.1% 100.0% 1 Following a review of the Group’s presentation of consolidated investment funds, comparative amounts have been restated from those previously reported. The review identified amounts presented within cash and cash
equivalents and other investments that are now presented as debt securities in the table above. The restatement has had no impact on the profit for the year or equity. See note B2(a) for further information. 2 Following a review of the classification of financial assets, comparative amounts have been amended from those previously reported. The effect of this change is to reclassify £3,408 million from fixed maturity securities to other
investments.

Analysis of assets continued
Aviva plc Preliminary announcement 2019 103
Overview Analysis of assets Other information
IFRS Income, expenses & capital
C4 – Analysis of debt securities continued C4.2 External ratings continued
External ratings
Debt securities – Shareholder assets 2019 AAA £m
AA £m
A £m
BBB £m
Less than BBB £m
Non-rated £m
Total £m
Government UK Government — 10,525 205 — — 158 10,888 UK local authorities — 137 — — — 57 194 Non-UK Government 5,890 4,307 1,424 428 52 882 12,983 5,890 14,969 1,629 428 52 1,097 24,065 Corporate Public utilities — 136 1,869 2,208 8 1,213 5,434 Other corporate bonds 2,119 2,816 7,691 5,075 297 2,243 20,241 2,119 2,952 9,560 7,283 305 3,456 25,675 Certificates of deposit — 3,022 1,440 — — 13 4,475 Structured Residential Mortgage Backed Security non-agency prime 141 — 62 1 — — 204 141 — 62 1 — — 204 Commercial Mortgage Backed Security 346 75 77 57 — 16 571 Asset Backed Security 139 344 109 115 95 — 802 Collateralised Debt Obligation (including Collateralised Loan Obligation) — — — — — — — Asset Backed Commercial Paper 16 1 — — — — 17 501 420 186 172 95 16 1,390 Wrapped credit — 13 464 96 5 37 615 Other 4 12 20 67 30 — 133 Total 8,655 21,388 13,361 8,047 487 4,619 56,557 Total % 15.3% 37.8% 23.6% 14.2% 0.9% 8.2% 100.0% Less: Assets classified as held for sale (55) (65) (33) (16) — (14) (183) Total 8,600 21,323 13,328 8,031 487 4,605 56,374 Total % 15.3% 37.8% 23.6% 14.2% 0.9% 8.2% 100.0% 2018 Total1,2 8,181 21,759 12,243 8,526 401 4,386 55,496
2018 Total %1,2 14.7% 39.2% 22.1% 15.4% 0.7% 7.9% 100.0% 1 Following a review of the Group’s presentation of consolidated investment funds, comparative amounts have been restated from those previously reported. The review identified amounts presented within cash and cash
equivalents and other investments that are now presented as debt securities in the table above. The restatement has had no impact on the profit for the year or equity. See note B2(a) for further information. 2 Following a review of the classification of financial assets, comparative amounts have been amended from those previously reported. The effect of this change is to reclassify £237 million from fixed maturity securities to other
investments.
Within shareholder assets debt securities, 42.5% of exposure is in government holdings (2018 restated: 41.1%). Our corporate debt securities portfolio represents 45.4% of total shareholder debt securities (2018 restated: 47.3%). At 31 December 2019, the proportion of our shareholder debt securities that are investment grade is 90.9% (2018 restated: 91.4%). The remaining 9.1% of shareholder debt securities that do not have an external rating of BBB or higher can be split as follows: • 0.9% are debt securities that are rated as below investment grade; and • 8.2% are not rated by the major rating agencies.
The majority of non-rated corporate bonds are held by our businesses in the UK. Of the securities not rated by an external rating agency most are allocated an internal rating using a methodology largely consistent with that adopted by an external rating agency, and are considered to be of investment grade credit quality; these include £3.2 billion (2018: £3.0 billion) of debt securities held in our UK Life business, predominantly made up of private placements and other corporate bonds, which have been internally rated as investment grade.

Analysis of assets continued
Aviva plc Preliminary announcement 2019 104
Overview Analysis of assets Other information
IFRS Income, expenses & capital
C5 – Analysis of loans (a) Overview The Group’s loan portfolio of £38,579 million (2018 restated: £36,184 million) is principally made up of the following: • Policy loans of £684 million (2018: £770 million), which are generally collateralised by a lien or charge over the underlying policy; • Loans and advances to banks of £8,830 million (2018 restated: £9,322 million), which primarily relate to loans of cash collateral received in
stock lending transactions and are therefore fully collateralised by other securities. Following a review of the Group’s presentation of consolidated investment funds, comparative amounts have been restated from those previously reported to reclassify certain stock lending transactions from cash and cash equivalents to loans and advances to banks. The restatement has had no impact on the profit for the year or equity. See note B2(a) for further information;
• Mortgage loans collateralised by property assets of £21,549 million (2018: £19,864 million); and • Healthcare, infrastructure and private financial initiative (PFI) loans of £6,467 million (2018: £5,358 million).
Loans with fixed maturities, including policy loans and loans and advances to banks, are recognised when cash is advanced to borrowers. These loans are carried at their unpaid principal balances and adjusted for amortisation of premium or discount, non-refundable loan fees and related direct costs. These amounts are deferred and amortised over the life of the loan using the effective interest rate method.
For certain mortgage loans, the Group has taken advantage of the fair value option under IAS 39 Financial Instruments: Recognition Measurement to present the mortgages, associated borrowings, other liabilities and derivative financial instruments at fair value, since they are managed together on a fair value basis. These mortgage loans are not traded in active markets and are classified within level 3 of the fair value hierarchy as the significant valuation assumptions and inputs are not deemed to be market observable. Of the Group’s total loan portfolio, 55.8% (2018 restated: 54.9%) is invested in mortgage loans. The shareholder risk relating to these loans is discussed further below.
Healthcare, infrastructure and PFI loans included within shareholder assets are £6,467 million (2018: £5,358 million). These loans are secured against the income from healthcare and education premises and as such are not considered further in this section.
Loans – Shareholder assets 2019
United Kingdom
£m Canada
£m Europe
£m Asia £m
Total £m
Policy loans 5 — 2 1 8 Loans and advances to banks 3,129 — — — 3,129 Healthcare, Infrastructure and PFI other loans 6,248 — 219 — 6,467 Mortgage loans 21,508 — — — 21,508 Other loans — 125 1 — 126 Total 30,890 125 222 1 31,238 Total % 98.9% 0.4% 0.7% — 100.0% Less: Assets classified as held for sale — — — — — Total 30,890 125 222 1 31,238 Total % 98.9% 0.4% 0.7% — 100.0% 2018 Total1 27,901 164 252 2 28,319
2018 Total %1 98.5% 0.6% 0.9% — 100.0% 1 Following a review of the Group’s presentation of consolidated investment funds, comparative amounts have been restated from those previously reported. The review identified amounts presented within cash and cash
equivalents and other investments that are now presented as loans and advances to banks in the table above. The restatement has had no impact on the profit for the year or equity. See note B2(a) for further information.
(b) Analysis of shareholder mortgage loans Mortgage loans included within shareholder assets are £21,508 million (2018: £19,813 million) and are almost entirely held in the UK. The narrative below focuses on explaining the risks arising as a result of these exposures.
2019 Total
£m
Non-securitised mortgage loans – Residential (Equity release) 8,558 – Commercial 7,640 – Healthcare, Infrastructure and PFI mortgage loans 2,878 19,076 Securitised mortgage loans 2,432 Total 21,508 Less: Assets classified as held for sale — Total 21,508 2018 Total 19,813
Non-securitised mortgage loans Residential The UK non-securitised residential mortgage portfolio has a total value as at 31 December 2019 of £8,558 million (2018: £7,315 million). The movement in the year is due to £782 million of new lending and an increase in the fair value of £502 million. Additional accrued interest in the year is offset by the value of redemptions. These mortgages are all in the form of equity release, whereby homeowners mortgage their property to release cash equity. Due to the structure of equity release mortgages, whereby interest amounts due are not paid in cash but instead rolled into the amount outstanding, they predominantly have a current Loan to Value (LTV) of below 70%. The average LTV across the portfolio is 28.2% (2018: 26.8%).

Analysis of assets continued
Aviva plc Preliminary announcement 2019 105
Overview Analysis of assets Other information
IFRS Income, expenses & capital
C5 – Analysis of loans continued (b) Analysis of shareholder mortgage loans continued Non-securitised mortgage loans continued Commercial Gross exposure by loan to value and arrears of UK non-securitised commercial mortgages is shown in the table below.
2019 >120%
£m 115–120%
£m 110–115%
£m 105–110%
£m 100–105%
£m 95–100%
£m 90–95%
£m 80–90%
£m 70–80%
£m <70%
£m Total
£m
Not in arrears — — — — 302 144 — 65 913 6,216 7,640 Total — — — — 302 144 — 65 913 6,216 7,640
Of the £7,640 million (2018: £7,232 million) of mortgage loans within shareholder assets, £6,877 million are used to back annuity liabilities and are stated on a fair value basis. The UK loan exposures are calculated on a discounted cash flow basis, and include a risk adjustment through the use of a Credit Risk Adjusted Value (CRAV).
For commercial mortgages, loan service collection ratios, a key indicator of mortgage portfolio performance, improved to 2.56x (2018: 2.43x). Loan Interest Cover (LIC), which is defined as the annual net rental income (including rental deposits less ground rent) divided by the annual loan interest service, also improved to 2.9x (2018: 2.75x). Average mortgage LTV increased from 54.9% in 2018 to 55.6%. There are no loans in arrears (2018: nil).
Commercial mortgages and Healthcare, Infrastructure and PFI loans are held at fair value on the asset side of the statement of financial position. The related insurance liabilities are valued using a discount rate derived from the gross yield on assets, with adjustments to allow for risk. £15,910 million of shareholder loan assets are backing annuity liabilities and comprise of commercial mortgage loans (£6,877 million), Healthcare, Infrastructure and PFI mortgage loans (£2,878 million) and Healthcare, Infrastructure and PFI other loans (£6,155 million).
The Group carries a valuation allowance within insurance liabilities against the risk of default of commercial mortgages of £500 million which equates to 34 bps at 31 December 2019 (2018: 41 bps). The total valuation allowance held on business transferred in from Aviva Annuity UK Limited in respect of corporate bonds and mortgages is £1,300 million (2018: £1,300 million) over the remaining term of the UK corporate bond and mortgage portfolio.
The UK portfolio remains well diversified in terms of property type, location and tenants as well as the spread of loans written over time. The risks in commercial mortgages are addressed through several layers of protection with the mortgage risk profile being primarily driven by the ability of the underlying tenant rental income to cover loan interest and amortisation. Should any single tenant default on their rental payment, rental from other tenants backing the same loan often ensures the loan interest cover does not fall below 1.0x. Where there are multiple loans to a single borrower further protection may be achieved through cross-charging (or pooling) such that any single loan is also supported by rents received within other pool loans. Additionally, there may be support provided by the borrower of the loan itself and further loss mitigation from any general floating charge held over assets within the borrower companies.
If the LIC cover falls below 1.0x and the borrower defaults then Aviva retains the option of selling the security or restructuring the loans and benefiting from the protection of the collateral. A combination of these benefits and the high recovery levels afforded by property collateral (compared to corporate debt or other uncollateralised credit exposures) results in the economic exposure being significantly lower than the gross exposure reported above. The Group continues to actively manage this position.
Healthcare, Infrastructure and PFI Healthcare, Infrastructure and PFI mortgage loans included within shareholder assets of £2,878 million (2018: £2,829 million) are secured against healthcare premises, education, social housing and emergency services related premises. For all such loans, Government support is provided through either direct funding or reimbursement of rental payments to the tenants to meet income service and provide for the debt to be reduced substantially over the term of the loan. Although the loan principal is not Government guaranteed, the nature of these businesses provides considerable comfort of an ongoing business model and low risk of default.
On a market value basis, we estimate the average LTV of these mortgages to be 72.6% (2018: 72.3%), although this is not considered to be a key risk indicator due to the Government support noted above and the social need for these premises. The Group therefore consider these loans to be lower risk relative to other mortgage loans.
Securitised mortgage loans As at 31 December 2019, the Group has £2,432 million (2018: £2,437 million) of securitised mortgage loans within shareholder assets. Funding for the securitised residential mortgage assets was obtained by issuing loan note securities. Of these loan notes approximately £224 million (2018: £239 million) are held by Group companies. The remainder is held by third parties external to Aviva. As any cash shortfall arising once all mortgages have been redeemed is borne by the loan note holders, the majority of the credit risk of these mortgages is borne by third parties rather than by shareholders. The average LTV across the securitised mortgage loans is 49.0% (2018: 45.2%).

Analysis of assets continued
Aviva plc Preliminary announcement 2019 106
Overview Analysis of assets Other information
IFRS Income, expenses & capital
C6 – Analysis of equity securities
2019 Restated1
2018
Fair value hierarchy Fair value hierarchy
Equity securities – Total assets Level 1
£m Level 2
£m Level 3
£m Total
£m Level 1
£m Level 2
£m Level 3
£m Total
£m
Public utilities 2,883 — — 2,883 2,369 — — 2,369 Banks, trusts and insurance companies 20,476 — 160 20,636 19,571 — 172 19,743 Industrial miscellaneous and all other 75,496 — 600 76,096 65,860 — 269 66,129 Non-redeemable preferred shares 211 — — 211 196 — — 196
Total 99,066 — 760 99,826 87,996 — 441 88,437
Total % 99.2% — 0.8% 100.0% 99.5% — 0.5% 100.0%
Less: Assets classified as held for sale (216) — (40) (256) (183) — (27) (210)
Total 98,850 — 720 99,570 87,813 — 414 88,227
Total % 99.3% — 0.7% 100.0% 99.5% — 0.5% 100.0% 1 Following a review of the Group’s presentation of consolidated investment funds, comparative amounts have been restated from those previously reported. The review identified amounts presented within cash and cash
equivalents and other investments that are now presented as equity securities in the table above. The restatement has had no impact on the profit for the year or equity. See note B2(a) for further information.
2019 Restated1
2018
Fair value hierarchy Fair value hierarchy
Equity securities – Policyholder assets Level 1
£m Level 2
£m Level 3
£m Total
£m Level 1
£m Level 2
£m Level 3
£m Total
£m
Public utilities 2,549 — — 2,549 2,072 — — 2,072 Banks, trusts and insurance companies 17,070 — 6 17,076 15,897 — 6 15,903 Industrial miscellaneous and all other 63,210 — 189 63,399 55,068 — 167 55,235 Non-redeemable preferred shares 11 — — 11 19 — — 19
Total 82,840 — 195 83,035 73,056 — 173 73,229
Total % 99.8% — 0.2% 100.0% 99.8% — 0.2% 100.0%
Less: Assets classified as held for sale (216) — (40) (256) (183) — (26) (209)
Total 82,624 — 155 82,779 72,873 — 147 73,020
Total % 99.8% — 0.2% 100.0% 99.8% — 0.2% 100.0% 1 Following a review of the Group’s presentation of consolidated investment funds, comparative amounts have been restated from those previously reported. The review identified amounts presented within cash and cash
equivalents and other investments that are now presented as equity securities in the table above. The restatement has had no impact on the profit for the year or equity. See note B2(a) for further information.
2019 Restated1
2018
Fair value hierarchy Fair value hierarchy
Equity securities – Participating fund assets Level 1
£m Level 2
£m Level 3
£m Total
£m Level 1
£m Level 2
£m Level 3
£m Total
£m
Public utilities 319 — — 319 283 — — 283 Banks, trusts and insurance companies 3,239 — 48 3,287 3,525 — 65 3,590 Industrial miscellaneous and all other 10,973 — 380 11,353 9,724 — 95 9,819 Non-redeemable preferred shares — — — — — — — —
Total 14,531 — 428 14,959 13,532 — 160 13,692
Total % 97.1% — 2.9% 100.0% 98.8% — 1.2% 100.0%
Less: Assets classified as held for sale — — — — — — — —
Total 14,531 — 428 14,959 13,532 — 160 13,692
Total % 97.1% — 2.9% 100.0% 98.8% — 1.2% 100.0% 1 Following a review of the Group’s presentation of consolidated investment funds, comparative amounts have been restated from those previously reported. The review identified amounts presented within cash and cash
equivalents and other investments that are now presented as equity securities in the table above. The restatement has had no impact on the profit for the year or equity. See note B2(a) for further information.
2019 Restated1
2018
Fair value hierarchy Fair value hierarchy
Equity securities – Shareholder assets Level 1
£m Level 2
£m Level 3
£m Total
£m Level 1
£m Level 2
£m Level 3
£m Total
£m
Public utilities 15 — — 15 14 — — 14 Banks, trusts and insurance companies 167 — 106 273 149 — 101 250 Industrial miscellaneous and all other 1,313 — 31 1,344 1,068 — 7 1,075 Non-redeemable preferred shares 200 — — 200 177 — — 177
Total 1,695 — 137 1,832 1,408 — 108 1,516
Total % 92.5% — 7.5% 100.0% 92.9% — 7.1% 100.0%
Less: Assets classified as held for sale — — — — — — (1) (1)
Total 1,695 — 137 1,832 1,408 — 107 1,515
Total % 92.5% — 7.5% 100.0% 92.9% — 7.1% 100.0% 1 Following a review of the Group’s presentation of consolidated investment funds, comparative amounts have been restated from those previously reported. The review identified amounts presented within cash and cash
equivalents and other investments that are now presented as equity securities in the table above. The restatement has had no impact on the profit for the year or equity. See note B2(a) for further information.

Analysis of assets continued
Aviva plc Preliminary announcement 2019 107
Overview Analysis of assets Other information
IFRS Income, expenses & capital
C7 – Analysis of investment property The Group’s total investment property value is £11,203 million (2018: £11,482 million).
Within total investment properties by value 93.9% (2018: 93.6%) are held in policyholder or participating fund assets. Shareholder exposure to investment properties is principally through investments in UK and French commercial property.
Investment properties are stated at their market values as assessed by qualified external independent valuers. The properties are valued on an income basis that is based on current rental income plus anticipated uplifts at the next rent review, lease expiry, or break option taking into consideration lease incentives and assuming no further growth in the estimated rental value of the property. This uplift and the discount rate are derived from rates implied by recent market transactions on similar property. These inputs are deemed unobservable.
Within total investment properties by value 97.6% (2018: 97.3%) are leased to third parties under operating leases, with the remainder either being vacant or held for capital appreciation.
Within shareholder investment properties by value 100% (2018: 100%) are leased to third parties under operating leases.
C8 – Analysis of other financial investments
2019 Restated1,2
2018
Fair value hierarchy Fair value hierarchy
Other investments – Total Level 1
£m Level 2
£m Level 3
£m Total
£m Level 1
£m Level 2
£m Level 3
£m Total
£m
Unit trusts and other investment vehicles 37,004 438 4,394 41,836 33,930 365 4,309 38,604 Derivative financial instruments 240 6,365 492 7,097 448 4,377 532 5,357 Deposits with credit institutions 156 13 — 169 155 — — 155 Minority holdings in property management undertakings 1 62 2,332 2,395 — 28 1,947 1,975 Other 438 — — 438 476 — — 476 Total 37,839 6,878 7,218 51,935 35,009 4,770 6,788 46,567
Total % 72.9% 13.2% 13.9% 100.0% 75.2% 10.2% 14.6% 100.0%
Less: Assets classified as held for sale (5,374) — (1,545) (6,919) (5,038) — (1,606) (6,644)
Total 32,465 6,878 5,673 45,016 29,971 4,770 5,182 39,923
Total % 72.1% 15.3% 12.6% 100.0% 75.1% 11.9% 13.0% 100.0% 1 Following a review of the Group’s presentation of consolidated investment funds, comparative amounts have been restated from those previously reported. The review identified amounts presented within cash and cash
equivalents and other investments that are now presented as loans, equity securities and fixed maturity securities. The restatement has had no impact on the profit for the year or equity. See note B2(a) for further information. 2 Following a review of the classification of financial assets, comparative amounts have been amended from those previously reported. The effect of this change is to reclassify £2,201 million of assets from fixed maturity securities
to other investments.
2019 Restated1,2
2018
Fair value hierarchy Fair value hierarchy
Other investments – Policyholder assets Level 1
£m Level 2
£m Level 3
£m Total
£m Level 1
£m Level 2
£m Level 3
£m Total
£m
Unit trusts and other investment vehicles 33,698 390 1,549 35,637 29,382 259 1,611 31,252 Derivative financial instruments 17 828 — 845 44 619 2 665 Deposits with credit institutions 125 13 — 138 125 — — 125 Minority holdings in property management undertakings 1 — 775 776 — — 370 370 Other 426 — — 426 460 — — 460
Total 34,267 1,231 2,324 37,822 30,011 878 1,983 32,872
Total % 90.6% 3.3% 6.1% 100.0% 91.3% 2.7% 6.0% 100.0%
Less: Assets classified as held for sale (5,166) — (1,545) (6,711) (5,022) — (1,606) (6,628)
Total 29,101 1,231 779 31,111 24,989 878 377 26,244
Total % 93.5% 4.0% 2.5% 100.0% 95.3% 3.3% 1.4% 100.0% 1 Following a review of the Group’s presentation of consolidated investment funds, comparative amounts have been restated from those previously reported. The review identified amounts presented within cash and cash
equivalents and other investments that are now presented as loans, equity securities and fixed maturity securities. The restatement has had no impact on the profit for the year or equity. See note B2(a) for further information. 2 Following a review of the classification of financial assets, comparative amounts have been amended from those previously reported. The effect of this change is to reclassify £1,444 million from other investments to fixed maturity
securities.

Analysis of assets continued
Aviva plc Preliminary announcement 2019 108
Overview Analysis of assets Other information
IFRS Income, expenses & capital
C8 – Analysis of other financial investments continued
2019 Restated1,2
2018
Fair value hierarchy Fair value hierarchy
Other investments – Participating fund assets Level 1
£m Level 2
£m Level 3
£m Total
£m Level 1
£m Level 2
£m Level 3
£m Total
£m
Unit trusts and other investment vehicles 2,767 47 2,661 5,475 3,729 105 2,585 6,419 Derivative financial instruments 183 3,656 42 3,881 248 2,408 69 2,725 Deposits with credit institutions 26 — — 26 17 — — 17 Minority holdings in property management undertakings — 28 1,312 1,340 — — 1,366 1,366 Other — — — — — — — —
Total 2,976 3,731 4,015 10,722 3,994 2,513 4,020 10,527
Total % 27.8% 34.8% 37.4% 100.0% 37.9% 23.9% 38.2% 100.0%
Less: Assets classified as held for sale (206) — — (206) — — — —
Total 2,770 3,731 4,015 10,516 3,994 2,513 4,020 10,527
Total % 26.3% 35.5% 38.2% 100.0% 37.9% 23.9% 38.2% 100.0% 1 Following a review of the Group’s presentation of consolidated investment funds, comparative amounts have been restated from those previously reported. The review identified amounts presented within cash and cash
equivalents and other investments that are now presented as loans, equity securities and fixed maturity securities. The restatement has had no impact on the profit for the year or equity. See note B2(a) for further information. 2 Following a review of the classification of financial assets, comparative amounts have been amended from those previously reported. The effect of this change is to reclassify £3,408 million from fixed maturity securities to other
investments.
2019 Restated1,2
2018
Fair value hierarchy Fair value hierarchy
Other investments – Shareholder assets Level 1
£m Level 2
£m Level 3
£m Total
£m Level 1
£m Level 2
£m Level 3
£m Total
£m
Unit trusts and other investment vehicles 539 1 184 724 819 1 113 933 Derivative financial instruments 40 1,881 450 2,371 156 1,350 461 1,967 Deposits with credit institutions 5 — — 5 13 — — 13 Minority holdings in property management undertakings — 34 245 279 — 28 211 239 Other 12 — — 12 16 — — 16
Total 596 1,916 879 3,391 1,004 1,379 785 3,168
Total % 17.6% 56.5% 25.9% 100.0% 31.7% 43.5% 24.8% 100.0%
Less: Assets classified as held for sale (2) — — (2) (16) — — (16)
Total 594 1,916 879 3,389 988 1,379 785 3,152
Total % 17.5% 56.6% 25.9% 100.0% 31.3% 43.8% 24.9% 100.0% 1 Following a review of the Group’s presentation of consolidated investment funds, comparative amounts have been restated from those previously reported. The review identified amounts presented within cash and cash
equivalents and other investments that are now presented as loans, equity securities and fixed maturity securities. The restatement has had no impact on the profit for the year or equity. See note B2(a) for further information. 2 Following a review of the classification of financial assets, comparative amounts have been amended from those previously reported. The effect of this change is to reclassify £237 million from fixed maturity securities to other
investments.
C9 – Analysis of available for sale investments There were no impairment expenses during 2019 relating to AFS debt securities and other investments.
Total unrealised losses on AFS debt securities at 31 December 2019 were £2 million (2018: £5 million). There were no other unrealised losses on AFS investments.
C10 – Summary of exposure to peripheral European countries The Group’s direct sovereign exposures to Greece, Ireland, Portugal, Italy and Spain (net of non-controlling interests, excluding policyholder assets) is summarised below:
Participating Shareholder Total
2019 £bn
Restated1
2018 £bn
2019 bn
Restated1
2018 £bn
2019 £bn
Restated1 2018 £bn
Greece — — — — — — Ireland 0.8 0.9 0.3 0.2 1.1 1.1 Portugal 0.2 0.2 0.1 — 0.3 0.2 Italy 7.7 7.1 0.2 0.6 7.9 7.7 Spain 0.6 0.8 0.2 0.1 0.8 0.9
Total 9.3 9.0 0.8 0.9 10.1 9.9 1 Following a review of the Group’s presentation of consolidated investment funds, comparative amounts have been restated from those previously reported. The review identified amounts presented within cash and cash
equivalents and other investments that are now presented as sovereign exposures in the table above. The restatement has had no impact on the profit for the year or equity. See note B2(a) for further information.
Included in our debt securities and other financial assets are exposures to peripheral European countries. All of these assets are valued on a mark-to-market basis under IAS 39, and therefore our statement of financial position and income statement already reflect any reduction in value between the date of purchase and the balance sheet date.
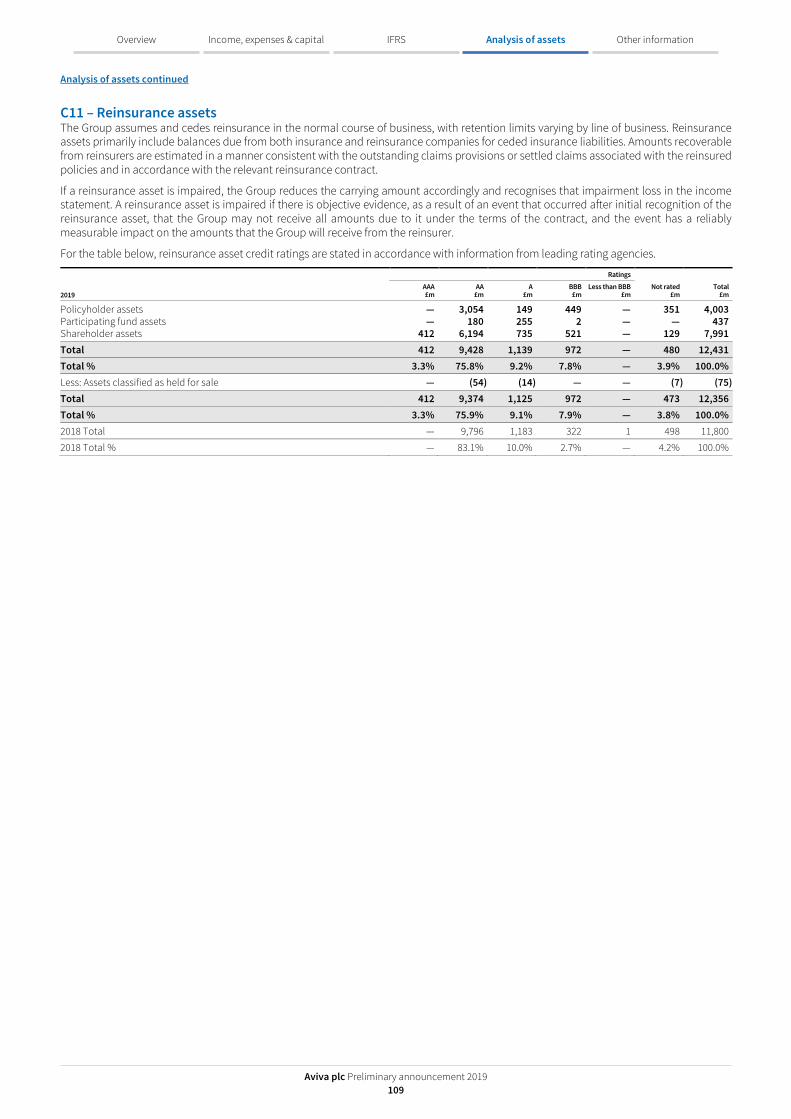
Analysis of assets continued
Aviva plc Preliminary announcement 2019 109
Overview Analysis of assets Other information
IFRS Income, expenses & capital
C11 – Reinsurance assets The Group assumes and cedes reinsurance in the normal course of business, with retention limits varying by line of business. Reinsurance assets primarily include balances due from both insurance and reinsurance companies for ceded insurance liabilities. Amounts recoverable from reinsurers are estimated in a manner consistent with the outstanding claims provisions or settled claims associated with the reinsured policies and in accordance with the relevant reinsurance contract.
If a reinsurance asset is impaired, the Group reduces the carrying amount accordingly and recognises that impairment loss in the income statement. A reinsurance asset is impaired if there is objective evidence, as a result of an event that occurred after initial recognition of the reinsurance asset, that the Group may not receive all amounts due to it under the terms of the contract, and the event has a reliably measurable impact on the amounts that the Group will receive from the reinsurer.
For the table below, reinsurance asset credit ratings are stated in accordance with information from leading rating agencies.
Ratings
2019 AAA £m
AA £m
A £m
BBB £m
Less than BBB £m
Not rated £m
Total £m
Policyholder assets — 3,054 149 449 — 351 4,003 Participating fund assets — 180 255 2 — — 437 Shareholder assets 412 6,194 735 521 — 129 7,991 Total 412 9,428 1,139 972 — 480 12,431 Total % 3.3% 75.8% 9.2% 7.8% — 3.9% 100.0% Less: Assets classified as held for sale — (54) (14) — — (7) (75) Total 412 9,374 1,125 972 — 473 12,356 Total % 3.3% 75.9% 9.1% 7.9% — 3.8% 100.0% 2018 Total — 9,796 1,183 322 1 498 11,800
2018 Total % — 83.1% 10.0% 2.7% — 4.2% 100.0%

Aviva plc Preliminary announcement 2019 110
Overview Analysis of assets Other information
IFRS Income, expenses & capital
Other information
In this section Page Alternative Performance Measures 111

Alternative Performance Measures
Aviva plc Preliminary announcement 2019 111
Overview Analysis of assets Other information
IFRS Income, expenses & capital
Alternative Performance Measures
In order to fully explain the performance of our business, we discuss and analyse our results in terms of financial measures which include a number of Alternative Performance Measures (APMs). APMs are non-GAAP measures which are used to supplement the disclosures prepared in accordance with other regulations such as International Financial Reporting Standards (IFRS) and Solvency II. We believe these measures provide useful information to enhance the understanding of our financial performance. However, APMs should be viewed as complementary to, rather than as a substitute for, the amounts determined according to other regulations.
The APMs utilised by Aviva may not be the same as those used by other insurers and may change over time.
At our capital markets day in November 2019, we announced new financial targets focussed on economic value, to measure our progress in meeting our key strategic initiatives. Consequently, we have introduced four APMs in 2019, that are based on Solvency II: • Solvency II return on equity (ROE) ‡ • Operating own funds generation • Solvency II net asset value (NAV) per share‡ • Solvency II debt leverage ratio These capital measures provide useful information as they are based on economic value which is used by the Group to assess performance and growth.
In addition, we have made certain changes to existing APMs to ensure that they remain relevant and useful for stakeholders.
The Group adjusted operating profit APM has been amended and now includes amortisation and impairment of internally generated intangible assets to provide more relevant information by better reflecting their operational nature. 2018 comparatives have been restated. For consistency with the change in Group adjusted operating profit, the combined operating ratio, operating earnings per share , operating expenses and IFRS return on equity have also been amended.
Furthermore, controllable costs is a new APM in 2019, based on operating expenses adjusted to exclude premium related costs such as premium based taxes, fees and levies that vary directly with premium volumes.
Further details on APMs derived from IFRS measures and APMs derived from Solvency II measures including changes that have been made in 2019, are provided in the following sections. A further section describes Other APMs.
‡ denotes APMs which are key performance indicators. # denotes key performance indicators used as a base to determine or modify remuneration.
APMs derived from IFRS measures A number of APMs relating to IFRS are utilised to measure and monitor the Group’s performance. Definitions and additional information, including reconciliations to the relevant amounts in the IFRS Financial Statements and, where appropriate, commentary on the material reconciling items are included within this section.
Group adjusted operating profit‡# Group adjusted operating profit is an APM that supports decision making and internal performance management of the Group’s operating segments that incorporates an expected return on investments supporting the life and non-life insurance businesses. The Group considers this measure meaningful to stakeholders as it enhances the understanding of the Group’s operating performance over time by separately identifying non-operating items. The various items excluded from Group adjusted operating profit, but included in IFRS profit before tax, are:
Investment variances, economic assumption changes and short-term fluctuation in return on investments Group adjusted operating profit for the life insurance business is based on expected investment returns on financial investments backing shareholder and policyholder funds over the reporting period, with allowance for the corresponding expected movements in liabilities. The expected rate of return is determined using consistent assumptions between operations, having regard to local economic and market forecasts of investment return and asset classification.
For fixed interest securities classified as fair value through profit or loss, the expected investment returns are based on average prospective yields for the actual assets held less an adjustment for credit risk. Where such securities are classified as available for sale the expected return comprises interest or dividend payments and amortisation of the premium or discount at purchase. The expected return on equities and properties is calculated by reference to the opening 10-year swap rate in the relevant currency plus an appropriate risk margin.
Group adjusted operating profit includes the effect of variances in experience for non-economic items, such as mortality, persistency and expenses, and the effect of changes in non-economic assumptions. Changes due to economic items, such as market value movement and interest rate changes, which give rise to variances between actual and expected investment returns, and the impact of changes in economic assumptions on liabilities, are disclosed separately outside Group adjusted operating profit.
Group adjusted operating profit for the non-life insurance business is based on expected investment returns on financial investments backing shareholder funds over the period. Expected investment returns are calculated for equities and properties by multiplying the opening market value of the investments, adjusted for sales and purchases during the year, by the long-term rate of return. This rate of return is the same as that applied for the long-term business expected returns. The long-term return for other investments (including debt securities) is the actual income receivable for the period. Actual income and long-term investment return both contain the amortisation of the discounts/premium arising on the acquisition of fixed income securities.

Alternative Performance Measures continued
Aviva plc Preliminary announcement 2019 112
Overview Analysis of assets Other information
IFRS Income, expenses & capital
Changes due to market value movements and interest rate changes, which give rise to variances between actual and expected investment returns, are disclosed separately outside Group adjusted operating profit. The impact of changes in the discount rate applied to claims provisions is also disclosed outside Group adjusted operating profit.
The exclusion of short-term investment variances from this APM reflects the long-term nature of much of our business. The Group adjusted operating profit which is used in managing the performance of our operating segments excludes the impact of economic variances, to provide a comparable measure year on year.
Impairment, amortisation and profit or loss on disposal Group adjusted operating profit also excludes impairment of goodwill, associates and joint ventures; amortisation and impairment of other intangible assets acquired in business combinations; amortisation and impairment of acquired value of in-force business; and the profit or loss on disposal and remeasurement of subsidiaries, joint ventures and associates. These items principally relate to merger and acquisition activity which we view as strategic in nature, hence they are excluded from the Group adjusted operating profit APM as this is principally used to manage the performance of our operating segments when reporting to the Group chief operating decision maker.
In 2019, the Group adjusted operating profit APM has been amended and now includes amortisation and impairment of internally generated intangible assets to provide more relevant information by better reflecting their operational nature. These assets include advisor platforms, digital distribution channels and claims and policy administration systems which are used to support operational activities. Comparative amounts have been restated resulting in a reduction in the prior year Group adjusted operating profit of £112 million. Amortisation and impairment of intangible assets acquired in business combinations will continue to be excluded from the Group adjusted operating profit as these relate to merger and acquisition activity.
In addition, integration and restructuring costs are now included in Group adjusted operating profit. There is no impact on 2018 comparative figures.
Other items These items are, in the Directors’ view, required to be separately disclosed by virtue of their nature or incidence to enable a full understanding of the Group’s financial performance. Other items at 2019 comprise: • A charge of £45 million relating to a change in the discount rate
used for estimating lump sum payments in settlement of bodily injury claims (see note A11). Consistent with the presentation of the change in the Ogden discount rate in 2016 and 2018, this is disclosed outside of Group adjusted operating profit; and
• A charge of £2 million relating to the negative goodwill which arose on the acquisition of Friends First in 2018, which is excluded from Group adjusted operating profit for consistency with the treatment of impairment of goodwill.
Other items at 2018 comprised: • A movement in the discount rate used for estimating lump sum
payments in settlement of bodily injury claims which resulted in a gain of £190 million. Consistent with the presentation of the change in the Ogden discount rate in 2016, this was disclosed outside of Group adjusted operating profit;
• A charge of £63 million relating to the UK defined benefit pension scheme as a result of the requirement to equalise members’ benefits for the effects of Guaranteed Minimum Pension. This was disclosed outside of Group adjusted operating profit as the additional liability arose as a consequence of a High Court
judgement in October 2018 in the case involving Lloyds Banking Group; and does not reflect the financial performance of the Group for the year;
• A charge of £10 million relating to goodwill payments to preference shareholders, which was announced on 30 April 2018, and associated administration costs;
• A release of a provision of £78 million relating to the sale of Aviva USA in 2013, which represents the reversal of an item previously excluded from Group adjusted operating profit; and
• A gain of £36 million relating to negative goodwill on the acquisition of Friends First, which was excluded from Group adjusted operating profit for consistency with the treatment of impairment of goodwill.
The Group adjusted operating profit APM should be viewed as complementary to IFRS measures. It is important to consider Group adjusted operating profit and profit before tax together to understand the performance of the business in the period.
The table below presents a reconciliation between our consolidated operating profit and profit before tax attributable to shareholders’ profits.
2019
£m
Restated1 2018
£m
United Kingdom – Life 1,855 1,886 United Kingdom – General Insurance 250 383 Canada 191 27 Europe 981 1,008 Asia 275 261 Aviva Investors 96 148 Other Group activities (464) (709)
Group adjusted operating profit before tax attributable to shareholders’ profit 3,184 3,004
Adjusted for the following: Investment return variances and economic assumption
changes on long-term business 654 (197) Short-term fluctuation in return on investments on non
long-term business 167 (476) Economic assumption changes on general insurance
and health business (54) 1 Impairment of goodwill, associates and joint ventures
and other amounts expensed (15) (13) Amortisation and impairment of intangibles acquired in
business combinations (87) (97) Amortisation and impairment of acquired value of in-
force business (406) (426) (Loss)/profit on the disposal and re-measurement of
subsidiaries, joint ventures and associates (22) 102 Other (47) 231
Adjusting items before tax 190 (875)
Profit before tax attributable to shareholders’ profits 3,374 2,129 1 During 2019 the Group adjusted operating profit APM has been revised, and now includes the amortisation
and impairment of internally generated intangible assets to better reflect the operational nature of these assets (see note B2 (b)). Group adjusted operating profit continues to exclude amortisation and impairment of intangible assets acquired in business combinations. Comparative amounts have been restated resulting in a reduction in the prior period Group adjusted operating profit of £112 million. There is no impact on profit before tax.
Combined operating ratio (COR)‡ A financial measure of general insurance underwriting profitability calculated as total underwriting costs in our insurance entities expressed as a percentage of net earned premiums. A COR below 100% indicates profitable underwriting.
In 2018 and 2019, the COR does not include the impact of any changes in the discount rate used for estimating lump sum payments in settlement of bodily injury claims.

Alternative Performance Measures continued
Aviva plc Preliminary announcement 2019 113
Overview Analysis of assets Other information
IFRS Income, expenses & capital
In 2019, following the change in the definition of Group adjusted operating profit, the COR has been amended to include the amortisation and impairment of internally generated intangible assets to better reflect their operational nature. Comparative amounts have been restated resulting in an increase in the prior year underwriting costs of £53 million and an increase in COR of 0.6%. Amortisation and impairment of intangible assets acquired in business combinations will continue to be excluded from the COR as these relate to merger and acquisition activity.
The Group COR is shown below.
2019
£m
Restated1 2018
£m
Incurred claims – GI & Health (as per note B6)2 (6,620) (6,400) Adjusted for the following:
Incurred claims – Health 651 633 Change in discount rate assumptions 54 — Impact of change in the discount rate used in
settlement of bodily injury claims 45 (190) Total Incurred claims (included in COR)3 (5,870) (5,957) Commission and expenses – GI & Health
(as per note B6)4 (3,321) (3,188) Adjusted for the following:
Amortisation and impairment of intangibles acquired in business combinations 19 31
Foreign exchange gains/losses (45) 7 Commission income 20 19 Other 5 4 Commission and Expenses –
Health & Other Non GI 300 309
Total commission and expenses (included in COR)5 (3,022) (2,818)
Total underwriting costs (8,892) (8,775)
Net earned premiums – GI & Health (as per note B6) 10,015 9,887
Adjusted for: Net earned premiums – Health (895) (857)
Net earned premiums (included in COR)6 9,120 9,030
Combined operating ratio 97.5% 97.2% 1 Following the change in the definition of Group adjusted operating profit, COR now includes the amortisation
and impairment of internally generated intangible assets to better reflect the operational nature of these assets. Comparative amounts have been restated resulting in an increase in the prior period underwriting costs of £(53) million and an increase in COR of 0.6%.
2 Corresponds to the sum of claims and benefits paid, net of recoveries from reinsurers and the change in insurance liabilities, net of reinsurance per note B6.
3 Includes £(6) million (2018: £1 million) relating to incurred claims for Aviva Re. 4 Commission and expenses consists of fee and commission expense and other operating expenses included
within the general insurance & health segmental income statement (per note B6) adjusted to an earned basis and to remove the health business.
5 Includes £(1) million (2018: £3 million) relating to commission and expenses for Aviva Re. 6 Includes £nil (2018: £(5) million) relating to net earned premiums for Aviva Re.
Claims ratio A financial measure of the performance of our general insurance business which is calculated as incurred claims expressed as a percentage of net earned premiums, which can be derived from the COR table above.
Commission and expense ratio A financial measure of the performance of our general insurance business which is derived from the sum of earned commissions and expenses expressed as a percentage of net earned premiums from the COR table above.
Operating earnings per share (EPS)‡# Operating EPS is calculated based on the Group adjusted operating profit attributable to ordinary shareholders net of tax, deducting non-controlling interests, preference dividends and the direct capital instrument (DCI) and tier 1 note coupons divided by the weighted average number of ordinary shares in issue, after deducting treasury shares. Operating EPS is considered meaningful to stakeholders because it enhances the understanding of the Group’s operating performance over time by adjusting for the effects of non-operating items.
Following the change in the definition of the Group adjusted operating profit APM in 2019, operating EPS has been amended and the 2018 comparative amount has been restated resulting in a reduction in the prior year from 58.4 pence to 56.2 pence.
A reconciliation between operating EPS and basic EPS can be found in note B8.
Controllable costs‡ and operating expenses Controllable costs are the controllable operational overheads associated with maintaining our businesses. Controllable costs are calculated as operating expenses, less premium based taxes, fees and levies that vary directly with premiums. These costs are by their nature a direct cost incurred as a result of generating premium income, and therefore not a controllable operational overhead. Operating expenses continues to be a useful measure alongside controllable costs.
Following the change in the definition of Group adjusted operating profit, operating expenses has been amended to include the amortisation and impairment of internally generated intangible assets to better reflect their operational nature. Comparative amounts have been restated resulting in an increase in prior year operating expenses of £112 million. Amortisation and impairment of intangible assets acquired in business combinations will continue to be excluded from operating expenses as these relate to merger and acquisition activity.
A reconciliation of other expenses in the IFRS consolidated income statement to operating expenses (restated) and controllable costs is set out below:
2019
£m 2018
£m
Other expenses (IFRS income statement) 3,329 3,843 Less: impairment of goodwill, associates and joint
ventures and other amounts expensed (15) (13) Less: amortisation and impairment of intangibles acquired
in business combinations1 (87) (97) Less: amortisation and impairment of acquired value of in-
force business (406) (426) Less: foreign exchange gains/(losses) 109 (28) Add: other acquisition costs 1,001 954 Add: claims handling costs 339 336 Less: other costs (151) (431)
Operating expenses1 4,119 4,138
Less: premium based income taxes, fees and levies (180) (170)
Controllable costs 3,939 3,968 1 Following the change in the definition of Group adjusted operating profit, operating expenses now include
the amortisation and impairment of internally generated intangible assets to better reflect the operational nature of these assets. Comparative amounts have been restated resulting in an increase in the prior period operating expenses of £112 million.
Operating expenses exclude impairment of goodwill, associates and joint ventures; amortisation and impairment of other intangible assets acquired in business combinations; amortisation and impairment of acquired value of in-force business; and the profit or loss on disposal and remeasurement of subsidiaries, joint ventures and associates. These items relate to merger and acquisition activity which we view as strategic in nature, hence they are excluded from operating expenses as this is principally used to manage the performance of our operating segments.
Operating expenses include indirect acquisition costs, such as underwriting overheads, and claims handling costs. These are considered to be controllable by the operating segments and are therefore also included in controllable costs.

Alternative Performance Measures continued
Aviva plc Preliminary announcement 2019 114
Overview Analysis of assets Other information
IFRS Income, expenses & capital
Operating expenses exclude other amounts that, in management’s view, are not representative of underlying day-to-day expenses involved in running the business, and that would distort the year on year operating expenses trend, including historical product governance costs and GI instalment income. In 2019 other costs includes an additional £175 million product governance provision in our UK Life business relating to past communications to a specific sub-set of pension policyholders that may not have adequately informed them of switching options into with-profits funds that were available to them.
Other costs in 2018 included movements in provisions set aside in respect of ongoing regulatory compliance as well as an increase of £175 million product governance provision relating to a historical issue over pension arrangement sales by Friends Provident (of which over 90% of cases related to pre-2002).
IFRS Return on Equity (RoE) The IFRS RoE calculation is based on Group adjusted operating profit after tax attributable to ordinary shareholders expressed as a percentage of weighted average ordinary shareholders’ equity (excluding non-controlling interests, preference share capital and direct capital instrument and tier 1 notes) as shown in note A13.
Following the change in the definition of the Group adjusted operating profit APM in 2019, IFRS RoE has been amended and the 2018 comparative amount has been restated resulting in a reduction in the prior year from 13.3% to 12.8%.
IFRS net asset value (NAV) per share IFRS NAV per share is calculated as the equity attributable to shareholders of Aviva plc, less preference share capital (both within the consolidated statement of financial position), divided by the actual number of shares in issue at the balance sheet date. IFRS NAV per share monitors the value generated by the Company in terms of the equity shareholders’ face value per share investment.
Assets Under Management (AUM) and Assets Under Administration (AUA) AUM represent all assets managed or administered by or on behalf of the Group, including those assets managed by Aviva Investors and by third parties. AUM include managed assets that are reported within the Group’s statement of financial position and those assets belonging to external clients outside the Aviva Group which are therefore not included in the Group’s statement of financial position.
Consistent with previous years, Aviva Investors AUA comprises AUM plus £36 billion (2018: £29 billion) of assets managed by third parties on platforms administered by Aviva Investors.
Both AUM and AUA are monitored as they reflect the potential earnings arising from investment returns and fee and commission income and measure the size and scale of the Group’s fund management business.
A reconciliation of amounts appearing in the Group’s statement of financial position to AUM is shown below:
2019 £bn
Restated1 2018 £bn
Assets managed on behalf of Group companies Assets included in statement of financial position2 Financial investments 351 327 Investment properties 11 11 Loans 39 36 Cash and cash equivalents 20 17 Other 1 1
422 392
Less: third party funds included above (17) (17)
405 375
Assets managed on behalf of third parties4 Aviva Investors 67 64 UK Platform5 29 23 Other 9 9
105 96
Total AUM3 510 471 1 Following a review of the Group’s presentation of consolidated investment funds, comparative amounts have
been restated from those previously reported. The restatement has had no impact on the profit for the period or equity. See note B2(a) for further information.
2 Includes assets classified as held for sale. 3 Includes AUM of £346 billion (2018: £331 billion) managed by Aviva Investors. 4 AUM managed on behalf of third parties cannot be directly reconciled to the financial statements. 5 UK Platform relates to the assets under management in the UK long-term savings business.
Net fund flows Net fund flows is one of the measures of growth used by management and is a component of the movement in the life and platform business managed assets (excluding UK with-profits) during the period. It is the difference between the inflows (being IFRS net written premiums plus deposits received under investment contracts) and outflows (being IFRS net paid claims plus redemptions and surrenders under investment contracts). It excludes market and other movements.
APMs derived from Solvency II measures The Solvency II regime requires insurers to hold own funds in excess of the Solvency Capital Requirement (SCR). Own funds are available capital resources determined under Solvency II. This includes the excess of assets over liabilities in the Solvency II balance sheet, calculated on best estimate, market consistent assumptions and include transitional measures on technical provisions (TMTP), subordinated liabilities that qualify as capital under Solvency II, and off-balance sheet own funds.
The SCR is calculated at Group level using a risk-based capital model which is calibrated to reflect the cost of mitigating the risk of insolvency to a 99.5% confidence level over a one-year time horizon – equivalent to a 1 in 200 year event – against financial and non-financial shocks. As a number of subsidiaries utilise the standard formula rather than a risk-based capital model to assess capital requirements, the overall Group SCR is calculated using a partial internal model, and it is shown after the impact of diversification benefit.

Alternative Performance Measures continued
Aviva plc Preliminary announcement 2019 115
Overview Analysis of assets Other information
IFRS Income, expenses & capital
The reconciliation from total Group equity on an IFRS basis to Solvency II own funds is presented below.
2019
£m 2018
£m
Total Group equity on an IFRS basis 18,685 18,455 Elimination of goodwill and other intangible
assets1 (8,424) (7,828) Insurance assets and liabilities valuation
differences (net of transitional deductions)2 19,564 19,293 Inclusion of risk margin (net of transitional
deductions) (3,122) (3,256) Net deferred tax on valuation differences3 (1,220) (1,149) Revaluation of subordinated liabilities 4 (716) (649) Other accounting differences4 (99) (286) Estimated Solvency II net assets (gross of
non-controlling interests) 24,668 24,580
Difference between Solvency II net assets and own funds5 3,679 2,987
Estimated Solvency II regulatory own funds6 28,347 27,567 1 Includes £1,855 million (2018: £1,872 million) of goodwill and £6,569 million (2018: £5,956 million) of other
intangible assets comprising acquired value of in-force business of £2,479 million (2018: £2,916 million), deferred acquisition costs (net of deferred income) of £3,221 million (2018: £2,858 million) and other intangibles of £869 million (2018: £182 million).
2 Includes valuation adjustments to reflect insurance assets and liabilities valued on a best estimate basis using market-implied assumptions.
3 Net deferred tax includes the tax effect of all other reconciling items in the table above which are shown gross of tax.
4. Includes valuation adjustments and the impact of the difference between consolidation methodologies under Solvency II and IFRS.
5 Regulatory adjustments to bridge from Solvency II net assets to own funds include recognition of subordinated debt capital, non-controlling interests and adjustments for ring-fenced funds restrictions.
6 Regulation was introduced in France that allows French insurers to place the Provision pour Participation aux Excedents (PPE) into Solvency II own funds. The PPE has been included in the France local regulatory own funds in 2019 but it is not included in the Group regulatory own funds.
A number of APMs relating to Solvency II are utilised to measure and monitor the Group’s performance, growth and financial strength: • Solvency II shareholder cover ratio‡ • Value of new business on an adjusted Solvency II basis (VNB)‡ • Operating Capital Generation (OCG) ‡# • Operating own funds generation • Solvency II return on equity (ROE)‡ • Solvency II net asset value (NAV) per share‡ • Solvency II debt leverage ratio
Solvency II shareholder cover ratio‡ The estimated Solvency II shareholder cover ratio, which is derived from own funds divided by the SCR using a ‘shareholder view’, is one of the indicators of the Group’s balance sheet strength. The shareholder view is considered by management to be more representative of the shareholders’ risk-exposure and the Group’s ability to cover the SCR with eligible own funds and aligns with management’s approach to dynamically manage its capital position. In arriving at the shareholder position, the following adjustments are typically made to the regulatory Solvency II position: • The contribution to the Group’s SCR and own funds of the most
material fully ring fenced with-profits funds and staff pension schemes in surplus are excluded. These exclusions have no impact on Solvency II surplus as these funds are self-supporting on a Solvency II capital basis with any surplus capital above SCR not recognised.
• A notional reset of the transitional measure on technical provisions (TMTP), calculated using the same method as used for formal TMTP resets. This presentation avoids step changes to the Solvency II position that arise only when the formal TMTP reset points are triggered. The 31 December 2019 position is based on a formal reset of the TMTP, in line with the requirement to reset the TMTP at least every two years and hence no adjustment is required. The TMTP is amortised on a straight-line basis over 16 years from 1 January 2016 in line with the Solvency II rules.
• Pro forma adjustments are made if the Solvency II shareholder
cover ratio does not fully reflect the effect of transactions or capital actions that are known as at each reporting date. Such adjustments may be required in respect of planned acquisitions and disposals, group reorganisations and adjustments to the Solvency II valuation basis arising from changes to the underlying regulations or updated interpretations provided by EIOPA. These adjustments are made in order to show a more representative view of the Group’s solvency position.
A reconciliation of the Solvency II regulatory surplus to the Solvency II shareholder surplus is provided below:
2019
Own funds 2019
£m
SCR 2019
£m
Surplus 2019
£m
Estimated Solvency II regulatory surplus 28,347 (15,517) 12,830 Adjustments for: Fully ring-fenced with-profit funds (2,501) 2,501 — Staff pension schemes in surplus (1,181) 1,181 — Notional reset of TMTP — — — Pro forma adjustments1 (117) (75) (192) Estimated Solvency II shareholder surplus 24,548 (11,910) 12,638 1 The 31 December 2019 Solvency II position includes three pro forma adjustments that relate to the disposal
of FPI (£nil impact on surplus), the disposal of Hong Kong (£nil impact on surplus) and the potential impact of an expected change to Solvency II regulations on the treatment of equity release mortgages (£0.2 billion decrease in surplus as a result of an increase in SCR).
2018
Own funds 2018
£m
SCR 2018
£m
Surplus 2018
£m
Estimated Solvency II regulatory surplus 27,567 (15,339) 12,228 Adjustments for: Fully ring-fenced with-profit funds (2,634) 2,634 —
Staff pension schemes in surplus (1,142) 1,142 —
Notional reset of TMTP (127) — (127) Pro forma adjustments1 (113) (6) (119)
Estimated Solvency II shareholder surplus 23,551 (11,569) 11,982
1 The 31 December 2018 Solvency II position includes the pro forma impact of the disposals of FPI (£0.1 billion increase in surplus) and the potential impact of an expected change to Solvency II regulations on the treatment of equity release mortgages (£0.2 billion reduction in surplus as a result of an increase in SCR).
A summary of the shareholder view of the Group’s Solvency II position is shown in the table below:
2019 £m
2018 £m
Own Funds 24,548 23,551 Solvency Capital Requirement (11,910) (11,569)
Estimated Solvency II Shareholder Surplus at 31 December
12,638 11,982
Estimated Shareholder Cover Ratio 206% 204%

Alternative Performance Measures continued
Aviva plc Preliminary announcement 2019 116
Overview Analysis of assets Other information
IFRS Income, expenses & capital
Value of new business on an adjusted Solvency II basis (VNB)‡ VNB measures the additional value to shareholders created through the writing of new life business in the period. It reflects Solvency II assumptions and allowance for risk, and is defined as the increase in Solvency II own funds resulting from life business written in the period, including the impact of interactions between in-force and new business, adjusted to: • remove the impact of the contract boundary restrictions under
Solvency II; • include businesses which are not within the scope of Solvency II
own funds (e.g. UK and Asia Healthcare, Retail fund management and UK equity release); and
• reflect a gross of tax and non-controlling interests basis, include the impact of ‘look through profits’ in service companies (where not included in Solvency II) and reflect the difference between locally applicable capital requirements for the smaller Asian markets (Indonesia, Vietnam, Hong Kong) and the value of new business on an adjusted Solvency II basis.
A reconciliation between VNB and the Solvency II own funds impact of new business is provided below:
2019 UK £m
Europe £m
Asia & Other
£m Group
£m
VNB (gross of tax and non-controlling interests) 592 414 218 1,224
Solvency II contract boundary restrictions – new business (71) (148) (45) (264)
Solvency II contract boundary restrictions – increments / renewals on in-force business 98 73 25 196
Businesses which are not in the scope of Solvency II own funds (138) (1) (19) (158)
Tax and Other1 (100) (171) (68) (339) Solvency II own funds impact of new
business (net of tax and non-controlling interests) 381 167 111 659
20181 Restated UK £m
Europe £m
Asia & Other £m
Group £m
VNB (gross of tax and non-controlling interests) 481 517 204 1,202
Solvency II contract boundary restrictions – new business (51) (131) (31) (213)
Solvency II contract boundary restrictions – increments / renewals on in-force business 126 83 21 230
Businesses which are not in the scope of Solvency II own funds (117) (4) (36) (157)
Tax and Other1 (92) (212) (69) (373)
Solvency II own funds impact of new business (net of tax and non-controlling interests) 347 253 89 689
1 Other includes the impact of ‘look through profits’ in service companies (where not included in Solvency II) of £(78) million (2018: £(63) million), the reduction in value when moving to a net of non-controlling interests basis of £(57) million (2018: £(81) million) and the difference between locally applicable capital requirements for the smaller Asian markets (Indonesia, Vietnam, Hong Kong) and the value of new business on an adjusted Solvency II basis of £(37) million (2018 restated: £(46) million).
The methodology underlying the calculation of VNB remains unchanged from the prior year. For 2018, new business written contributed to the calculation of the UK Life’s transitional measures (in line with the clarification issued by the PRA in 2017), but this is no longer applicable to the Group in 2019.
VNB is calculated using economic assumptions as at the point of sale, taken as those appropriate to the start of each quarter. For contracts that are repriced more frequently, weekly or monthly economic assumptions have been used. The economic assumptions follow Solvency II rules for risk-free rates, volatility adjustment and matching adjustment. The operating assumptions are consistent with the Solvency II balance sheet, when these assumptions are updated, the year-to-date VNB will capture the impact of the assumption change on all business sold that year.
Matching Adjustment (MA) A MA is applied to certain obligations based on the expected allocation of assets backing new business at each year-end date. This allocation may be different to the MA applied at the portfolio level. Aviva applies a MA to certain obligations in UK Life, using methodology which is set out in the Solvency and Financial Condition Report.
The matching adjustment used for 2019 UK new business (where applicable) was 95 bps (2018: 105 bps).
New business margin New business margin is calculated as value of new business on an adjusted Solvency II basis (VNB) divided by the present value of new business premiums (PVNBP) and expressed as a percentage.
Present value of new business premiums (PVNBP) PVNBP measures sales in the Group’s life insurance business. PVNBP is derived from the present value of new regular premiums expected to be received over the term of the new contracts plus 100% of single premiums from new business written in the financial period and is expressed at the point of sale. The discounted value of regular premiums is calculated using the same methodology as for VNB. PVNBP also includes any changes to existing contracts which were not anticipated at the outset of the contract that generate additional shareholder risk and associated premium income of the nature of a new policy.
The table below presents a reconciliation of sales to IFRS net written premiums:
2019
£m 2018
£m
Present value of new business premiums 45,665 40,763 Investment sales 4,621 4,799 General insurance and health net written premiums 10,224 9,968 Long-term health and collectives business (3,563) (3,840) Total sales 56,947 51,690 Effect of capitalisation factor on regular premium long-
term business1 (15,294) (12,726) JVs and associates2 (286) (257) Annualisation impact of regular premium long-term
business3 (327) (247) Deposits4 (10,917) (10,329) Investment sales5 (4,621) (4,799) IFRS gross written premiums from existing long-term
business6 5,057 4,776 Long-term insurance and savings business premiums
ceded to reinsurers (2,879) (1,775)
Total IFRS net written premiums 27,680 26,333
Analysed as: Long-term insurance and savings net written premiums 17,456 16,365 General insurance and health net written premiums 10,224 9,968 27,680 26,333 1 Discounted value of regular premiums expected to be received over the term of the new contract, adjusted
for expected levels of persistency. 2 Total long-term new business sales include our share of sales from joint ventures and associates. Under IFRS,
premiums from these sales are excluded. 3 The impact of annualisation is removed in order to reconcile the non-GAAP new business sales to IFRS
premiums. 4 Under IFRS, only the margin earned from non-participating investment contracts is recognised in the IFRS
income statement. 5 Investment sales included in total sales represent the cash inflows received from customers investing in
mutual fund type products such as unit trusts and OEICs. 6 The non-GAAP measure of sales focuses on new business written in the period under review while the IFRS
income statement includes premiums received from all business, both new and existing.

Alternative Performance Measures
Aviva plc Preliminary announcement 2019 117
Overview Analysis of assets Other information
IFRS Income, expenses & capital
Operating capital generation (OCG)‡# OCG measures the amount of Solvency II capital the Group generates from operating activities and incorporates an expected return on investments supporting the life and non-life insurance businesses. The Group considers this measure meaningful to stakeholders as it enhances the understanding of the Group’s operating performance over time by separately identifying non-operating items. The calculation of OCG is consistent with previous periods.
The expected investment returns assumed within OCG are consistent with the returns used for Group adjusted operating profit.
OCG includes the effect of variances in experience for non-economic items, such as mortality, persistency and expenses, the effect of changes in non-economic assumptions (for example, longevity), model changes that are non-economic in nature and the impact of capital actions, for example, strategic changes in asset mix including changes in hedging exposure. Consistent with the Group adjusted operating profit APM, OCG is determined on start of period economic assumptions and therefore excludes economic variances and economic assumption changes.
An analysis of the components of OCG is presented below, including an analysis of Solvency II operating own funds generation which is the own funds component of OCG (see the section below):
2019 £m
2018 £m
Solvency II own funds impact of new business (net of tax and non-controlling interests)
659 689
Operating own funds generation from Life existing business
507 835
Operating own funds generation from non-life 431 299 Other own funds generation1 944 497 Group debt costs (284) (298)
Solvency II operating own funds generation 2,257 2,022
Solvency II operating SCR impact 2 1,176
Solvency II OCG 2,259 3,198 1 Other includes the impact of capital actions and non-economic assumption changes.
OCG is a key component of the movement in Solvency II shareholder surplus. The tables below provide an analysis of the change in Solvency II shareholder surplus.
2019 Shareholder view
Own funds 2019
£m
SCR 2019
£m
Surplus 2019
£m
Group Solvency II shareholder surplus at 1 January
23,551 (11,569) 11,982
Operating capital generation 2,257 2 2,259 Non-operating capital generation 178 (362) (184) Dividends1 (1,222) — (1,222) Share buy-back — — — Hybrid debt repayments (210) — (210) Acquired/divested business (6) 19 13 Estimated Solvency II shareholder surplus at
31 December 24,548 (11,910) 12,638
1 Dividends includes £17 million (2018: £17 million) of Aviva plc preference dividends and £21 million (2018: £21 million) of General Accident plc preference dividends.
2018 Shareholder view
Own funds 2018
£m
SCR 2018
£m
Surplus 2018
£m
Group Solvency II shareholder surplus at 1 January
24,737 (12,506) 12,231
Operating capital generation 2,022 1,176 3,198 Non-operating capital generation (777) (231) (1,008) Dividends1 (1,166) — (1,166) Share buy-back (600) — (600) Hybrid debt repayments (875) — (875) Acquired/divested business 210 (8) 202
Estimated Solvency II shareholder surplus at 31 December
23,551 (11,569) 11,982
1 Dividends includes £17 million (2018: £17 million) of Aviva plc preference dividends and £21 million (2018: £21 million) of General Accident plc preference dividends.
Solvency II future surplus emergence Solvency II future surplus emergence is a projection of the capital generation from existing long-term in-force life business. The projection is a static analysis as at a point in time and hence it does not include the potential impact of future new business or the potential impact of active management of the business (for example, active management of market, demographic and expense risk through investment, hedging, risk transfer, operational risk and expense management), which may affect the actual amount of OCG earned from existing business in future periods.
For business subject to short contract boundaries under Solvency II, allowance has been made for the impact of renewal premiums as and when they are expected to occur.
The projected surplus, which is primarily expected to arise from the release of risk margin (including transitional measures) and solvency capital requirement as the business runs off over time, is expected to emerge through OCG in future years. The cash flows are real-world cash flows, i.e. they are based on best estimate non-economic assumptions used in the Solvency II valuation and real-world investment returns rather than risk-free. The expected investment returns are consistent with the returns used in IFRS.
Operating own funds generation Operating own funds generation measures the amount of Solvency II own funds generated from operating activities. Operating own funds generation is the own funds component of OCG and follows the methodology and assumptions outlined in OCG.
Solvency II Return on Equity (RoE)‡ Solvency II ROE is calculated as: • Operating own funds generation less preference dividends, direct
capital instrument (DCI) and tier 1 note coupons divided by; • Opening value of unrestricted tier 1 shareholder own funds Unrestricted tier 1 shareholder own funds represents the highest quality tier of capital and includes instruments with principal loss absorbing features such as permanence, subordination, undated, absence of redemption incentives, mandatory costs and encumbrances. The tables below provide a summary of the Group’s regulatory Solvency II own funds by tier and a reconciliation between unrestricted tier 1 regulatory own funds and unrestricted tier 1 shareholder own funds:
Regulatory view 2019
£m 2018
£m
Unrestricted regulatory tier 1 own funds 20,377 19,312 Restricted Tier 1 1,839 2,096 Tier 2 5,794 5,811 Tier 31 337 348
Estimated Solvency II regulatory own funds2 28,347 27,567 1 Tier 3 regulatory own funds at 31 December 2019 consists of £259 million subordinated debt
(2018: £253 million) plus £78 million net deferred tax assets (2018: £95 million). 2 Regulation was introduced in France that allows French insurers to place the Provision pour Participation aux
Excedents (PPE) into Solvency II own funds. The PPE has been included in the France local regulatory own funds in 2019 but it is not included in the Group regulatory own funds.
Shareholder view 2019
£m 2018
£m
Unrestricted regulatory tier 1 own funds 20,377 19,312 Adjustments for: Fully ring-fenced with-profit funds (2,501) (2,634) Staff pension schemes in surplus (1,181) (1,142) Notional reset of TMTP — (127) Pro forma adjustments1 (117) (113)
Unrestricted shareholder tier 1 own funds 16,579 15,296 1 The 31 December 2019 Solvency II position includes two pro forma adjustments that relate to the disposal
of FPI (£0.1 billion reduction in own funds) and the disposal of Hong Kong (£nil impact on own funds). The 31 December 2018 Solvency II position includes the pro forma impact of the disposal of FPI (£0.1 billion reduction in own funds).
Alternative Performance Measures continued
Aviva plc Preliminary announcement 2019 116
Overview Analysis of assets Other information
IFRS Income, expenses & capital
Value of new business on an adjusted Solvency II basis (VNB)‡ VNB measures the additional value to shareholders created through the writing of new life business in the period. It reflects Solvency II assumptions and allowance for risk, and is defined as the increase in Solvency II own funds resulting from life business written in the period, including the impact of interactions between in-force and new business, adjusted to: • remove the impact of the contract boundary restrictions under
Solvency II; • include businesses which are not within the scope of Solvency II
own funds (e.g. UK and Asia Healthcare, Retail fund management and UK equity release); and
• reflect a gross of tax and non-controlling interests basis, include the impact of ‘look through profits’ in service companies (where not included in Solvency II) and reflect the difference between locally applicable capital requirements for the smaller Asian markets (Indonesia, Vietnam, Hong Kong) and the value of new business on an adjusted Solvency II basis.
A reconciliation between VNB and the Solvency II own funds impact of new business is provided below:
2019 UK £m
Europe £m
Asia & Other
£m Group
£m
VNB (gross of tax and non-controlling interests) 592 414 218 1,224
Solvency II contract boundary restrictions – new business (71) (148) (45) (264)
Solvency II contract boundary restrictions – increments / renewals on in-force business 98 73 25 196
Businesses which are not in the scope of Solvency II own funds (138) (1) (19) (158)
Tax and Other1 (100) (171) (68) (339) Solvency II own funds impact of new
business (net of tax and non-controlling interests) 381 167 111 659
20181 Restated UK £m
Europe £m
Asia & Other £m
Group £m
VNB (gross of tax and non-controlling interests) 481 517 204 1,202
Solvency II contract boundary restrictions – new business (51) (131) (31) (213)
Solvency II contract boundary restrictions – increments / renewals on in-force business 126 83 21 230
Businesses which are not in the scope of Solvency II own funds (117) (4) (36) (157)
Tax and Other1 (92) (212) (69) (373)
Solvency II own funds impact of new business (net of tax and non-controlling interests) 347 253 89 689
1 Other includes the impact of ‘look through profits’ in service companies (where not included in Solvency II) of £(78) million (2018: £(63) million), the reduction in value when moving to a net of non-controlling interests basis of £(57) million (2018: £(81) million) and the difference between locally applicable capital requirements for the smaller Asian markets (Indonesia, Vietnam, Hong Kong) and the value of new business on an adjusted Solvency II basis of £(37) million (2018 restated: £(46) million).
The methodology underlying the calculation of VNB remains unchanged from the prior year. For 2018, new business written contributed to the calculation of the UK Life’s transitional measures (in line with the clarification issued by the PRA in 2017), but this is no longer applicable to the Group in 2019.
VNB is calculated using economic assumptions as at the point of sale, taken as those appropriate to the start of each quarter. For contracts that are repriced more frequently, weekly or monthly economic assumptions have been used. The economic assumptions follow Solvency II rules for risk-free rates, volatility adjustment and matching adjustment. The operating assumptions are consistent with the Solvency II balance sheet, when these assumptions are updated, the year-to-date VNB will capture the impact of the assumption change on all business sold that year.
Matching Adjustment (MA) A MA is applied to certain obligations based on the expected allocation of assets backing new business at each year-end date. This allocation may be different to the MA applied at the portfolio level. Aviva applies a MA to certain obligations in UK Life, using methodology which is set out in the Solvency and Financial Condition Report.
The matching adjustment used for 2019 UK new business (where applicable) was 95 bps (2018: 105 bps).
New business margin New business margin is calculated as value of new business on an adjusted Solvency II basis (VNB) divided by the present value of new business premiums (PVNBP) and expressed as a percentage.
Present value of new business premiums (PVNBP) PVNBP measures sales in the Group’s life insurance business. PVNBP is derived from the present value of new regular premiums expected to be received over the term of the new contracts plus 100% of single premiums from new business written in the financial period and is expressed at the point of sale. The discounted value of regular premiums is calculated using the same methodology as for VNB. PVNBP also includes any changes to existing contracts which were not anticipated at the outset of the contract that generate additional shareholder risk and associated premium income of the nature of a new policy.
The table below presents a reconciliation of sales to IFRS net written premiums:
2019
£m 2018
£m
Present value of new business premiums 45,665 40,763 Investment sales 4,621 4,799 General insurance and health net written premiums 10,224 9,968 Long-term health and collectives business (3,563) (3,840) Total sales 56,947 51,690 Effect of capitalisation factor on regular premium long-
term business1 (15,294) (12,726) JVs and associates2 (286) (257) Annualisation impact of regular premium long-term
business3 (327) (247) Deposits4 (10,917) (10,329) Investment sales5 (4,621) (4,799) IFRS gross written premiums from existing long-term
business6 5,057 4,776 Long-term insurance and savings business premiums
ceded to reinsurers (2,879) (1,775)
Total IFRS net written premiums 27,680 26,333
Analysed as: Long-term insurance and savings net written premiums 17,456 16,365 General insurance and health net written premiums 10,224 9,968 27,680 26,333 1 Discounted value of regular premiums expected to be received over the term of the new contract, adjusted
for expected levels of persistency. 2 Total long-term new business sales include our share of sales from joint ventures and associates. Under IFRS,
premiums from these sales are excluded. 3 The impact of annualisation is removed in order to reconcile the non-GAAP new business sales to IFRS
premiums. 4 Under IFRS, only the margin earned from non-participating investment contracts is recognised in the IFRS
income statement. 5 Investment sales included in total sales represent the cash inflows received from customers investing in
mutual fund type products such as unit trusts and OEICs. 6 The non-GAAP measure of sales focuses on new business written in the period under review while the IFRS
income statement includes premiums received from all business, both new and existing.

Alternative Performance Measures continued
Aviva plc Preliminary announcement 2019 118
Overview Analysis of assets Other information
IFRS Income, expenses & capital
Solvency II RoE provides useful information as it is used as an economic value measure by the Group to assess growth and performance.
The Solvency II return on equity is shown below:
2019
£m 2018
£m
Solvency II operating own funds generation 2,257 2,022 Less preference share dividends (38) (38) Less DCI and tier 1 note coupons (34) (36) 2,185 1,948 Opening Unrestricted tier 1 shareholder Solvency II
own funds 15,296 15,550 Solvency II Return on Equity 14.3% 12.5%
Solvency II return on capital (unlevered) Solvency II return on capital (unlevered) is calculated as operating own funds generation excluding interest costs divided by opening shareholder Solvency II own funds. It is used as an economic value measure by business divisions to assess growth and performance.
Solvency II net asset value (NAV) per share‡ Solvency II NAV per share is used to monitor the value generated by the Group in terms of the equity shareholders’ face value per share investment. This is calculated as the unrestricted tier 1 Solvency II shareholder own funds, divided by the actual number of shares in issue as at the balance sheet date. Consistent with Solvency II ROE, it is an economic value measure used by the Group to assess growth.
The Solvency II NAV per share is shown below:
2019 2018
Unrestricted tier 1 shareholder Solvency II own funds (£m) 16,579 15,296 Number of shares in issue at 31 December (in millions) 3,921 3,902
Solvency II NAV per share 423p 392p
Solvency II debt leverage ratio Solvency II debt leverage ratio is calculated as Solvency II debt expressed as a percentage of Solvency II regulatory own funds plus senior debt and commercial paper. Where Solvency II debt includes subordinated debt, preference share capital and direct capital instrument and tier 1 notes. The Solvency II debt leverage ratio provides a measure of the Group’s financial strength.
2019
£m 2018
£m
Solvency II regulatory debt 7,892 8,160
Senior notes 1,052 1,113
Commercial paper 238 251
Total Solvency II debt 9,182 9,525
Estimated Solvency II regulatory own funds, senior debt and commercial paper 29,637 28,931
Solvency II debt leverage 31% 33%
A reconciliation from IFRS subordinated debt to Solvency II regulatory debt is provided below:
2019
£m 2018
£m
IFRS borrowings 9,067 9,420 Less: borrowings not classified as Solvency II regulatory debt
Senior notes (1,052) (1,113) Commercial paper (238) (251) Operational borrowings (1,571) (1,721)
Less: Amounts held by Group Companies — 5 IFRS subordinated debt 6,206 6,340 Revaluation of subordinated liabilities 716 649 Other movements 20 (10)
Solvency II subordinated debt 6,942 6,979 Preference share capital, deferred capital instrument
and tier 1 notes 950 1,181 Solvency II regulatory debt 7,892 8,160
Other APMs Cash remittances‡ # Cash paid by our operating businesses to the Group, comprised of dividends and interest on internal loans. Dividend payments by operating businesses may be subject to insurance regulations that restrict the amount that can be paid. The business monitors total cash remittances at a Group level and in each of its markets.
Cash remittances eliminate on consolidation and hence are not directly reconcilable to the Group’s IFRS consolidated statement of cash flows.
Centre liquidity Centre liquidity represents cash remitted by the business units to the Group centre less centre operating expenses and debt financing costs. It includes cash disposal proceeds and capital injections. This provides meaningful information because it shows the liquidity at the Group centre available to meet debt interest and central costs and to pay dividends to shareholders.
Excess centre cash flow This represents the cash remitted by business units to the Group centre less central operating expenses and debt financing costs. Excess centre cash flow is a measure of the cash available to pay dividends, reduce debt or invest back into our business. Excess centre cash flow does not include cash movements such as disposal proceeds or capital injections.
These amounts eliminate on consolidation and hence are not directly reconcilable to the Group’s IFRS consolidated statement of cash flows.
Annual Premium Equivalent (APE) APE is a measure of sales in our life insurance business. APE is calculated as the sum of new regular premiums plus 10% of new single premiums written in the period. This provides useful information on sales and new business when considered alongside VNB.
Operating expense ratio The operating expense ratio expresses expenses as a percentage of operating income.
Operating income is calculated as Group adjusted operating profit before Group debt costs and operating expenses.

Alternative Performance Measures continued
Aviva plc Preliminary announcement 2019 119
Overview Analysis of assets Other information
IFRS Income, expenses & capital
Spread margin The spread margin represents the return made on the Group’s annuity and other non-linked business, based on the expected investment return, less amounts credited to policyholders. While not a key performance metric of the Group, the spread margin is a useful indicator of the expected investment return arising on this business.
Underwriting margin The underwriting margin represents the release of reserves held to cover claims, surrenders and administrative expenses less the cost of actual claims and surrenders in the period.
Unit-linked margin The unit-linked margin represents the annual management charges on unit-linked business. This is an indicator of the return arising on this business.