INCLUSION OF FOLIC ACID DATA IN A DATABASE … 5b - Usage of food... · A DATABASE FOR NUTRIENT...
24
INCLUSION OF FOLIC ACID DATA IN A DATABASE FOR NUTRIENT INTAKE EVALUATION IN BRAZIL Fernanda Grande, Eliana B. Giuntini, Kristy S. Coelho, Elizabete Wenzel de Menezes * Food Research Center (FoRC/CEPID/FAPESP). FCF/USP. São Paulo. Brazil *Coordinator of BRASILFOODS.
Transcript of INCLUSION OF FOLIC ACID DATA IN A DATABASE … 5b - Usage of food... · A DATABASE FOR NUTRIENT...

INCLUSION OF FOLIC ACID DATA IN A DATABASE FOR NUTRIENT
INTAKE EVALUATION IN BRAZIL
Fernanda Grande, Eliana B. Giuntini, Kristy S. Coelho, Elizabete Wenzel de Menezes*
Food Research Center (FoRC/CEPID/FAPESP). FCF/USP. São Paulo. Brazil *Coordinator of BRASILFOODS.

Food fortification in Brazil
• Fortification of wheat and corn flours with Folic Acid (FAc) has been mandatory in Brazil since 2002
• However, there are no National Food Composition Databases that include folate and FAc data
• Literature search: very few analytical data for folate/FAc were available for Brazilian foods – mainly using HPLC methods
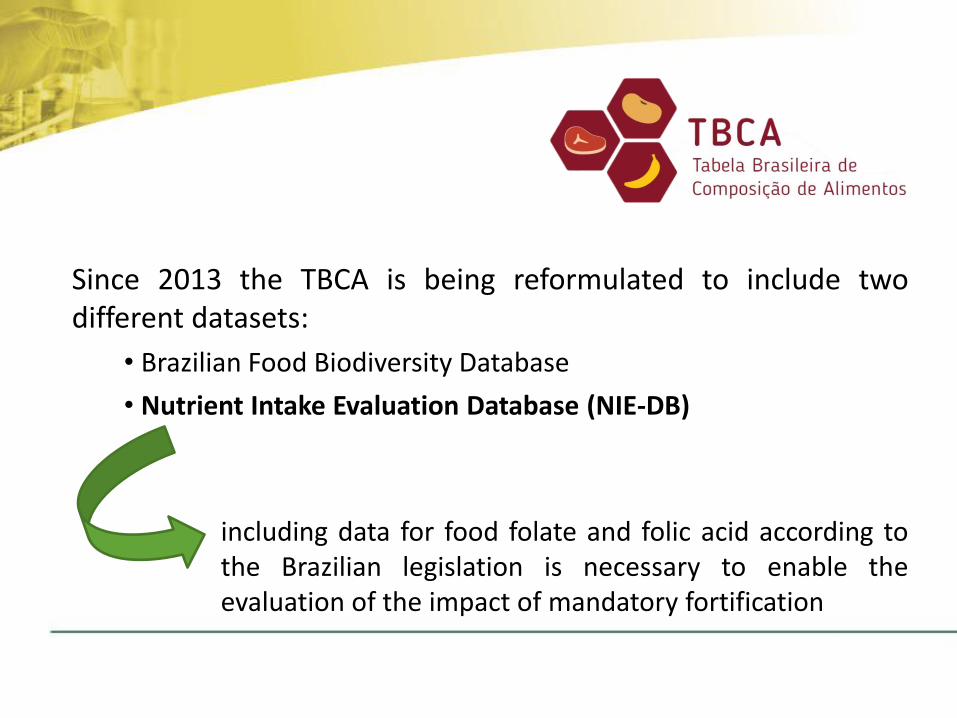
Since 2013 the TBCA is being reformulated to include two different datasets:
• Brazilian Food Biodiversity Database
• Nutrient Intake Evaluation Database (NIE-DB)
including data for food folate and folic acid according to the Brazilian legislation is necessary to enable the evaluation of the impact of mandatory fortification

Objectives
• To include the folate and FAc content of fortified foods in the Brazilian Nutrient Intake Evaluation Database (NIE-DB)
• To estimate FAc availability from these foods in Brazilian households using food purchase data

Folate and folic acid data
• Food folate: borrowed from the USDA National Nutrient Database for Standard Reference Release 28
• Folic Acid: the data were assumed on the basis of regulatory requirements
content of FAc in the fortified flours was assumed to be 150 mg/100g of flour according to the Brazilian regulation
• DFE= folate + 1.7 x folic acid
Methodology
(IOM, 1998)

Foods to include in the NIE-DB
• Household Budget Survey (HBS) (2008-2009): identification of the foods containing fortified flours as an ingredient in the food purchase data
• Recipes were collected for each food item and folate and FAc content were calculated by applying appropriate yield and nutrient retention factors
• Data were collated and managed using the INFOODS Compilation Tool - Version 1.2.1 (adapted)
Estimating Household availability of FAc • Estimated by applying nutrient values from the NIE-DB to the purchase
data from the HBS
Methodology
(FAO/INFOODS, 2011)

Thirty-two foods were identified as containing fortified flours in the HBS and the content of folate, FAc and DFE Foods were divided in three categories for calculation of folic acid and folate:
- Single ingredients
- Recipes
- Manufactured products
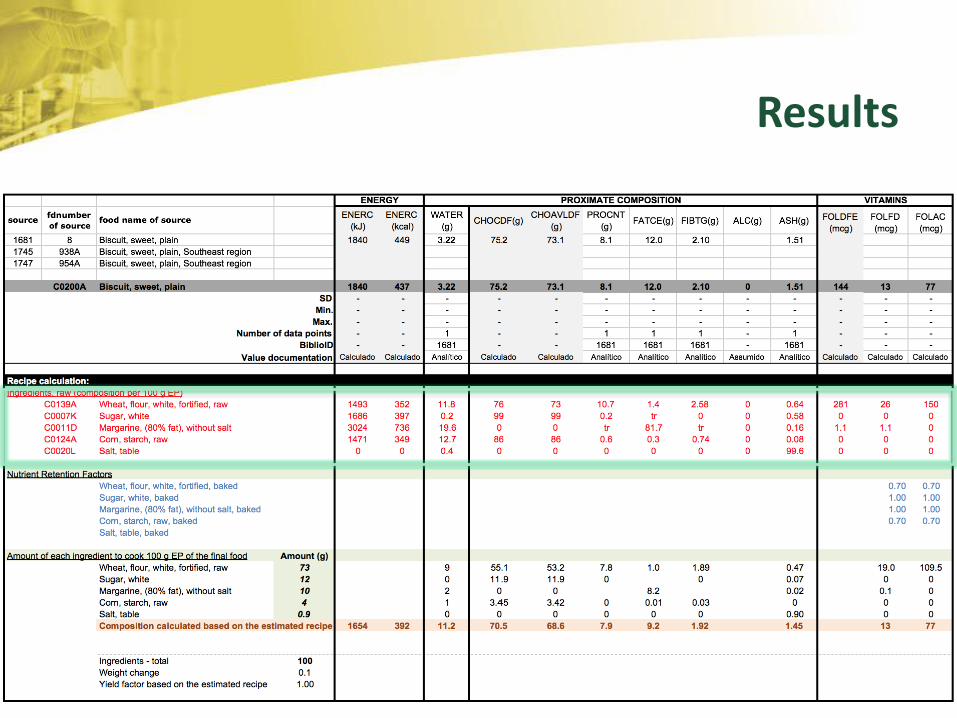
Results

Results
- Manufactured products
• list of ingredients in the label
• the amount of each ingredient was estimated by formulating a recipe to meet the analytical data for proximate composition
• using the formulated recipe, the vitamin content was calculated by using the same procedure applied for recipes

Results

Results

Results
Results

Results

Results

Results

Results
Household availability of FAc, food folate and Dietary Folate Equivalent (mg/per capita/day) from fortified foods, Brazil, 2008-2009
FAc can cover 44% of the daily Estimated
Average Requirement
(IOM, 1998) Brazil
Foodfolate
Folicacid
DFE
15 mg
75 mg
141 mg
Folate Folic Acid DFE

Pastas18%
Flours25%
Breads44%
Cakes1%
Biscuits/cookies12%
BRAZIL
Contribution (%) of different foods to the FAc availability in Brazilian Households, 2008-2009
Results

Results
0
10
20
30
40
50
60
70
80
90
≤R$830 R$830toR$1245 R$1245toR$2490 R$2490toR$4150 R$41150toR$6225 >R$6225
Total Breads Flours Pastas Biscuits/cookies Cakes
Household availability of FAc (mg/per capita/day) from fortified foods, according to monthly family income in Brazil, 2008/2009

Results
Household availability of FAc (mg/per capita/day) in Brazil from fortified foods by regions, 2008/2009
0
10
20
30
40
50
60
70
80
90
100
North Northeast Southeast South Midwest
Total Breads Flours Pastas Biscuits/cookies Cakes

Results
Household availability of FAc (mg/per capita/day) in Brazil from fortified foods by regions, 2008/2009
0
10
20
30
40
50
60
70
80
90
100
North Northeast Southeast South Midwest
Total Breads Flours Pastas Biscuits/cookies Cakes

Results
Household availability of FAc (mg/per capita/day) in Brazil from fortified foods by regions, 2008/2009
0
10
20
30
40
50
60
70
80
90
100
North Northeast Southeast South Midwest
Total Breads Flours Pastas Biscuits/cookies Cakes
36% EAR 46% EAR 42% EAR 59% EAR 36% EAR (IOM, 1998)

Conclusion
• The NIE-DB can be used as a tool for assessing the FAc content of Brazilian foods
• The database allows researchers to disaggregate the consumption of added FAc and naturally occurring folate in order to assess the effect of flour fortification on total intake in Brazil

Future steps
• Another 120 foods will be included in the NIE-BD to cover not only foods reported in the HBS but also the ones from the National Dietary Survey to allow the estimation of individual intake for FAc