

Including Oneself and Including Others: Who Belongs in My ...
34
Including Oneself and Including Others: Who Belongs in My Country? The Harvard community has made this article openly available. Please share how this access benefits you. Your story matters Citation Hochschild, Jennifer L. and Charles Lang. Forthcoming. Including oneself and including others: Who belongs in my country? Annals of the American Academy of Political and Social Science 630. Published Version http://ann.sagepub.com/ Citable link http://nrs.harvard.edu/urn-3:HUL.InstRepos:4315070 Terms of Use This article was downloaded from Harvard University’s DASH repository, and is made available under the terms and conditions applicable to Open Access Policy Articles, as set forth at http:// nrs.harvard.edu/urn-3:HUL.InstRepos:dash.current.terms-of- use#OAP
Transcript of Including Oneself and Including Others: Who Belongs in My ...

Including Oneself and IncludingOthers: Who Belongs in My Country?
The Harvard community has made thisarticle openly available. Please share howthis access benefits you. Your story matters
Citation Hochschild, Jennifer L. and Charles Lang. Forthcoming. Includingoneself and including others: Who belongs in my country? Annals ofthe American Academy of Political and Social Science 630.
Published Version http://ann.sagepub.com/
Citable link http://nrs.harvard.edu/urn-3:HUL.InstRepos:4315070
Terms of Use This article was downloaded from Harvard University’s DASHrepository, and is made available under the terms and conditionsapplicable to Open Access Policy Articles, as set forth at http://nrs.harvard.edu/urn-3:HUL.InstRepos:dash.current.terms-of-use#OAP

1
12/10/2009 10:56 AM
Including Oneself and Including Others: Who Belongs in My Country?
Jennifer L. Hochschild and Charles Lang
Keywords: inclusion, exclusion, public opinion, OECD countries, immigrant incorporation, race,
religion
To be a first class member of a country, must one have citizenship, the same ethnic or racial
background, or the same religion, as most citizens? How does high status relate to beliefs about
inclusion? We analyze the 2003 ISSP survey on national identity, focusing on ten wealthy,
democratic countries. We find a series of mismatches: a strong sense of being included is often
coupled with a desire to exclude others. Countries with extreme public views are not always the
countries with political controversy over inclusion. Views of citizens or members of the
mainstream religion or race often differ from views of outsiders. Countries often cluster in ways
that violate standard assumptions about geographic, cultural, or political affinities. Enjoying
high status does not guarantee feeling included or seeking to include others. Given these
mismatches, it is no surprise that politics and policies around inclusion are contentious, unstable,
and fascinating.

2
Germany is not an immigration country.
--1994 election platforms of Christian Democratic Union
and Christian Social Union
Germany is not a country of immigration, but a country of integration.
-- Frankfurter Allgemeine Zeitung, July 12, 2007
America’s racial disparities remain as deep-rooted after Barack Obama’s election as they
were before…. The struggle for racial and economic justice remains fraught.
-- (Joseph 2009)
Because we have tasted the bitter swill of civil war and segregation, and emerged from
that dark chapter stronger and more united, we cannot help but believe that the old
hatreds shall someday pass; that the lines of tribe shall soon dissolve.
-- President Barack Obama’s Inaugural Speech, January 20, 2009
To be a full-fledged, first class member of a country, must one have citizenship, the same ethnic
or racial background, or the same religion, as most citizens? How is high status related to
inclusion? Do well-off individuals feel secure enough to welcome outsiders in, or do they seek to
protect their benefits and status from outsiders; do poor members of a polity empathize with the
excluded, or raise barriers against potential competitors? Countries answer these questions
differently and residents of a country disagree among themselves. This article addresses one part
of this array of questions by examining how people in ten wealthy, westernized states evaluate
their own level of inclusion and what criteria they set for including others.
Our goal is systematic comparison among and within countries that are, roughly
speaking, socioeconomically and politically similar but treat issues of inclusion differently. Such
3
a comparison reveals starkly the tradeoffs in many contemporary discussions of inclusion and
exclusion. But it also reveals a broader set of attitudes than Americans usually consider, and it
shows that governments resting on public opinion and seeking to deal with questions of inclusion
have a wider set of policy choices than most Americans perceive.
We generate these comparisons from a public opinion survey, the International Social
Survey Programme (ISSP). In 2003, analysts from 42 countries asked a common set of 70
questions in a module on “national identity” [For illuminating uses of this survey, see (Bail
2008); (Kunovich 2009); (Pehrson et al. 2009); and (Davidov 2009). More generally, see (Blank
and Schmidt 2003)]. We use fourteen items to create indices that answer two misleadingly
simple questions: How included do I feel in my country, and what characteristics should a person
have to be included in my country? We then analyze views about inclusion and exclusion of
oneself and others across ten countries, and by majority and minority groups within a country.
We also show how views about inclusion relate respondents’ socioeconomic status,.
Some results are not surprising: white Americans feel more included than nonwhites,
Christians and Jews feel more included than people of other or no faith, and citizens feel more
included than noncitizens. Other findings were less predictable: nonwhite Americans resist
bringing outsiders in as much as do whites; nonreligious Britons feel excluded but promote
inclusion of others more than do those of any faith; Canadians feel more included than do
residents of most other countries, but also express more exclusionary views than do most others.
The most powerful conclusion is one of mismatches, in five distinct ways. First, a strong
sense of being included was frequently coupled with a desire to exclude others from one’s polity.
Second, countries with extreme public opinion are not necessarily the countries with political
controversy around questions of inclusion. Third, views of racial or religious insiders and of
4
citizens typically differ from views of relative outsiders. Fourth, countries often cluster in
groups that do not accord with our standard assumptions about geographic, cultural, or political
affinities. Finally, enjoying high status does not guarantee feeling included or seeking to include
others, and low status is not always associated with feeling excluded or preferring to exclude
others. In short, attitudes about inclusion may not accord with one another, or with one’s social
standing, the views of co-nationals, the level of political controversy about inclusion, or the
views of people in purportedly similar countries. No wonder the topic is endlessly fascinating,
and policies to resolve issues of stratification and exclusion are extremely difficult to negotiate.
To explicate these mismatches, the article proceeds as follows: we lay out a framework
showing how, in theory, status and inclusion are related. We next specify our questions and
explain the data and methods. We then provide results, and finally discuss the many mismatches.
The Model of Status and Inclusion
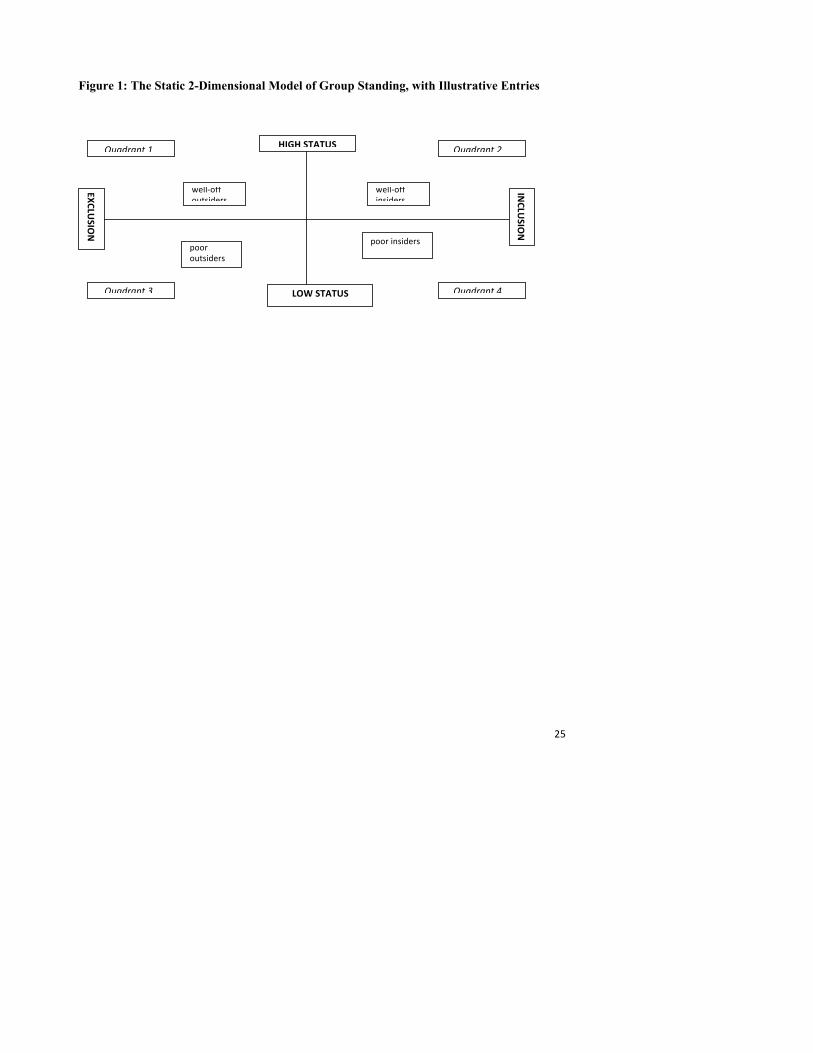
We start from a model of a person’s or group’s position at a given time, conceptualized along
two orthogonal dimensions. The vertical dimension is status, in which people are relatively
dominant or subordinated based on some contextually specific combination of political power,
socioeconomic standing, and cultural prestige. The horizontal dimension is one of inclusion,
determined by some contextually specific combination of individual identity or preference,
public policies, and the preferences and practices of others in the country [adapted from (Kim
1999)]. In the static model, groups or individuals can be located in one of the four resulting
quadrants, as in Figure 1:
Figure 1 about here
5
The static model can be made dynamic, since the location of a group or person, or the
elements determining vertical or horizontal position, may change over time. Before the U.S.
Civil War, all whites had a higher status than all blacks, regardless of income; by the 2000s,
some nonwhites arguably have a higher status than some whites, as nonwhites gain income or
political power and as income or power can sometimes override race in determining high status.
With regard to inclusion, for the century after 1850, most Americans perceived Asians to be
outsiders, regardless of their wealth or nativity. By the 2000s, enough had intermarried and
whites’ views had changed enough that Asians are arguably attaining insider status, socially if
not politically.
National context can affect a person or group’s location; dark skinned Afro-Caribbeans
might be high status insiders at home but become low status outsiders when they migrate to the
United States or England. Even categories or individuals within a group may change their status
with migration; different societal gender dynamics and laws may permit Muslim women to move
from quadrant 3 to quadrant 1 or 4 when they move from Pakistan to England.1
Finally, each person or group’s location is relative to others’. Insiders may, willingly or
under pressure, open their symbolic gates to some outsiders such as black Americans after the
1960s or Argentine-born ethnic Germans after World War II. Alternatively, a group may rise in
status if another group enters the polity below it; Irish Americans became symbolically “more
white” around the turn of the twentieth century as Southern and Eastern Europeans poured into
the United States and as blacks migrated north. “Enters” can be literal, as in migration, or
metaphorical, as when homosexuals are identified as a distinct group with social and political
import. Many political disputes can be interpreted as debates of whether and how a given group
6
may move toward quadrant 2, and many intra-group conflicts revolve around whether a group or
its members are willing to do what seems necessary to move toward quadrant 2.
Even boundaries between or understandings of the quadrants themselves may evolve, as,
for example, new groups enter quadrant 2 in sufficient numbers and with sufficient strength to
change the meaning of “mainstream.” Until at least the defeat of Al Smith’s presidential
candidacy in 1928, Catholicism was not part of the American mainstream; John Kennedy’s
election as president in 1960 signaled that it now was. Conversely, the attacks of September 11,
2001 contracted quadrants 2 and 4 (inclusion) and expanded quadrants 1 and 3 (exclusion) in the
United States, at least with regard to Islam and unauthorized immigrants. How expansive
quadrant 2 can be – for example, can one be French and still retain citizenship in the country of
origin? – is a vexed issue for most wealthy, westernized countries.
This simple model is thus quite flexible historically, geographically, culturally,
politically, and psychologically. It is especially useful if one treats the dimensions as continua
rather than as sharply bounded quadrants and if the model is treated dynamically rather than
statically. In this article, we use it to focus on attitudes about inclusion and exclusion rather than
on groups’ or individuals’ actual position or trajectory across the four quadrants. The model
provides a systematic way to analyze the elements of political contestation or cooperation around
immigrant incorporation, race relations, religious tolerance, and the meaning of citizenship in
democratic countries. As we will show, these elements relate to one another in intelligible ways,
but mostly by producing mismatches with conventional wisdom.
Data and Methods
The ISSP is conducted annually or biannually around the world by independent institutions in
each country. The survey items are jointly negotiated and as close to identical across countries
7
as translation permits.2 We created a four-item index to explore how included the respondent
feels, and a ten-item index to explore the conditions for including others in the respondent’s
national identity.3 A third index of four items measures status.4
Methods: We conducted the analysis in two stages – constructing the composite variables, and
analyzing them with respect to respondents' country of residence, race, citizenship status, or
religion. To do so, we needed first to determine if there was an underlying unidimensional
construct that could be summed by the available variables, and second, to determine if each
included variable contributed equally to the final construct, and if not, how to weight them to
reflect their differing influence.
We approached the first problem by collecting all variables from the data set that were
plausible candidates for measuring either status or inclusion, and correlating them with each
other. This provided a general idea of what variables might belong together. We then conducted
a classical composite analysis using Cronbach's Alpha to provide further evidence on how well
the variables measured a single, latent construct.5 Once these tests determined likely candidates
for inclusion in the composites, we undertook Principal Component Analysis (PCA) to provide
supporting evidence for the latent construct and to furnish appropriate weights to each included
variable.6 We identified which composites were relevant by plotting the estimated variance for
each composite against their composite number in a 'scree' plot.
Up to 10 percent of the values were missing for some variables, which required a way to
deal with the implications of absent values. We used three strategies: listwise deletion (that is,
deleting the entire case if one value is missing), substituting the mean value for missing values,
and multiple imputation of data.7 None of these methods is ideal, and each has problems
peculiar to it. Given this fact, and the fact that the analysis here is exploratory, we judged it most
8
important that the same inferences could to be made regardless of the method used to deal with
missing data. Therefore, we repeated all statistical analyses -- correlations, Cronbach's Alpha and
PCA -- using each method of dealing with missing data, and we present here only inferences that
could be verified across all methods.
Countries: Where the data make it possible, we compare views of inclusion across ten countries.
They are all relatively wealthy and democratic, and they all have a mix of races or ethnicities,
religions, and residents with different legal statuses. All have engaged in intense political
disputes with regard to questions of inclusion and stratification over recent decades, and none
has fully resolved those issues. (Perhaps no country ever can.) Nevertheless, the countries vary
in important ways. Three are Anglophone settler states: United States, Canada, and Australia.
Four are large West or Central European states: Great Britain, France, Germany, and Austria.
Two are small Scandinavian states: Sweden and Denmark. One is nonwestern: Japan. An initial
hypothesis is that these clusters of states would correspond to clusters of attitudes – but that is
not the case, as we show below.
Feeling Included and Including Others
Residents even of roughly similar countries vary a great deal in the degree to which they feel
included in their own national identity [see also (Antonsich 2009)] and in the terms they set for
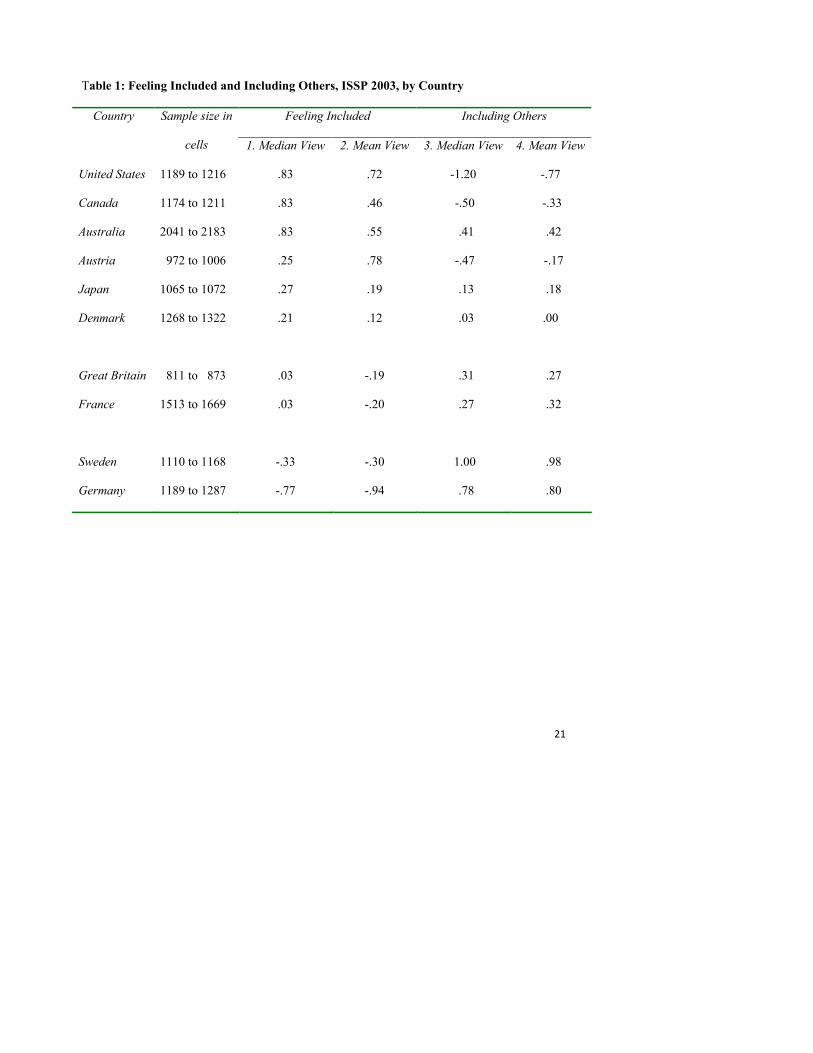
welcoming outsiders in. Table 1 and Figure 2 show the evidence for this claim:
Table 1 and Figure 2 about here
Looking at median or mean views of self-inclusion (columns 1 and 2 of table 1), and at the
distribution of views on self-inclusion (the dotted lines in figure 2), we see three patterns.
Especially in the United States and Australia, but also in Austria, Canada, and perhaps Japan and
Denmark, respondents make strong claims about self-inclusion [see also (Schildkraut 2007)]. In
9
Great Britain, and France, respondents are more evenly distributed around the mid-point,
suggesting that they feel somewhat included but do not assert national identity as strongly as do
residents of the first six countries. And in Sweden and especially Germany, respondents show a
weak sense of inclusion, or even exclusion compared with residents of the other states. In other
words, Germans and Swedes feel comparatively indifferent to, or even alienated from, their
national identity, or they may prefer outsider to insider status [see also (Hjerm 1998); (Jones and
Smith 2001)].8 One would need to look much more closely within each country’s political
dynamics to understand just what this relative sense of self-exclusion entails. But political
leaders in Germany and Sweden may not be able to draw upon a powerful sense of patriotism in
the way leaders in Australia and the United States can.
Now consider the median or mean views on inclusion of others (columns 3 and 4 of table
1), and the distribution of views on including others (the solid lines in figure 2). Here we also see
almost exactly the same three patterns. First, most strongly in the United States, Austria, and
Canada, and to a lesser degree in Australia, Japan, and Denmark, respondents are exclusionary;
they endorse high hurdles before outsiders may attain national identity. These are the same six
countries with the highest levels of self-inclusion. Second, just as residents of Great Britain and
France hold relatively moderate views about their own national identity, so too do they hold
relatively moderate views with regard to permitting outsiders to attain national membership.
Finally, in Sweden and Germany, respondents appear to be the most welcoming of outsiders.
Here too we see self-inclusion and inclusion of others moving toward opposite ends of their
distributions; Swedes and Germans are the least patriotic, and the most hospitable to outsiders.
Nevertheless, in all ten countries there is a very strong inverse relationship at the level of
individual respondents between self- and other-inclusion.9
10
This simple statistical analysis invites a wealth of political analysis. Judging only by
these data, one would expect the politics around the incorporation of outsiders to be less
contentious in Great Britain and France, the states in which people feel neither deeply patriotic
nor deeply protective against bringing outsiders in, compared with the other states. In contrast,
one would expect the politics around incorporation to be highly problematic in the United States,
Canada, and Austria, and perhaps Japan, Denmark, and Australia. Those are the countries in
which residents are deeply patriotic and deeply concerned about bringing outsiders in. Finally,
from these data, one would expect Germany and Sweden to welcome outsiders.
But that is not the pattern of the politics of incorporation during the past two decades.
Denmark, Great Britain, and France have seen violence and deaths, and Australia, Austria, and
Germany have engaged in intense electoral politics over immigration and immigrant inclusion.
Conversely, Canada, Sweden, Japan, and the United States have not, at least by comparison.
Assuming that the survey accurately represents public opinion, we are left with an intriguing
question for analysts and politicians: How and why have passionate advocates of one side or
another in the immigration debate been able to override an underlying rough consensus in public
opinion in Great Britain, France, and perhaps Denmark and, to a lesser degree, Germany?
Conversely, why has political contention around incorporation been mild in Canada, and
relatively mild in the United States, at least by comparison with the riots, deaths, and nativist
political parties in some European states?
The answers vary, and cannot be pursued in this article. Sometimes (as in Denmark,
Great Britain, and France), a particular incident can set off a chain of responses, with violence
either at the beginning or the end of the chain. Absent such an incident, perhaps the underlying
moderation of public opinion can keep debates about immigration and immigrants less fraught.

11
At other times (as in Germany, Australia, and Austria), strongly nationalist, even nativist,
candidates or parties have emerged, but there has been little violence and passions have cooled
somewhat after elections. (France has witnessed both strong nativism and violence.) Although
a political scientist is loathe to turn to contingency for explanations, it may be just luck that a
galvanizing incident has not occurred in all countries where residents feel a strong sense of
inclusion as well as a strong desire to exclude outsiders.
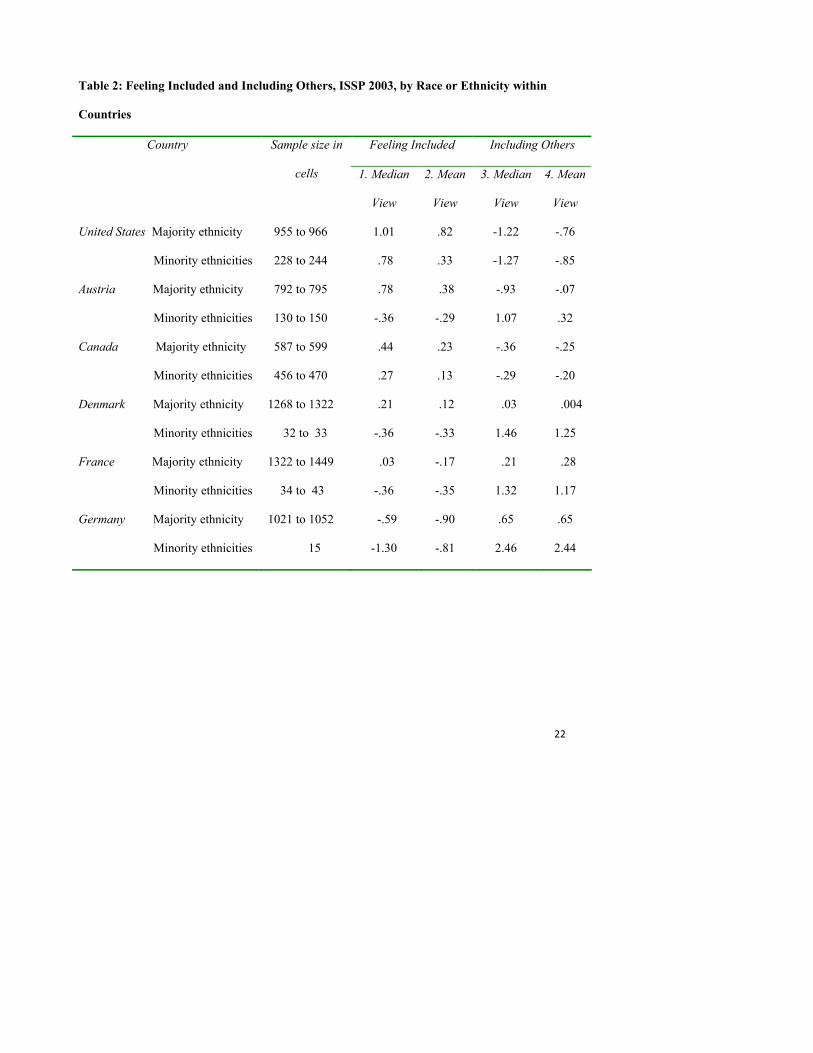
Inclusion and Race or Ethnicity
We can gain more leverage on public views of inclusion and exclusion by disaggregating
respondents into those more and less likely to be especially sensitive to such concerns. We begin
by comparing minority races or ethnicities (which we treat as synonyms) with majorities – the
division that has been most fraught in the United States for centuries. Data constraints permit
this analysis for only six countries; as above, we present the median and mean scores for self
inclusion and including others, as well as the subsample sizes (all in table 2) and the distribution
of views (figure 3). The countries are arrayed from the most-included majority group to the
least.
Table 2 and Figure 3 about here
We see two distinct patterns with regard to self-inclusion, depending on which evidence
we are considering. Focusing on median views permits the conclusion that minorities feel
almost as included as do majorities in the United States and Canada [on the impact of that shared
view, see (Transue 2007)] , but less so in the other four states. Looking at means and the
distribution of views, however, we see similarity across majority and minority ethnicities in
Canada, France, and Germany – a different set. Compared with medians, means also show
weaker inclusion among both majorities and minorities in the United States and Canada, but

12
among only majority groups in the other four. That suggests that most of the people with the
strongest views feel comparatively less included, especially and surprisingly among members of
majority races or ethnicities.
Turning to views about including others, the patterns are intriguingly different. In
medians, means, and distribution of views, Canada and especially the United States are distinct,
in that minority and majority ethnicities hold equally exclusionary views. In the other four
countries, minority ethnicities favor bringing outsiders in more than do their majority
counterparts. The Canadian case is partly explained by the fact that French Canadians comprise
a large part of the minority group in that country; they may view incorporation of non-French-
speaking outsiders as a further threat to their somewhat precarious position in the national power
structure. A parallel situation may hold in the United States, where African Americans have a
complex relationship with Latino immigrants – viewing them sometimes as rivals for jobs and
political or social position, and sometimes as allies against the greater threat posed by whites
[(McClain 2008); (Marrow 2008)]. In the other four countries, minority groups may perceive
outsiders to be much more like themselves, and therefore as likely allies in any contests with
majorities.
Inclusion and Citizenship
The 2003 ISSP contains few noncitizens in the countries we are examining, so this analysis is
constrained. We can, however, compare the median views of citizens and noncitizens on
including others in eight of the ten countries. Since citizens are the vast majority of respondents,
their views closely resemble the country-wide views discussed above. In contrast, with one
exception, the median noncitizen endorses inclusion of others much more than does the median
citizen. Countries vary in the location of their citizens and noncitizens along the continuum from
13
full exclusion to complete inclusion, but in almost all cases noncitizens are about a point or more
supportive of inclusion. Only in France do citizens’ and noncitizens’ views about including
others almost coincide.
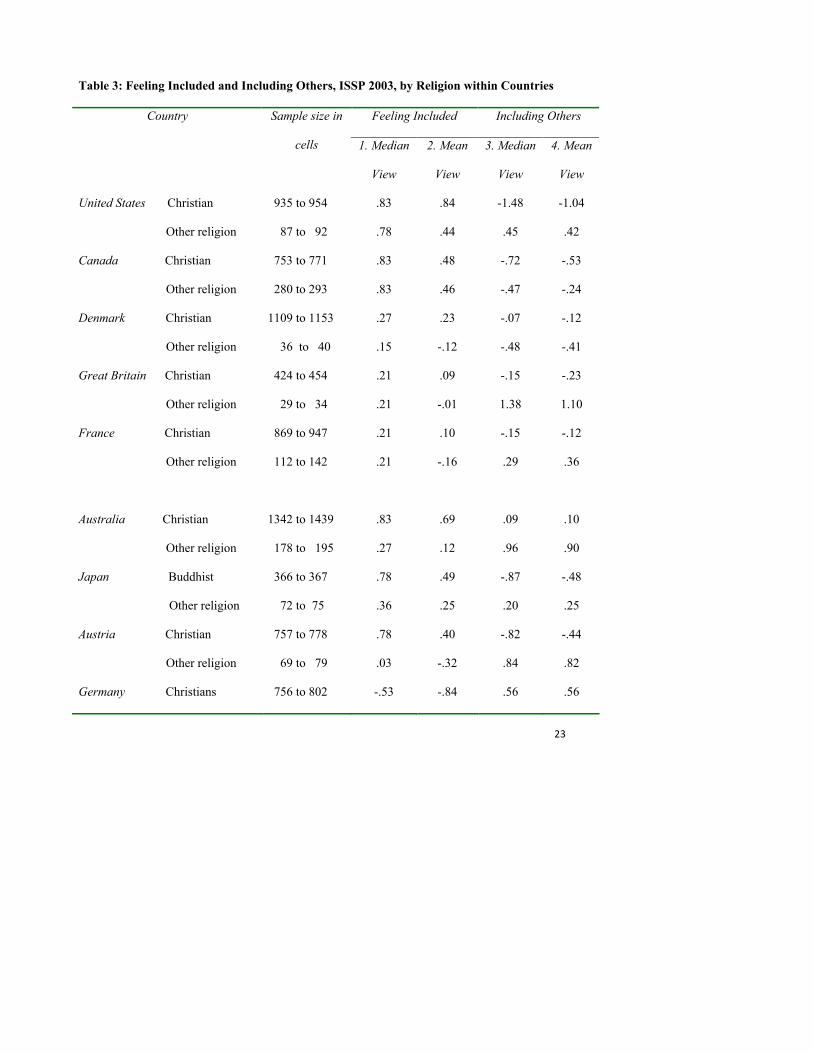
Inclusion and Religion
Noncitizens (and therefore nonvoters) have little leverage over incorporative policies. That
disadvantage does not hold for other forms of minority status, such as religion. We divided the
ISSP country samples into the majority or dominant religion (Christianity in all cases except
Japan), all minority religions combined, and no religion.10 Table 3 provides the median and
mean views of majority and minority religions with regard to self-inclusion and including others;
figure 4 provides the distribution of views for majority and minority religions.
Table 3 and Figure 4 about here
As the bulk of respondents from a given country, members of the dominant religion hold
views very similar to the views of that country’s whole sample. The new information therefore
is the views of religious minorities. Table 3 shows that the median views of Christians and
religious minorities with regard to self-inclusion (column 1) are similar in the United States,
Canada, Denmark, Great Britain, and France; religious minorities in these states feel as much a
part of their country, on average, as do religious majorities. In contrast, the median member of a
religious minority feels less included in Australia, Austria, and Japan – and excluded in
Germany.11 However, the mean view of religious minorities (column 2) is considerably lower
than the median in seven of the ten countries -- the United States, Canada, Austria, Denmark,
Great Britain, France, and Sweden.12 That indicates that some non-Christian respondents feel
much less included, or even excluded. Given the patterns in median views of religious majorities
14
and minorities, and in the mean and median views of religious minorities, we conclude that some
if not most religious minorities feel excluded in each of the ten states.
The distribution of views in panel A of figure 4 reinforces that conclusion. Strongly in the
United States, Australia and Austria, and less strongly in Japan and Denmark, religious
minorities feel less included than do religious majorities. Feelings of inclusion are similar for the
two groups in Britain, Canada, France, and Sweden—and religious minorities feel slightly more
included in Germany, if the very small sample size can be trusted.
In Austria, and possibly in Denmark and Japan, means, medians, and the distribution of
views all show that religious minorities feel less included than do religious majorities. If public
opinion underlies political contestation, we would expect religious tensions to be publicly
manifested in these three states. That has occurred in Denmark and Austria – but also in France,
Germany, and Great Britain (and not in Japan). So we are again left with an open research
question regarding the links between feeling more or less included and political activity.
With regard to including others, religious minorities generally favor bringing outsiders in
more than do religious majorities. The median view of minorities is higher than the median view
of majority believers, except for Denmark (table 3, column 3), and the mean view among
religious minorities is the same or higher than their median view (column 4; exceptions are Great
Britain, Sweden, and Germany). The distribution of views of religious minorities is much less
skewed to the left than is the distribution of views of religious majorities (figure 3, panel B) in
five of the ten countries.
Austria and Japan show great discrepancy between religious majorities and minorities on
both self inclusion and inclusion of others, which would lead us to expect political contests
around religion or deep alienation among religious minorities (or both). That expectation is
m.hunt� 12/30/09 11:03 AMComment: 4?
15
borne out in Austria, but not in Japan. Conversely, we would expect the least contention in
Sweden, an expectation that has been borne out. Elsewhere, religious minorities diverge from
religious majorities, but not strongly or across all measures. In these places, particular incidents,
leaders, or policy disputes could but may not lead to conflict over treatment of people divided by
religion but united by residence [for helpful comparative analyses of the relationship between
religion and political incorporation, see (Wright and Citrin 2009); (Foner and Alba 2008);
(Norris and Inglehart 2009)].
Comparing Disparities by Citizenship, Religion, and Race
Which form of difference in a state – citizenship, religion, or race – seems likely to generate the
most volatile politics around questions of inclusion? By one simple measure, citizenship
disparities seem the most explosive. We determined the absolute difference between the median
ratings of the majority and minority groups with regard to including others, for each country and
each form of difference. Differences between citizens and non-citizens averaged 1.30, compared
with only .27 between religious majorities and minorities and .77 between racial or ethnic
majorities and minorities. By this measure, we should expect the most conflict among
democratic publics around citizenship and the least around religion.13 (This conclusion warrants
caution, however, since sample size affects volatility. Since noncitizen subsamples are small and
perhaps not representative, the survey results may not accurately reflect noncitizens’ views in
some or all of these countries.)
Countries vary in the number of differences that could prove volatile. In Australia and
Austria, both religious groups and citizens and noncitizens disagree strongly with one another;
Germany adds disagreement between ethnic majorities and minorities as well. France, Canada,
and the United States each show only one deep disagreement. Thus if public opinion translated
16
directly into political contestation, we would expect the most severe conflicts over inclusion in
the two Germanic countries and Australia, and more conflict over immigrant incorporation than
over religious tolerance or racial and ethnic stratification.
The Full Model: Dimensions of Status and Inclusion
We turn finally to the full model in figure 1, by bringing in the status dimension. The model is
probably best used in analyzing particular countries, so that one can consider change over time
and across groups, as well as changing meanings of inclusion and political dynamics.
Nevertheless, it enables us to reveal one more, arguably the most important, mismatch. Figure 5
uses the indices of status and self inclusion to locate four countries’ respondents in the model’s
quadrants. We chose these four because they best typify distinctive patterns; each dot represents
one respondent.14
Figure 5 about here
Presumably a country would prefer all residents to be in quadrant 2, where people enjoy
relatively high status and feel included. The United States comes closest to that ideal among
these four countries, as one can see from the relative density of the dots in quadrant 2. The least
desirable quadrant is 3, where people have relatively low status and feel excluded. Among these
four countries, Germany is the unfortunate state exemplar of that pattern.
Despite having very different political and personal valences, quadrants 2 and 3 are both
analytically coherent. It is not surprising that high status people feel included in their country, or
low status people feel excluded. Quadrants 1 and 4 are more analytically puzzling because they
create two, quite distinct, mismatches. Quadrant 1 is the most politically troubling, since it
includes high status people who nonetheless feel excluded or alienated from their country. In
these graphs, that is most clearly Sweden’s situation. Finally, quadrant 4 is politically useful,

17
since it serves as a buffer for a country’s leaders and policies. It is comprised of low status
people who nonetheless feel included in or proud of their country. Among these four countries,
Austria has the largest relative share of people who feel more included than one would predict
from their situation in life.
The four countries in figure 6 are divided into the same four quadrants except that the
horizontal dimension focuses on inclusion of others rather than on one’s own sense of inclusion.
Again we have chosen countries that best typify the various patterns.
Figure 6 about here
In the liberal cosmopolitan ideal, a country’s residents would all be in quadrant 2, with high
status and strong support for bringing outsiders in. Sweden comes closest among our ten
countries to this ideal, even though it also has a high proportion of disaffected high status
residents. The antithesis of the liberal cosmopolitan ideal lies in quadrant 3, with low status
people who are hostile to outsiders. Among our ten countries, Austria shows the strongest
evidence of that confluence; this graph helps to explicate how the Freedom Party (FPŐ) of Jorg
Häider, with its political platform of “zero immigration,” gained prominence in the 1990s.
As with self-inclusion, quadrants 1 and 4 are more analytically complex. Quadrant 1
troubles liberals, although it gratifies a conservative nationalist. This is the arena of high status
residents who would prefer to exclude outsiders or make incorporation difficult. Among our ten
countries, the United States shows the most high status nationalism -- manifested in periodic
movements to eliminate illegal immigration, repatriate migrants, withhold governmental benefits
to legal noncitizens, or even revoke birthright citizenship. Quadrant 4, in contrast, would
surprise but gratify a liberal cosmopolitan. This is the arena of low status people with inclusive

18
attitudes toward outsiders. Surprisingly, Germany best exemplifies this combination among our
ten countries.
One could look further at changes in the distribution among quadrants through time, links
between political disputes over inclusion and public opinion, clusters of countries or groups with
regard to concentrations in a given quadrant, comparisons across quadrants between the indices
of inclusion, and so on. We cannot develop those extensions here, but they suggest an intriguing
research agenda.
Conclusion: Five Mismatches
Patterns of belief about inclusion and exclusion are complex, not to say murky. Even these
descriptive results from one survey show why issues of racial stratification, religious tolerance,
or immigrant incorporation prove so difficult for democratic polities to resolve, and how cross-
national comparisons open new vistas for analysis and politics.
We have identified five mismatches. Most importantly, patriotism is not associated with
a warm welcome in any of our ten countries, although the consistently strong inverse relationship
between feeling included and willingness to include varies a little bit across countries. At a
minimum, this dynamic makes it difficult for employers to bring in new workers or for elected
officials to promote immigrant incorporation; at a maximum, it can generate virulent nativism.
A second mismatch grows out of the expectations generated by the first. From these
data, one would expect political passions around inclusion to erupt in Austria, Canada, and the
United States – the three countries with the greatest disparity in the distribution of views about
personal inclusion and the desire to include others. But none of these three have experienced as
much public turmoil around immigrant incorporation as have Denmark, Great Britain, and
France. This mismatch points to the need for fine-grained analyses of the politics of

19
stratification and incorporation, attention to conditions under which broad public opinion shapes
policy disputes, and ways in which surveys do, or do not, reflect genuine public sentiment.
A third mismatch occurs among groups within a state. With some exceptions,
noncitizens, members of religious minorities, and racial or ethnic minorities feel less included
and are more willing to incorporate outsiders than their majority counterparts. That point is
hardly news. But the details regarding disparities of opinion, gaps between median and mean
views, and clusters of beliefs across these three distinctions reveals a great deal about particular
states.
However, the third mismatch does not always hold, which leads to the fourth. Countries
do not always cluster in the same way across the indices of self- and other-inclusion, and when
they do cluster, it is hard to tell why. For example, respondents in Australia, Canada, and the
United States might be expected to feel equally included since those countries are Anglophone
settler states. But why does Austria resemble those three, as it often does? Or why do racial and
ethnic minorities in the United States and Canada mostly agree with majorities in seeking to
exclude outsiders, given that Canadian noncitizens or American non-Christians feel differently?
And so on; what appears to be a coherent cluster of countries along one dimension of inclusion
often disintegrates when we consider a different dimension or another form of stratification.
The broadest angle of vision yields the final mismatch. The 2-dimensional theory of
status and inclusion would lead one to expect people of high status to feel included and people of
low status to feel excluded. There may even be causal links there: high status leads to a sense of
pride and inclusion, or a commitment to the country generates success that leads to high status.
Nevertheless, a high proportion of people – more in some countries than in others -- are in the
“wrong” quadrants. They are well-off but feel alienated or rejected by their country, or they are
20
poor but nonetheless proud of and attached to their country. Similarly, the same 2-dimensional
theory points to complex views on including outsiders. To a cosmopolitan liberal, high-status
nationalists or nativists generate the most troubling mismatch; to a nationalist conservative,
people with low status who welcome outsiders in are the misguided ones.
The United Nations predicts that four percent of the world’s population will soon live
outside their country of birth; about four in ten Mexicans would like to move to the United
States. People wept for joy in Grant Park the night that Barack Obama was elected president of
the United States, but people still speak bitterly of continued racism and subordination.
Mismatches between willingness to include others and feeling included in one’s own polity will
continue to shape political and policy disputes for decades to come.
21
Table 1: Feeling Included and Including Others, ISSP 2003, by Country
Feeling Included Including Others Country Sample size in
cells 1. Median View 2. Mean View 3. Median View 4. Mean View
United States 1189 to 1216 .83 .72 -1.20 -.77
Canada 1174 to 1211 .83 .46 -.50 -.33
Australia 2041 to 2183 .83 .55 .41 .42
Austria 972 to 1006 .25 .78 -.47 -.17
Japan 1065 to 1072 .27 .19 .13 .18
Denmark 1268 to 1322 .21 .12 .03 .00
Great Britain 811 to 873 .03 -.19 .31 .27
France 1513 to 1669 .03 -.20 .27 .32
Sweden 1110 to 1168 -.33 -.30 1.00 .98
Germany 1189 to 1287 -.77 -.94 .78 .80
22
Table 2: Feeling Included and Including Others, ISSP 2003, by Race or Ethnicity within
Countries
Feeling Included Including Others Country Sample size in
cells 1. Median
View
2. Mean
View
3. Median
View
4. Mean
View
United States Majority ethnicity
Minority ethnicities
955 to 966
228 to 244
1.01
.78
.82
.33
-1.22
-1.27
-.76
-.85
Austria Majority ethnicity
Minority ethnicities
792 to 795
130 to 150
.78
-.36
.38
-.29
-.93
1.07
-.07
.32
Canada Majority ethnicity
Minority ethnicities
587 to 599
456 to 470
.44
.27
.23
.13
-.36
-.29
-.25
-.20
Denmark Majority ethnicity
Minority ethnicities
1268 to 1322
32 to 33
.21
-.36
.12
-.33
.03
1.46
.004
1.25
France Majority ethnicity
Minority ethnicities
1322 to 1449
34 to 43
.03
-.36
-.17
-.35
.21
1.32
.28
1.17
Germany Majority ethnicity
Minority ethnicities
1021 to 1052
15
-.59
-1.30
-.90
-.81
.65
2.46
.65
2.44
23
Table 3: Feeling Included and Including Others, ISSP 2003, by Religion within Countries
Feeling Included Including Others Country Sample size in
cells 1. Median
View
2. Mean
View
3. Median
View
4. Mean
View
United States Christian
Other religion
935 to 954
87 to 92
.83
.78
.84
.44
-1.48
.45
-1.04
.42
Canada Christian
Other religion
753 to 771
280 to 293
.83
.83
.48
.46
-.72
-.47
-.53
-.24
Denmark Christian
Other religion
1109 to 1153
36 to 40
.27
.15
.23
-.12
-.07
-.48
-.12
-.41
Great Britain Christian
Other religion
424 to 454
29 to 34
.21
.21
.09
-.01
-.15
1.38
-.23
1.10
France Christian
Other religion
869 to 947
112 to 142
.21
.21
.10
-.16
-.15
.29
-.12
.36
Australia Christian
Other religion
1342 to 1439
178 to 195
.83
.27
.69
.12
.09
.96
.10
.90
Japan Buddhist
Other religion
366 to 367
72 to 75
.78
.36
.49
.25
-.87
.20
-.48
.25
Austria Christian
Other religion
757 to 778
69 to 79
.78
.03
.40
-.32
-.82
.84
-.44
.82
Germany Christians 756 to 802 -.53 -.84 .56 .56
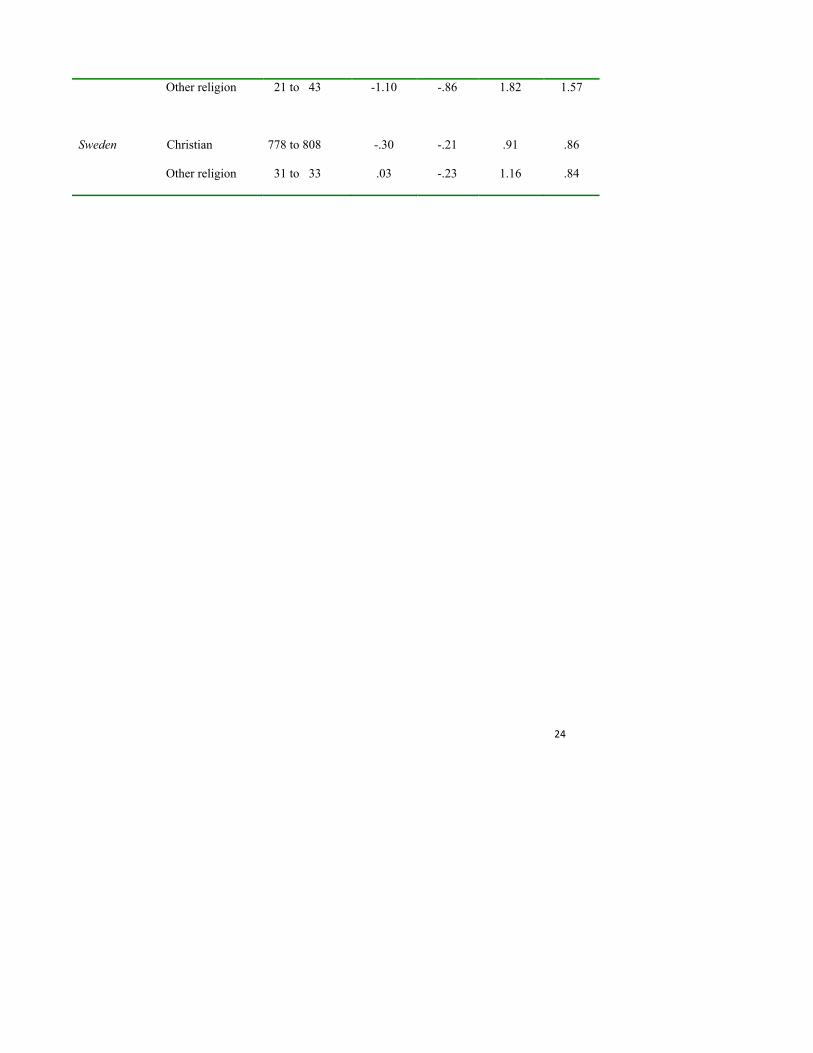
24
Other religion 21 to 43 -1.10 -.86 1.82 1.57
Sweden Christian
Other religion
778 to 808
31 to 33
-.30
.03
-.21
-.23
.91
1.16
.86
.84
25
Figure 1: The Static 2-Dimensional Model of Group Standing, with Illustrative Entries
HIGH STATUS
LOW STATUS
EXCLUSIO
N
INCLU
SION
Quadrant 1
well-‐off outsiders
Quadrant 2
well-‐off insiders
Quadrant 3
poor outsiders
Quadrant 4
poor insiders
26
Figure 2: Feeling Included and Including Others, ISSP 2003, by Country
Density distribution of self -inclusion (dotted line) and inclusion of others (solid line)
[sent separately as pdf]
Figure 3: Feeling Included and Including Others, ISSP 2003, by Race or Ethnicity within
Countries
Density distribution of self -inclusion (dotted line) and inclusion of others (solid line)
[sent separately as pdf]
Figure 4: Feeling Included and Including Others, ISSP 2003, by Religion within Countries
Density distribution of self -inclusion (dotted line) and inclusion of others (solid line)
[sent separately as pdf]
Figure 5: Relating Status to Self-Inclusion in the Model of Group Standing, ISSP 2003
[sent separately as pdf]
Figure 6: Relating Status to Inclusion of Others in the Model of Group Standing, ISSP
2003
[sent separately as pdf]

27
Jennifer L. Hochschild is Henry LaBarre Jayne Professor of Government at Harvard University,
with a joint appointment in the Department of African and African American Studies. Recently,
Hochschild co-edited (with John Mollenkopf) Bringing Outsiders In: Transatlantic Perspectives
on Immigrant Political Incorporation (Ithaca, NY, 2009). Her current book projects are Blurring
Racial Boundaries: Skin Color, Immigration, Multiracialism, and DNA (co-authored) and Facts
in Politics: What Do Citizens Know and What Difference Does It Make?
Charles Lang is a doctoral student at the Harvard Graduate School of Education, from which he
holds an M.A. in Mind, Brain and Education. He graduated in 2006 from the University of
Melbourne with bachelor’s degrees in biochemistry and political science. He has worked as a
research scientist in a hospital and done database management and statistical analysis for
Australia’s national Department of Health and Aging.
28
References
Antonsich, Marco. 2009. "National Identities in the Age of Globalization: The Case of Western
Europe." National Identities. 11 (3): 281-99.
Bail, Christopher 2008. "The Configuration of Symbolic Boundaries against Immigrants in
Europe." American Sociological Review. 73 (1): 37-59.
Blank, Thomas and Peter Schmidt, eds.,. 2003. "Special Issue: National Identity in Europe."
Political Psychology. 24 (2): 233-401.
Davidov, Eldad. 2009. "Measurement Equivalence of Nationalism and Constructive Patriotism in
the ISSP: 34 Countries in a Comparative Perspective." Political Analysis. 17 (1): 64-82.
Foner, Nancy and Richard Alba. 2008. "Immigrant Religion in the U.S. and Western Europe:
Bridge or Barrier to Inclusion?" International Migration Review. 42 (2): 360-92.
Heath, Anthony, Jean Martin II, and Thees Spreckelsen. 2009. "Cross-National Comparability of
Survey Attitude Measures." International Journal of Public Opinion Research. 21 (3):
293-315.
Hjerm, M. 1998. "National Identities, National Pride, and Xenophobia: A Comparison of Four
European Countries." Acta Sociologica. 41 (xx): 335-47.
Jones, F.L. and P Smith. 2001. "Diversity and Commonality in National Identities: An
Exploratory Analysis of Cross-National Patterns." Journal of Sociology. 37 (1): 45-63.
Joseph, Peniel. 2009. "Our National Postracial Hangover." Chronicle of Higher Education.
August 7, B6.
Kim, Claire. 1999. "The Racial Triangulation of Asian Americans." Politics and Society. 27 (1):
103-36.

29
Kunovich, Robert. 2009. "The Sources and Consequences of National Identification." American
Sociological Review. 74 (4): 573-93.
Marrow, Helen. 2008. "Hispanic Immigration, Black Population Size, and Intergroup Relations
in the Rural and Small-Town South." in New Faces in New Places: The Changing
Geography of American Immigration. Douglas Massey, ed. New York: Russell Sage
Foundation, 211-48.
McClain, Paula et al. 2008. "Black Elites and Latino Immigrant Relations in a Southern City." in
New Race Politics in America: Understanding Minority and Immigrant Politics. Jane
Junn and Kerry Haynie, ed. New York: Cambridge University Press, 145-65.
Medina, Tait, Shawna Smith, and J. Scott Long. 2009. "Measurement Models Matter: Implicit
Assumptions and Cross-National Research." International Journal of Public Opinion
Research. 21 (3): 333-61.
Norris, Pippa and Ronald Inglehart. 2009. Muslim Integration into Western Cultures: Between
Origins and Destinations. Cambridge MA: Harvard University, Harvard Kennedy
School.
Pehrson, Samuel, Vivian Vignoles, and Rupert Brown. 2009. "National Identification and Anti-
Immigrant Prejudice: Individual and Contextual Effects of National Definitions." Social
Psychology Quarterly. 72 (1): 24-38.
Schildkraut, Deborah. 2007. "Defining American Identity in the Twenty-First Century: How
Much 'There' Is There?" Journal of Politics. 69 (xx): 597-615.
Transue, John. 2007. "Identity Salience, Identity Acceptance, and Racial Policy Attitudes:
American National Identity as a Uniting Force." American Journal of Political Science.
51 (1): 78-91.
30
Wright, Matthew and Jack Citrin. 2009. "God and Country: Religion, Religiosity, and National
Identity in American Public Opinion." Toronto Canada: American Political Science
Association, September 3-6.
1 Local context may also affect location on the quadrants. Homosexuals can become insiders
more readily in San Francisco than in, say, Biloxi, Mississippi; Jews may feel excluded in
Phoenix, Arizona while fundamentalist Protestants have a similar position in Manhattan. More
generally, demographic composition, partisan competition, the nature of jobs, spatial
segregation, local leadership and other features of a city or region shape possibilities for upward
mobility or, perhaps, exclusion.
2 ZACAT (the Central Archive for Empirical Social Research at the University of Cologne)
documents and makes available the data. See http://www.issp.org/ and
http://zacat.gesis.org/webview/index.jsp. Cautions about cross-national research using survey
data are included in (Medina et al. 2009) and –especially relevant-- (Heath et al. 2009)
3 The “self-inclusion” index included: 1) Which in the following list is most important to you in
describing who you are? [Nationality considered “yes”, all other answers, “no”]; 2) How close
do you feel to [country]?; 3) I would rather be a citizen of [country] than any other country in the
world; and 4) How proud are you of being [country]?
The “inclusion of others” index included: 1-8) To be truly [nationality], how important is
it to …? have been born in [country]; have [country] citizenship; have lived in [country] for

31
most of one's life; be able to speak [country’s recognized language(s)]; to be a [dominant religion
or denomination in that country]; to respect [country’s] political institutions and laws
-to feel [country nationality]; to have [country nationality] ancestry; 9) Children born in
[country] of parents who are not citizens should have the right to become [country] citizens; and
10) Children born abroad should have the right to become [country] citizens if at least one of
their parents is.
4 The status measures were years of schooling, monthly income in euros, annual family income
in euros, and employment class in SIOPS status units. The latter is an international standardized
prestige measure for occupations. It is highly reliable, with inter-country correlations of 0.97;
thus it can be used to measure the relative prestige of occupations within and across countries.
We converted ISCO88 units used in the ISSP to SIOPS using SPSS macros developed by Harry
B.G. Ganzeboom, downloaded from http://home.fsw.vu.nl/hbg.ganzeboom/harry/index.htm. See
also (Ganzeboom and Treiman 1996).
5 Cronbach's Alpha measures agreement among respondents’ answers on each variable, also
called reliability. If the reliability was reduced by adding a particular variable, then we deemed
that variable unnecessary to the composite.
6 PCA is a mathematical analysis of the variables that determines optimal weighted linear
composites; in other words, it weights the variables to produce a set of possible composites that
are most plausible. Plausibility is judged by maximum variance given the inter-correlations
between variables, the first principal component being the composite with maximum variance.
7 Multiple imputation involves imputing several values for each missing value, to represent the
uncertainty about which values to impute. We used the Proc MI procedure from the statistical
32
package SAS for this task.
8 Social desirability could also account for the survey responses. It may be more difficult in
some countries than in others to admit that one is not proud of one’s country or does not feel
fully included, or to express hostility to outsiders or prejudice against minorities. We cannot,
however, systematically test the possibility of variations in social desirability response set across
countries.
9 For all respondents by country, the correlations between self-inclusion and inclusion of others
are: Australia: -.805; Austria: -.984; Canada: -.658; Denmark: -.822; France: -.649; Germany: -
.812; Great Britain: -.805; Japan: -.821; Sweden: -.635; United States: -.731. All are statistically
significant at the .0001 level. R2 ranges from .18 for Sweden to .40 for Austria.
10 Ideally one would disaggregate within Christianity, and among minority religions, but sample
sizes were too small or unrepresentative to permit that refinement. Our analysis does not address
those with no religion, since the latter are not clearly within, or outside, the societal mainstream.
11 Sweden is the outlier; religious minorities feel more included than do Christians. However, the
cell size for religious minorities is small so these results may not be trustworthy.
12 In this case, Germany is the outlier, since the mean member of a minority religion feels
slightly less excluded than does the median member. Here too, the cell size for religious
minorities is small so these results may not be trustworthy.
13 The tiny number of noncitizen responses on self-inclusion prevents a full comparison on that
index. However, religious majorities and minorities differed by an average of .28 in their sense
of inclusion, and racial or ethnic majorities and minorities differed by an average of .42.
14 We focus on only four because of space constraints. For graphs of the other countries, contact