INCA PEDESTRIAN BRIDGE OVER 38TH AVENUE
65
CDOT Project NO. FBR R200-266 CDOT Subaccount No. 23558 Stanley Consultants Project No. 29715 January 2021 STRUCTURE ALTERNATIVES EVALUATION REPORT Region 2 Bridge Bundle Design Build Grant Project Preliminary Design and Procurement Support Services Structure I-13-G (Region 2 – SH 24 MP 227.095) Prepared for: Colorado Department of Transportation Region 2 5615 Wills Blvd. Pueblo, CO 81008 Prepared by: Inna E. Pushkarova, PE [email protected] T:720.460.4742
Transcript of INCA PEDESTRIAN BRIDGE OVER 38TH AVENUE

CDOT Project NO. FBR R200-266
CDOT Subaccount No. 23558
Stanley Consultants Project No. 29715 January 2021
STRUCTURE ALTERNATIVES EVALUATION REPORT
Region 2 Bridge Bundle Design Build Grant Project
Preliminary Design and Procurement Support Services
Structure I-13-G
(Region 2 – SH 24 MP 227.095)
Prepared for: Colorado Department of Transportation Region 2 5615 Wills Blvd. Pueblo, CO 81008
Prepared by: Inna E. Pushkarova, PE
[email protected] T:720.460.4742

Structure I-13-G Structure Alternatives Evaluation Report
Page | 2
Table of Contents 1. EXECUTIVE SUMMARY .......................................................................................................................... 4
1.1. PROJECT DESCRIPTION .............................................................................................................. 4
1.2. PURPOSE OF THE REPORT ......................................................................................................... 4
1.3. STRUCTURE SELECTION PROCESS .............................................................................................. 4
1.4. STRUCTURE RECOMMENDATIONS ............................................................................................ 5
2. SITE DESCRIPTION AND DESIGN FEATURES .......................................................................................... 5
2.1. EXISTING STRUCTURE ................................................................................................................ 5
2.2. RIGHT OF WAY IMPACT ............................................................................................................. 8
2.3. TRAFFIC DETOUR OR SHOOFLY ................................................................................................. 8
2.4. UTILITIES .................................................................................................................................... 8
2.5. GEOTECHNICAL SUMMARY ....................................................................................................... 8
2.6. HYDRAULICS SUMMARY ............................................................................................................ 9
2.7. ENVIRONMENTAL CONCERNS ................................................................................................... 9
2.8. ROADWAY FEATURES .............................................................................................................. 10
3. STRUCTURAL DESIGN CRITERIA .......................................................................................................... 12
3.1. DESIGN SPECIFICATIONS ......................................................................................................... 12
3.2. CONSTRUCTION SPECIFICATIONS ............................................................................................ 12
3.3. LOADING .................................................................................................................................. 12
4. STRUCTURE SELECTION ...................................................................................................................... 12
4.1. SELECTION CRITERIA ................................................................................................................ 12
4.2. REHABILITATION ALTERNATIVES ............................................................................................. 13
4.3. STRUCTURE LAYOUT ALTERNATIVES ....................................................................................... 13
4.4. SUPERSTRUCTURE ALTERNATIVES .......................................................................................... 13
4.5. SUBSTRUCTURE ALTERNATIVES .............................................................................................. 14
4.6. ACCELERATED BRIDGE CONSTRUCTION (ABC) ........................................................................ 15
4.7. CONSTRUCTION PHASING ....................................................................................................... 15
4.8. CONSTRUCTABILITY ................................................................................................................. 15
4.9. MAINTENANCE AND DURABILITY ............................................................................................ 15
4.10. CORROSIVE RESISTANCE.......................................................................................................... 15

Structure I-13-G Structure Alternatives Evaluation Report
Page | 3
4.11. CONSTRUCTION COST ............................................................................................................. 15
4.12. CONCLUSIONS AND RECOMMENDATIONS ............................................................................. 16
APPENDIX A – General Layout and Typical Section .................................................................................... 18
APPENDIX B – Structure Selection Report Checklist ................................................................................... 19
APPENDIX C – Construction Cost Estimate ................................................................................................. 20
APPENDIX D – Geotechnical Report ............................................................................................................ 21
Picture 1 – Bridge I-13-G General Location ................................................................................................... 6
Picture 2 – Typical pile split and existing riprap ........................................................................................... 7
Picture 3 – Existing beam lag bolts ............................................................................................................... 7
Table 1 – Bridge I-13-G Summary Information ............................................................................................. 6
Table 2 – Summary of Bedrock and Groundwater Conditions ..................................................................... 9
Table 3 – Construction Cost Summary ........................................................................................................ 16
Table 4 – Summary of Structure Alternatives Evaluation ........................................................................... 16

Structure I-13-G Structure Alternatives Evaluation Report
Page | 4
1. EXECUTIVE SUMMARY
1.1. PROJECT DESCRIPTION
The CDOT Region 2 Bridge Bundle Design Build Project consists of the replacement of seventeen (17) rural bridges on essential highway corridors in southeastern and central Colorado. The key corridors (US 350, US 24, CO 239 and CO 9) provide rural mobility, intra- and interstate commerce, movement of agricultural products and supplies, and access to tourist destinations. The 2 other bridges are Additionally Requested Elements (AREs) in the design build project. There is a total of nineteen (19) structures bundled under this project. This design build project is partially funded by the USDOT FHWA Competitive Highway Bridge Program grant and funds from the Colorado Bridge Enterprise (14 structures, project number 23558). The 5 additional structures are funded solely by Colorado Bridge Enterprise (project number 23559). These projects are combined to form one design-build project. The nineteen bridges identified to be included in the ‘Region 2 Bridge Bundle’ were selected based on similarities in the bridge conditions, risk factors, site characteristics, and probable replacement type, with the goal of achieving economy of scale. Seventeen of the bridges being replaced are at least 80 years old. Five of the bridges are Load Restricted limiting trucking routes through major sections of the US 24 and US 350 corridors. The bundle is comprised of nine timber bridges, four concrete box culverts, one corrugated metal pipe (CMP), four concrete I-beam bridges, and one I-beam bridge with corrugated metal deck.
1.2. PURPOSE OF THE REPORT
This report presents the findings of the preliminary level multidisciplinary investigation of the existing conditions of the given structure. The objective of this report is not to select a new structure type but to develop guidelines that will be addressed in the Design-Build documents and make recommendations based on the available information. All the information obtained in the survey, geotechnical investigation, hydrology and hydraulics, existing utilities, and environmental investigation is discussed in this report. The study evaluates feasible structure alternatives for the site and identifies all known constrains.
1.3. STRUCTURE SELECTION PROCESS
The following criteria for comparing and evaluating the structural alternatives is discussed below and will need to be considered during design-build prosses:
o Hydraulic Opening Requirements o Roadway alignments o ROW Impacts o Constructability
o Construction costs o Maintenance o Durability o Traffic Control
The recommendations of the report are based on the overall consideration of all these elements as appropriate to this site and bridge.

Structure I-13-G Structure Alternatives Evaluation Report
Page | 5
1.4. STRUCTURE RECOMMENDATIONS
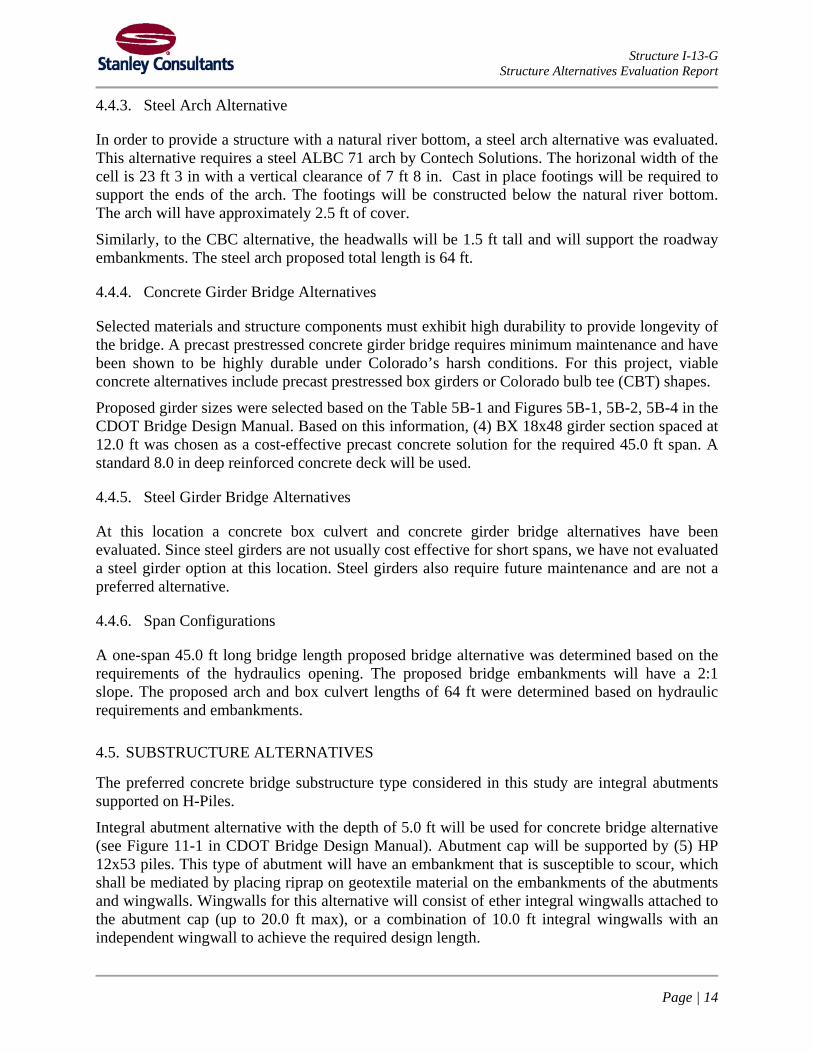
Based on the subsequent discussion, the recommended proposed overpass structure will consist of the ALBC 71 Arch Structure by Contech Solutions. The proposed 7 ft 8 in clear vertical span will maintain cattle crossing at this location. The width of proposed construction must accommodate two 12.0 ft lanes of traffic with 8.0 ft minimum shoulders and the Colorado current standard Guardrail on each side. The proposed length will be 64 ft. Wingwalls will be required on four corners to retain the roadway fill. The contractor may select a different structure type based on their investigation, meeting the criteria described in this report.
2. SITE DESCRIPTION AND DESIGN FEATURES
2.1. EXISTING STRUCTURE
The existing I-13-G structure is a three-span treated timber stringer bridge built in 1937. The existing structure allows two seasonal washes that converge upstream of the structure to cross under State Highway (SH) 24, forming a single deep channel downstream. The existing bridges were based on a CDOT Standard P-117-B-H. The existing bridge consist of three 23.0 ft long spans, for a total structure length of 70.5 ft. The width of the existing structure is 29.0 ft curb to curb, 30.0 ft out to out of deck. The existing vertical clearance varies from 8.0 ft to 9.0 ft. The existing framing consists of 14 rows of 6 in x 20 in wood stringers, spaced at 2 ft 2 ¾ in. The bridge deck consists of 3 in x 6 in wood planks. The piers are wood piers with (6) 1.0 ft diameter piles and a diagonal wood brace. The pier cap is a 1.0 ft square wood beam. The pile spacings are approximately 6.0 ft. The abutments consist of 1.0 ft square wood abutment caps, supported on (7) 1.0 ft diameter piles. The pile spacings at the abutment are approximately 5.0 ft. There are 4 wood wingwalls at the existing bridge. The wingwalls are approximately 16.0 ft long and vary in height. The wingwalls are supported by (4) 12.0 in diameter piles. There is a short 2.0 ft to 3.0 ft high wood retaining wall in front of the abutments. The wall is supported by 12.0 in wood piles spaced at approximately 5.0 ft. Fill and a riprap system are placed between the abutment and lower wall at an approximate 1.5:1 slope. The existing structure is currently used as a cattle crossing. The existing bridge railing is attached to the outside edge of the deck and consists of a timber rail with 6”x8”x5’-0” post and single 3”x8” rail. Existing I-13-G structure is located on SH 24 at Mile Post 227.095, approximately 12.0 miles west of Hartsel, CO. Table 1 summarizes bridge information.

Structure I-13-G Structure Alternatives Evaluation Report
Page | 6
National Bridge Structure Number I-13-G Year Built 1937 Construction Type Treated timber stringer Condition Rating Poor Load Restricted No Bridge Length 70.5 feet Bridge Width 30 feet Number of spans 3 Water Crossing Seasonal wash AADT 1900 Percent Commercial Traffic 8.0%
Table 1 – Bridge I-13-G Summary Information
Picture 1 – Bridge I-13-G General Location
The replacement of Bridge I-13-G is warranted due to the age and deteriorating conditions. Based on visual inspection and provided bridge inspection report, 26% of the existing girders are split or repaired. Eight girders have been repaired with lag bolts, so it is now considered a temporary structure. Other issues include: - All piles have cracks penetrating 2-25% of pile thickness. Three piles are severely split. - Both abutments have weathered backing planks. - All wingwalls are weathered, and cracks are present in most support piles.

Structure I-13-G Structure Alternatives Evaluation Report
Page | 7
- Heavy erosion is found upstream of the seasonal wash. - Several guard rails are weathered and splintered, and four timber posts are broken. - Rot, mold, water staining, and deterioration are present throughout numerous primary structural components
Picture 2 – Typical pile split and existing riprap
Picture 3 – Existing beam lag bolts

Structure I-13-G Structure Alternatives Evaluation Report
Page | 8
2.2. RIGHT OF WAY IMPACT
The existing right of way (ROW) is located approximately 103.0 ft from the centerline of the existing road on the south side of the structure and 99.0 ft on the north side of the structure. Any alternative selected by a design-build team shall not make an impact on the existing right of way. No permanent ROW acquisitions are planned on either side of the SH 24. Temporary construction easements may be required for detour or drainage erosion control.
2.3. TRAFFIC DETOUR OR SHOOFLY
As stated by the CDOT grant application, the roadway shall not be closed for construction. Two other alternatives were investigated: 1. Phasing the constructions to keep one lane open. To meet all typical CDOT roadway phased construction criteria, this alternative can be constructed keeping half of the existing bridge open to traffic. 2. Building a two-lane shoofly on the north side of the existing bridge with a temporary pipe placed for drainage. A detour to the south should be avoided because of the wetlands present on south side of the structure. This is the preferred alternative for this project.
2.4. UTILITIES
Stanley subcontracted with Lamb-Star Engineering to provide utility location services in the vicinity of the structure. There is an overhead electric line located along the north ROW line running parallel to the existing road. There is an existing telephone underground line along the south ROW line. Based on the Lamb-Star Engineering investigation, there are no other existing utilities in the vicinity of the structure.
2.5. GEOTECHNICAL SUMMARY
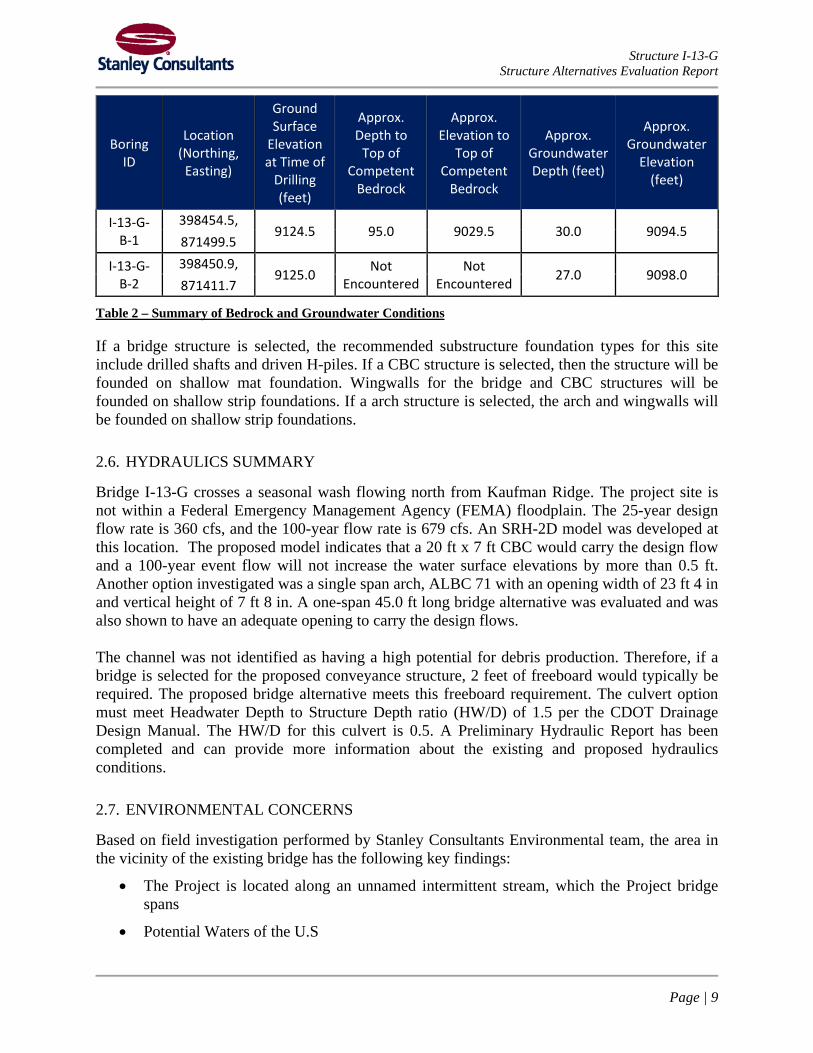
Stanley subcontracted with Yeh and Associates, Inc. to perform the geotechnical investigation of all bridges in this project. Full Preliminary Geotechnical Study is provided in the Appendix D. Two bridge borings, I-13-G-B-1 and I-13-G-B-2 were drilled by Yeh in the vicinity of the existing structure, and two pavement borings, I-13-G-P-1 and I-13-G-P-2, were drilled along the existing pavement approximately 250 feet from the structure. The bridge borings encountered variable amounts of lean clay, sand, and gravel overlaying sandstone bedrock. Table 2 provides a summary of the bedrock and groundwater conditions for the bridge borings. The surface elevations, approximate bedrock depths/elevations, and approximate groundwater depths/elevations are presented to the nearest 0.5 feet. The groundwater depths and elevations are based on observations during drilling.
Structure I-13-G Structure Alternatives Evaluation Report
Page | 9
Boring ID
Location (Northing,
Easting)
Ground Surface
Elevation at Time of
Drilling (feet)
Approx. Depth to
Top of Competent
Bedrock
Approx. Elevation to
Top of Competent
Bedrock
Approx. Groundwater Depth (feet)
Approx. Groundwater
Elevation (feet)
I-13-G- B-1
398454.5, 9124.5 95.0 9029.5 30.0 9094.5
871499.5
I-13-G- B-2
398450.9, 9125.0 Not
Encountered Not
Encountered 27.0 9098.0 871411.7
Table 2 – Summary of Bedrock and Groundwater Conditions
If a bridge structure is selected, the recommended substructure foundation types for this site include drilled shafts and driven H-piles. If a CBC structure is selected, then the structure will be founded on shallow mat foundation. Wingwalls for the bridge and CBC structures will be founded on shallow strip foundations. If a arch structure is selected, the arch and wingwalls will be founded on shallow strip foundations.
2.6. HYDRAULICS SUMMARY
Bridge I-13-G crosses a seasonal wash flowing north from Kaufman Ridge. The project site is not within a Federal Emergency Management Agency (FEMA) floodplain. The 25-year design flow rate is 360 cfs, and the 100-year flow rate is 679 cfs. An SRH-2D model was developed at this location. The proposed model indicates that a 20 ft x 7 ft CBC would carry the design flow and a 100-year event flow will not increase the water surface elevations by more than 0.5 ft. Another option investigated was a single span arch, ALBC 71 with an opening width of 23 ft 4 in and vertical height of 7 ft 8 in. A one-span 45.0 ft long bridge alternative was evaluated and was also shown to have an adequate opening to carry the design flows. The channel was not identified as having a high potential for debris production. Therefore, if a bridge is selected for the proposed conveyance structure, 2 feet of freeboard would typically be required. The proposed bridge alternative meets this freeboard requirement. The culvert option must meet Headwater Depth to Structure Depth ratio (HW/D) of 1.5 per the CDOT Drainage Design Manual. The HW/D for this culvert is 0.5. A Preliminary Hydraulic Report has been completed and can provide more information about the existing and proposed hydraulics conditions.
2.7. ENVIRONMENTAL CONCERNS
Based on field investigation performed by Stanley Consultants Environmental team, the area in the vicinity of the existing bridge has the following key findings:
• The Project is located along an unnamed intermittent stream, which the Project bridge spans
• Potential Waters of the U.S

Structure I-13-G Structure Alternatives Evaluation Report
Page | 10
o The Project has the potential to impact 0.06 acres of US Army Corps of Engineers (USACE) jurisdictional wetlands
o The Project has the potential to impact 0.44 acres (or 680 linear feet) of USACE jurisdictional tributaries
• Sensitive Species o The Project has no potential to impact species listed under the federal Endangered
Species Act o The Project has the potential to impact two species listed by Colorado Parks and
Wildlife as endangered or threatened Burrowing owl (Athene cunicularia) – State Threatened There is potential for Migratory Bird Treaty Act (MBTA) species occur
• Floodplains o The Project is not located within a Federal Emergency Management Agency
(FEMA) floodplain
• Hazardous Waste o None of the surrounding properties are known hazardous waste sites o Several stockpiles of gravel from an unknown source with an unknown potential
for contaminants were noted on the southwest side of the PRA
• Archaeological, Historic and Paleontological Resources o These resources are being assessed by CDOT and will be provided under separate
cover Refer to Desktop Study and wetland reports for additional information.
2.8. ROADWAY FEATURES
2.8.1. Cross Section
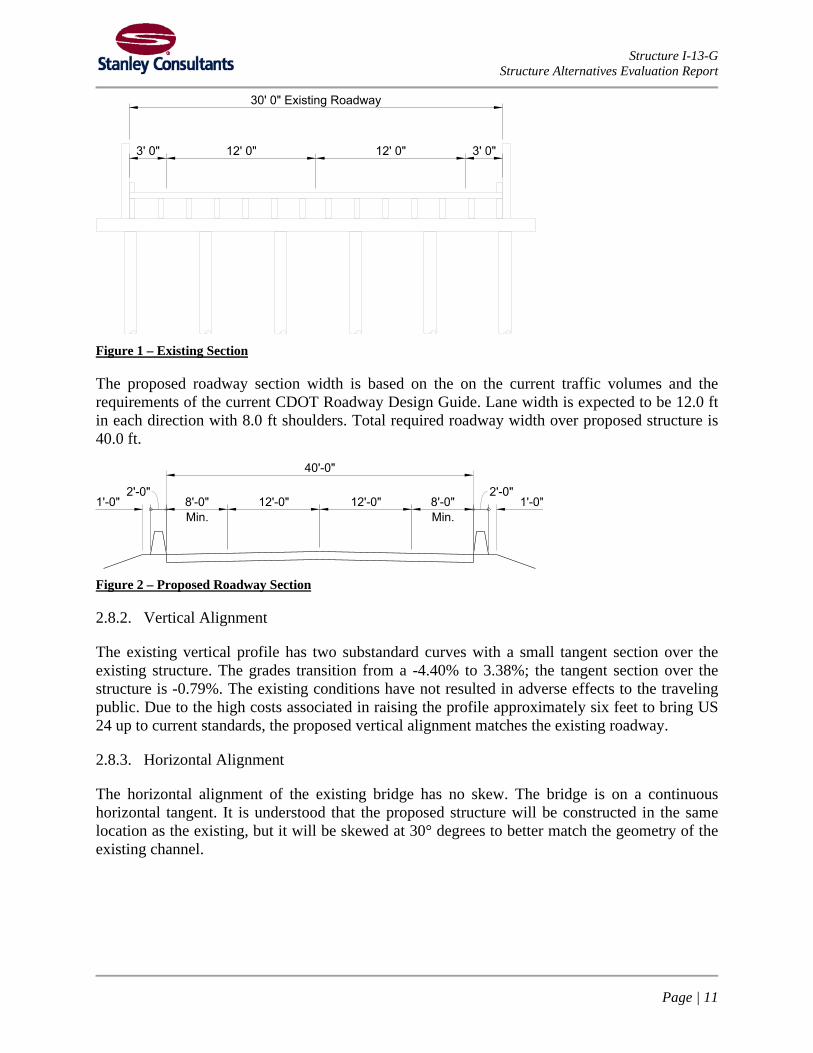
The existing SH 24 is a 2-lane roadway with two-way traffic. Both lanes are 12.0 ft wide and there are 3.0 ft exterior shoulders on both sides. The existing guardrail is a type 10R, present on both sides of the road.
Structure I-13-G Structure Alternatives Evaluation Report
Page | 11
Figure 1 – Existing Section
The proposed roadway section width is based on the on the current traffic volumes and the requirements of the current CDOT Roadway Design Guide. Lane width is expected to be 12.0 ft in each direction with 8.0 ft shoulders. Total required roadway width over proposed structure is 40.0 ft.
Figure 2 – Proposed Roadway Section
2.8.2. Vertical Alignment
The existing vertical profile has two substandard curves with a small tangent section over the existing structure. The grades transition from a -4.40% to 3.38%; the tangent section over the structure is -0.79%. The existing conditions have not resulted in adverse effects to the traveling public. Due to the high costs associated in raising the profile approximately six feet to bring US 24 up to current standards, the proposed vertical alignment matches the existing roadway.
2.8.3. Horizontal Alignment
The horizontal alignment of the existing bridge has no skew. The bridge is on a continuous horizontal tangent. It is understood that the proposed structure will be constructed in the same location as the existing, but it will be skewed at 30° degrees to better match the geometry of the existing channel.

Structure I-13-G Structure Alternatives Evaluation Report
Page | 12
3. STRUCTURAL DESIGN CRITERIA
3.1. DESIGN SPECIFICATIONS
• AASHTO LRFD Bridge Design Specifications, 9th Edition
• CDOT LRFD Bridge Design Manual
• CDOT Bridge Rating Manual
• CDOT Bridge Detail Manual
3.2. CONSTRUCTION SPECIFICATIONS
Colorado Department of Transportation Standard Specifications for Road and Bridge Construction, 2019.
3.3. LOADING
Live Loads: HL-93 Design Truck or Tandem, Design Lane Load, Colorado Permit Vehicle Future Dead Load: Design for additional 6 feet of fill for future roadway raise. Bridge Barrier: Bridge Rail Type 9 or Type 10MASH per the Colorado current standard Future Wearing Surface: 36.67 lbs per square foot (3 in minimum) Utilities: per plan details if required at final design Collision Load: the substructure will not require collision loading design. In cases where Bridge Rail is attached to the structure, the effects of vehicular collision on the barrier must be considered in accordance with AASHTO. Earthquake Load: The structure is located within Seismic Zone 1 and must meet the AASHTO connection and detailing requirements. Stream Forces and Scour Effects: stream force effects must be evaluated during final design when applicable. Possible cases include stream forces on the substructure and superstructure in addition to buoyancy from overtopping. Evaluation from scour will be performed per the CDOT Bridge Design Manual and AASHTO.
4. STRUCTURE SELECTION
4.1. SELECTION CRITERIA
The goal of this report is to identify which structural alternatives best meet the project requirements. The following criteria were established as a basis for evaluating the suitability of each structure type: hydraulic opening, constructability, construction cost, maintenance & durability, ROW and roadway impacts. The discussion below expands on these factors as it pertains to each alternative. Summary of Structure Alternatives Evaluation Table can be found at the end of Section 4.
Structure I-13-G Structure Alternatives Evaluation Report
Page | 13
4.2. REHABILITATION ALTERNATIVES
Rehabilitation of I-13-G will not be performed due to the age and type of the bridge. Constructed in 1937, this structure was in service for over 80 years and is showing signs of deterioration and aging that are inconsistent with practical and cost-effective rehabilitation.
4.3. STRUCTURE LAYOUT ALTERNATIVES
Layout of the proposed structure is controlled by the width of the proposed roadway section, stream geometry, hydraulic opening requirements, phased construction considerations and the position of the existing bridge substructure. The horizontal alignment of the proposed structure will be skewed at 30° degrees to follow the converged seasonal wash. The proposed bridge will provide adequate freeboard based on the 100-year water surface elevations provided in the hydraulics report. Refer to CDOT Bridge Design Manual and CDOT Drainage Manual for additional clearance requirements information. Any bridge structure selected for final construction must satisfy the live load deflection requirement for the selected girder types specified in AASHTO LRFD Bridge Design Manual.
4.4. SUPERSTRUCTURE ALTERNATIVES
4.4.1. Reinforced Concrete Pipe Alternative
Based on discussions with CDOT an RCP alternative would be a maintenance issue and were not acceptable at this location.
4.4.2. Concrete Box Culvert Alternative
Concrete box culverts are a cost-effective solution in both short- and long-term due to ease of construction and maintenance. The benefit of this structure type is that the culverts can be cast-in-place (CIP) or precast off-site and transported to the site for placement to streamline the construction prosses. In addition, CBC size can be selected from CDOT M&S Standards that cover vide array of single-cell and multi-cell culvert sizes. For I-13-G, a 20 ft x 7 ft box culvert is required to carry the design flow. The box can be constructed as CIP or precast. The proposed box culvert will be skewed at 30° degrees so the inlet of structure can accommodate the merge of the seasonal washes. The minimum design cover over the top slab of the proposed CBC is approximately 2.5 ft. Both of the structure’s headwalls will be 1.5 ft tall and will support the roadway embankments. The concrete box culvert proposed total length is 64 ft. Wingwalls will be provided on 4 sides on the box culvert and will be 20 ft long. Wingwalls will be per CDOT M-601-20 standard. Concrete box culvert alternative will require riprap apron on the downstream side of the structure as an energy dissipation countermeasure.
Structure I-13-G Structure Alternatives Evaluation Report
Page | 14
4.4.3. Steel Arch Alternative
In order to provide a structure with a natural river bottom, a steel arch alternative was evaluated. This alternative requires a steel ALBC 71 arch by Contech Solutions. The horizonal width of the cell is 23 ft 3 in with a vertical clearance of 7 ft 8 in. Cast in place footings will be required to support the ends of the arch. The footings will be constructed below the natural river bottom. The arch will have approximately 2.5 ft of cover. Similarly, to the CBC alternative, the headwalls will be 1.5 ft tall and will support the roadway embankments. The steel arch proposed total length is 64 ft.
4.4.4. Concrete Girder Bridge Alternatives
Selected materials and structure components must exhibit high durability to provide longevity of the bridge. A precast prestressed concrete girder bridge requires minimum maintenance and have been shown to be highly durable under Colorado’s harsh conditions. For this project, viable concrete alternatives include precast prestressed box girders or Colorado bulb tee (CBT) shapes. Proposed girder sizes were selected based on the Table 5B-1 and Figures 5B-1, 5B-2, 5B-4 in the CDOT Bridge Design Manual. Based on this information, (4) BX 18x48 girder section spaced at 12.0 ft was chosen as a cost-effective precast concrete solution for the required 45.0 ft span. A standard 8.0 in deep reinforced concrete deck will be used.
4.4.5. Steel Girder Bridge Alternatives
At this location a concrete box culvert and concrete girder bridge alternatives have been evaluated. Since steel girders are not usually cost effective for short spans, we have not evaluated a steel girder option at this location. Steel girders also require future maintenance and are not a preferred alternative.
4.4.6. Span Configurations
A one-span 45.0 ft long bridge length proposed bridge alternative was determined based on the requirements of the hydraulics opening. The proposed bridge embankments will have a 2:1 slope. The proposed arch and box culvert lengths of 64 ft were determined based on hydraulic requirements and embankments.
4.5. SUBSTRUCTURE ALTERNATIVES
The preferred concrete bridge substructure type considered in this study are integral abutments supported on H-Piles. Integral abutment alternative with the depth of 5.0 ft will be used for concrete bridge alternative (see Figure 11-1 in CDOT Bridge Design Manual). Abutment cap will be supported by (5) HP 12x53 piles. This type of abutment will have an embankment that is susceptible to scour, which shall be mediated by placing riprap on geotextile material on the embankments of the abutments and wingwalls. Wingwalls for this alternative will consist of ether integral wingwalls attached to the abutment cap (up to 20.0 ft max), or a combination of 10.0 ft integral wingwalls with an independent wingwall to achieve the required design length.

Structure I-13-G Structure Alternatives Evaluation Report
Page | 15
The steel arch alternative will have 2.0 ft wide by 1 ft 4 in deep cast in place footings under each leg per Contech Solutions standards.
4.6. ACCELERATED BRIDGE CONSTRUCTION (ABC)
CDOT has developed an Accelerated Bridge Construction (ABC) decision making process. The intent of this process is to apply some form of ABC on most projects. The design-build team is encouraged to use these recourses to evaluate cost efficiency of implementing ABC design.
4.7. CONSTRUCTION PHASING
As discussed in Section 2.3, building a shoofly is feasible on the north side of the existing structure and is the preferred alternative for this site. The shoofly will support the detoured two-way traffic and must comply with CDOT Roadway standards.
4.8. CONSTRUCTABILITY
Constructing concrete box culvert or steel arch would require less construction time and using precast sections would further reduce construction time. No known constructability issues are expected at this location.
4.9. MAINTENANCE AND DURABILITY
Typical CDOT specified materials and construction methods must be used for the construction of the proposed structure. Following accepted current practice in designing and constructing the structure will provide a durable bridge to meet the required 100-year service life with minimal required maintenance. Concrete box and steel arch alternatives may require routine cleaning. There is very little maintenance associated with the concrete girder bridge alternative.
4.10. CORROSIVE RESISTANCE
Epoxy coated reinforcing must be used for all reinforced concrete elements. A waterproofing membrane and stone matrix asphalt will be used on top of the concrete deck or CBC to prevent water and salt intrusion.
4.11. CONSTRUCTION COST
Construction costs are one of the most important factors in the structure type selections. Preliminary construction cost estimates are prepared for all selected structure alternatives to be compared as discussed above. High level construction cost for each structure type is summarized in the table below. Detailed calculations of the cost can be found in the Appendix C of this report. Individual items cost was obtained from recent CDOT Cost Data Books. A 30% contingency multiplier was used in cost calculations.

Structure I-13-G Structure Alternatives Evaluation Report
Page | 16
Alternative Construction Cost (30% Contingency) Area Cost
per sf Cost
Rating
Concrete Box Culvert $ 498,415.00 1397 sf $ 357 1.3
Steel Arch $ 406,894.00 1664 sf $ 245 1.6
Concrete Bridge $ 640,040.00 1935 sf $ 331 1.0
Table 3 – Construction Cost Summary
4.12. CONCLUSIONS AND RECOMMENDATIONS
Table below provides a summary or feasible alternatives evaluation based on the established selection criteria
Criteria CBC Steel Arch Concrete Bridge
Hydraulic Opening Satisfies the requirements
Satisfies the requirements. Preferable
for cattle crossing
Satisfies the requirements. Preferable
for cattle crossing
Constructability
No expected constructability issues.
Can be precast to streamline
construction
No expected constructability issues.
Delivered to site in ready to install sections
No expected constructability issues
Construction Cost Rating 1.3 1.6 1.0
Maintenance & Durability
May require routine cleaning
May require routine cleaning
Concrete girders require minimal maintenance. Integral abutment on H-Piles will require
scour protection.
ROW and Roadway Impacts No ROW impacts No ROW impacts No ROW impacts.
Table 4 – Summary of Structure Alternatives Evaluation

Structure I-13-G Structure Alternatives Evaluation Report
Page | 17
Based on the criteria discussed above, the steel arch alternative is the recommended alternative to replace existing I-13-G structure. The contractor may select a different structure type based on their investigations, meeting the criteria described in this report. See Appendix A for the selected General Layout and Typical Section.

Structure I-13-G Structure Alternatives Evaluation Report
APPENDIX A – General Layout and Typical Section
General Layout and Typical Section
X
30690
4210.19115.62
40' 0
" Ro
adwa
y
Shldr8'
0"
Lane12' 0
"
Lane12' 0
"
Shldr8'
0"
64' 0" Proposed Arch Structure
29' 3
¾"
1' 6"
1'
6"
20' 0" Typ.
HCL US 24
Ò Structure
Existing ROW
Overhead Electric
(to be removed)
Existing I-13-G Structure
Existing ROW
UG Telephone
CenturyLink
60°0'0"
120°0'0"
30' 0
" Existin
g Out to O
ut
9112.12
Invert Elev.
9113.82
Invert Elev.
(to be removed)
Existing I-13-G Structure
Profile
Proposed Roadway Guardrail Type 9(Typ.)
Ground Line
Existing
HCL US 24
64' 0" Proposed Arch Structure
Ty
p.
1' 4
"
Typ.
2' 0"
23' 3" Typ.
26' ¼" Typ.
(typ.)
Steel Arch
Proposed
Roadway
Proposed
Fil
l C
over
Î2
' 6
"
(to be removed)
Existing I-13-G Structure
Ground Line
Existing
7' 8
"
2.66%
SECTION
(Taken Normal to Ò Structure)
Flow
PLAN
To
Hartsel
PROFILE
(Taken Along Ò Structure)
survey and existing as-built drawings.
Dimensions are based on recent 1.
Notes:
155+0
0
To Johnson
Villa
ge
US 24 227.095
11
I-13-GI. Pushkarova
I. Pushkarova
STR
US 24 OVER SEASONAL DRAW
GENERAL LAYOUT AND TYP. SECTION
1+
00
No Revisions:
Revised:
Void: Sheet Subset:
Detailer:
Designer:
Sheet NumberSubset Sheets:
Init.CommentsDate:
Sheet Revisions As Constructed1/10/2021Print Date:
Horiz. Scale: Vert. Scale: As Noted
File Name:
97
06
10
:08
:05
PM
pw
:\\S
CI-P
WIN
TE
G-2
.sta
nle
yg
ro
up
.co
m:D
ata
so
urce-1
\Do
cu
men
ts\C
olo
rad
o_
Dep
artm
en
t_o
f_
Tran
sp
orta
tio
n\2
97
15
- C
DO
T R
2 B
rid
ge B
un
dle
\11
-C
AD
D\W
ork
sets
\29
17
5\D
GN
s\B
rid
ge\S
heets
\Gen
eral
Lay
ou
t I-1
3-G
_S
H3
50
MP
22
7.0
9.d
gn
23558STR_General Layout I-13-G_SH24 MP 227.09.dgn
Project No./CodeREGION 2 BRIDGE BUNDLE
Phone: 303-799-6806
Centennial, CO 80112
Suite 500
8000 South Chester St.M.P.
Structure No.Phone:719-546-5753
FAX:719-546-5402
Colorado Department of Transportation
5615 Wills Blvd
Pueblo, CO 81008
Region 2 JLS of
0+
00
155+00
9130
9120
9110
9100
0+50
9130
9120
9110
9100
0+00 1+00

Structure I-13-G Structure Alternatives Evaluation Report
APPENDIX B – Structure Selection Report Checklist
Structure Selection Report Checklist

Structure Selection Report QA Checklist This checklist is to serve as a general guideline for structure selection process. It is to be filled out by the project Engineer of Record or designee to indicate all items that are to be discussed in the Structure Selection Report. This checklist is to be included as an appendix to the Structure Selection Report and must be signed by Staff Bridge Unit Leader or designee prior to submittal of FIR documents to the Region.
Project Name
Project Location
Project Number Subaccount
Structure Number(s)
Engineer of Record Date
Cover Sheet Name of the Project and Site Address Structure(s) Number Property Owner Name and Contact Information Report Preparer Name and Contact Information Seal and Signature of the Designer Submittal and Revision Dates as Applicable
Executive Summary Project Description Purpose of the Report Structure Selection Process Structure Recommendations
Site Description and Design Features Existing Structures ROW Impact Traffic Detour Utilities Geotechnical Summary Hydraulics Summary Environmental Concerns Roadway Design Features
Cross Section Vertical Alignment Horizontal Alignment
Structural Design Criteria Design Specifications Construction Specifications Loading
Collision Load Earthquake Load
Software to be used by the Designer Software to be used by the Independent Design Checker
Structure Selection Selection Criteria Rehabilitation Alternatives Structure Layout Alternatives:
Vertical Clearances Horizontal Clearances Deflection Skew

Superstructure Alternatives: Concrete Girder Alternatives Steel Girder Alternatives Span Configurations
Substructure Alternatives: Abutment Alternatives (GRS, Integral, Semi-integral, etc.) Pier Alternatives
Wall Alternatives Construction Phasing Possible Future Widenings Use of Existing Bridge in Phasing / Partial Configuration ABC Design Constructability Aesthetic Design Maintenance and Durability Corrosive Resistance Load Testing Requirements Use of Lightweight Concrete Construction Cost Life Cycle Cost Analysis
Other ____________________________________________________________________________________ ____________________________________________________________________________________ Figures and Appendices
Vicinity Map Alternative Typical Sections General Layout of the Selected Structure Summary of Structure Type Evaluation Table Summary of Quantities and Cost Estimate Tables Inspection Report Hydraulics Investigation Results Geotechnical Investigation Results
Recommendations ____________________________________________________________________________________ ____________________________________________________________________________________ ____________________________________________________________________________________ ____________________________________________________________________________________ ____________________________________________________________________________________ If you need more space, use an additional sheet(s) of paper.
List of Variances ____________________________________________________________________________________ ____________________________________________________________________________________ ____________________________________________________________________________________ ____________________________________________________________________________________ ____________________________________________________________________________________ If you need more space, use an additional sheet(s) of paper. CDOT Staff Bridge Quality Assurance Sign-off By signing this checklist Staff Bridge Unit Leader or designee acknowledges approval of the Structure Selection Report findings, recommendations, and all design deviations from the CDOT Structural Standards and design criteria.
___________________________ ___________________________ ___________________
Print Name Signature Date
(no name)
Typewritten Text
* CBC Alternative
(no name)
Typewritten Text
* RCP Alternative

Structure I-13-G Structure Alternatives Evaluation Report
APPENDIX C – Construction Cost Estimate
Construction Cost Estimate

Project No.: CDOT #23558 (Stanley #29715) Date: 1/10/2021
Project Name: Region 2 Bridge Bundle Design Build Grant Project
Subject: Quantity Calculations - I-13-G ARCH Alternative
Client: CDOT Region 2
Approx Quantities
Estimated Total Cost
202-00400 Removal of Bridge EACH 90,000.00$ 1 90,000$
206-00000 Structure Excavation CY 20.00$ 187 3,740$
206-00100 Structure Backfill (Class 1) CY 35.00$ 415 14,525$
506-00000 Riprap CY 120.00$ 271 32,520$
510-20100 Structural Plate Arch (Special) LF 1,540.00$ 64 98,560$
601-03040 Concrete Class G (Bridge) CY 900.00$ 63 56,700$
601-40300 Structural Concrete Coating SY 14.00$ 105 1,470$
602-00020 Reinforcing Steel (Epoxy Coated) LB 1.50$ 10320 15,480$
312,995$
30%
406,894$
1664.00
245$
Subtotal of accounted construction items =>
Contingency Multiplier =>
Subtotal of construction items =>
Deck area (SF) =>
Cost per SF =>
ARCH Alternative
Contract Item No.
Item Description UnitEstimated Unit
Cost
TOTAL
Page 1

Project No.: CDOT #23558 (Stanley #29715) Date: 1/10/2021
Project Name: Region 2 Bridge Bundle Design Build Grant Project
Subject: Quantity Calculations - I-13-G CBC Alternative
Client: CDOT Region 2
Approx Quantities
Estimated Total Cost
202-00400 Removal of Bridge EACH 90,000.00$ 1 90,000$
206-00000 Structure Excavation CY 20.00$ 204 4,088$
206-00100 Structure Backfill (Class 1) CY 35.00$ 159 5,582$
506-00000 Riprap CY 120.00$ 42 5,000$
515-00120 Waterproofing (Membrane) SY 22.50$ 293 6,600$
601-03000 Concrete Class G CY 900.00$ 226 203,126$
601-40300 Structural Concrete Coating SY 14.00$ 133 1,856$
602-00020 Reinforcing Steel (Epoxy Coated) LB 1.20$ 55954 67,145$
383,396$
30%
498,415$
1397
357$
CBC Alternative
Contract Item No.
Item Description UnitEstimated Unit
Cost
TOTAL
Subtotal of accounted construction items =>
Contingency Multiplier =>
Subtotal of construction items =>
Deck area (SF) =>
Cost per SF =>
Page 1

Project No.: CDOT #23558 (Stanley #29715) Date: 1/10/2021
Project Name: Region 2 Bridge Bundle Design Build Grant Project
Subject: Quantity Calculations - I-13-G Concrete Bridge Alternative
Client: CDOT Region 2
Approx Quantities
Estimated Total Cost
202-00400 Removal of Bridge EACH 90,000.0$ 1 90,000$
206-00000 Structure Excavation CY 20.00$ 129 2,576$
206-00100 Structure Backfill (Class 1) CY 35.00$ 497 17,406$
420-00102 Geotextile (Erosion Control) (Class 1) SY 7.00$ 242 1,694$
502-00200 Drive Steel Piling LF 18.00$ 900 16,200$
502-00460 Pile Tip EACH 150.00$ 10 1,500$
502-02010 Dynamic Pile Test EACH 3,100.00$ 2 6,200$
502-11253 Steel Piling (HP 12x53) LF 71.00$ 900 63,900$
506-00209 Riprap (9 Inch) CY 120.00$ 361 43,320$
515-00120 Waterproofing (Membrane) SY 22.5$ 258 5,808$
601-03000 Concrete Class G CY 900.00$ 146 131,154$
601-40300 Structural Concrete Coating SY 14.00$ 344 4,813$
602-00020 Reinforcing Steel (Epoxy Coated) LB 1.50$ 32779 49,168$
606-10900 Bridge Rail Type 9 LF 152.00$ 95 14,440$
618-01992 Prestressed Concrete Box (Depth Less Than 32 Inches) SF 60.00$ 736 44,160$
492,338$
30%
640,040$
1935
331$
Subtotal of accounted construction items =>
Contingency Multiplier =>
Subtotal of construction items =>
Deck area (SF) =>
Cost per SF =>
CONCRETE BRIDGE ALTERNATIVE
Contract Item No.
Item Description UnitEstimated Unit Cost
TOTAL
Page 1

Structure I-13-G Structure Alternatives Evaluation Report
APPENDIX D – Geotechnical Report
Geotechnical Report

Yeh and Associates, Inc. 2000 Clay Street, Suite 200
Geotechnical • Geological • Construction Services Denver, CO 80211
(303) 781-9590 www.yeh-eng.com
Colorado California Denver | Colorado Springs | Durango | Glenwood Springs | Grand Junction | Greeley Grover Beach | Ventura
December 11, 2020 Project No. 220-063 Mr. Ron Gibson, P.E. Stanley Consultants
8000 South Chester Street, Suite 500 Centennial, Colorado 80112 Subject: Preliminary Geotechnical Study - DRAFT
Structure I-13-G 23558/23559 Region 2 Bridge Bundle
CDOT Region 2, Colorado Dear Mr. Gibson:
This memorandum presents the results of Yeh and Associates, Inc.’s (Yeh) preliminary geotechnical engineering
study for the proposed replacement of the Bridge Structure I-13-G as part of the CDOT Region 2 Bridge Bundle
Project.
The CDOT Region 2 Bridge Bundle Design-Build Project consists of the replacement of a total of 19 structures
bundled together as a single project. These structures are rural bridges on essential highway corridors (US 350,
US 24, CO 239, and CO 9) in southeastern and central Colorado. These key corridors provide rural mobility, intra-
and interstate commerce, movement of agricultural products and supplies, and access to tourist destinations.
The design-build project consists of 17 bridges and two Additionally Requested Elements (ARE) structures.
This design-build project is jointly funded by the USDOT FHWA Competitive Highway Bridge Program grant (14
structures, Project No. 23558) and the Colorado Bridge Enterprise (five structures, Project No. 23559). These
projects are combined to form one design-build project. The two ARE structures are part of the five bridges
funded by the Colorado Bridge Enterprise.
The nineteen bridges identified to be included in the Region 2 Bridge Bundle were selected based on similarities
in the bridge conditions, risk factors, site characteristics, and probable replacement type, with the goal of
achieving economy of scale. Seventeen of the bridges being replaced are at least 80 years old. Five of the bridges
are Load Restricted, limiting trucking routes through major sections of the US 24 and US 350 corridors. The
bundle includes nine timber bridges, four concrete box culverts, one corrugated metal pipe (CMP), four concrete
I-beam bridges, and one I-beam bridge with corrugated metal deck.
1 PROJECT UNDERSTANDING
Bridge I-13-G is part of the Region 2 Bridge Bundle Design-Build Project. Our preliminary geotechnical study was
completed to support the 30% design level that will be included in the design-build bid package. We understand
the existing structure will be replaced with either a concrete box culvert (CBC) or a bridge structure. The new

Preliminary Geotechnical Study – Structure I-13-G Project No. 220-063 23558/23559 R2 Bridge Bundle December 11, 2020
2
structure will be constructed along the current roadway alignment and existing roadway grade will be
maintained. No significant cut or fills are required for construction of the proposed replacement structure.
2 SUBSURFACE CONDITIONS
Two bridge borings, I-13-G-B-1 and I-13-G-B-2, were drilled by Yeh in the vicinity of the existing bridge, and two
pavement borings, I-13-G-P-1 and I-13-G-P-2, were drilled along the existing pavement approximately 250 feet
from the bridge. The approximate boring locations are shown on the engineering geology sheet in Appendix A.
The legend and boring logs are included in Appendix B. Laboratory test results are provided in Appendix C and
are shown on the boring logs.
The bridge borings encountered variable amounts of lean clay, sand, and gravel overlying sandstone bedrock.
Table 1 provides a summary of the bedrock and groundwater conditions for the bridge borings. The surface
elevations, approximate bedrock depths/elevations, and approximate groundwater depths/elevations are
presented to the nearest 0.5 feet. The groundwater depths and elevations are based on observations during
drilling.
Table 1. Summary of Bedrock and Groundwater Conditions
Boring ID Location1
(Northing, Easting)
Ground Surface
Elevation at Time of
Drilling1 (feet)
Approx. Depth to
Top of Competent
Bedrock1 (feet)
Approx. Elevation to
Top of Competent
Bedrock1 (feet)
Approx. Groundwater
Depth1, 2
(feet)
Approx. Groundwater Elevation 1, 2
(feet)
I-13-G -B-1
398454.5, 871499.5
9124.5 95.0 9029.5 30.0 9094.5
I-13-G -B-2
398450.9, 871411.7
9125.0 Not
Encountered Not
Encountered 27.0 9098.0
Notes:
(1) Surface elevations, approximate bedrock depths/elevations, and approximate groundwater depths/elevations are presented to the nearest 0.5 feet. Location and elevation are provided by project surveyor.
(2) Groundwater depths and elevations are based on observations during drilling.
3 BRIDGE FOUNDATION RECOMMENDATIONS
We understand that the replacement structure will consist of either a new bridge structure or a concrete box
culvert structure (CBC). If a bridge structure is selected, then the abutments and piers will be supported on
driven H-piles or drilled shafts. If CBC structure is selected, then the structure will be founded on a shallow mat
foundation. Wing walls for the bridge and CBC structures will be founded on shallow strip foundations.
Based on the subsurface conditions encountered during our preliminary study, engineering analysis, and
experience with similar projects it is our opinion that driven H-pile and drilled shaft foundations are suitable for
support of the bridge structure. Shallow foundations are suitable for support of the CBC and wing wall structures.
Recommendations for the drilled shafts are presented in Section 3.2, driven H-pile recommendations are
provided in Section 3.3, and CBC foundation recommendations are presented in Section 3.4.
The soil and bedrock properties were estimated from penetration resistance, material descriptions, and
laboratory data. The design and construction of the foundation elements should comply with all applicable
requirements and guidelines listed in AASHTO (2020) and the CDOT Standard Specifications (CDOT 2019).

Preliminary Geotechnical Study – Structure I-13-G Project No. 220-063 23558/23559 R2 Bridge Bundle December 11, 2020
3
Shallow Foundation Recommendations
Based on the depth to competent bedrock and the anticipated loading requirements, it is our opinion that
shallow foundations are not suitable to support the bridge abutments.
Drilled Shaft Recommendations
3.2.1 Drilled Shaft Nominal Axial Resistance
The estimated bearing resistance should be developed from the side and tip resistance in the underlying
competent bedrock or the stiff gravelly clay at about 55 feet BGS. The resistance from the overburden soil
should be neglected. The design approach in Abu-Hejleh et al. (2003) provides recommendations for the use of
an updated Colorado SPT-based (UCSB) design method. In this design method, the nominal side and tip
resistance of a drilled shaft in the sedimentary bedrock is proportional to the driven sampler penetration
resistance. This approach was generally used to estimate the axial resistance. Based on local practice, the
modified California penetration resistance is considered to be equivalent to a standard penetration test (SPT)
penetration resistance, i.e. N value, in bedrock.
Table 2a and 2b contain the recommended values for the nominal side and tip resistance for drilled shafts
founded in the underlying competent bedrock and gravelly clay, respectively. The upper three feet of competent
bedrock penetration shall not be used for drilled shaft resistance due to the likelihood of construction
disturbance and possible additional weathering. To account for axial group effects, the minimum spacing
requirements between drilled shafts should be three diameters from center-to-center.
Table 2a. Recommended Drilled Shaft Axial Resistance- Founded in Rock
Reference Boring
Approximate Top of Competent
Bedrock Elevation (feet)
Tip Resistance (ksf) Side Resistance, (ksf)
Nominal Factored (Φ=0.5)
Nominal Factored
(Φ=0.45)
I-13-G-B-1 9029.5 43 21.5 3.5 1.58
I-13-G-B-2 Not Encountered
Table 2b. Recommended Drilled Shaft Axial Resistance – Founded in Soil
Reference Boring
Approximate Top of Bearing Soil Elevation (feet)
Tip Resistance (ksf) Side Resistance, (ksf)
Nominal Factored (Φ=0.40)
Nominal Factored
(Φ=0.45)
I-13-G-B-1 9069.5 24 9.6 1.9 0.86
I-13-G-B-2 9070.0 21 8.4 1.7 0.77
3.2.2 Drilled Shaft Lateral Resistance
The input parameters provided in Table 3 are recommended for use with the computer program LPILE to develop
the soil models used to evaluate the drilled shaft response to lateral loading. Table 3 provides the estimated
values associated with the soil types encountered in the borings. They can also be used for driven H-piles, which
will be described in Section 3.3. The nature and type of loading should be considered carefully. Individual soil

Preliminary Geotechnical Study – Structure I-13-G Project No. 220-063 23558/23559 R2 Bridge Bundle December 11, 2020
4
layers and their extent can be averaged or distinguished by referring to the boring logs at the locations of the
proposed bridge. The soils and/or bedrock materials prone to future disturbance, such as from utility
excavations or frost heave, should be neglected in the lateral load analyses to the depth of disturbance, which
may require more than but should not be less than three feet.
Recommendations for p-y multiplier values (Pm values) to account for the reduction in lateral capacity due to
group effects are provided in Section 10.7.3.12 of AASHTO (2020). The Pm value will depend on the direction of
the applied load, center-to-center spacing, and location of the foundation element within the group.
Table 3. LPILE Parameters
Soil Type LPILE Soil Criteria
Effective Unit Weight (pcf)
Friction Angle, (deg.)
Undrained Cohesion,
(psf)
Strain Factor,
ε50
p-y modulus kstatic (pci)
AGT1 BGT2 AGT1 BGT2
Class 1 Structure Backfill
Sand (Reese)
130 67.5 34 - - 90 60
Clay Stiff Clay w/o Free
Water (Reese) 120 57.5 - 200 0.01 - -
Sandy Clay Stiff Clay w/o Free
Water (Reese) 120 57.5 - 1,800 0.007 - -
Clayey Gravel, Sand with Gravel, Clayey
Sand
Sand w/o Free Water (Reese)
125 62.5 33 - - 90 60
Shale Bedrock Stiff Clay w/o Free
Water (Reese) 130 130 - 8,000 0.004 - -
Note: 1Above Groundwater Table 2Below Groundwater Table
3.2.3 General Drilled Shaft Recommendations
The following recommendations can be used in the design and construction of the drilled shafts.
• Groundwater and potentially caving soils may be encountered during drilling depending on the time of
year and location. The Contractor shall construct the drilled shafts using means and methods that
maintain a stable hole.
• Bedrock may be very hard at various elevations. The contractor should mobilize equipment of sufficient
size and operating condition to achieve the required design bedrock penetration.
• Drilled shaft construction shall not disturb previously installed drilled shafts. The drilled shaft concrete
should have sufficient time to cure before construction on a drilled shaft within three shaft diameters
(center to center spacing) begins to prevent interaction between shafts during excavation and concrete
placement.
• Based on the results of the field investigation and experience with similar properly constructed drilled
shaft foundations, it is estimated that foundation settlement will be less than approximately ½ inch
when designed according to the criteria presented in this report. Drilled shafts founded in soil will have
an estimated settlement of 1-inch.
• A representative of the Contractor’s engineer should observe drilled shaft installation operations on a
full-time basis.

Preliminary Geotechnical Study – Structure I-13-G Project No. 220-063 23558/23559 R2 Bridge Bundle December 11, 2020
5
Driven H-pile Recommendations
3.3.1 Driven H-pile Axial Resistance
Steel H-piles may be designed for a nominal axial resistance equal to 28 kips per square inch (ksi) multiplied by
the cross sectional area of the pile for piles composed of Grade 50 ksi steel for use with LRFD Strength Limit
State design. Piles should be driven to the nominal resistance and have a minimum penetration of 55 feet below
the existing ground surface. A wave equation analysis using the Contractor’s pile driving equipment is necessary
to estimate pile drivability.
3.3.2 Driven H-Pile Axial Resistance Factors
Assuming a pile driving analyzer (PDA) is used to monitor pile driving per Section 502 of CDOT (2019), a resistance
factor of 0.65 may be used per AASHTO (2020) Table 10.5.5.2.3-1. Section 502.05 of CDOT (2019) stipulates that
if PDA is used, a minimum of one PDA monitoring per bridge bent be performed to determine the condition of
the pile, efficiency of the hammer, static bearing resistance of the pile, and to establish pile driving criteria. Per
AASHTO (2020) recommendations, a resistance factor of 0.5 can be used for wave equation analysis only without
pile dynamic measurements such as PDA monitoring. Per AASHTO (2020) recommendations, a resistance factor
of 0.75 may be used if a successful static load test is conducted per site condition.
3.3.3 Driven H-Pile Lateral Resistance
The information provided previously in Section 3.2.2 may be used to evaluate H-pile lateral resistance.
3.3.4 General Driven H-Pile Recommendations
The following recommendations are for the design and construction of driven H-piles.
1. Based on the results of the field exploration and our experience with similar properly constructed driven
pile foundations, it is estimated that settlement will be approximately 1 inch when designed according
to the criteria presented in this report.
2. A minimum spacing requirement for the piles should be three diameters (equivalent) center to center.
3. Driven piles should be driven with protective cast steel pile points or equivalent to provide better pile
tip seating and to prevent potential damage from coarse soil particles, which may be present at the site.
4. A qualified representative of the Contractor’s engineer should observe pile-driving activities on a full-
time basis. Piles should be observed and checked for crimping, buckling, and alignment. A record should
be kept of embedment depths and penetration resistances for each pile.
5. It is estimated that the piles will penetrate approximately 3 to 5 feet into competent bedrock (see Table
1 for the estimated elevation for the top of competent bedrock). The final tip elevations will depend
on bedrock conditions encountered during driving.
6. If the pile penetration extends below the estimated pile penetration into bedrock by 10 feet or more,
the pile driving operations should be temporarily suspended for dynamic monitoring with PDA. We
recommend that the subject pile be allowed to rest overnight or longer before restriking and monitoring
the beginning-of-restrike with a PDA. The data collected with the PDA shall then be reduced using the
software CAPWAP to determine the final nominal pile resistance. The pile driving criteria may be
modified by CDOT’s or the Contractor’s engineer based on the PDA/CAPWAP results.

Preliminary Geotechnical Study – Structure I-13-G Project No. 220-063 23558/23559 R2 Bridge Bundle December 11, 2020
6
CBC Foundation Recommendations
To assure adequate foundation support and to minimize the potential for differential settlement, we
recommend that the exposed subgrade soils should be scarified a minimum of 6 inches; moisture conditioned,
and re-compacted in accordance with Section 203.07 of the CDOT Standard Specifications (2019) before the
placement of structural elements or structural backfill. If unsuitable or soft materials are encountered after the
excavation, the materials may be removed and replaced with CDOT Class 1 Structure Backfill in accordance with
Section 203.07 of the CDOT Standard Specifications (2019). Visual inspection of the foundation excavations
should be performed by a qualified representative of the Geotechnical Engineer of record to identify the quality
of the foundation materials prior to placement of backfill and the CBC. Groundwater may be encountered during
excavation for the subgrade preparation. Groundwater control systems may be required to prevent seepage
migrating into the construction zone by creating groundwater cut-off and/or dewatering systems.
The recommended nominal bearing resistance using Strength Limit State for the CBC and associated wing walls
for both moist and saturated conditions are provided in Table 4. We assume the materials in contact with the
bottom of the proposed CBC and wing walls will consist of native, medium stiff to stiff sandy clay and/or clay
with sand or CDOT Class 1 Structure Backfill placed in accordance with Section 203.07 of the CDOT Standard
Specifications (2019). The reduced footing width due to eccentricity can be calculated based on the
recommendations in Sections 11.6.3.2 and 11.10.5.4 of AASHTO (2020). A bearing resistance factor of 0.45 may
be used for shallow foundations based on the recommendations in Table 10.5.5.2.2-1 of AASHTO (2020).
Table 4. Bearing Resistance for CBC and Wing Walls on Shallow Foundation
Soil Conditions Nominal Bearing Resistance (ksf) 1, 2
Moist 2.5 + 1.3*B’
Saturated 1.3 + 0.7*B’
1 B’ is the footing width in feet reduced for eccentricity (e). B’ = B - 2e, where B is the nominal foundation width. 2 The calculated nominal bearing resistance shall be limited to 15 ksf.
The proposed CBC will be at the location of the existing bridge and as needed, portion of the CBC will be in a cut
area, therefore it is estimated that the total settlement of the structure will be minimal and will occur during
construction. The structure settlement is partially controlled by the weight of the adjacent embankment fill.
Thus, it is recommended that the embankment fill on both sides of the CBC be placed at a relatively uniform
elevation.
Resistance to sliding at the bottom of foundations can be calculated based on a coefficient of friction at the
interface between the pre-cast concrete and the existing native soils or compacted CDOT Class 1 Structure
Backfill. The recommended nominal coefficients of friction and the corresponding resistance factors for Class 1
Structure Backfill and native soils are provided in Table 5.
Table 5. Coefficients of Friction for CBC and Wing Walls on Shallow Foundation
Foundation Soil Type Coefficient of Friction Resistance Factor
Class 1 Structure Backfill 0.53 0.9
Native Clay 0.30 0.8

Preliminary Geotechnical Study – Structure I-13-G Project No. 220-063 23558/23559 R2 Bridge Bundle December 11, 2020
7
Backfill adjacent to the CBC should be Class 1 Structure Backfill, compacted with moisture density control.
Backfill materials shall have a Class 0 for severity of sulfate exposure. Fill should be tested for severity of sulfate
exposure prior to acceptance.
The passive pressure against the sides of the foundation is typically ignored; however, passive resistance can be
used if long-term protection from disturbance, such as frost heave, future excavations, etc., is assured. Table 6
presents recommendations for the passive soil resistances for the encountered soil conditions. The passive
resistance estimates are calculated from Figure 3.11.5.4-1 in AASHTO (2020) where a portion of the slip surface
is modeled as a logarithmic spiral, the backslope is horizontal and the passive soil/concrete interface friction
angle is equal to 60 percent of the soil’s friction angle.
The recommended passive earth pressure resistances are presented in terms of an equivalent fluid unit weight
for moist and saturated conditions. The recommended passive earth pressure values assume mobilization of
the nominal soil/concrete foundation interface shear strength. A suitable resistance factor should be included
in the design to limit the strain, which will occur at the nominal shear strength, particularly in the case of passive
resistance. The resultant passive earth force, calculated from the equivalent fluid unit weight, should be applied
at a point located 1/3 of the height of the soil (in contact with the foundation) above the base of the foundation,
directed upward at an angle of 20 degrees from the horizontal.
Table 6. Passive Soil Resistance for CBC
Passive Soil Resistance
Soil Type Nominal Resistance Resistance Factor
Moist 332 psf/ft 0.50
Saturated 166 psf/ft 0.50
Lateral Earth Pressures
External loads used in the analyses of the bridge abutments and wing walls should include earth pressure loads,
traffic loads, and any other potential surcharge loads. Typical drainage details consisting of inlets near the
abutments, geocomposite strip drains, and perforated pipes shall be included in the design to properly contain
and transfer surface and subsurface water without saturating the soil around the abutments and walls.
All abutment and wing wall backfill materials should meet the requirements for CDOT Structure Backfill Class 1
in accordance with CDOT (2019). All backfill adjacent to the abutments and walls shall be placed and compacted
in accordance with CDOT (2019). It is recommended that compaction of backfill materials be observed and
evaluated by an experienced Contractor’s engineer or Contractor’s engineer’s representative.
A lateral wall movement or rotation of approximately 0.1 to 0.2 percent of the wall height may be required to
mobilize active earth pressure for the recommended backfill materials. If the estimated wall movement is less
than this amount, an at-rest soil pressure should be used in design. In order to mobilize passive earth pressure,
lateral wall movement or rotation of approximately 1.0 to 2.0 percent of the wall height may be required for the
recommended backfill materials. It should be carefully considered if this amount of movement can be accepted
before passive earth pressure is used in the design.
Earth pressure loading within and along the back of the bridge abutments and wing walls shall be controlled by the structural backfill. We recommend that active, at-rest, and passive lateral earth pressures used for the design of the structures be based on an effective angle of internal friction of 34 degrees, and a unit weight of

Preliminary Geotechnical Study – Structure I-13-G Project No. 220-063 23558/23559 R2 Bridge Bundle December 11, 2020
8
135 pounds per cubic foot (pcf) for CDOT Structure Backfill Class 1. The following can be used for design assuming a horizontal backslope:
• Active earth pressure coefficient (ka) of 0.28
• Passive earth pressure coefficient (kp) of 3.53
• At-rest earth pressure coefficient (k0) of 0.44
Lateral earth pressures for a non-horizontal backslope can be estimated using section 3.11 in AASHTO (2020).
Bridge Scour Parameters
A bulk sample of the creek bed soils/rock below the existing bridge was collected for gradation analysis. The
results of the grain size analysis are presented in Appendix C.
4 BRIDGE APPROACH PAVEMENT
Pavement borings were located approximately 250 feet beyond the existing bridge abutments on each side.
Prior to drilling, the existing pavement was cored with a 4-inch nominal diameter core barrel. Photos of the
pavement core, logs of the subsurface soils/rock, and results of geotechnical and analytical laboratory testing
are presented in the appendices. Bulk soil samples were collected from the pavement borings and combined for
classification, strength (R-value), and analytical testing. The asphalt pavement thicknesses, aggregate base
thicknesses (if present), subgrade soil classifications, and subgrade R-values are presented in Table 7. Analytical
test results are presented in Table 8. Preliminary pavement design will be completed by CDOT Staff Materials.
Table 7. Existing Pavement Section and Subgrade Properties
Boring ID Existing Asphalt
Concrete Thickness (in)
Aggregate Base Thickness (in)
Subgrade Soil Classification
(AASHTO)1
R-Value1
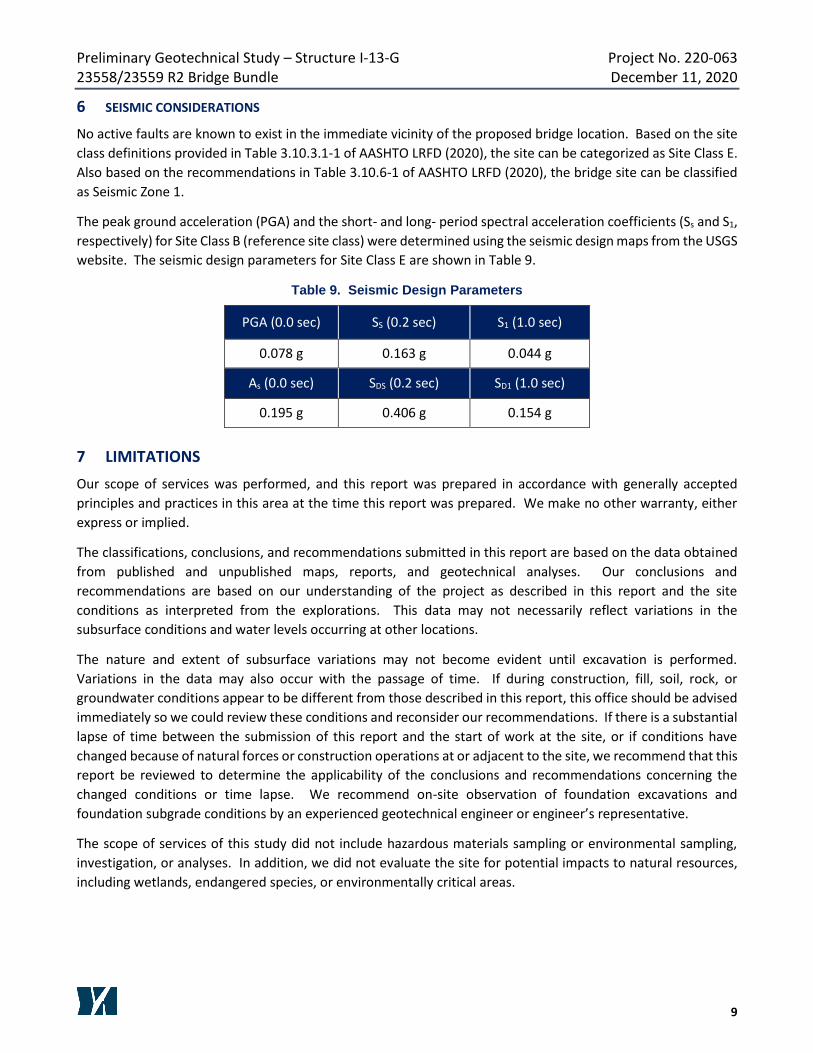
I-13-G-P-1 7.0 Not Encountered A-6 (6) 7
I-13-G-P-2 8.5 Not Encountered
1. Subgrade Classification and R-value test results based on combined bulk sample from each pavement boring.
5 ANALYTICAL TEST RESULTS
Analytical testing was completed on representative samples of soils encountered in the borings. The test results
can be found in Appendix C and are summarized in Table 8. The Analytical results should be used to select the
proper concrete type for the project in accordance with CDOT Standard Specifications (2019). A qualified
corrosion engineer should review the laboratory data and boring logs to determine the appropriate level of
corrosion protection for materials in contact with these soils.
Table 8. Analytical Test Results
Boring ID Material Water Soluble
Sulfates, % Water Soluble Chlorides, %
pH Resistivity,
ohm-cm
I-13-G-P-1/P-2 Lean Clay (Fill) 0.008 0.0127 - -
I-13-G-B-1 Silty Sand 0.579 0.0004 7.9 1487
I-13-G-B-2 Gravelly Lean Clay 0.382 0.0003 7.1 655
Preliminary Geotechnical Study – Structure I-13-G Project No. 220-063 23558/23559 R2 Bridge Bundle December 11, 2020
9
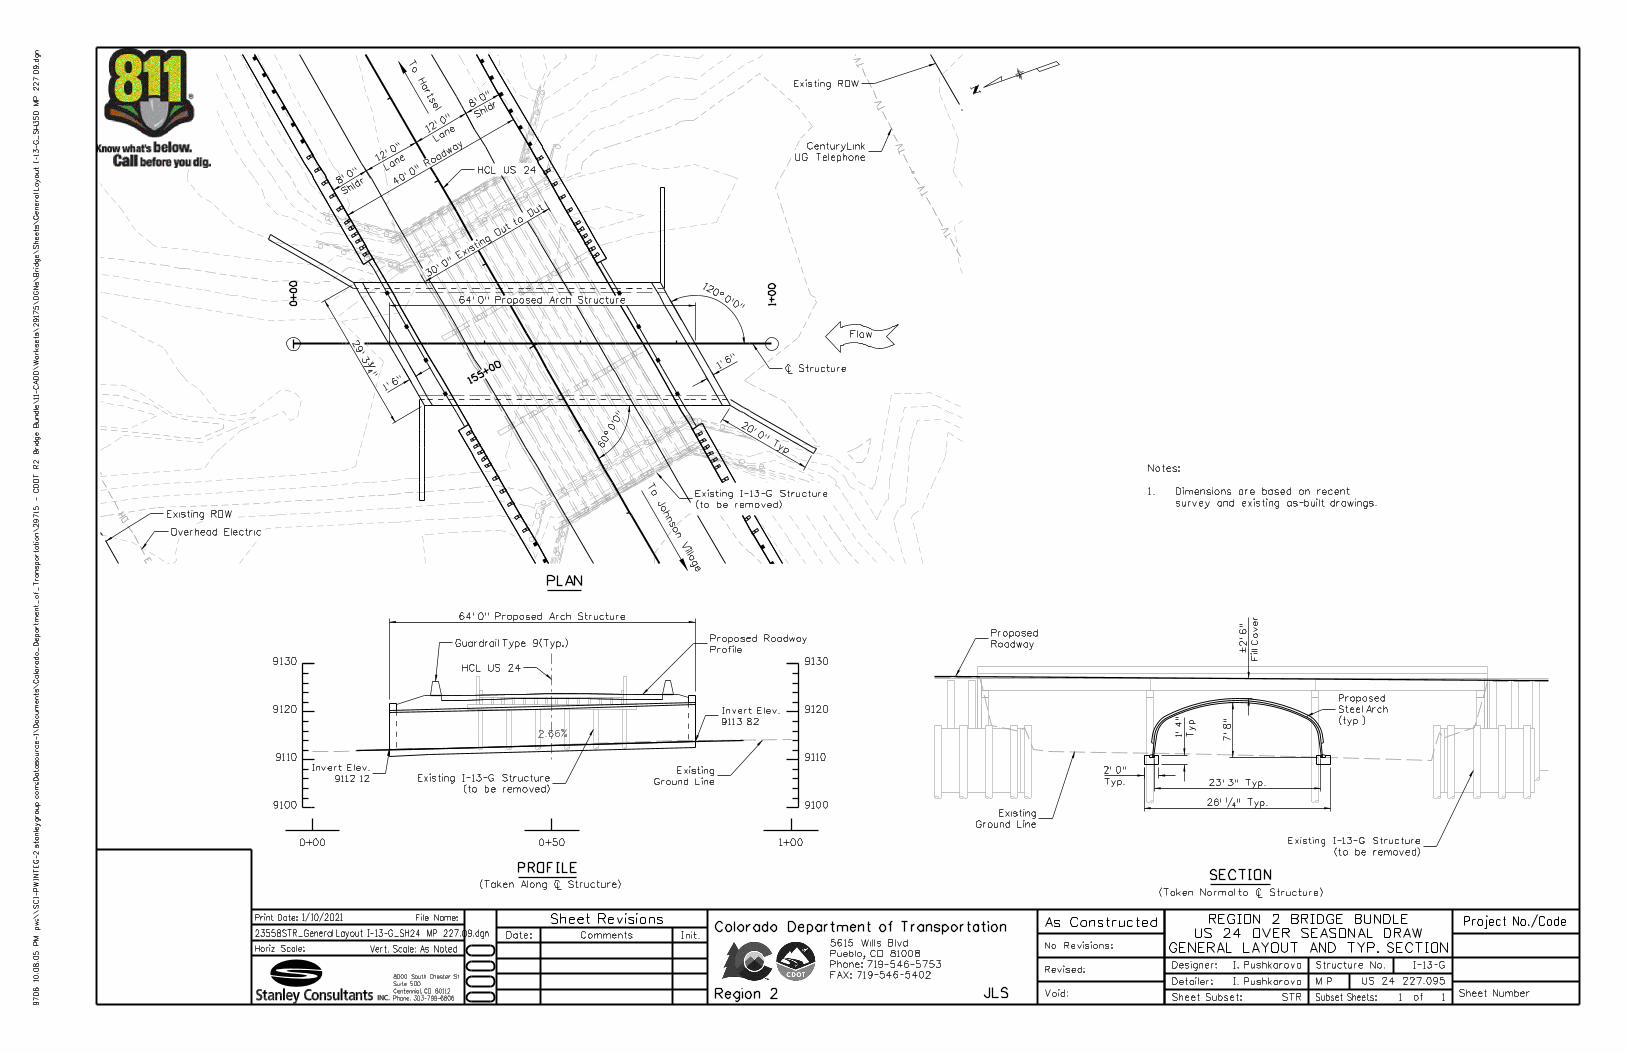
6 SEISMIC CONSIDERATIONS
No active faults are known to exist in the immediate vicinity of the proposed bridge location. Based on the site
class definitions provided in Table 3.10.3.1-1 of AASHTO LRFD (2020), the site can be categorized as Site Class E.
Also based on the recommendations in Table 3.10.6-1 of AASHTO LRFD (2020), the bridge site can be classified
as Seismic Zone 1.
The peak ground acceleration (PGA) and the short- and long- period spectral acceleration coefficients (Ss and S1,
respectively) for Site Class B (reference site class) were determined using the seismic design maps from the USGS
website. The seismic design parameters for Site Class E are shown in Table 9.
Table 9. Seismic Design Parameters
PGA (0.0 sec) SS (0.2 sec) S1 (1.0 sec)
0.078 g 0.163 g 0.044 g
As (0.0 sec) SDS (0.2 sec) SD1 (1.0 sec)
0.195 g 0.406 g 0.154 g
7 LIMITATIONS
Our scope of services was performed, and this report was prepared in accordance with generally accepted
principles and practices in this area at the time this report was prepared. We make no other warranty, either
express or implied.
The classifications, conclusions, and recommendations submitted in this report are based on the data obtained
from published and unpublished maps, reports, and geotechnical analyses. Our conclusions and
recommendations are based on our understanding of the project as described in this report and the site
conditions as interpreted from the explorations. This data may not necessarily reflect variations in the
subsurface conditions and water levels occurring at other locations.
The nature and extent of subsurface variations may not become evident until excavation is performed.
Variations in the data may also occur with the passage of time. If during construction, fill, soil, rock, or
groundwater conditions appear to be different from those described in this report, this office should be advised
immediately so we could review these conditions and reconsider our recommendations. If there is a substantial
lapse of time between the submission of this report and the start of work at the site, or if conditions have
changed because of natural forces or construction operations at or adjacent to the site, we recommend that this
report be reviewed to determine the applicability of the conclusions and recommendations concerning the
changed conditions or time lapse. We recommend on-site observation of foundation excavations and
foundation subgrade conditions by an experienced geotechnical engineer or engineer’s representative.
The scope of services of this study did not include hazardous materials sampling or environmental sampling,
investigation, or analyses. In addition, we did not evaluate the site for potential impacts to natural resources,
including wetlands, endangered species, or environmentally critical areas.

Preliminary Geotechnical Study – Structure I-13-G Project No. 220-063 23558/23559 R2 Bridge Bundle December 11, 2020
10
8 REFERENCES
AASHTO LRFD, 9th Edition. AASHTO Load Resistance Factor Design (LRFD) Bridge Design Specifications, Eight
Edition. Washington, DC: American Association of State Highway and Transportation Officials. 2020.
Abu-Hejleh, N., O’Neill, M.W., Hanneman, Dennis, Atwooll, W.J., 2003. Improvement of the Geotechnical Axial
Design Methodology for Colorado’s Drilled Shafts Socketed in Weak Rocks, Final Report: Colorado Department
of Transportation Research Branch, July 2003, Report No. CDOT-DTD-R-2003-6.
Colorado Department of Transportation, 2019. CDOT Standard Specifications for Road and Bridge Construction.
2019 Edition.
Respectfully Submitted, YEH AND ASSOCIATES, INC. Prepared by: Reviewed by: Brett Lykins JG T. McCall, PE Staff Engineer Senior Project Engineer Independent Technical Review by: Hsing-Cheng Liu, PE, PhD Senior Project Manager Attachments: Appendix A Appendix B Appendix C
DRAFTDRAFT
DRAFT

Preliminary Geotechnical Study – Structure I-13-G Project No. 220-063 23558/23559 R2 Bridge Bundle December 11, 2020
A
APPENDIX A
ENGINEERING GEOLOGY SHEET

TM
EXISTING GROUND
EXISTING BRIDGE
Numbers
Structure
No Revisions:
Revised:
Void: Sheet Subset:
Detailer:
Designer:
GeologySheet Number
Subset Sheets:
Init.CommentsDate:
Sheet Revisions As Constructed12/4/2020Print Date:
Horiz. Scale:1:50 Vert. Scale: As Noted
Unit Leader Initials
Project No./CodeFile Name:
Unit Information
mwalz 1:5
6:3
3
PM
pw:\\cdot-p
w.b
entle
y.c
om:c
dot-p
w-01P\
Docu
ments\
01
Major Projects\
R2
B2 (R
EGIO
N 2
BRID
GE
BU
ND
LE)\
Legacy
Data\
23558 -
R2
B2 (R
EGIO
N 2
BRID
GE
BU
ND
LE) (G
RA
NT)\
Materials
_Geotechnic
al\
Dra
win
gs\
23558
GE
OT_
Engin
eerin
g
Geolo
gy I-13-
G.d
gn
23558GEOT_Engineering Geology I-13-G.dgn
Yeh and Associates, Inc.Geotechnical · Geological · Construction Services
JTM
MJW
23558
STM R200-262
Colorado Department of Transportation
Region 2
FAX: 719-227-3298
Phone: 719-634-2323
Colorado Springs, CO 80906
1480 Quail Lake Loop, Suite A
50'0' 25' 100'
ENGINEERING GEOLOGY
R2 BRIDGE BUNDLE
1 of 1
BORING LOCATION
9120
9110
9100
9090
9080
9070
Sample Type
Graphic
Groundwater
Levels
##
Boring No.
TYPICAL BOREHOLE LOG
Penetration Resistance
(Blows per foot -OR-
inches of penetration)*
Material Description
Graphics
(see Legend)
with a penetration of 3 inches.
that 50 blows were applied to the sampler,
*e.g. A value of 50/3 or 50:3" indicates
Modified California Sampler
Split Spoon Sampler
LEGEND
9060
9130
I-13-G B-2I-13-G P-2
I-13-G B-1 I-13-G P-1
I-13-G P-1I-13-G B-2
I-13-G P-2
I-13-G B-1
I-13-G
9060
9070
9080
9090
9100
9110
9120
91306
4
44
5
4
8
12
12
17
22
19
13
28
17
31
22
30
24
8
3
4
8
15
15
15
16
21
28
24
25
25
20
34
49
39
47
54
50:6"
35
7
4
920
9050
9040
9030
9020
9050
9040
9030
9020
US 24
AsphaltUSCS ClayeySand
Fill
Low PlasticitySandy Clay
Low PlasticityGravelly Clay
USCS Lean/LowPlasticity Clay
USCS Silty SandUSCS ClayeyGravel
USCS ClayeySand
WeatheredBedrock
Sandstone Shale

Preliminary Geotechnical Study – Structure I-13-G Project No. 220-063 23558/23559 R2 Bridge Bundle December 11, 2020
B
APPENDIX B
KEY TO BORING LOGS
BORING LOGS
PAVEMENT CORE PHOTOS

CDOT Region 2 Bridge Bundle
Project Number: 220-063
Legend for Symbols Used on Borehole Logs
Project:
Lab Test Standards Other Lab Test Abbreviations
Notes
Moisture Content ASTM D2216Dry Density ASTM D7263Sand/Fines Content ASTM D421, ASTM C136,
ASTM D1140Atterberg Limits ASTM D4318AASHTO Class. AASHTO M145,
ASTM D3282USCS Class. ASTM D2487(Fines = % Passing #200 SieveSand = % Passing #4 Sieve, but not passing #200 Sieve)
Sample Types
Asphalt Cobbles and gravel USCS Fat/HighPlasticity Clay
USCS Lean/LowPlasticity Clay
Fill with Clay as majorsoil
Fill with Gravel asmajor soil USCS Clayey Gravel USCS Silty, Clayey
Gravel
USCS Poorly-gradedGravel
USCS Poorly-gradedGravel with Clay
Low Plasticity GravellyClay USCS Silt
USCS Low PlasticityOrganic silt or clay
High Plasticity SandyClay
Poorly-graded SandyGravel
Low Plasticity SandyClay
USCS Clayey Sand USCS Clayey Sand USCS Silty Sand USCS Poorly-gradedSand
Lithology Symbols
Drilling Methods
Bulk Sample ofauger/odex cuttings Rock core
Modified CaliforniaSampler(2.5 inch OD, 2.0 inchID)
Standard PenetrationTest(ASTM D1586)
CORING
(see Boring Logs for complete descriptions)
2. "Penetration Resistance" on the Boring Logs refers to the uncorrected N value for SPT samples only, as per ASTMD1586. For samples obtained with a Modified California (MC) sampler, drive depth is 12 inches, and "PenetrationResistance" refers to the sum of all blows. Where blow counts were > 50 for the 3rd increment (SPT) or 2nd increment(MC), "Penetration Resistance" combines the last and 2nd-to-last blows and lengths; for other increments with > 50blows, the blows for the last increment are reported.
4. "ER" for the hammer is the Reported Calibrated Energy Transfer Ratio for that specific hammer, as provided by thedrilling company.
1. Visual classifications are in general accordance with ASTM D2488, "Standard Practice for Description andIdentification of Soils (Visual-Manual Procedures)".
3. The Modified California sampler used to obtain samples is a 2.5-inch OD, 2.0-inch ID (1.95-inch ID with liners),split-barrel sampler with internal liners, as per ASTM D3550. Sampler is driven with a 140-pound hammer, dropped 30inches per blow.
Diorite Gneiss Granite Limestone
Sandstone Shale Weathered Bedrock
pH Soil pH (AASHTO T289-91)S Water-Soluble Sulfate Content (AASHTO T290-91,
ASTM D4327)Chl Water-Soluble Chloride Content (AASHTO T291-91,
ASTM D4327)S/C Swell/Collapse (ASTM D4546)UCCS Unconfined Compressive Strength
(Soil - ASTM D2166, Rock - ASTM D7012)R-Value Resistance R-Value (ASTM D2844)DS (C) Direct Shear cohesion (ASTM D3080)DS (phi) Direct Shear friction angle (ASTM D3080)Re Electrical Resistivity (AASHTO T288-91)PtL Point Load Strength Index (ASTM D5731)
HOLLOW-STEMAUGER
CORING
A-7-6 (3)SC
S/C=0.3%41.3 41 1718.6 100.2
7
4
9
20
3-4
2-2
3-6
7-13
0.0 - 0.6 ft. ASPHALT (7 inches).
0.6 - 7.0 ft. Clayey SAND with gravel(SC) (Fill), brown, moist, very loose toloose.
7.0 - 10.0 ft. Sandy lean CLAY withgravel (CL), brown, moist, stiff to verystiff.
Bottom of Hole at 10.0 ft.
29.0 29.7
Night Work:
--
--
--
Logged By: C. Wallace
Final By: J. McCall
SymbolDepthDate
Total Depth: 10.0 ft
Ground Elevation: 9125.5
Coordinates: N: 398499.3 E: 871735.3
Location: US 24, westbound outside lane
Weather Notes: Clear, 60s
Inclination from Horiz.: Vertical
Boring Began: 9/24/2020
Boring Completed: 9/24/2020
Drilling Method(s): Coring /
Hollow-Stem Auger
Driller: Vine Laboratories
Drill Rig: CME 750X Buggy
Hammer: Automatic (hydraulic), ER: 80%
Groundwater Levels: Not Observed
Project Number: 220-063 Boring No.: I-13-G P-1
Dril
ling
Met
hod
Sam
ple
Typ
e/D
epth
ProjectName:
Dep
th(f
eet)
5
10
CDOT Region 2 Bridge Bundle
AtterbergLimits
Ele
vatio
n(f
eet)
9125
9120
9115
9110
9105
PAGE1 of 1
AASHTO& USCSClassifi-cations
Field Notesand
Other LabTests
Fin
es C
onte
nt(%
)
Liqu
idLi
mit
Pla
stic
ityIn
dex
BO
RIN
G L
OG
201
9 -
SP
T C
DO
T S
TY
LE 2
20-0
63 R
2 B
RID
GE
BU
ND
LE.G
PJ
201
9 Y
EH
CO
LOR
AD
O T
EM
PLA
TE
.GD
T 2
019
YE
H C
OLO
RA
DO
LIB
RA
RY
.GLB
12/
4/20
Moi
stur
eC
onte
nt (
%)
Dry
Den
sity
(pcf
)
Soil Samples
Pen
etra
tion
Res
ista
nce
Blowsper6 in
Material Description
Lith
olog
y
Gra
vel C
onte
nt(%
)
San
d C
onte
nt(%
)

A-6 (5)CL
S/C=0%50.9 35 1615.8 108.4
6
4
4
4
3-3
2-2
2-2
2-2
0.0 - 0.7 ft. ASPHALT (8.5 inches).
0.7 - 8.0 ft. Gravelly lean CLAY withsand (CL) (Fill), brown to light brown,moist, medium stiff.
8.0 - 10.0 ft. Sandy lean CLAY withgravel (CL), dark brown to black, moist,medium stiff, rich in organic material.
Bottom of Hole at 10.0 ft.
32.0 17.1
Night Work:
--
--
--
Logged By: C. Wallace
Final By: J. McCall
SymbolDepthDate
Total Depth: 10.0 ft
Ground Elevation: 9130
Coordinates: N: 398406.7 E: 871171.0
Location: US 24, eastbound outside lane
Weather Notes: Clear, 60s
Inclination from Horiz.: Vertical
Boring Began: 9/23/2020
Boring Completed: 9/23/2020
Drilling Method(s): Coring /
Solid-Stem Auger
Driller: Vine Laboratories
Drill Rig: CME 750X Buggy
Hammer: Automatic (hydraulic), ER: 80%
Groundwater Levels: Not Observed
Project Number: 220-063 Boring No.: I-13-G P-2
Dril
ling
Met
hod
Sam
ple
Typ
e/D
epth
ProjectName:
Dep
th(f
eet)
5
10
CDOT Region 2 Bridge Bundle
AtterbergLimits
Ele
vatio
n(f
eet)
9125
9120
9115
9110
PAGE1 of 1
AASHTO& USCSClassifi-cations
Field Notesand
Other LabTests
Fin
es C
onte
nt(%
)
Liqu
idLi
mit
Pla
stic
ityIn
dex
BO
RIN
G L
OG
201
9 -
SP
T C
DO
T S
TY
LE 2
20-0
63 R
2 B
RID
GE
BU
ND
LE.G
PJ
201
9 Y
EH
CO
LOR
AD
O T
EM
PLA
TE
.GD
T 2
019
YE
H C
OLO
RA
DO
LIB
RA
RY
.GLB
12/
4/20
Moi
stur
eC
onte
nt (
%)
Dry
Den
sity
(pcf
)
Soil Samples
Pen
etra
tion
Res
ista
nce
Blowsper6 in
Material Description
Lith
olog
y
Gra
vel C
onte
nt(%
)
San
d C
onte
nt(%
)

A-4 (3)CL
S/C=0%64.5 26 923.7 95.0
8
3
4
8
15
5-3
2-2-1
2-2
5-3
5-10
0.0 - 0.7 ft. ASPHALT (8 inches).
0.7 - 5.0 ft. Clayey SAND with gravel(SC) (Fill), brown, dry to moist, loose.
5.0 - 15.0 ft. Sandy lean CLAY (CL)(Fill), brown, moist, soft.
15.0 - 20.0 ft. Sandy lean CLAY withgravel (CL), brown mottled with yellow,moist, medium stiff.
20.0 - 30.0 ft. Clayey SAND (SC),brown, moist, medium dense.
35.5
Night Work:
30.0 ft9/24/20
--
--
Logged By: C. Wallace
Final By: J. McCall
SymbolDepthDate
Total Depth: 101.5 ft
Ground Elevation: 9124.5
Coordinates: N: 398454.5 E: 871499.5
Location: US 24, westbound outside lane
Weather Notes: Clear, 50s
Inclination from Horiz.: Vertical
Boring Began: 9/24/2020
Boring Completed: 9/24/2020
Drilling Method(s): Hollow-Stem Auger
Driller: Vine Laboratories
Drill Rig: CME 750X Buggy
Hammer: Automatic (hydraulic), ER: 80%
Groundwater Levels:
Project Number: 220-063 Boring No.: I-13-G B-1
Dril
ling
Met
hod
Sam
ple
Typ
e/D
epth
ProjectName:
Dep
th(f
eet)
5
10
15
20
CDOT Region 2 Bridge Bundle
AtterbergLimits
Ele
vatio
n(f
eet)
9120
9115
9110
9105
9100
PAGE1 of 4
AASHTO& USCSClassifi-cations
Field Notesand
Other LabTests
Fin
es C
onte
nt(%
)
Liqu
idLi
mit
Pla
stic
ityIn
dex
BO
RIN
G L
OG
201
9 -
SP
T C
DO
T S
TY
LE 2
20-0
63 R
2 B
RID
GE
BU
ND
LE.G
PJ
201
9 Y
EH
CO
LOR
AD
O T
EM
PLA
TE
.GD
T 2
019
YE
H C
OLO
RA
DO
LIB
RA
RY
.GLB
12/
4/20
Moi
stur
eC
onte
nt (
%)
Dry
Den
sity
(pcf
)
Soil Samples
Pen
etra
tion
Res
ista
nce
Blowsper6 in
Material Description
Lith
olog
y
Gra
vel C
onte
nt(%
)
San
d C
onte
nt(%
)

A-2-4 (0)SM
pH=7.9S=0.579%Chl=0.0004%Re=1487ohm·cm
28.4 16 011.5
15
15
16
21
28
24
5-7-8
5-7-8
5-11
10-11
7-17-11
13-11
20.0 - 30.0 ft. Clayey SAND (SC),brown, moist, medium dense.
Seam of sandy fat clay, dark brown, from26-26.4 feet.
30.0 - 35.0 ft. Interlayered sandy leanCLAY (CH), clayey SAND (SC), andclayey GRAVEL (GC), brown, moist towet, medium dense, very stiff.
35.0 - 40.0 ft. Gravelly lean CLAY (CL),black, moist, stiff, rock structure apparent(shale residuum), high carbon content.
40.0 - 49.0 ft. Interlayered gravelly leanCLAY (CL) and clayey GRAVEL (GC),black, moist, medium dense, very stiff,sandstone gravels; rock structureapparent (sandstone and shaleresiduum), high carbon content.
49.0 - 56.0 ft. Silty SAND (SM), gray,moist, medium dense, weakly cemented(sandstone residuum).
21.0 50.6
Project Number: 220-063 Boring No.: I-13-G B-1
Dril
ling
Met
hod
Sam
ple
Typ
e/D
epth
ProjectName:
Dep
th(f
eet)
30
35
40
45
50
55
CDOT Region 2 Bridge Bundle
AtterbergLimits
Ele
vatio
n(f
eet)
9095
9090
9085
9080
9075
9070
PAGE2 of 4
AASHTO& USCSClassifi-cations
Field Notesand
Other LabTests
Fin
es C
onte
nt(%
)
Liqu
idLi
mit
Pla
stic
ityIn
dex
BO
RIN
G L
OG
201
9 -
SP
T C
DO
T S
TY
LE 2
20-0
63 R
2 B
RID
GE
BU
ND
LE.G
PJ
201
9 Y
EH
CO
LOR
AD
O T
EM
PLA
TE
.GD
T 2
019
YE
H C
OLO
RA
DO
LIB
RA
RY
.GLB
12/
4/20
Moi
stur
eC
onte
nt (
%)
Dry
Den
sity
(pcf
)
Soil Samples
Pen
etra
tion
Res
ista
nce
Blowsper6 in
Material Description
Lith
olog
y
Gra
vel C
onte
nt(%
)
San
d C
onte
nt(%
)

25
25
20
34
49
39
5-12-13
10-15
5-8-12
11-23
16-20-29
12-27
56.0 - 75.0 ft. Gravelly lean CLAY (CL),black, moist, very stiff to hard, rockstructure apparent (shale residuum), highcarbon content.
- sand seam (1' thickness) at 60'.
75.0 - 90.0 ft. Clayey GRAVEL (GC),black, moist, dense, shale residuum, highcarbon content.
Project Number: 220-063 Boring No.: I-13-G B-1
Dril
ling
Met
hod
Sam
ple
Typ
e/D
epth
ProjectName:
Dep
th(f
eet)
60
65
70
75
80
85
CDOT Region 2 Bridge Bundle
AtterbergLimits
Ele
vatio
n(f
eet)
9065
9060
9055
9050
9045
9040
PAGE3 of 4
AASHTO& USCSClassifi-cations
Field Notesand
Other LabTests
Fin
es C
onte
nt(%
)
Liqu
idLi
mit
Pla
stic
ityIn
dex
BO
RIN
G L
OG
201
9 -
SP
T C
DO
T S
TY
LE 2
20-0
63 R
2 B
RID
GE
BU
ND
LE.G
PJ
201
9 Y
EH
CO
LOR
AD
O T
EM
PLA
TE
.GD
T 2
019
YE
H C
OLO
RA
DO
LIB
RA
RY
.GLB
12/
4/20
Moi
stur
eC
onte
nt (
%)
Dry
Den
sity
(pcf
)
Soil Samples
Pen
etra
tion
Res
ista
nce
Blowsper6 in
Material Description
Lith
olog
y
Gra
vel C
onte
nt(%
)
San
d C
onte
nt(%
)

A-6 (5)CL
UCCS=97.7 psi57.0 31 147.6
47
54
50:6"
35
12-20-27
14-40
32-50:6"
14-15-20
75.0 - 90.0 ft. Clayey GRAVEL (GC),black, moist, dense, shale residuum, highcarbon content.
90.0 - 95.0 ft. DECOMPOSED SHALE,dark gray to black, predominantlydecomposed to decomposed, hard.
95.0 - 96.0 ft. SANDSTONE, gray,decomposed, hard.
96.0 - 100.0 ft. SHALE, dark brown toblack, decomposed to slightly weathered,hard.
100.0 - 101.5 ft. SANDSTONE, gray,decomposed, hard.
Bottom of Hole at 101.5 ft.
5.0 38.0
Project Number: 220-063 Boring No.: I-13-G B-1
Dril
ling
Met
hod
Sam
ple
Typ
e/D
epth
ProjectName:
Dep
th(f
eet)
90
95
100
CDOT Region 2 Bridge Bundle
AtterbergLimits
Ele
vatio
n(f
eet)
9035
9030
9025
9020
9015
9010
PAGE4 of 4
AASHTO& USCSClassifi-cations
Field Notesand
Other LabTests
Fin
es C
onte
nt(%
)
Liqu
idLi
mit
Pla
stic
ityIn
dex
BO
RIN
G L
OG
201
9 -
SP
T C
DO
T S
TY
LE 2
20-0
63 R
2 B
RID
GE
BU
ND
LE.G
PJ
201
9 Y
EH
CO
LOR
AD
O T
EM
PLA
TE
.GD
T 2
019
YE
H C
OLO
RA
DO
LIB
RA
RY
.GLB
12/
4/20
Moi
stur
eC
onte
nt (
%)
Dry
Den
sity
(pcf
)
Soil Samples
Pen
etra
tion
Res
ista
nce
Blowsper6 in
Material Description
Lith
olog
y
Gra
vel C
onte
nt(%
)
San
d C
onte
nt(%
)

A-6 (4)CL
S/C=-0.3%58.2 28 1214.6 110.8
5
4
8
12
12
2-3
2-2
5-3
2-5-7
5-5-7
0.0 - 0.7 ft. ASPHALT (8 inches).
0.7 - 10.0 ft. Sandy lean CLAY (CL)(Fill), dark brown, moist, medium stiff.
10.0 - 20.0 ft. Clayey SAND with gravel(SC), dark brown and yellow, moist,loose to medium dense.
20.0 - 27.0 ft. Interlayered clayey SANDwith gravel (SC) and sandy CLAY withgravel (CL), dark brown and yellow,moist, medium dense, stiff to very stiff.
41.8
Night Work:
27.0 ft9/23/20
--
--
Logged By: C. Wallace
Final By: J. McCall
SymbolDepthDate
Total Depth: 71.0 ft
Ground Elevation: 9125
Coordinates: N: 398450.9 E: 871411.7
Location: US 24, eastbound outside lane
Weather Notes:
Inclination from Horiz.: Vertical
Boring Began: 9/23/2020
Boring Completed: 9/23/2020
Drilling Method(s): Hollow-Stem Auger
Driller: Vine Laboratories
Drill Rig: CME 750X Buggy
Hammer: Automatic (hydraulic), ER: 80%
Groundwater Levels:
Project Number: 220-063 Boring No.: I-13-G B-2
Dril
ling
Met
hod
Sam
ple
Typ
e/D
epth
ProjectName:
Dep
th(f
eet)
5
10
15
20
CDOT Region 2 Bridge Bundle
AtterbergLimits
Ele
vatio
n(f
eet)
9120
9115
9110
9105
PAGE1 of 3
AASHTO& USCSClassifi-cations
Field Notesand
Other LabTests
Fin
es C
onte
nt(%
)
Liqu
idLi
mit
Pla
stic
ityIn
dex
BO
RIN
G L
OG
201
9 -
SP
T C
DO
T S
TY
LE 2
20-0
63 R
2 B
RID
GE
BU
ND
LE.G
PJ
201
9 Y
EH
CO
LOR
AD
O T
EM
PLA
TE
.GD
T 2
019
YE
H C
OLO
RA
DO
LIB
RA
RY
.GLB
12/
4/20
Moi
stur
eC
onte
nt (
%)
Dry
Den
sity
(pcf
)
Soil Samples
Pen
etra
tion
Res
ista
nce
Blowsper6 in
Material Description
Lith
olog
y
Gra
vel C
onte
nt(%
)
San
d C
onte
nt(%
)

A-4 (0)SM
UCCS=17 psi42.0 NV NP19.2
17
22
19
13
28
17
5-6-11
4-10-12
8-11
6-7
3-14-14
5-12
20.0 - 27.0 ft. Interlayered clayey SANDwith gravel (SC) and sandy CLAY withgravel (CL), dark brown and yellow,moist, medium dense, stiff to very stiff.
27.0 - 40.0 ft. Silty SAND (SM),brown-tan mottled with black, moist towet, medium dense, locally gravelly.
40.0 - 44.0 ft. Clayey SAND with gravel(SC), tan mottled with dark brown, wet,medium dense.
44.0 - 54.0 ft. Clayey GRAVEL (GC),black, wet, medium dense, rock structureapparent (residuum of shale), highcarbon content.
0.0 58.0
Project Number: 220-063 Boring No.: I-13-G B-2
Dril
ling
Met
hod
Sam
ple
Typ
e/D
epth
ProjectName:
Dep
th(f
eet)
30
35
40
45
50
55
CDOT Region 2 Bridge Bundle
AtterbergLimits
Ele
vatio
n(f
eet)
9095
9090
9085
9080
9075
9070
PAGE2 of 3
AASHTO& USCSClassifi-cations
Field Notesand
Other LabTests
Fin
es C
onte
nt(%
)
Liqu
idLi
mit
Pla
stic
ityIn
dex
BO
RIN
G L
OG
201
9 -
SP
T C
DO
T S
TY
LE 2
20-0
63 R
2 B
RID
GE
BU
ND
LE.G
PJ
201
9 Y
EH
CO
LOR
AD
O T
EM
PLA
TE
.GD
T 2
019
YE
H C
OLO
RA
DO
LIB
RA
RY
.GLB
12/
4/20
Moi
stur
eC
onte
nt (
%)
Dry
Den
sity
(pcf
)
Soil Samples
Pen
etra
tion
Res
ista
nce
Blowsper6 in
Material Description
Lith
olog
y
Gra
vel C
onte
nt(%
)
San
d C
onte
nt(%
)

A-4 (1)SC-SM
A-6 (8)CL
pH=7.1S=0.382%Chl=0.0003%Re=655ohm·cm
UCCS=25.6 psi
46.5
89.0
27
26
7
11
14.8
15.6
31
22
30
24
5-12-19
5-17
9-14-16
8-16
54.0 - 59.0 ft. Gravelly fat CLAY (CH),black, moist, hard, rock structureapparent (residuum of shale), highcarbon content.
59.0 - 65.0 ft. Clayey GRAVEL (GC),black, wet, medium dense, rock structureapparent (residuum of shale), highcarbon content.
65.0 - 70.0 ft. Silty, clayey SAND withgravel (SC-SM), black, dense, hard,high carbon content.
70.0 - 71.0 ft. Lean CLAY (CL), blackand gray, moist, very stiff, rock structurelocally apparent (residuum of siltstone).
Bottom of Hole at 71.0 ft.
15.0
0.0
38.5
11.0
Project Number: 220-063 Boring No.: I-13-G B-2
Dril
ling
Met
hod
Sam
ple
Typ
e/D
epth
ProjectName:
Dep
th(f
eet)
60
65
70
CDOT Region 2 Bridge Bundle
AtterbergLimits
Ele
vatio
n(f
eet)
9065
9060
9055
9050
9045
9040
PAGE3 of 3
AASHTO& USCSClassifi-cations
Field Notesand
Other LabTests
Fin
es C
onte
nt(%
)
Liqu
idLi
mit
Pla
stic
ityIn
dex
BO
RIN
G L
OG
201
9 -
SP
T C
DO
T S
TY
LE 2
20-0
63 R
2 B
RID
GE
BU
ND
LE.G
PJ
201
9 Y
EH
CO
LOR
AD
O T
EM
PLA
TE
.GD
T 2
019
YE
H C
OLO
RA
DO
LIB
RA
RY
.GLB
12/
4/20
Moi
stur
eC
onte
nt (
%)
Dry
Den
sity
(pcf
)
Soil Samples
Pen
etra
tion
Res
ista
nce
Blowsper6 in
Material Description
Lith
olog
y
Gra
vel C
onte
nt(%
)
San
d C
onte
nt(%
)
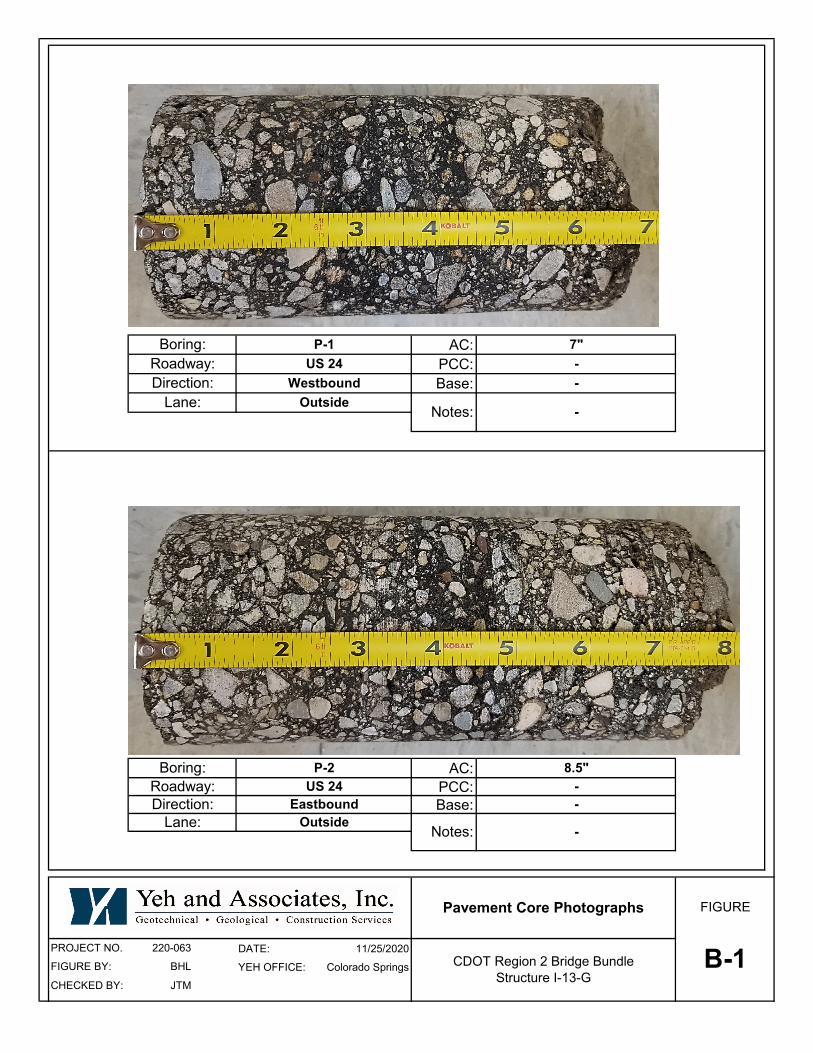
AC:
PCC:
Base:
AC:
PCC:
Base:
PROJECT NO. 220-063 DATE: 11/25/2020
FIGURE BY: BHL YEH OFFICE: Colorado Springs
CHECKED BY: JTM
Boring: P-1 7"
Roadway: US 24 -
Direction: Westbound -
Lane: OutsideNotes: -
Boring: P-2 8.5"
Roadway: US 24 -
Pavement Core Photographs FIGURE
B-1CDOT Region 2 Bridge Bundle
Structure I-13-G
Direction: Eastbound -
Lane: OutsideNotes: -

Preliminary Geotechnical Study – Structure I-13-G Project No. 220-063 23558/23559 R2 Bridge Bundle December 11, 2020
C
APPENDIX C
SUMMARY OF LABORATORY TEST RESULTS

I-13-G B-1 10.0 MC 23.7 95.0 35.5 64.5 26 17 9 0 @ 1000 A-4 (3) CL
I-13-G B-1 50.0 MC 11.5 21.0 50.6 28.4 16 16 0 7.9 0.579 0.0004 1487 A-2-4 (0) SM
I-13-G B-1 90.0 MC 7.6 5.0 38.0 57.0 31 17 14 97.7 A-6 (5) CL
I-13-G B-2 5.0 MC 14.6 110.8 41.8 58.2 28 16 12 -0.3 @ 500 A-6 (4) CL
I-13-G B-2 35.0 MC 19.2 0.0 58.0 42.0 NV NP NP 17 A-4 (0) SM
I-13-G B-2 65.0 SPT 14.8 15.0 38.5 46.5 27 20 7 7.1 0.382 0.0003 655 A-4 (1) SC-SM
I-13-G B-2 70.0 MC 15.6 0.0 11.0 89.0 26 15 11 25.6 A-6 (8) CL
I-13-G P-1 4.0 MC 18.6 100.2 29.0 29.7 41.3 41 24 17 0.3 @ 200 A-7-6 (3) SC
I-13-G P-2 4.0 MC 15.8 108.4 32.0 17.1 50.9 35 19 16 0 @ 200 A-6 (5) CL
I-13-G Scour 0 BULK 1.3 45.0 44.1 10.9 27 18 9 A-2-4 (0) GW-GC
I-13-G-P-1/P-2 2.5 BULK 15.9 10.0 33.7 56.3 34 19 15 0.008 0.0127 A-6 (6) CL
Summary of Laboratory Test Results
Sample Location Classification
AASHTO
Swell (+) /Collapse (-)(% at Load
in psf)
Colorado Springs Lab
WaterSolubleChloride
(%)
pH
Gradation
Sand(%)
NaturalDry
Density(pcf)
R-ValueBoringNo.
Unconf.Comp.
Strength(psi)
NaturalMoistureContent
(%)Depth
(ft)
Gravel> #4(%)
Report By: D. Gruenwald Checked By: J. McCall
SampleType PI USCS
Project No: 220-063 Project Name: CDOT Region 2 Bridge Bundle Date: 12-04-2020
Resistivity(ohm-cm)
WaterSolubleSulfate
(%)PLLL
Atterberg
Fines< #200
(%)
Rev 03/19 Page 1 of 1
20
TBD7

0
5
10
15
20
25
30
35
40
45
50
55
60
65
70
75
80
85
90
95
100
0.0010.010.1110100
4 20 406 601.5 8 14
%Silt%Sand
10.0
50.0
90.0
5.0
35.0
501/2
SIEVE ANALYSIS
COBBLES GRAVEL SAND
9
NP
14
12
NP
SILT OR CLAY
USCSClassification
I-13-G B-1
I-13-G B-1
I-13-G B-1
I-13-G B-2
I-13-G B-2
3/4 3/8
CL
SM
CL
CL
SM
A-4 (3)
A-2-4 (0)
A-6 (5)
A-6 (4)
A-4 (0)
16 30P
ER
CE
NT
FIN
ER
BY
WE
IGH
T1 2006 1403
PIPLBOREHOLE DEPTH
(ft)
10
LL
HYDROMETER
%Fines%Clay%Gravel
U.S. SIEVE OPENING IN INCHES U.S. SIEVE NUMBERS
AASHTOClassification
17
20
17
16
NP
3 10024
GRAIN SIZE IN MILLIMETERS
26
16
31
28
NV
21.0
5.0
0.0
31.5
50.6
38.0
23.8
58.0
64.5
28.4
57.0
58.2
42.0
Project No. 220-063
Yeh Lab: Colorado Springs
FIGURE
Date: 11-30-2020 C- 2CDOT Region 2 Bridge BundleStructure I-13-GReport By: D. Gruenwald
Checked By: J. McCall
03 G
RA
IN S
IZE
YE
H 2
20-0
63 R
2 B
RID
GE
BU
ND
LE.G
PJ
201
9 Y
EH
CO
LOR
AD
O T
EM
PLA
TE
.GD
T 2
019
YE
H C
OLO
RA
DO
LIB
RA
RY
.GLB
11/
30/2
0

0
5
10
15
20
25
30
35
40
45
50
55
60
65
70
75
80
85
90
95
100
0.0010.010.1110100
4 20 406 601.5 8 14
%Silt%Sand
65.0
70.0
4.0
4.0
2.5
501/2
SIEVE ANALYSIS
COBBLES GRAVEL SAND
7
11
17
16
15
SILT OR CLAY
USCSClassification
I-13-G B-2
I-13-G B-2
I-13-G P-1
I-13-G P-2
I-13-G-P-1/P-2
3/4 3/8
SC-SM
CL
SC
CL
CL
A-4 (1)
A-6 (8)
A-7-6 (3)
A-6 (5)
A-6 (6)
16 30P
ER
CE
NT
FIN
ER
BY
WE
IGH
T1 2006 1403
PIPLBOREHOLE DEPTH
(ft)
10
LL
HYDROMETER
%Fines%Clay%Gravel
U.S. SIEVE OPENING IN INCHES U.S. SIEVE NUMBERS
AASHTOClassification
20
15
24
19
19
3 10024
GRAIN SIZE IN MILLIMETERS
27
26
41
35
34
15.0
0.0
29.0
32.0
10.0
38.5
11.0
29.7
17.1
33.7
46.5
89.0
41.3
50.9
56.3
Project No. 220-063
Yeh Lab: Colorado Springs
FIGURE
Date: 11-30-2020 C- 3CDOT Region 2 Bridge BundleStructure I-13-GReport By: D. Gruenwald
Checked By: J. McCall
03 G
RA
IN S
IZE
YE
H 2
20-0
63 R
2 B
RID
GE
BU
ND
LE.G
PJ
201
9 Y
EH
CO
LOR
AD
O T
EM
PLA
TE
.GD
T 2
019
YE
H C
OLO
RA
DO
LIB
RA
RY
.GLB
11/
30/2
0

0
5
10
15
20
25
30
35
40
45
50
55
60
65
70
75
80
85
90
95
100
0.0010.010.1110100
4 20 406 601.5 8 14
%Silt%Sand
0.0
501/2
SIEVE ANALYSIS
COBBLES GRAVEL SAND
9
SILT OR CLAY
USCSClassification
I-13-G Scour
3/4 3/8
GW-GCA-2-4 (0)
16 30P
ER
CE
NT
FIN
ER
BY
WE
IGH
T1 2006 1403
PIPLBOREHOLE DEPTH
(ft)
10
LL
HYDROMETER
%Fines%Clay%Gravel
U.S. SIEVE OPENING IN INCHES U.S. SIEVE NUMBERS
AASHTOClassification
18
3 10024
GRAIN SIZE IN MILLIMETERS
27 45.0 35.1 10.9
Project No. 220-063
Yeh Lab: Colorado Springs
FIGURE
Date: 11-30-2020 C- 4CDOT Region 2 Bridge BundleStructure I-13-GReport By: D. Gruenwald
Checked By: J. McCall
03 G
RA
IN S
IZE
YE
H 2
20-0
63 R
2 B
RID
GE
BU
ND
LE.G
PJ
201
9 Y
EH
CO
LOR
AD
O T
EM
PLA
TE
.GD
T 2
019
YE
H C
OLO
RA
DO
LIB
RA
RY
.GLB
11/
30/2
0

vv0
10
20
30
40
50
60
70
0 20 40 60 80 100
"U" L
INE
"A" L
INE
CL or OL
CL-ML MH or OH
CH or OH
I-13-G B-1
I-13-G B-1
I-13-G B-1
I-13-G B-2
I-13-G B-2
I-13-G B-2
I-13-G B-2
I-13-G P-1
I-13-G P-2
I-13-G Scour
I-13-G-P-1/P-2
LIQUID LIMIT
10.0
50.0
90.0
5.0
35.0
65.0
70.0
4.0
4.0
0.0
2.5
A-4 (3)
A-2-4 (0)
A-6 (5)
A-6 (4)
A-4 (0)
A-4 (1)
A-6 (8)
A-7-6 (3)
A-6 (5)
A-2-4 (0)
A-6 (6)
BOREHOLE DEPTH (ft)
ML or OL
PL
17
20
17
16
NP
20
15
24
19
18
19
PI
9
NP
14
12
NP
7
11
17
16
9
15
Passing#200
SANDY LEAN CLAY (CL)
SILTY SAND with GRAVEL (SM)
SANDY LEAN CLAY (CL)
SANDY LEAN CLAY with GRAVEL (CL)
SILTY SAND (SM)
SILTY, CLAYEY SAND with GRAVEL (SC-SM)
LEAN CLAY (CL)
CLAYEY SAND with GRAVEL (SC)
GRAVELLY LEAN CLAY with SAND (CL)
WELL-GRADED GRAVEL with CLAY and SAND (GW-GC)
SANDY LEAN CLAY (CL)
PLA
ST
ICIT
Y I
ND
EX
LL USCS Sample Description and Symbol AASHTOClass.
26
16
31
28
NV
27
26
41
35
27
34
64.5
28.4
57.0
58.2
42.0
46.5
89.0
41.3
50.9
10.9
56.3
Yeh Lab: Colorado Springs
Date: 11-30-2020
Checked By: J. McCall
Project No. 220-063
FIGURE
C - 5
ATTERBERG LIMITS
CDOT Region 2 Bridge BundleStructure I-13-GReport By: D. Gruenwald
01 A
TT
ER
BE
RG
LIM
ITS
YE
H -
ALL
BO
RIN
GS
220
-063
R2
BR
IDG
E B
UN
DLE
.GP
J 2
019
YE
H C
OLO
RA
DO
TE
MP
LAT
E.G
DT
201
9 Y
EH
CO
LOR
AD
O L
IBR
AR
Y.G
LB 1
1/30
/20
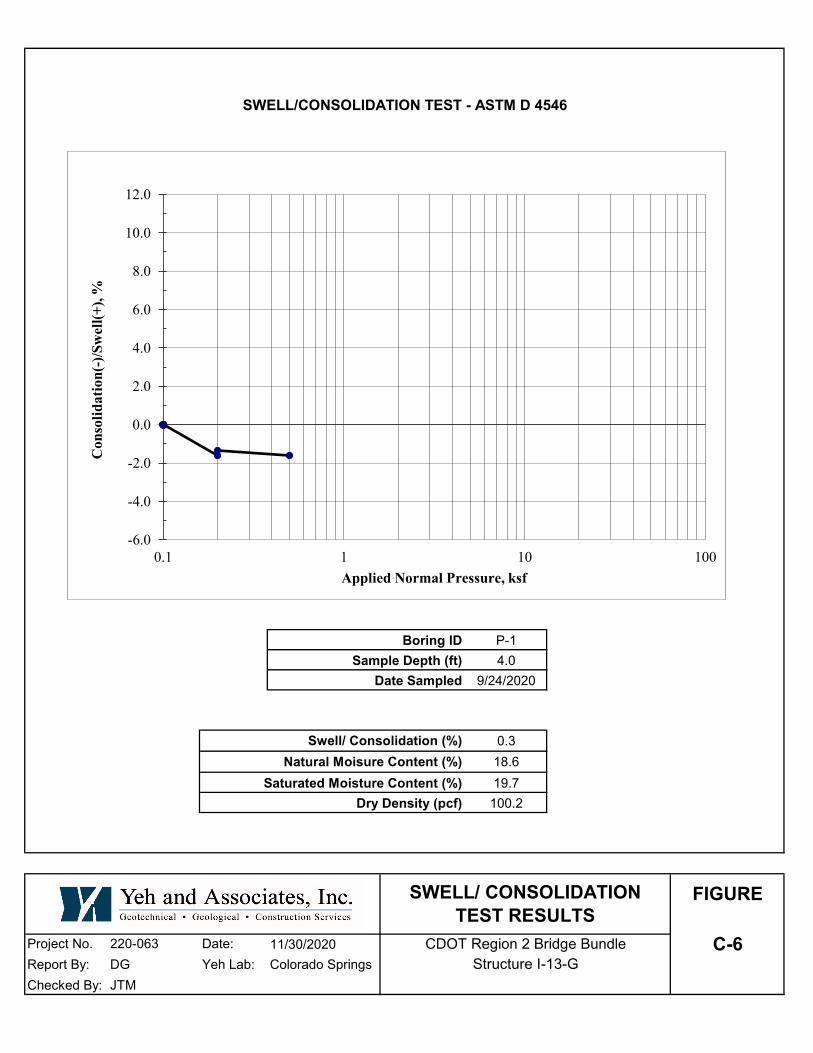
Boring ID P-1
4.0
9/24/2020
0.3
18.6
19.7
100.2
Project No. 220-063 Date: 11/30/2020
Report By: DG Yeh Lab: Colorado Springs
Checked By: JTM
Swell/ Consolidation (%)
Sample Depth (ft)
SWELL/CONSOLIDATION TEST - ASTM D 4546
C-6
Date Sampled
Natural Moisure Content (%)
Dry Density (pcf)
Saturated Moisture Content (%)
FIGURESWELL/ CONSOLIDATION
TEST RESULTS
CDOT Region 2 Bridge Bundle
Structure I-13-G
-6.0
-4.0
-2.0
0.0
2.0
4.0
6.0
8.0
10.0
12.0
0.1 1 10 100
Con
soli
dati
on
(-)/
Sw
ell
(+),
%
Applied Normal Pressure, ksf

Boring ID P-2
4.0
9/24/2020
0.0
15.8
17.5
108.4
Project No. 220-063 Date: 11/30/2020
Report By: DG Yeh Lab: Colorado Springs
Checked By: JTM
SWELL/ CONSOLIDATION
TEST RESULTSFIGURE
C-7CDOT Region 2 Bridge Bundle
Structure I-13-G
Dry Density (pcf)
Saturated Moisture Content (%)
Sample Depth (ft)
Date Sampled
Swell/ Consolidation (%)
Natural Moisure Content (%)
SWELL/CONSOLIDATION TEST - ASTM D 4546
-6.0
-4.0
-2.0
0.0
2.0
4.0
6.0
8.0
10.0
12.0
0.1 1 10 100
Con
soli
dati
on
(-)/
Sw
ell
(+),
%
Applied Normal Pressure, ksf
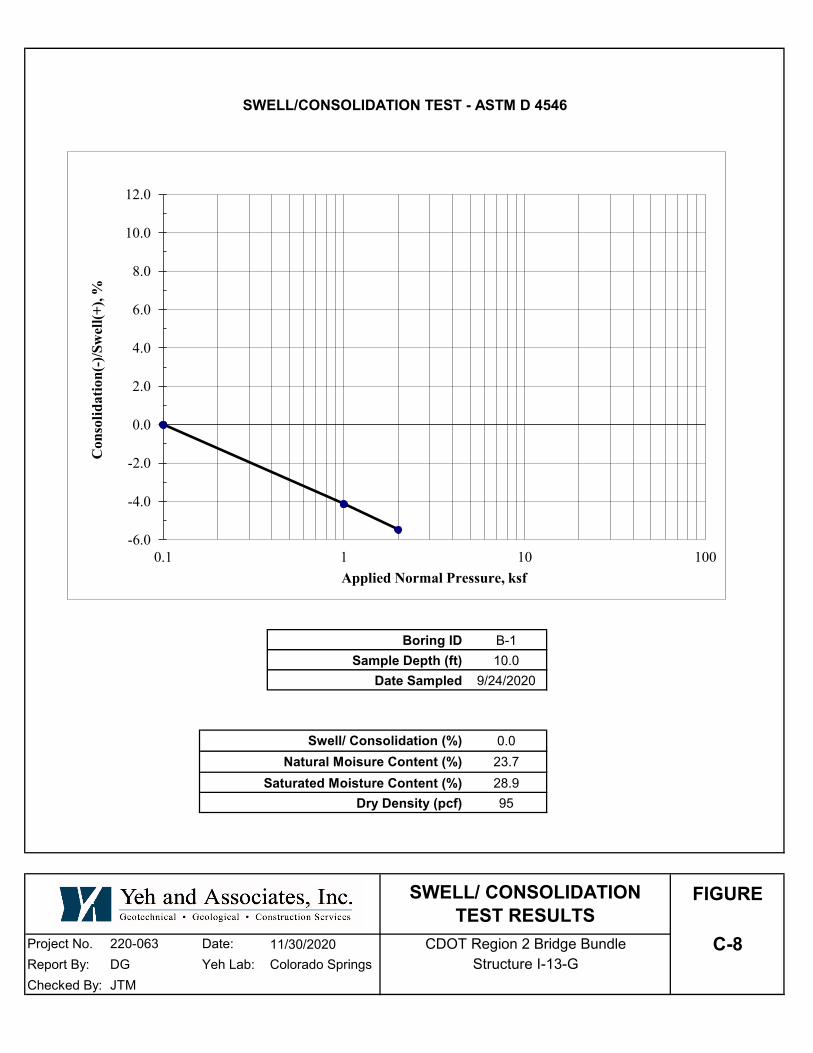
Boring ID B-1
10.0
9/24/2020
0.0
23.7
28.9
95
Project No. 220-063 Date: 11/30/2020
Report By: DG Yeh Lab: Colorado Springs
Checked By: JTM
SWELL/CONSOLIDATION TEST - ASTM D 4546
Saturated Moisture Content (%)
Sample Depth (ft)
Date Sampled
Swell/ Consolidation (%)
Natural Moisure Content (%)
Dry Density (pcf)
SWELL/ CONSOLIDATION
TEST RESULTSFIGURE
C-8CDOT Region 2 Bridge Bundle
Structure I-13-G
-6.0
-4.0
-2.0
0.0
2.0
4.0
6.0
8.0
10.0
12.0
0.1 1 10 100
Con
soli
dati
on
(-)/
Sw
ell
(+),
%
Applied Normal Pressure, ksf

Boring ID B-2
5.0
9/24/2020
-0.3
14.6
17.6
110.8
Project No. 220-063 Date: 11/30/2020
Report By: DG Yeh Lab: Colorado Springs
Checked By: JTM
SWELL/CONSOLIDATION TEST - ASTM D 4546
Saturated Moisture Content (%)
Sample Depth (ft)
Date Sampled
Swell/ Consolidation (%)
Natural Moisure Content (%)
Dry Density (pcf)
SWELL/ CONSOLIDATION
TEST RESULTSFIGURE
C-9CDOT Region 2 Bridge Bundle
Structure I-13-G
-6.0
-4.0
-2.0
0.0
2.0
4.0
6.0
8.0
10.0
12.0
0.1 1 10 100
Con
soli
dati
on
(-)/
Sw
ell
(+),
%
Applied Normal Pressure, ksf
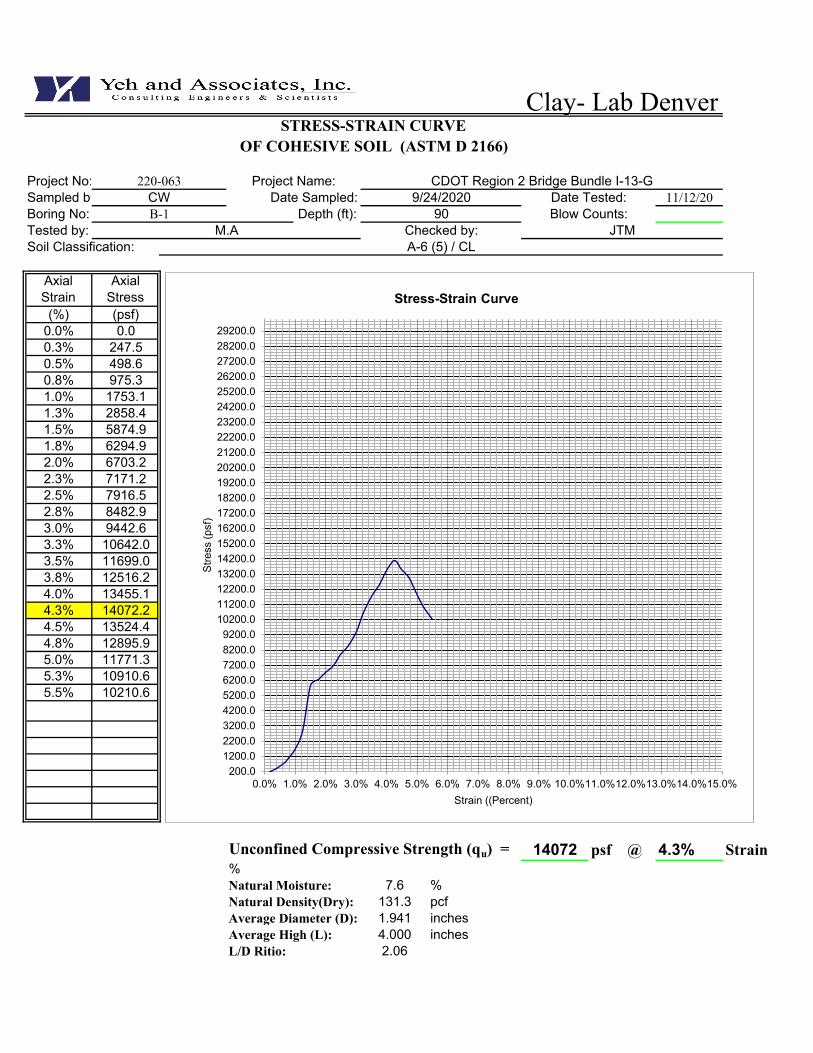
Project No:
Sampled by: 11/12/20
Boring No: Depth (ft):
Tested by:
Soil Classification:
(%) (psf)
0.0% 0.0
0.3% 247.5
0.5% 498.6
0.8% 975.3
1.0% 1753.1
1.3% 2858.4
1.5% 5874.9
1.8% 6294.9
2.0% 6703.2
2.3% 7171.2
2.5% 7916.5
2.8% 8482.9
3.0% 9442.6
3.3% 10642.0
3.5% 11699.0
3.8% 12516.2
4.0% 13455.1
4.3% 14072.2
4.5% 13524.4
4.8% 12895.9
5.0% 11771.3
5.3% 10910.6
5.5% 10210.6
Unconfined Compressive Strength (qu) = 14072 psf @ 4.3% Strain
%
Natural Moisture: 7.6 %
Natural Density(Dry): 131.3 pcf
Average Diameter (D): 1.941 inches
Average High (L): 4.000 inches
L/D Ritio: 2.06
Clay- Lab DenverSTRESS-STRAIN CURVE
OF COHESIVE SOIL (ASTM D 2166)
220-063 Project Name: CDOT Region 2 Bridge Bundle I-13-G
CW Date Sampled: 9/24/2020 Date Tested:
B-1 90 Blow Counts:
M.A Checked by: JTM
A-6 (5) / CL
Axial
Strain
Axial
Stress
200.0
1200.0
2200.0
3200.0
4200.0
5200.0
6200.0
7200.0
8200.0
9200.0
10200.0
11200.0
12200.0
13200.0
14200.0
15200.0
16200.0
17200.0
18200.0
19200.0
20200.0
21200.0
22200.0
23200.0
24200.0
25200.0
26200.0
27200.0
28200.0
29200.0
0.0% 1.0% 2.0% 3.0% 4.0% 5.0% 6.0% 7.0% 8.0% 9.0% 10.0%11.0%12.0%13.0%14.0%15.0%
Str
ess (
psf)
Strain ((Percent)
Stress-Strain Curve

Project No:
Sampled by: 11/12/20
Boring No: Depth (ft):
Tested by:
Soil Classification:
(%) (psf)
0.0% 0.0
0.2% 39.1
0.5% 151.3
0.7% 579.4
1.0% 864.4
1.2% 1157.7
1.5% 1435.0
1.7% 1701.3
2.0% 1942.1
2.2% 2167.4
2.5% 2243.1
2.7% 2366.2
3.0% 2450.5
3.2% 2444.2
3.5% 2191.8
3.7% 1992.5
4.0% 1883.7
4.2% 1747.3
Unconfined Compressive Strength (qu) = 2451 psf @ 3.0% Strain
%
Natural Moisture: 19.2 %
Natural Density(Dry): 109.9 pcf
Average Diameter (D): 1.933 inches
Average High (L): 4.007 inches
L/D Ritio: 2.07
M.A Checked by: JTM
A-4 (0) / SM
Axial
Strain
Axial
Stress
CW Date Sampled: 9/24/2020 Date Tested:
B-2 35 Blow Counts:
Clay- Lab DenverSTRESS-STRAIN CURVE
OF COHESIVE SOIL (ASTM D 2166)
220-063 Project Name: CDOT Region 2 Bridge Bundle I-13-G
0.0
250.0
500.0
750.0
1000.0
1250.0
1500.0
1750.0
2000.0
2250.0
2500.0
2750.0
3000.0
3250.0
3500.0
3750.0
4000.0
4250.0
4500.0
4750.0
5000.0
0.0% 1.0% 2.0% 3.0% 4.0% 5.0% 6.0% 7.0% 8.0% 9.0% 10.0%11.0%12.0%13.0%14.0%15.0%
Str
ess (
psf)
Strain ((Percent)
Stress-Strain Curve

Project No:
Sampled by: 11/12/20
Boring No: Depth (ft):
Tested by:
Soil Classification:
(%) (psf)
0.0% 0.0
0.2% 117.2
0.5% 268.0
0.7% 393.7
1.0% 538.1
1.2% 701.2
1.5% 863.4
1.7% 1034.4
2.0% 1209.4
2.2% 1383.4
2.5% 1570.9
2.7% 1771.6
3.0% 1985.6
3.2% 2174.7
3.5% 2358.2
3.7% 2573.6
4.0% 2769.1
4.2% 2926.0
4.5% 3068.1
4.7% 3214.0
5.0% 3359.1
5.2% 3480.2
5.5% 3572.9
5.7% 3655.8
6.0% 3687.5
6.2% 3677.7
6.5% 3667.9
6.7% 3516.6
7.0% 3293.1
7.2% 2916.3
7.5% 2704.6
7.7% 2200.3 Unconfined Compressive Strength (qu) = 3688 psf @ 6.0% Strain8.0% 1815.9 %
Natural Moisture: 15.6 %
Natural Density(Dry): 119.4 pcf
Average Diameter (D): 1.935 inches
Average High (L): 4.009 inches
L/D Ritio: 2.07
Clay- Lab DenverSTRESS-STRAIN CURVE
OF COHESIVE SOIL (ASTM D 2166)
220-063 Project Name: CDOT Region 2 Bridge Bundle I-13-G
CW Date Sampled: 9/24/2020 Date Tested:
B-2 70 Blow Counts:
M.A Checked by: JTM
A-6 (8) / CL
Axial
Strain
Axial
Stress
0.0
200.0
400.0
600.0
800.0
1000.0
1200.0
1400.0
1600.0
1800.0
2000.0
2200.0
2400.0
2600.0
2800.0
3000.0
3200.0
3400.0
3600.0
3800.0
4000.0
4200.0
4400.0
4600.0
4800.0
5000.0
0.0% 1.0% 2.0% 3.0% 4.0% 5.0% 6.0% 7.0% 8.0% 9.0% 10.0%11.0%12.0%13.0%14.0%15.0%
Str
ess (
psf)
Strain ((Percent)
Stress-Strain Curve

R Value
CLIENT Yeh & Associates BORING NO. P-1/P-2JOB NO. 2546-129 DEPTH Combined BulkPROJECT CDOT R2 Bridge Bundle_G-12-C SAMPLE NO. I-13-GPROJECT NO. 220-063 DATE SAMPLED --LOCATION -- SAMPLED BY --DATE TESTED 12/03/20 DESCRIPTION --TECHNICIAN ALH
Mass of Wet Soil & Pan (g): 1897.3 1895.5 1981.2Mass of Dry Soil & Pan (g): 1727.8 1744.5 1835.4
Mass of Pan (g): 791.0 792.6 843.1Mass of Wet Soil & Mold (g): 3227.3 3212.0 3240.5
Mass of Mold (g): 2110.9 2104.3 2101.8Sample Height (in): 2.63 2.56 2.60
Wet Density (pcf): 128.7 131.2 132.8Dry Density (pcf): 109.0 113.2 115.8
Wet Density (kg/m³): 2061 2101 2127Dry Density (kg/m³): 1746 1814 1854
Moisture (%): 18.1 15.9 14.7
Exudation Pressure (lbs): 2841 3714 4138Exudation Pressure (psi): 226.1 295.6 329.3
2000 lbs. Dial Reading (psi): 153 138 134Displacement Turns: 5.93 5.34 5.05
Uncorrected R Value: 2 7 9Corrected R Value: 2 7 10
NOTES:
Data entry by: ALH Date: 12/04/20Checked by: WAR Date: 12/07/20File name: 2546129__R Value ASTM D2844_2.xlsm
Sample Conditions
R Value Data
ASTM D2844
Corrected R Value at 300 psi Exudation Pressure
7
0
2
4
6
8
10
12
0 50 100 150 200 250 300 350
R V
alu
e
Exudation Pressure (psi)
R Value vs. Exudation Pressure (psi)