Company presentation : August 2012 Company Presentation August 2012.
1
Inbank ASCompany Presentation Q3 2019
Company presentation
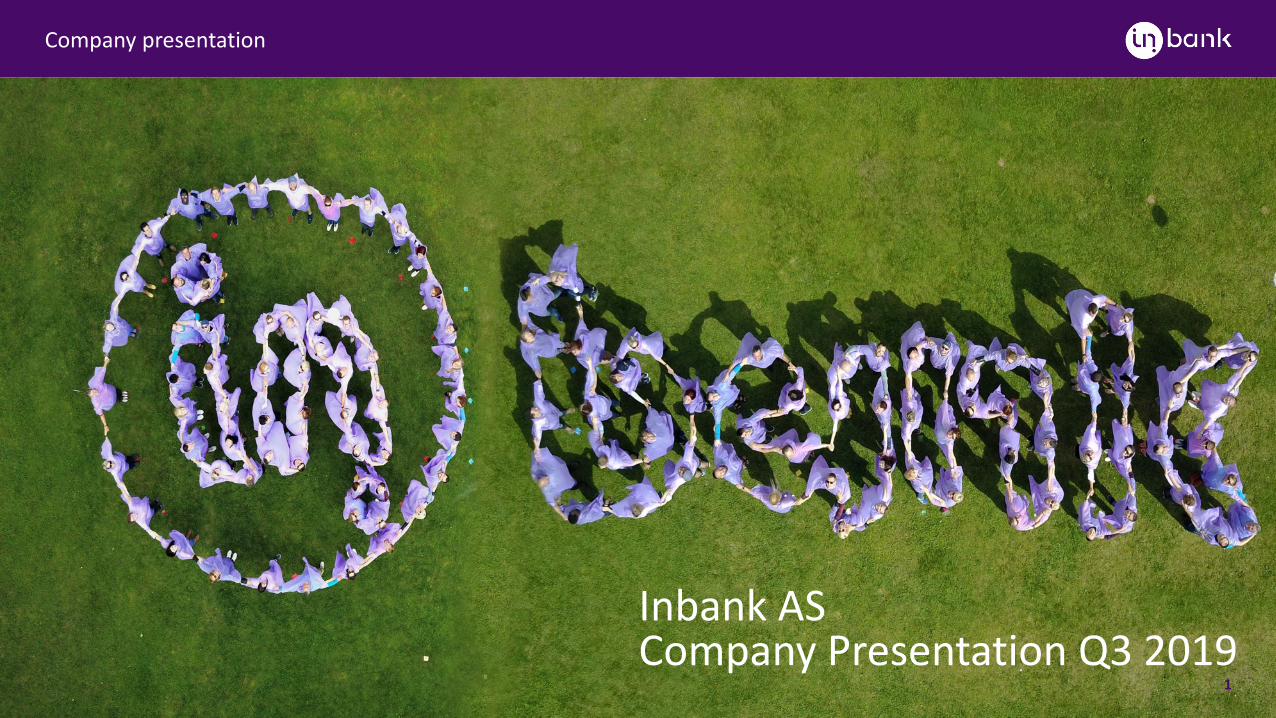
Inbank at glance
Company presentation
2
EUR 310mLoan Portfolio
520 000 Active Contracts
32%Return On Equity
2018
7Countries
1750+Active Partners
49% Sales Growth
Last 9M
Data as of Q3 2019
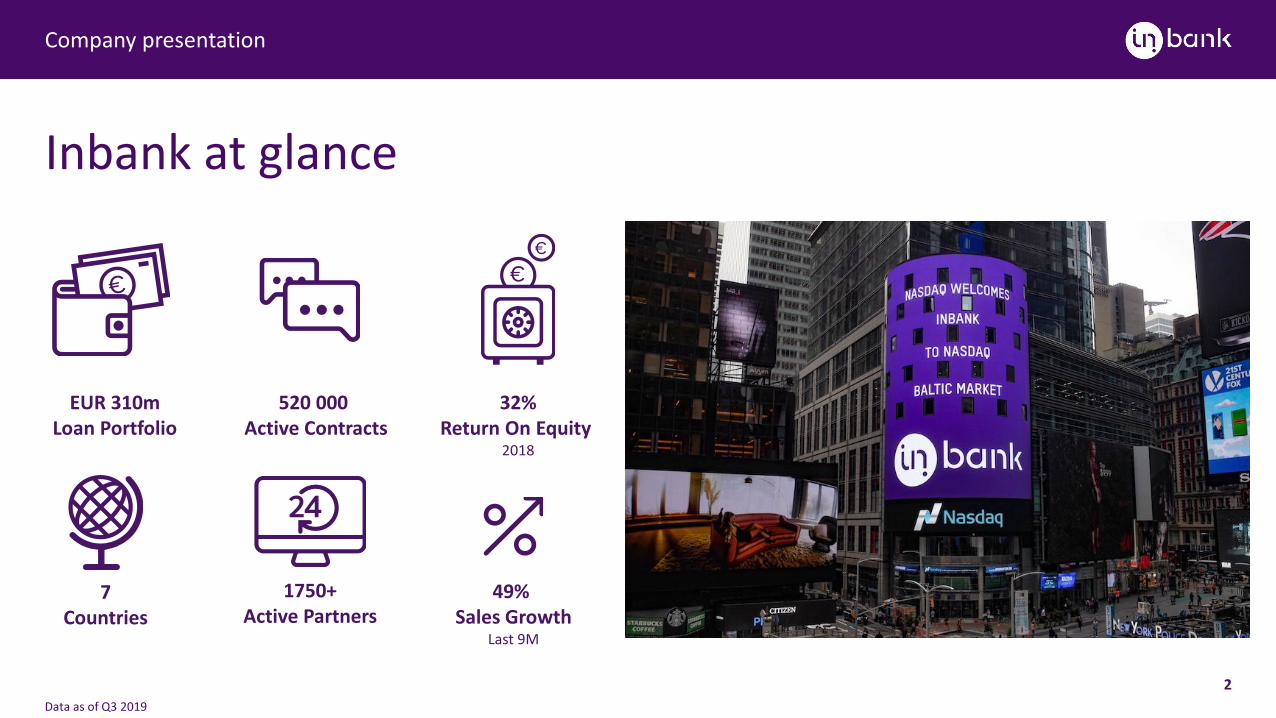
Group history and structure
Company presentation
3
First hire purchase contract
Co-branded credit cards with Coop retail chain
Joint venture in consumer loans with
Krediidipank
Latvianconsumer
credit market entry
Bankinglicence and rebranding
Auto24.ee partnership
Acquisition of Coop Pank
and sale of affiliates to Coop Pank
Polish branch Mokilizingasacquisition
201720152011 20182014
Founders &Employees
36%FinancialInvestors
64%
Owner Shares %
Cofi Investeeringud OÜ 24 635 27,3%
Pershing Hall Holding Limited 23 858 26,4%
Other (61 shareholders) 41 851 46,3%
Group Structure
Co-operationwith Raisin
2016
Shareholder Structure
Activity highlights
Company presentation
4
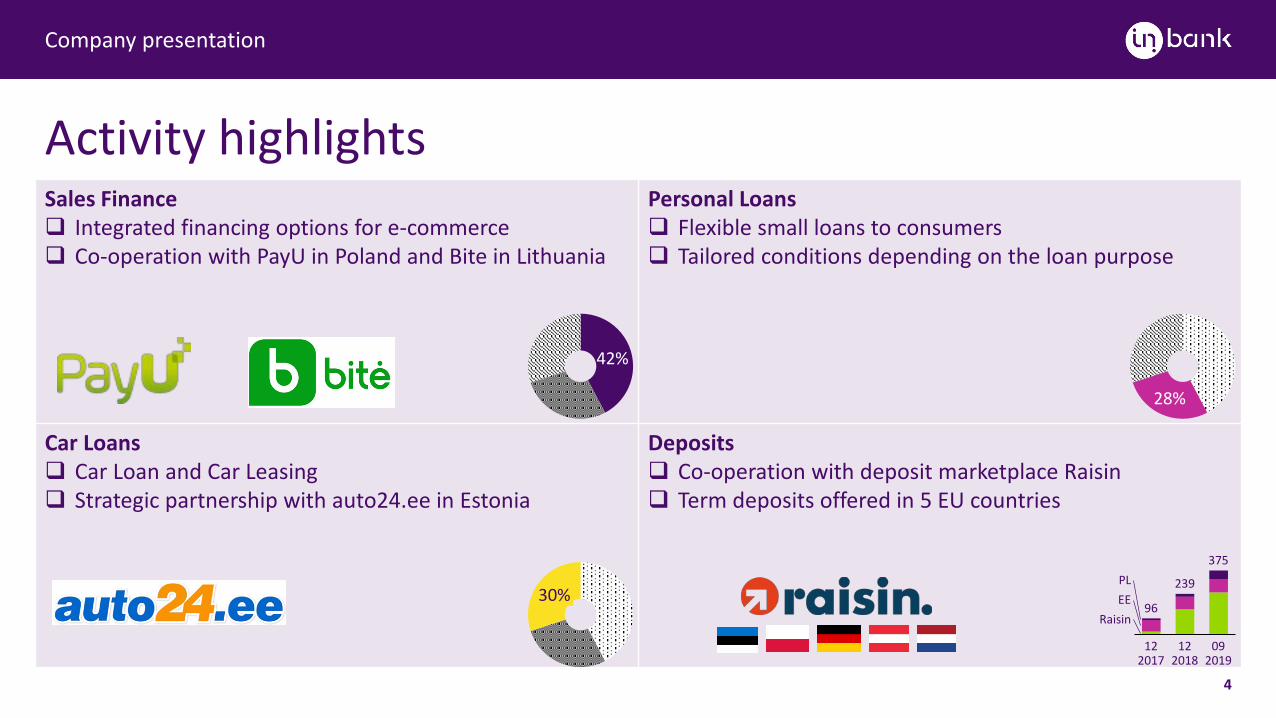
Sales Finance Integrated financing options for e-commerce Co-operation with PayU in Poland and Bite in Lithuania
Personal Loans Flexible small loans to consumers Tailored conditions depending on the loan purpose
Car Loans Car Loan and Car Leasing Strategic partnership with auto24.ee in Estonia
Deposits Co-operation with deposit marketplace Raisin Term deposits offered in 5 EU countries
30%
42%
28%
122018
PL
122017
092019
EERaisin
96
239
375
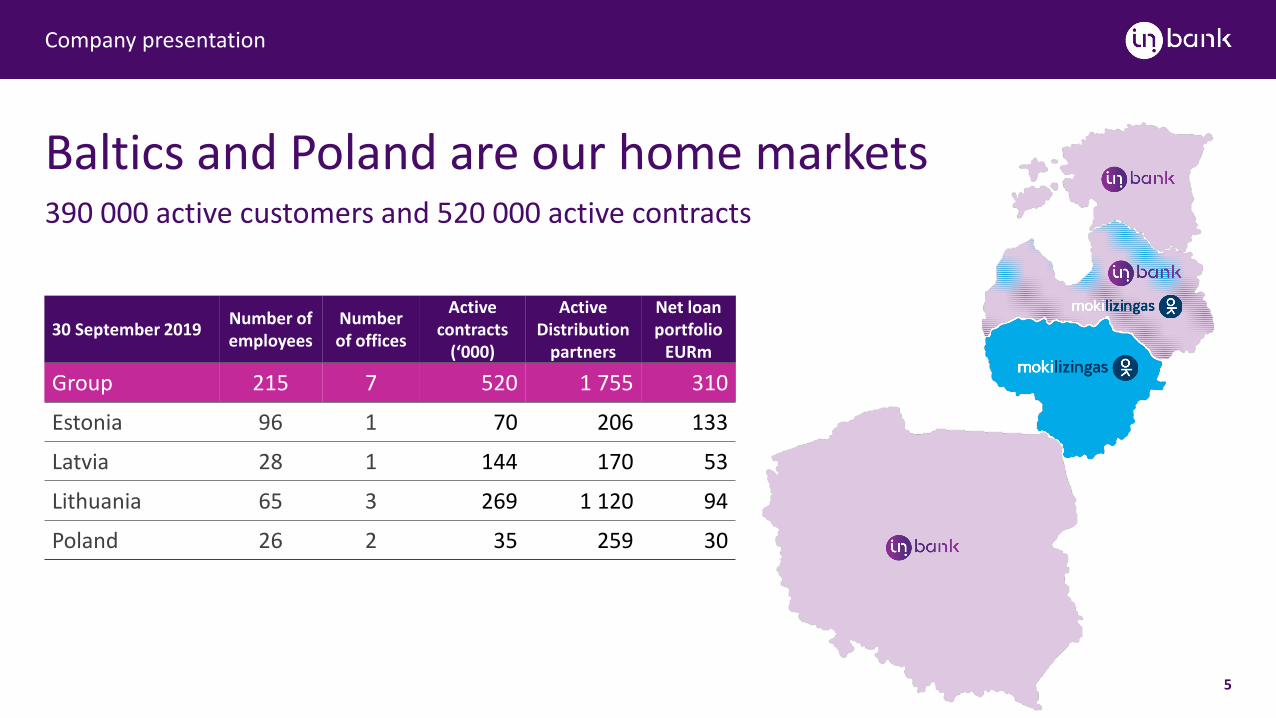
30 September 2019 Number of employees
Number of offices
Active contracts
(‘000)
Active Distribution
partners
Net loan portfolio
EURm
Group 215 7 520 1 755 310
Estonia 96 1 70 206 133
Latvia 28 1 144 170 53
Lithuania 65 3 269 1 120 94
Poland 26 2 35 259 30
Baltics and Poland are our home markets
5
Company presentation
390 000 active customers and 520 000 active contracts
Efficient and automated business model
Company presentation
6
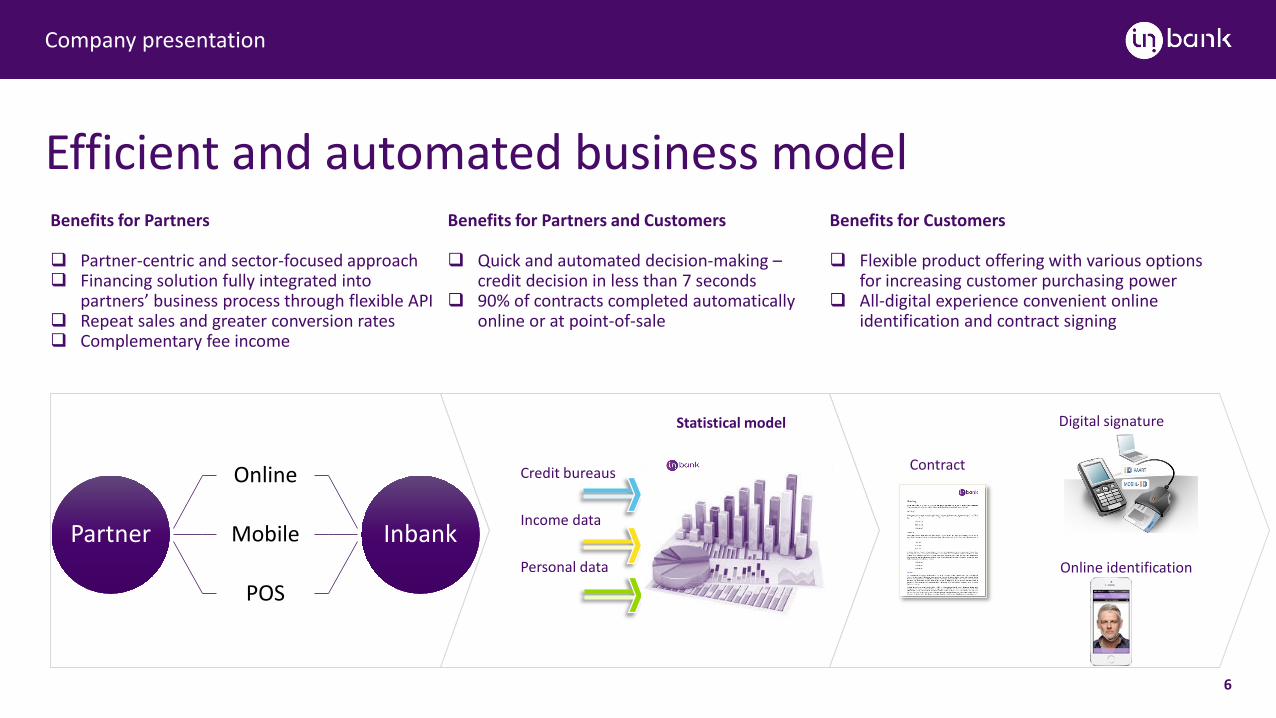
Benefits for Partners
Partner-centric and sector-focused approach Financing solution fully integrated into
partners’ business process through flexible API Repeat sales and greater conversion rates Complementary fee income
Benefits for Partners and Customers
Quick and automated decision-making –credit decision in less than 7 seconds
90% of contracts completed automatically online or at point-of-sale
Benefits for Customers
Flexible product offering with various options for increasing customer purchasing power
All-digital experience convenient online identification and contract signing
Credit bureaus
Income data
Statistical model Digital signature
Contract
Personal data Online identification
Partner
Online
Mobile
POS
Inbank
Company presentation
7
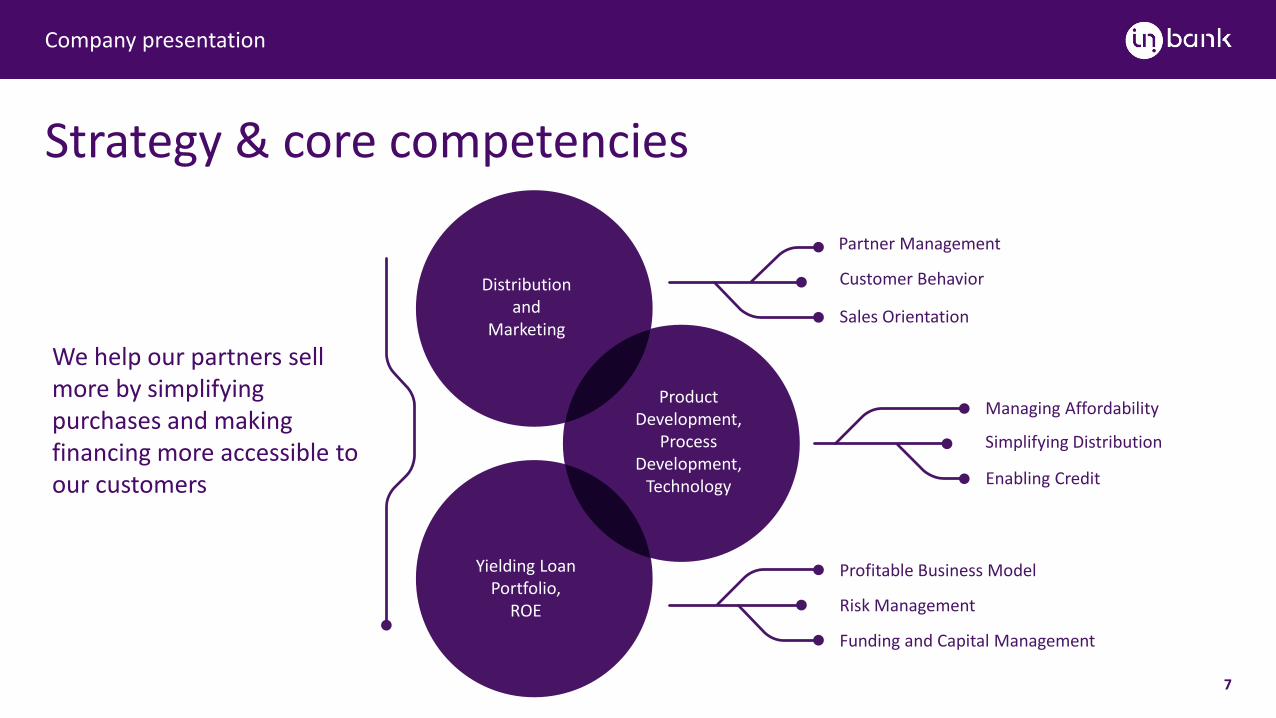
Strategy & core competencies
We help our partners sell more by simplifying purchases and making financing more accessible to our customers
Distributionand
Marketing
ProductDevelopment,
ProcessDevelopment,
Technology
Yielding LoanPortfolio,
ROE
Partner Management
Customer Behavior
Sales Orientation
Managing Affordability
Simplifying Distribution
Enabling Credit
Profitable Business Model
Risk Management
Funding and Capital Management
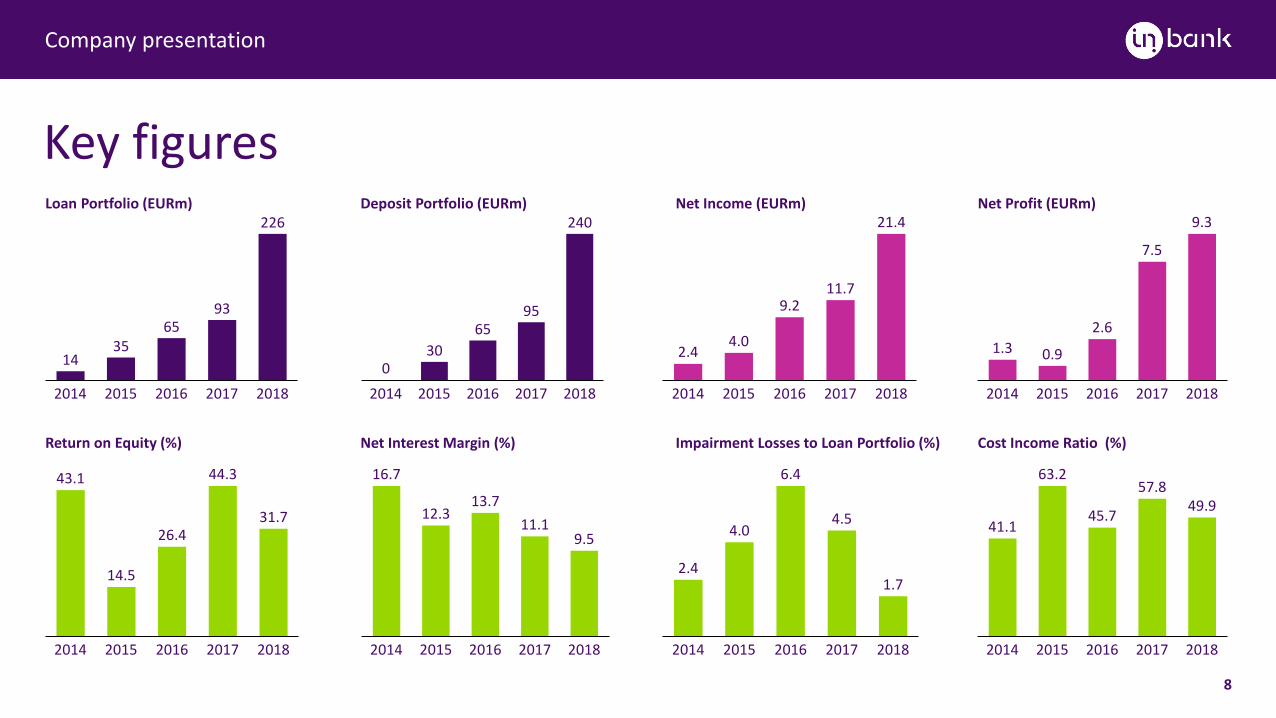
Key figures
Company presentation
26.4
2014
43.1
2015 20172016
14.5
2018
44.3
31.7
Return on Equity (%)
12.3
2015
9.5
16.7
2014 20172016 2018
13.711.1
Net Interest Margin (%) Impairment Losses to Loan Portfolio (%) Cost Income Ratio (%)
2014
2.4
20182015
4.0
20172016
6.4
4.5
1.7
2014 2015
63.2
2016
45.7
2017
57.8
41.1
2018
49.9
1435
6593
226
2014 20182015 2016 2017
Loan Portfolio (EURm)
3065
95
240
0
2014 20162015 2017 2018
Deposit Portfolio (EURm) Net Income (EURm) Net Profit (EURm)
9.2
2015
2.4
2014 2016 2017 2018
4.0
11.7
21.4
2017
0.9
2014 2015
2.6
2016
1.3
2018
7.5
9.3
8
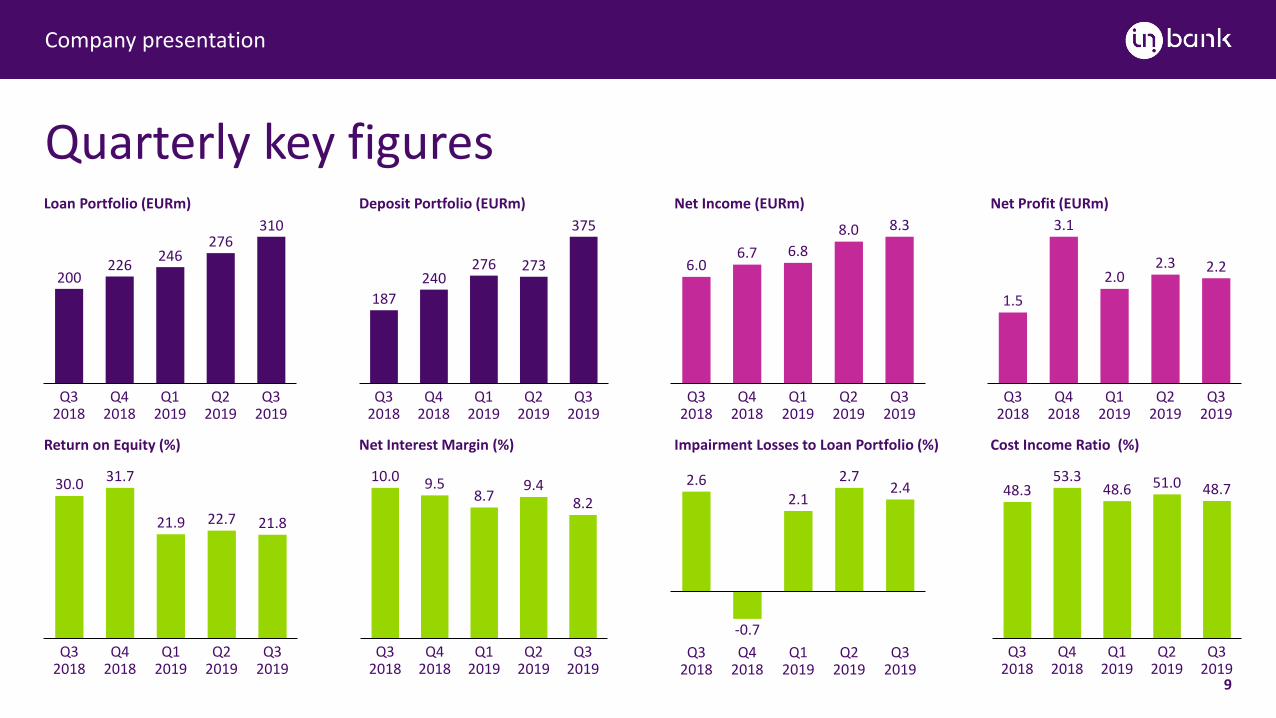
Quarterly key figures
Company presentation
30.0
Q42018
Q32018
21.9
Q12019
21.8
Q22019
Q32019
31.7
22.7
Return on Equity (%)
Q42018
Q32018
Q12019
Q32019
9.5
Q22019
10.08.7
9.48.2
Net Interest Margin (%) Impairment Losses to Loan Portfolio (%) Cost Income Ratio (%)
2.1
Q32018
Q42018
-0.7Q1
2019Q2
2019
2.6
Q32019
2.72.4
53.3
Q32018
Q22019
Q42018
Q12019
Q32019
48.648.3 51.0 48.7
200226 246
276310
Q22019
Q12019
Q32018
Q42018
Q32019
Loan Portfolio (EURm)
187240
276 273
375
Q12019
Q32018
Q42018
Q32019
Q22019
Deposit Portfolio (EURm) Net Income (EURm) Net Profit (EURm)
Q22019
Q32018
6.0
Q42018
Q12019
6.8
Q32019
6.7
8.38.0
Q32018
Q12019
Q42018
Q32019
2.01.5
Q22019
3.1
2.3 2.2
9
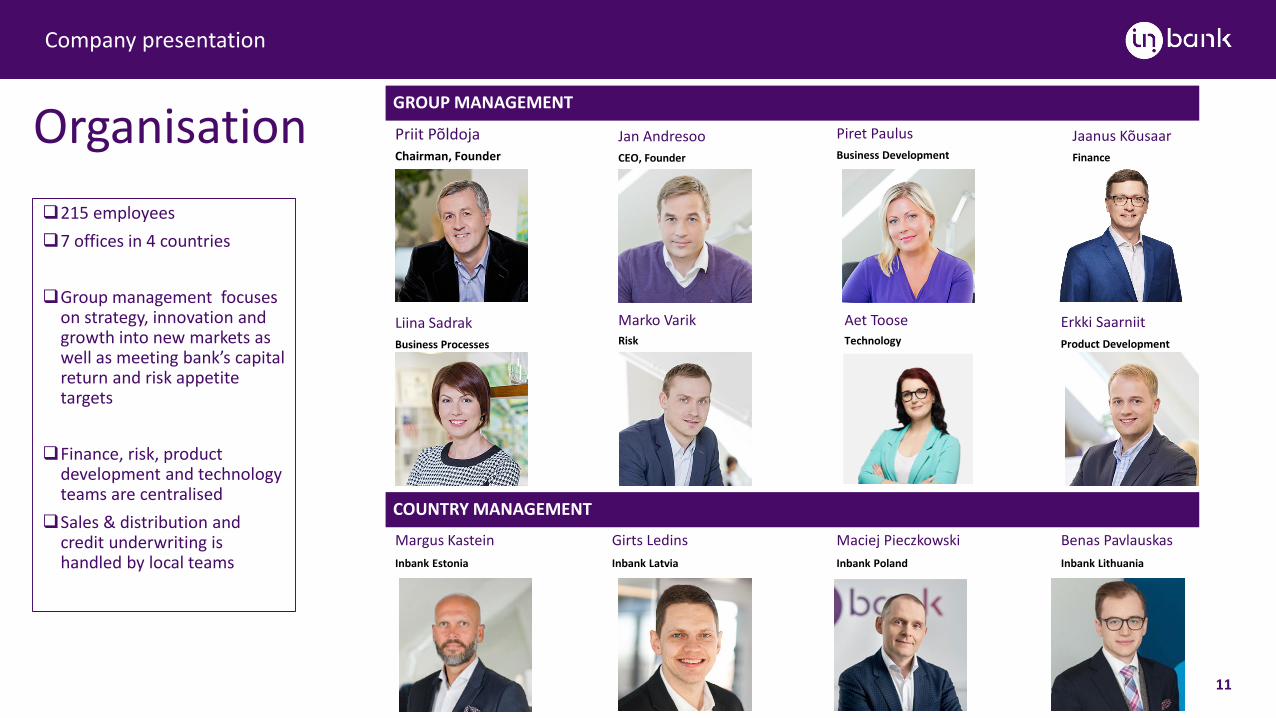
Organisation
Company presentation
11
Priit PõldojaChairman, Founder
Jan AndresooCEO, Founder
Liina SadrakBusiness Processes
Piret PaulusBusiness Development
Erkki SaarniitProduct Development
Marko VarikRisk
215 employees7 offices in 4 countries
Group management focuses on strategy, innovation and growth into new markets as well as meeting bank’s capital return and risk appetite targets
Finance, risk, product development and technology teams are centralised
Sales & distribution and credit underwriting is handled by local teams
Girts LedinsInbank Latvia
Maciej PieczkowskiInbank Poland
Benas PavlauskasInbank Lithuania
Margus KasteinInbank Estonia
Jaanus KõusaarFinance
GROUP MANAGEMENT
COUNTRY MANAGEMENT
Aet TooseTechnology
Key success factors
Company presentation
12
Profitable and scalable consumer finance business model
Excellent proprietary technology and innovative digital solutions Focused strategy and experienced, professional team
Proven track record with strong market position in the Baltics
Second largest consumer finance provider in Estonia with 12% market share Potential to grow business in Poland and expand the business model into more countries
EU banking licence for access to sustainable funding
Strong international investor base to support the growth Tier 2 bonds listed on Nasdaq Baltic exchange, AT1 capital issued Shareholding in payment service provider Maksekeskus gives potential access to payments market
Inbank ASNiine 11, 10414 [email protected]+372 640 8080inbank.ee
Inbank.ee Inbank.lv Inbank.pl mokilizingas.lt


![Company Presentation [Company Update]](https://static.fdocuments.net/doc/165x107/577cb1c71a28aba7118bdd5f/company-presentation-company-update.jpg)