In vivo visualization of dermal collagen fiber in skin ... · In vivo visualization of dermal...
9
In vivo visualization of dermal collagen fiber in skin burn by collagen-sensitive second-harmonic-generation microscopy Ryosuke Tanaka Shu-ichiro Fukushima Kunihiko Sasaki Yuji Tanaka Hiroyuki Murota Takeshi Matsumoto Tsutomu Araki Takeshi Yasui Downloaded From: https://www.spiedigitallibrary.org/journals/Journal-of-Biomedical-Optics on 7/17/2018 Terms of Use: https://www.spiedigitallibrary.org/terms-of-use
Transcript of In vivo visualization of dermal collagen fiber in skin ... · In vivo visualization of dermal...
In vivo visualization of dermal collagenfiber in skin burn by collagen-sensitivesecond-harmonic-generation microscopy
Ryosuke TanakaShu-ichiro FukushimaKunihiko SasakiYuji TanakaHiroyuki MurotaTakeshi MatsumotoTsutomu ArakiTakeshi Yasui
Downloaded From: https://www.spiedigitallibrary.org/journals/Journal-of-Biomedical-Optics on 7/17/2018Terms of Use: https://www.spiedigitallibrary.org/terms-of-use
In vivo visualization of dermal collagen fiber in skin burnby collagen-sensitive second-harmonic-generationmicroscopy
Ryosuke Tanaka,a Shu-ichiro Fukushima,a,b Kunihiko Sasaki,a Yuji Tanaka,a Hiroyuki Murota,c Takeshi Matsumoto,aTsutomu Araki,a and Takeshi Yasuia,b,daOsaka University, Graduate School of Engineering Science, 1-3 Machikaneyama, Toyonaka, Osaka 560-8531, JapanbNara Medical University, Department of Anatomy and Cell Biology, 840 Shijo-cho, Kashihara, Nara 634-8521, JapancOsaka University, Graduate School of Medicine, 2-2 Yamadaoka, Suita, Osaka 565-0871, JapandUniversity of Tokushima, Institute of Technology and Science, 2-1 Minami-Josanjima, Tokushima, Tokushima 770-8506, Japan
Abstract. Optical assessment of skin burns is possible with second-harmonic-generation (SHG) microscopy due toits high sensitivity to thermal denaturation of collagen molecules. In contrast to previous studies that were per-formed using excised tissue specimens ex vivo, in vivo observation of dermal collagen fibers in living rat burnmodels with SHG microscopy is demonstrated. Changes in signal vanishing patterns in the SHG images are con-firmed to be dependent on the burn degree. Comparison of the SHG images with Masson’s trichrome-stainedimages indicated that the observed patterns were caused by the coexistence of molten and fibrous structuresof dermal collagen fibers. Furthermore, a quantitative parameter for burn assessment based on the depth profileof the mean SHG intensity across the entire SHG image is proposed. These results and discussions imply a potentialof SHG microscopy as a minimally invasive, highly quantitative tool for skin burn assessment. © The Authors. Published by
SPIE under a Creative Commons Attribution 3.0 Unported License. Distribution or reproduction of this work in whole or in part requires full attribution of the
original publication, including its DOI. [DOI: 10.1117/1.JBO.18.6.061231]
Keywords: nonlinear microscopy; second-harmonic-generation; collagen; burn; thermal denaturation; skin; dermis; dermatology.
Paper 12654SSRR received Oct. 1, 2012; revised manuscript received Mar. 14, 2013; accepted for publication Mar. 19, 2013; publishedonline Apr. 12, 2013; corrected Apr. 18, 2013.
1 IntroductionSkin is the outer protector of the human body and is subjected toa range of environmental stimuli, such as light, mechanical, bio-chemical, and thermal stimuli. Exposure of the skin to excessiveheat, such as from a flame, hot liquid, or hot solid, sometimescauses skin burns. Burns are usually categorized into threedegrees depending on the invasion depth of thermal injury inthe skin, which has a three-layer tissue structure. In a first-degree burn, or epidermal burn, in which the injury is limitedto the epidermis, there is no need for intensive therapy becausedamaged epithelial cells can regenerate themselves. Although asecond-degree burn damages both the epidermis and dermis, theskin can still be healed by reepithelialization with suitable medi-cal treatment. Second-degree burns are further classified intosuperficial dermal burn (SDB) and deep dermal burn (DDB).On the other hand, a third-degree burn, or deep burn (DB), dam-ages down to the subcutaneous layer and causes cellular death,requiring skin graft surgery. Furthermore, DB involving over50% of the total body surface area may lead to death by infec-tion. Since the appropriate therapeutic method for the burndepends on the degree of the burn, assessment of the burndepth is a key step in determining the treatment plan.1 In par-ticular, it is important to differentiate between SDB, DDB, and
DB to prevent the spread of infection in the affected site and toachieve favorable prognosis.
Visual inspection by a medical doctor is often used in clinicalexamination. However, it is difficult for even an experienceddoctor to differentiate between SDB and DDB because thedoctor estimates the degree of the skin burn only from theappearance of the wound on the epidermis.2 The pin-pricktest is another clinical assessment often used for severeburns. Since completely damaged nerve cells lose the senseof pain to a pin-prick stimulus, this test can distinguish DBfrom other burns; however, it is still difficult to know whetherthe burn is an SDB or a DDB. There is therefore a significantneed for a reliable, minimally invasive, highly quantitative burnassessment method.
Optical probe methods are desirable for burn assessmentbecause they are simple, non-contact, and painless to the patient.Furthermore, optical probes can be directly applied because skinis superficial tissue. Optical burn assessment will be made pos-sible by obtaining biological parameters closely related with theskin burn by optical probe methods.1 Blood flow in the skin tis-sue is a useful biological parameter. Usually, there is abundantblood flow in healthy tissue. On the other hand, a skin burncauses vascular occlusion and stops the blood flow in injuredtissue. Therefore, optical probe methods for visualizing the dis-tribution of the blood flow in tissue can be used for burn assess-ment. Laser Doppler imaging (LDI) can visualize the lateraldistribution of blood flow velocity in tissue;3,4 however, it can-not provide sufficiently quantitative parameters on the burndepth. Photoacoustic (PA) microscopy can inform us of theburn depth in the form of a temporal waveform of the PA
Address all correspondence to: Takeshi Yasui, University of Tokushima, Instituteof Technology and Science, 2-1 Minami-Josanjima, Tokushima, Tokushima 770-8506, Japan. Tel and Fax: +81-88-656-7377; E-mail: [email protected]
Journal of Biomedical Optics 061231-1 June 2013 • Vol. 18(6)
Journal of Biomedical Optics 18(6), 061231 (June 2013)
Downloaded From: https://www.spiedigitallibrary.org/journals/Journal-of-Biomedical-Optics on 7/17/2018Terms of Use: https://www.spiedigitallibrary.org/terms-of-use
signal.5,6 However, since LDI and PA microscopy measure thesignal originating from the blood in healthy tissue under theinjured tissue, the obtained information does not always directlyreflect the degree of the skin burn.
If one could utilize another biological parameter that reflectsthe degree of the dermal burn more sensitively than the bloodflow, the effectiveness of optical burn assessment would begreatly improved. Collagen molecules, which are abundant inthe dermis, have the potential to provide such a biologicalparameter because thermal denaturation converts the native tri-ple helix of three polypeptide chains to a random coil. Detectingthis structural change would enable sensitive burn assessment inthe dermis, allowing differentiation among SDB, DDB, and DB.
Polarization-sensitive optical coherence tomography hasbeen used to determine burn depth because the birefringencespecific to collagen molecules and their aggregates (microfibrils,fibrils, fibers, and bundles) is reduced by thermal denatura-tion.7,8 However, since the burn causes only a small changein birefringence, it is difficult to visualize the distribution inthe burn area with high image contrast.
Second-harmonic-generation (SHG) light functions as aneffective optical probe that shows high selectivity and goodimage contrast to collagen molecules as well as high spatialresolution, optical three-dimensional (3-D) sectioning, minimalinvasiveness, deep penetration, the absence of interference frombackground light, and in vivo measurement without additionalstaining.9,10 Most importantly from the viewpoint of optical burnassessment, since SHG light arises from a non-centrosymmetrictriple helix of three polypeptide chains in the collagen molecule,its intensity decreases and finally disappears when thermaldenaturation changes the structure of this molecule to a centro-symmetric random coil.11,12 Therefore, thermal denaturationof collagen fibers in various tissues, such as the cornea,13
tendons,14–16 and dermis,17,18 has been investigated by SHGmicroscopy. These previous studies indicated that SHG lighthas the potential to be an indicator for monitoring thermal dena-turation. However, those experiments were performed usingexcised tissue specimens ex vivo. To accelerate in vivo applica-tions of SHG microscopy in the field of optical burn assessment,it is essential to evaluate the technique under in vivo conditions.In the work described in this article, we demonstrated in vivoobservation of dermal collagen fibers in rat burn models withSHG microscopy and evaluated the potential of SHG micros-copy for in vivo optical burn assessment.
2 Materials and Methods
2.1 Animal Model of Burns
The experimental protocol used in this study was approved by theBioethics Committee for Animal Experiment in Osaka Uni-versity. An animal model of burns was prepared following thewell-established protocol of Walker and Mason.19 The accuracyof this protocol has already been confirmed by histologicalexamination.5 Male Wistar rats (Japan SLC, 8 to 10 weeksold), weighing between 250 and 300 g, were used as the animalmodel and housed in a climate-controlled animal care facility forone week before use to acclimate themselves to a new environ-ment. On the day before imposing the burn, we anesthetized therats with isoflurane (4% for induction, 2% for maintenance, eachwith an O2 flow rate of 1.0 l∕min). After the animal was anes-thetized, its back was shaved and epilated with scissors and hairremover lotion. On the day of imposing the burn, we anesthetized
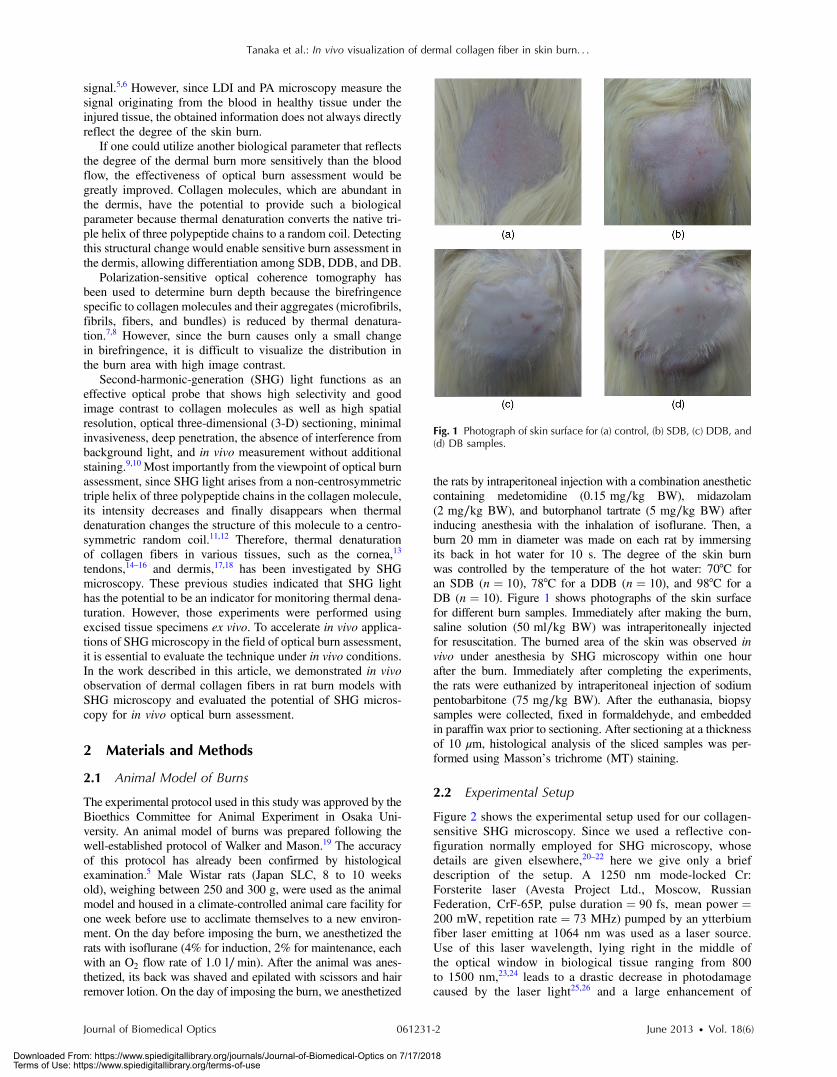
the rats by intraperitoneal injection with a combination anestheticcontaining medetomidine (0.15 mg∕kg BW), midazolam(2 mg∕kg BW), and butorphanol tartrate (5 mg∕kg BW) afterinducing anesthesia with the inhalation of isoflurane. Then, aburn 20 mm in diameter was made on each rat by immersingits back in hot water for 10 s. The degree of the skin burnwas controlled by the temperature of the hot water: 70°C foran SDB (n ¼ 10), 78°C for a DDB (n ¼ 10), and 98°C for aDB (n ¼ 10). Figure 1 shows photographs of the skin surfacefor different burn samples. Immediately after making the burn,saline solution (50 ml∕kg BW) was intraperitoneally injectedfor resuscitation. The burned area of the skin was observed invivo under anesthesia by SHG microscopy within one hourafter the burn. Immediately after completing the experiments,the rats were euthanized by intraperitoneal injection of sodiumpentobarbitone (75 mg∕kg BW). After the euthanasia, biopsysamples were collected, fixed in formaldehyde, and embeddedin paraffin wax prior to sectioning. After sectioning at a thicknessof 10 μm, histological analysis of the sliced samples was per-formed using Masson’s trichrome (MT) staining.
2.2 Experimental Setup
Figure 2 shows the experimental setup used for our collagen-sensitive SHG microscopy. Since we used a reflective con-figuration normally employed for SHG microscopy, whosedetails are given elsewhere,20–22 here we give only a briefdescription of the setup. A 1250 nm mode-locked Cr:Forsterite laser (Avesta Project Ltd., Moscow, RussianFederation, CrF-65P, pulse duration ¼ 90 fs, mean power ¼200 mW, repetition rate ¼ 73 MHz) pumped by an ytterbiumfiber laser emitting at 1064 nm was used as a laser source.Use of this laser wavelength, lying right in the middle ofthe optical window in biological tissue ranging from 800to 1500 nm,23,24 leads to a drastic decrease in photodamagecaused by the laser light25,26 and a large enhancement of
Fig. 1 Photograph of skin surface for (a) control, (b) SDB, (c) DDB, and(d) DB samples.
Journal of Biomedical Optics 061231-2 June 2013 • Vol. 18(6)
Tanaka et al.: In vivo visualization of dermal collagen fiber in skin burn. . .
Downloaded From: https://www.spiedigitallibrary.org/journals/Journal-of-Biomedical-Optics on 7/17/2018Terms of Use: https://www.spiedigitallibrary.org/terms-of-use
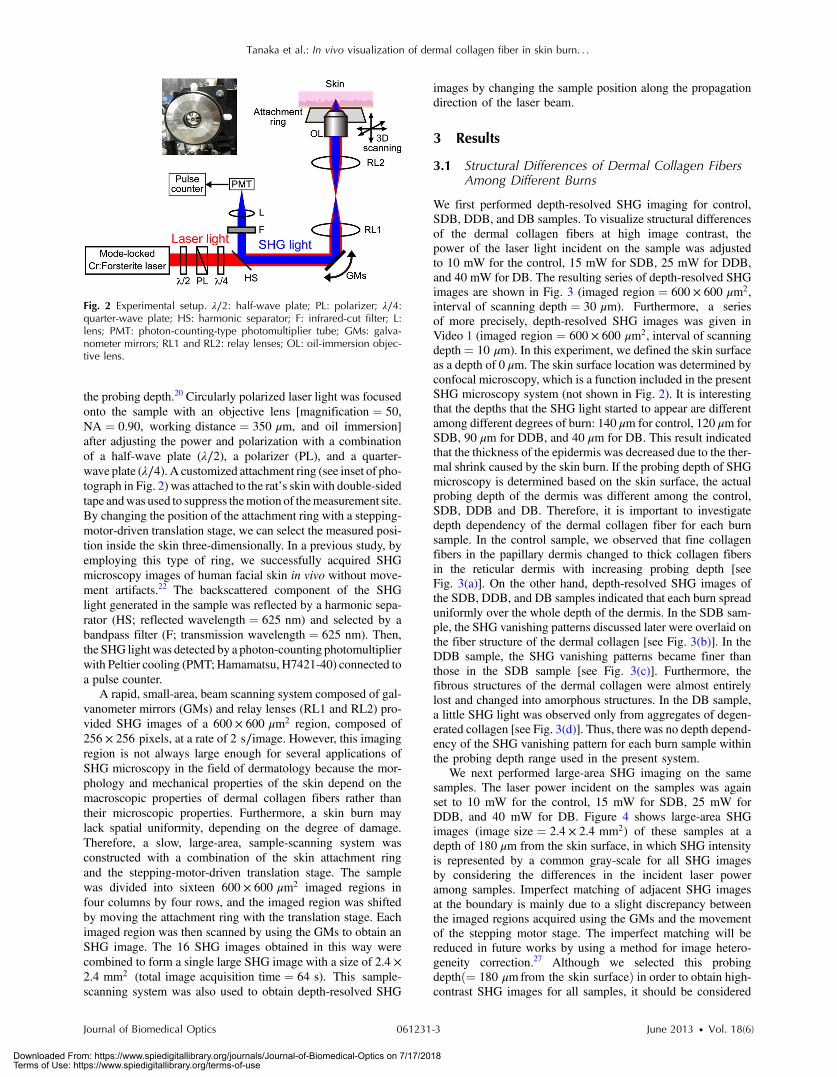
the probing depth.20 Circularly polarized laser light was focusedonto the sample with an objective lens [magnification ¼ 50,NA ¼ 0.90, working distance ¼ 350 μm, and oil immersion]after adjusting the power and polarization with a combinationof a half-wave plate (λ∕2), a polarizer (PL), and a quarter-wave plate (λ∕4). A customized attachment ring (see inset of pho-tograph in Fig. 2) was attached to the rat’s skin with double-sidedtape andwas used to suppress themotion of themeasurement site.By changing the position of the attachment ring with a stepping-motor-driven translation stage, we can select the measured posi-tion inside the skin three-dimensionally. In a previous study, byemploying this type of ring, we successfully acquired SHGmicroscopy images of human facial skin in vivo without move-ment artifacts.22 The backscattered component of the SHGlight generated in the sample was reflected by a harmonic sepa-rator (HS; reflected wavelength ¼ 625 nm) and selected by abandpass filter (F; transmission wavelength ¼ 625 nm). Then,the SHG lightwas detected by a photon-counting photomultiplierwith Peltier cooling (PMT; Hamamatsu, H7421-40) connected toa pulse counter.
A rapid, small-area, beam scanning system composed of gal-vanometer mirrors (GMs) and relay lenses (RL1 and RL2) pro-vided SHG images of a 600 × 600 μm2 region, composed of256 × 256 pixels, at a rate of 2 s∕image. However, this imagingregion is not always large enough for several applications ofSHG microscopy in the field of dermatology because the mor-phology and mechanical properties of the skin depend on themacroscopic properties of dermal collagen fibers rather thantheir microscopic properties. Furthermore, a skin burn maylack spatial uniformity, depending on the degree of damage.Therefore, a slow, large-area, sample-scanning system wasconstructed with a combination of the skin attachment ringand the stepping-motor-driven translation stage. The samplewas divided into sixteen 600 × 600 μm2 imaged regions infour columns by four rows, and the imaged region was shiftedby moving the attachment ring with the translation stage. Eachimaged region was then scanned by using the GMs to obtain anSHG image. The 16 SHG images obtained in this way werecombined to form a single large SHG image with a size of 2.4 ×2.4 mm2 (total image acquisition time ¼ 64 s). This sample-scanning system was also used to obtain depth-resolved SHG
images by changing the sample position along the propagationdirection of the laser beam.
3 Results
3.1 Structural Differences of Dermal Collagen FibersAmong Different Burns
We first performed depth-resolved SHG imaging for control,SDB, DDB, and DB samples. To visualize structural differencesof the dermal collagen fibers at high image contrast, thepower of the laser light incident on the sample was adjustedto 10 mW for the control, 15 mW for SDB, 25 mW for DDB,and 40 mW for DB. The resulting series of depth-resolved SHGimages are shown in Fig. 3 (imaged region ¼ 600 × 600 μm2,interval of scanning depth ¼ 30 μm). Furthermore, a seriesof more precisely, depth-resolved SHG images was given inVideo 1 (imaged region ¼ 600 × 600 μm2, interval of scanningdepth¼ 10 μm). In this experiment, we defined the skin surfaceas a depth of 0 μm. The skin surface location was determined byconfocal microscopy, which is a function included in the presentSHG microscopy system (not shown in Fig. 2). It is interestingthat the depths that the SHG light started to appear are differentamong different degrees of burn: 140 μm for control, 120 μm forSDB, 90 μm for DDB, and 40 μm for DB. This result indicatedthat the thickness of the epidermis was decreased due to the ther-mal shrink caused by the skin burn. If the probing depth of SHGmicroscopy is determined based on the skin surface, the actualprobing depth of the dermis was different among the control,SDB, DDB and DB. Therefore, it is important to investigatedepth dependency of the dermal collagen fiber for each burnsample. In the control sample, we observed that fine collagenfibers in the papillary dermis changed to thick collagen fibersin the reticular dermis with increasing probing depth [seeFig. 3(a)]. On the other hand, depth-resolved SHG images ofthe SDB, DDB, and DB samples indicated that each burn spreaduniformly over the whole depth of the dermis. In the SDB sam-ple, the SHG vanishing patterns discussed later were overlaid onthe fiber structure of the dermal collagen [see Fig. 3(b)]. In theDDB sample, the SHG vanishing patterns became finer thanthose in the SDB sample [see Fig. 3(c)]. Furthermore, thefibrous structures of the dermal collagen were almost entirelylost and changed into amorphous structures. In the DB sample,a little SHG light was observed only from aggregates of degen-erated collagen [see Fig. 3(d)]. Thus, there was no depth depend-ency of the SHG vanishing pattern for each burn sample withinthe probing depth range used in the present system.
We next performed large-area SHG imaging on the samesamples. The laser power incident on the samples was againset to 10 mW for the control, 15 mW for SDB, 25 mW forDDB, and 40 mW for DB. Figure 4 shows large-area SHGimages (image size ¼ 2.4 × 2.4 mm2) of these samples at adepth of 180 μm from the skin surface, in which SHG intensityis represented by a common gray-scale for all SHG imagesby considering the differences in the incident laser poweramong samples. Imperfect matching of adjacent SHG imagesat the boundary is mainly due to a slight discrepancy betweenthe imaged regions acquired using the GMs and the movementof the stepping motor stage. The imperfect matching will bereduced in future works by using a method for image hetero-geneity correction.27 Although we selected this probingdepthð¼ 180 μm from the skin surfaceÞ in order to obtain high-contrast SHG images for all samples, it should be considered
Fig. 2 Experimental setup. λ∕2: half-wave plate; PL: polarizer; λ∕4:quarter-wave plate; HS: harmonic separator; F: infrared-cut filter; L:lens; PMT: photon-counting-type photomultiplier tube; GMs: galva-nometer mirrors; RL1 and RL2: relay lenses; OL: oil-immersion objec-tive lens.
Journal of Biomedical Optics 061231-3 June 2013 • Vol. 18(6)
Tanaka et al.: In vivo visualization of dermal collagen fiber in skin burn. . .
Downloaded From: https://www.spiedigitallibrary.org/journals/Journal-of-Biomedical-Optics on 7/17/2018Terms of Use: https://www.spiedigitallibrary.org/terms-of-use
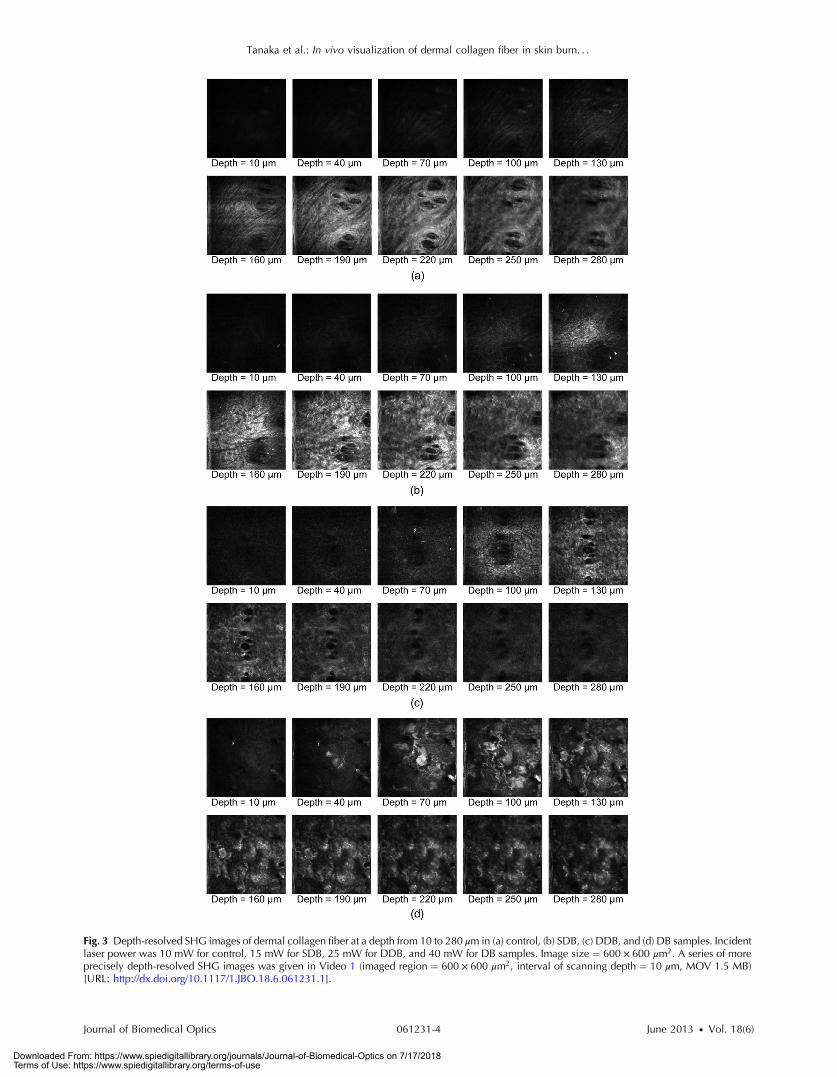
Fig. 3 Depth-resolved SHG images of dermal collagen fiber at a depth from 10 to 280 μm in (a) control, (b) SDB, (c) DDB, and (d) DB samples. Incidentlaser power was 10 mW for control, 15 mW for SDB, 25 mW for DDB, and 40 mW for DB samples. Image size ¼ 600 × 600 μm2. A series of moreprecisely depth-resolved SHG images was given in Video 1 (imaged region ¼ 600 × 600 μm2, interval of scanning depth ¼ 10 μm, MOV 1.5 MB)[URL: http://dx.doi.org/10.1117/1.JBO.18.6.061231.1].
Journal of Biomedical Optics 061231-4 June 2013 • Vol. 18(6)
Tanaka et al.: In vivo visualization of dermal collagen fiber in skin burn. . .
Downloaded From: https://www.spiedigitallibrary.org/journals/Journal-of-Biomedical-Optics on 7/17/2018Terms of Use: https://www.spiedigitallibrary.org/terms-of-use
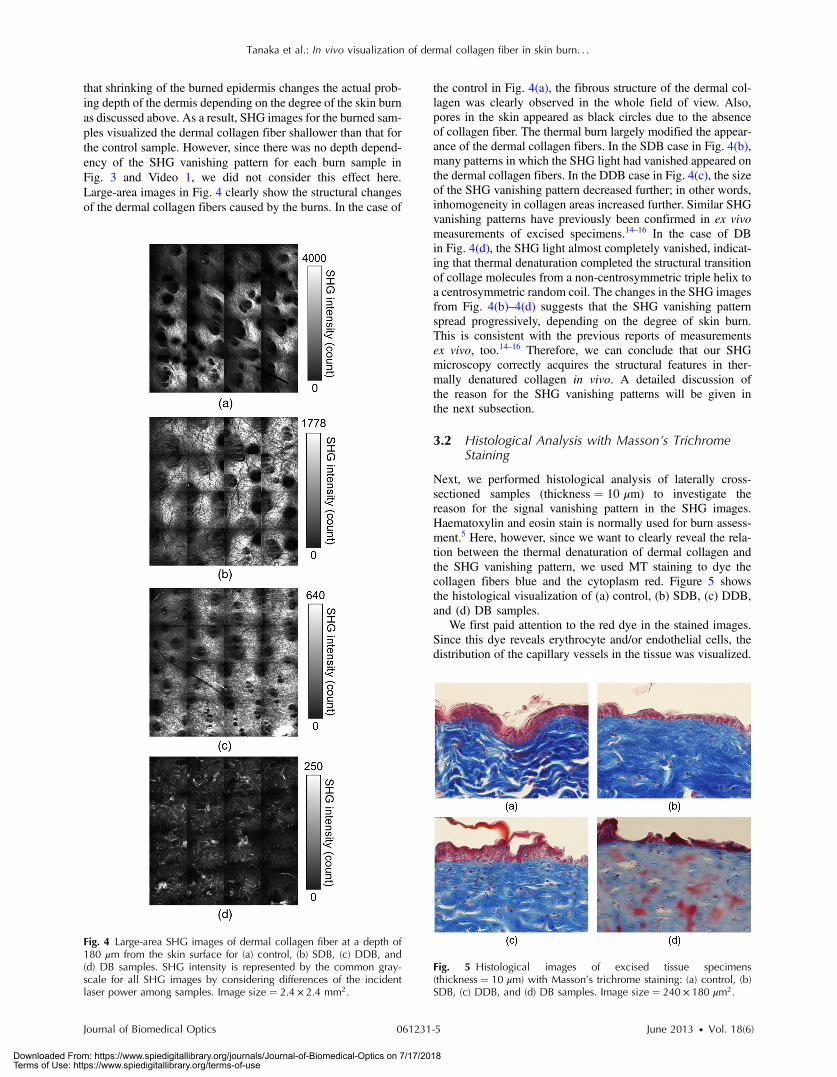
that shrinking of the burned epidermis changes the actual prob-ing depth of the dermis depending on the degree of the skin burnas discussed above. As a result, SHG images for the burned sam-ples visualized the dermal collagen fiber shallower than that forthe control sample. However, since there was no depth depend-ency of the SHG vanishing pattern for each burn sample inFig. 3 and Video 1, we did not consider this effect here.Large-area images in Fig. 4 clearly show the structural changesof the dermal collagen fibers caused by the burns. In the case of
the control in Fig. 4(a), the fibrous structure of the dermal col-lagen was clearly observed in the whole field of view. Also,pores in the skin appeared as black circles due to the absenceof collagen fiber. The thermal burn largely modified the appear-ance of the dermal collagen fibers. In the SDB case in Fig. 4(b),many patterns in which the SHG light had vanished appeared onthe dermal collagen fibers. In the DDB case in Fig. 4(c), the sizeof the SHG vanishing pattern decreased further; in other words,inhomogeneity in collagen areas increased further. Similar SHGvanishing patterns have previously been confirmed in ex vivomeasurements of excised specimens.14–16 In the case of DBin Fig. 4(d), the SHG light almost completely vanished, indicat-ing that thermal denaturation completed the structural transitionof collage molecules from a non-centrosymmetric triple helix toa centrosymmetric random coil. The changes in the SHG imagesfrom Fig. 4(b)–4(d) suggests that the SHG vanishing patternspread progressively, depending on the degree of skin burn.This is consistent with the previous reports of measurementsex vivo, too.14–16 Therefore, we can conclude that our SHGmicroscopy correctly acquires the structural features in ther-mally denatured collagen in vivo. A detailed discussion ofthe reason for the SHG vanishing patterns will be given inthe next subsection.
3.2 Histological Analysis with Masson’s TrichromeStaining
Next, we performed histological analysis of laterally cross-sectioned samples (thickness ¼ 10 μm) to investigate thereason for the signal vanishing pattern in the SHG images.Haematoxylin and eosin stain is normally used for burn assess-ment.5 Here, however, since we want to clearly reveal the rela-tion between the thermal denaturation of dermal collagen andthe SHG vanishing pattern, we used MT staining to dye thecollagen fibers blue and the cytoplasm red. Figure 5 showsthe histological visualization of (a) control, (b) SDB, (c) DDB,and (d) DB samples.
We first paid attention to the red dye in the stained images.Since this dye reveals erythrocyte and/or endothelial cells, thedistribution of the capillary vessels in the tissue was visualized.
Fig. 4 Large-area SHG images of dermal collagen fiber at a depth of180 μm from the skin surface for (a) control, (b) SDB, (c) DDB, and(d) DB samples. SHG intensity is represented by the common gray-scale for all SHG images by considering differences of the incidentlaser power among samples. Image size ¼ 2.4 × 2.4 mm2.
Fig. 5 Histological images of excised tissue specimens(thickness ¼ 10 μm) with Masson’s trichrome staining: (a) control, (b)SDB, (c) DDB, and (d) DB samples. Image size ¼ 240 × 180 μm2.
Journal of Biomedical Optics 061231-5 June 2013 • Vol. 18(6)
Tanaka et al.: In vivo visualization of dermal collagen fiber in skin burn. . .
Downloaded From: https://www.spiedigitallibrary.org/journals/Journal-of-Biomedical-Optics on 7/17/2018Terms of Use: https://www.spiedigitallibrary.org/terms-of-use
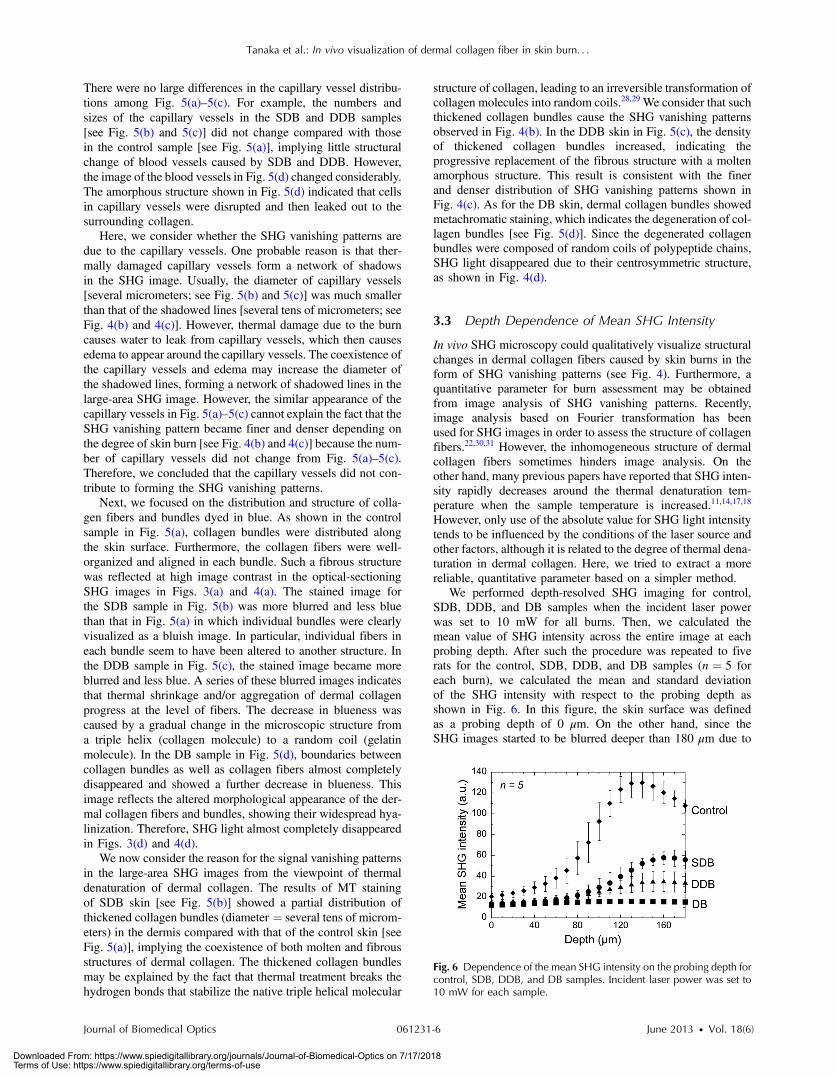
There were no large differences in the capillary vessel distribu-tions among Fig. 5(a)–5(c). For example, the numbers andsizes of the capillary vessels in the SDB and DDB samples[see Fig. 5(b) and 5(c)] did not change compared with thosein the control sample [see Fig. 5(a)], implying little structuralchange of blood vessels caused by SDB and DDB. However,the image of the blood vessels in Fig. 5(d) changed considerably.The amorphous structure shown in Fig. 5(d) indicated that cellsin capillary vessels were disrupted and then leaked out to thesurrounding collagen.
Here, we consider whether the SHG vanishing patterns aredue to the capillary vessels. One probable reason is that ther-mally damaged capillary vessels form a network of shadowsin the SHG image. Usually, the diameter of capillary vessels[several micrometers; see Fig. 5(b) and 5(c)] was much smallerthan that of the shadowed lines [several tens of micrometers; seeFig. 4(b) and 4(c)]. However, thermal damage due to the burncauses water to leak from capillary vessels, which then causesedema to appear around the capillary vessels. The coexistence ofthe capillary vessels and edema may increase the diameter ofthe shadowed lines, forming a network of shadowed lines in thelarge-area SHG image. However, the similar appearance of thecapillary vessels in Fig. 5(a)–5(c) cannot explain the fact that theSHG vanishing pattern became finer and denser depending onthe degree of skin burn [see Fig. 4(b) and 4(c)] because the num-ber of capillary vessels did not change from Fig. 5(a)–5(c).Therefore, we concluded that the capillary vessels did not con-tribute to forming the SHG vanishing patterns.
Next, we focused on the distribution and structure of colla-gen fibers and bundles dyed in blue. As shown in the controlsample in Fig. 5(a), collagen bundles were distributed alongthe skin surface. Furthermore, the collagen fibers were well-organized and aligned in each bundle. Such a fibrous structurewas reflected at high image contrast in the optical-sectioningSHG images in Figs. 3(a) and 4(a). The stained image forthe SDB sample in Fig. 5(b) was more blurred and less bluethan that in Fig. 5(a) in which individual bundles were clearlyvisualized as a bluish image. In particular, individual fibers ineach bundle seem to have been altered to another structure. Inthe DDB sample in Fig. 5(c), the stained image became moreblurred and less blue. A series of these blurred images indicatesthat thermal shrinkage and/or aggregation of dermal collagenprogress at the level of fibers. The decrease in blueness wascaused by a gradual change in the microscopic structure froma triple helix (collagen molecule) to a random coil (gelatinmolecule). In the DB sample in Fig. 5(d), boundaries betweencollagen bundles as well as collagen fibers almost completelydisappeared and showed a further decrease in blueness. Thisimage reflects the altered morphological appearance of the der-mal collagen fibers and bundles, showing their widespread hya-linization. Therefore, SHG light almost completely disappearedin Figs. 3(d) and 4(d).
We now consider the reason for the signal vanishing patternsin the large-area SHG images from the viewpoint of thermaldenaturation of dermal collagen. The results of MT stainingof SDB skin [see Fig. 5(b)] showed a partial distribution ofthickened collagen bundles (diameter ¼ several tens of microm-eters) in the dermis compared with that of the control skin [seeFig. 5(a)], implying the coexistence of both molten and fibrousstructures of dermal collagen. The thickened collagen bundlesmay be explained by the fact that thermal treatment breaks thehydrogen bonds that stabilize the native triple helical molecular
structure of collagen, leading to an irreversible transformation ofcollagen molecules into random coils.28,29 We consider that suchthickened collagen bundles cause the SHG vanishing patternsobserved in Fig. 4(b). In the DDB skin in Fig. 5(c), the densityof thickened collagen bundles increased, indicating theprogressive replacement of the fibrous structure with a moltenamorphous structure. This result is consistent with the finerand denser distribution of SHG vanishing patterns shown inFig. 4(c). As for the DB skin, dermal collagen bundles showedmetachromatic staining, which indicates the degeneration of col-lagen bundles [see Fig. 5(d)]. Since the degenerated collagenbundles were composed of random coils of polypeptide chains,SHG light disappeared due to their centrosymmetric structure,as shown in Fig. 4(d).
3.3 Depth Dependence of Mean SHG Intensity
In vivo SHG microscopy could qualitatively visualize structuralchanges in dermal collagen fibers caused by skin burns in theform of SHG vanishing patterns (see Fig. 4). Furthermore, aquantitative parameter for burn assessment may be obtainedfrom image analysis of SHG vanishing patterns. Recently,image analysis based on Fourier transformation has beenused for SHG images in order to assess the structure of collagenfibers.22,30,31 However, the inhomogeneous structure of dermalcollagen fibers sometimes hinders image analysis. On theother hand, many previous papers have reported that SHG inten-sity rapidly decreases around the thermal denaturation tem-perature when the sample temperature is increased.11,14,17,18
However, only use of the absolute value for SHG light intensitytends to be influenced by the conditions of the laser source andother factors, although it is related to the degree of thermal dena-turation in dermal collagen. Here, we tried to extract a morereliable, quantitative parameter based on a simpler method.
We performed depth-resolved SHG imaging for control,SDB, DDB, and DB samples when the incident laser powerwas set to 10 mW for all burns. Then, we calculated themean value of SHG intensity across the entire image at eachprobing depth. After such the procedure was repeated to fiverats for the control, SDB, DDB, and DB samples (n ¼ 5 foreach burn), we calculated the mean and standard deviationof the SHG intensity with respect to the probing depth asshown in Fig. 6. In this figure, the skin surface was definedas a probing depth of 0 μm. On the other hand, since theSHG images started to be blurred deeper than 180 μm due to
Fig. 6 Dependence of the mean SHG intensity on the probing depth forcontrol, SDB, DDB, and DB samples. Incident laser power was set to10 mW for each sample.
Journal of Biomedical Optics 061231-6 June 2013 • Vol. 18(6)
Tanaka et al.: In vivo visualization of dermal collagen fiber in skin burn. . .
Downloaded From: https://www.spiedigitallibrary.org/journals/Journal-of-Biomedical-Optics on 7/17/2018Terms of Use: https://www.spiedigitallibrary.org/terms-of-use
the multiple scattering, we limited the range of the abscissabelow 180 μm. We consider that the reason why the meanSHG intensities in all of the curves did not start from 0 isdue to the dark noise of the PMT and/or the backgroundnoise of the fundamental light and/or the SHG light comingfrom the sample. In the control sample, as the probing depthincreased, the SHG intensity increased, reaching its peak arounda depth of 130 μm, and then decreased. In the SDB sample, thepeak value of the mean SHG intensity was greatly decreased,and its position was shifted to a deeper portion comparedwith the control sample. In the DDB sample, the peak valueof the mean SHG intensity was further decreased, whereasthe peak position was almost the same as that of the SDB sam-ple. The mean SHG intensity for the DB sample was almost con-stant at the noise level of the detector, indicating the vanishing ofSHG light due to complete thermal denaturation of the collagenmolecules. In this way, the depth profile of the SHG lightsignificantly varied depending on the degree of the burn.
Let us consider the reason for the form of the depth profile.First, SHG light starts to be generated when the focal spot movesfrom the epidermis to the dermis, and then the generated SHGlight reaches a plateau when the focal spot probes a deeper por-tion in the dermis. Second, the laser light arriving at the focalspot is attenuated due to scattering and absorption, depending onthe probing depth. Third, the backscattered SHG light from thefocal spot is attenuated in proportional to the probing depth untilreaching the skin surface. The balance of these three effectsdetermines the depth profile of the control in Fig. 6, wherethe SHG light increased, reached the peak, and decreased.Next, we consider the depth profile in the case of SDB,DDB, or DB. Thermal denaturation of dermal collagen fiberlargely reduces the generation efficiency of SHG light, namely,the second-order nonlinear-optical susceptibility χð2Þ, due tothe structural transition from a triple helix to a random coil.Simultaneously, the burn changes the optical scattering andabsorption properties in the epidermis and dermis. These leadto the observed differences among the rising slopes shownin Fig. 6.
One interesting feature in these depth profiles is the differ-ence of the depth, indicating the peak of mean SHG intensity,among different burn samples. However, since the depths thatthe SHG light started to appear were different among themdue to the shrink of the burned epidermis as shown in Fig. 3and Video 1, this parameter may include the influence of theshrunk epidermis. Another interesting feature is the differenceof the rising slope among them. To extract this rising slope as aquantitative parameter relating to the skin burn, we performedthe curve fitting analysis using an error function (erf) as follows
IðxÞ ¼ I02
�1þ erf
�x − xcd
��; (1)
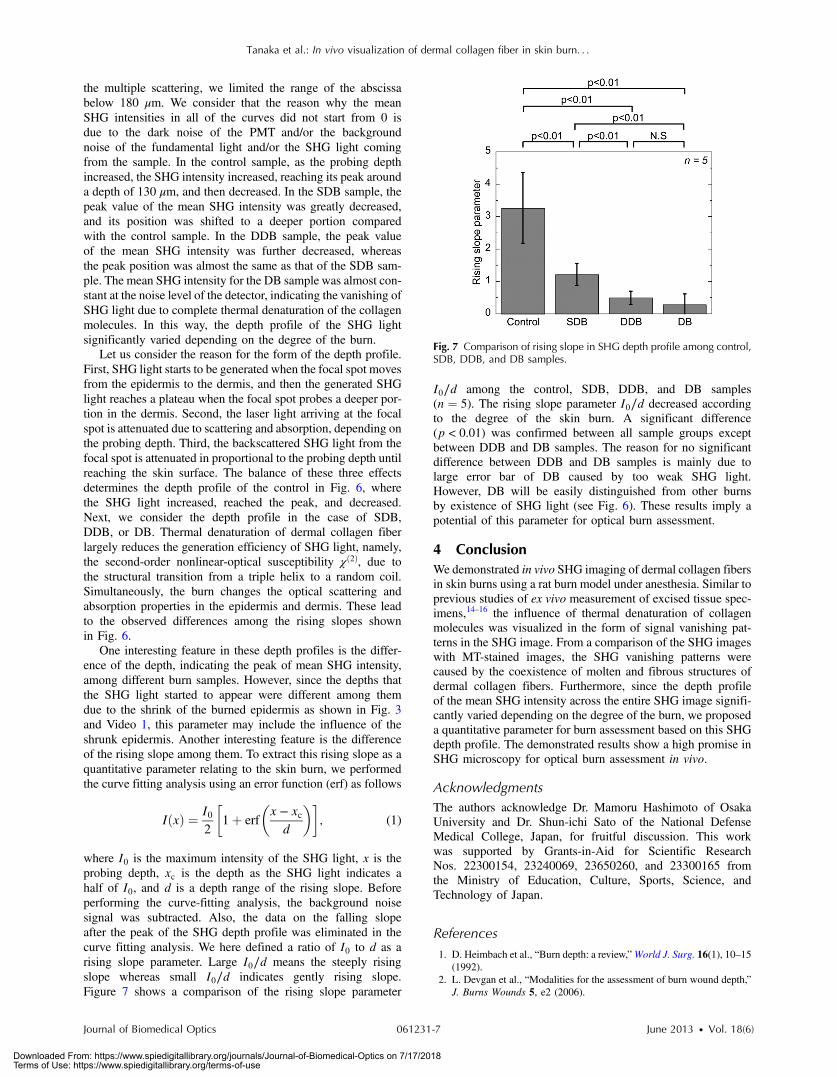
where I0 is the maximum intensity of the SHG light, x is theprobing depth, xc is the depth as the SHG light indicates ahalf of I0, and d is a depth range of the rising slope. Beforeperforming the curve-fitting analysis, the background noisesignal was subtracted. Also, the data on the falling slopeafter the peak of the SHG depth profile was eliminated in thecurve fitting analysis. We here defined a ratio of I0 to d as arising slope parameter. Large I0∕d means the steeply risingslope whereas small I0∕d indicates gently rising slope.Figure 7 shows a comparison of the rising slope parameter
I0∕d among the control, SDB, DDB, and DB samples(n ¼ 5). The rising slope parameter I0∕d decreased accordingto the degree of the skin burn. A significant difference(p < 0.01) was confirmed between all sample groups exceptbetween DDB and DB samples. The reason for no significantdifference between DDB and DB samples is mainly due tolarge error bar of DB caused by too weak SHG light.However, DB will be easily distinguished from other burnsby existence of SHG light (see Fig. 6). These results imply apotential of this parameter for optical burn assessment.
4 ConclusionWe demonstrated in vivo SHG imaging of dermal collagen fibersin skin burns using a rat burn model under anesthesia. Similar toprevious studies of ex vivo measurement of excised tissue spec-imens,14–16 the influence of thermal denaturation of collagenmolecules was visualized in the form of signal vanishing pat-terns in the SHG image. From a comparison of the SHG imageswith MT-stained images, the SHG vanishing patterns werecaused by the coexistence of molten and fibrous structures ofdermal collagen fibers. Furthermore, since the depth profileof the mean SHG intensity across the entire SHG image signifi-cantly varied depending on the degree of the burn, we proposeda quantitative parameter for burn assessment based on this SHGdepth profile. The demonstrated results show a high promise inSHG microscopy for optical burn assessment in vivo.
AcknowledgmentsThe authors acknowledge Dr. Mamoru Hashimoto of OsakaUniversity and Dr. Shun-ichi Sato of the National DefenseMedical College, Japan, for fruitful discussion. This workwas supported by Grants-in-Aid for Scientific ResearchNos. 22300154, 23240069, 23650260, and 23300165 fromthe Ministry of Education, Culture, Sports, Science, andTechnology of Japan.
References1. D. Heimbach et al., “Burn depth: a review,”World J. Surg. 16(1), 10–15
(1992).2. L. Devgan et al., “Modalities for the assessment of burn wound depth,”
J. Burns Wounds 5, e2 (2006).
Fig. 7 Comparison of rising slope in SHG depth profile among control,SDB, DDB, and DB samples.
Journal of Biomedical Optics 061231-7 June 2013 • Vol. 18(6)
Tanaka et al.: In vivo visualization of dermal collagen fiber in skin burn. . .
Downloaded From: https://www.spiedigitallibrary.org/journals/Journal-of-Biomedical-Optics on 7/17/2018Terms of Use: https://www.spiedigitallibrary.org/terms-of-use

3. F. W. H. Kloppenberg, G. I. J. M. Beerthuizen, and H. J. ten Duis,“Perfusion of burn wounds assessed by laser Doppler imaging is relatedto burn depth and healing time,” Burns 27(4), 359–363 (2001).
4. A. D. Jaskille et al., “Critical review of burn depth assessment tech-niques: part II. Review of laser Doppler technology,” J. Burn CareRes. 31(1), 151–157 (2010).
5. S. Sato et al., “Photoacoustic diagnosis of burns in rats,” J. Trauma59(6), 1450–1456 (2005).
6. H. F. Zhang et al., “Imaging acute thermal burns by photoacousticmicroscopy,” J. Biomed. Opt. 11(5), 054033 (2006).
7. B. H. Park et al., “In vivo burn depth determination by high-speed fiber-based polarization sensitive optical coherence tomography,” J. Biomed.Opt. 6(4), 474–479 (2001).
8. M. C. Pierce et al., “Collagen denaturation can be quantified in burnedhuman skin using polarization-sensitive optical coherence tomography,”Burns 30(6), 511–517 (2004).
9. I. Freund, M. Deutsch, and A. Sprecher, “Connective tissue polarity.Optical second-harmonic microscopy, cross-beam summation, andsmall-angle scattering in rat-tail tendon,” Biophys. J. 50(4), 693–712(1986).
10. P. J. Campagnola and C.-Y. Dong, “Second harmonic generationmicroscopy: principles and applications to disease diagnosis,” LaserPhoton. Rev. 5(1), 13–26 (2011).
11. B. M. Kim et al., “Collagen structure and nonlinear susceptibility:effects of heat, glycation, and enzymatic cleavage on second harmonicsignal intensity,” Lasers Surg. Med. 27(4), 329–335 (2000).
12. T. Theodossiou et al., “Thermally induced irreversible conformationalchanges in collagen probed by optical second harmonic generation andlaser-induced fluorescence,” Lasers Med. Sci. 17(1), 34–41 (2002).
13. H. Y. Tan et al., “Characterizing the thermally induced structuralchanges to intact porcine eye, part 1: second harmonic generationimaging of cornea stroma,” J. Biomed. Opt. 10(5), 054019 (2005).
14. S.-J. Lin et al., “Monitoring the thermally induced structural transitionsof collagen by use of second-harmonic generation microscopy,” Opt.Lett. 30(6), 622–624 (2005).
15. S.-J. Lin et al., “Prediction of heat-induced collagen shrinkage by useof second harmonic generation microscopy,” J. Biomed. Opt. 11(3),034020 (2006).
16. Y. Sun et al., “Investigating mechanisms of collagen thermal denatura-tion by high resolution second-harmonic generation imaging originalresearch article,” Biophys. J. 91(7), 2620–2625 (2006).
17. M.-G. Lin et al., “Evaluation of dermal thermal damage by multiphotonautofluorescence and second-harmonic-generation microscopy,”J. Biomed. Opt. 11(6), 064006 (2006).
18. T. Yasui et al., “Determination of burn depth based on depth-resolvedsecond-harmonic-generation imaging of dermal collagen,” inBiomedical Optics, pp. BSuD104, The Optical Society of America,Miami, Florida (2010).
19. H. L. Walker and A. D. Mason, “A standard animal burn,” J. Trauma8(6), 1049–1051 (1968).
20. T. Yasui et al., “Ex vivo and in vivo second-harmonic-generation im-aging of dermal collagen fiber in skin: comparison of imaging character-istics between mode-locked Cr:Forsterite and Ti:Sapphire lasers,” Appl.Opt. 48(10), D88–D95 (2009).
21. T. Yasui et al., “Observation of dermal collagen fiber in wrinkled skinusing polarization-resolved second-harmonic-generation microscopy,”Opt. Express 17(2), 912–923 (2009).
22. T. Yasui et al., “In vivo observation of age-related structural changes ofdermal collagen in human facial skin using collagen-sensitive secondharmonic generation microscope equipped with 1250-nm mode-lockedCr:Forsterite laser,” J. Biomed. Opt. 18(3), 031108 (2013).
23. R. R. Anderson and J. A. Parish, “The optics of human skin,” J. Invest.Dermatol. 77(1), 13–19 (1981).
24. P. C. Cheng et al., “Highly efficient upconverters for multiphoton fluo-rescence microscopy,” J. Microsc. 189(3), 199–212 (1998).
25. S.-W. Chu et al., “In vivo developmental biology study using noninva-sive multi-harmonic generation microscopy,” Opt. Express 11(23),3093–3099 (2003).
26. S.-P. Tai et al., “In vivo optical biopsy of hamster oral cavity withepi-third-harmonic-generation microscopy,” Opt. Express 14(13),6178–6187 (2006).
27. V. A. Hovhannisyan et al., “Image heterogeneity correction in large-area, three-dimensional multiphoton microscopy,” Opt. Express16(7), 5107–5117 (2008).
28. N. T. Wright and J. D. Humphrey, “Denaturation of collagen via heat-ing: an irreversible rate process,” Annu. Rev. Biomed. Eng. 4(1),109–128 (2002).
29. K. Hayashi et al., “The effect of nonablative laser energy on theultrastructure of joint capsular collagen,” Arthroscopy 12(4), 474–481(1996).
30. R. A. Rao, M. R. Mehta, and K. C. Toussaint, “Fourier transform-second-harmonic generation imaging of biological tissues,” Opt.Express 17(17), 14534–14542 (2009).
31. M. Sivaguru et al., “Quantitative analysis of collagen fiber organizationin injured tendons using Fourier transform-second harmonic generationimaging,” Opt. Express 18(24), 24983–24993 (2010).
Journal of Biomedical Optics 061231-8 June 2013 • Vol. 18(6)
Tanaka et al.: In vivo visualization of dermal collagen fiber in skin burn. . .
Downloaded From: https://www.spiedigitallibrary.org/journals/Journal-of-Biomedical-Optics on 7/17/2018Terms of Use: https://www.spiedigitallibrary.org/terms-of-use