In vitro stability and metabolism of salvinorin A in rat ... vitro stability and metabolism of...
8
Xenobiotica, 2009; 39(5): 391–398 RESEARCH ARTICLE In vitro stability and metabolism of salvinorin A in rat plasma K. Tsujikawa, K. Kuwayama, H. Miyaguchi, T. Kanamori, Y. T. Iwata, and H. Inoue National Research Institute of Police Science, Kashiwa, Japan Address for Correspondence: K. Tsujikawa, National Research Institute of Police Science, 6-3-1, Kashiwanoha, Kashiwa 277-0882, Japan. E-mail: tujikawa@ nrips.go.jp (Received 23 October 2008; revised 21 January 2009; accepted 22 January 2009) Introduction Salvia divinorum (Lamiaceae), which is native to Oaxaca in Central Mexico, has been used for traditional medi- cine and spiritual practices because of its hallucinogenic properties (Valdés et al. 1983). In recent years, this plant has been become widely available as a hallucinogen throughout the world due to internet trading. It is illegal at present to buy, sell or possess the plant or its active prin- cipal component in several countries such as Australia, Belgium, Denmark, Finland, Italy, South Korea, and Spain (Medana et al. 2006). In Japan, selling this plant has been controlled by the Pharmaceutical Affairs Law since 2007. e main active ingredient in S. divinorum is salvinorin A (SalA), a non-nitrogenous neoclerodane diterpene (Siebert 1994; Valdés 1994). is compound is shown to be a potent and selective -opioid receptor agonist in vitro and in vivo (Roth et al. 2002; Chavkin et al. 2004; Butelman et al. 2004). SalA may be converted to a deacetylated metabolite salvinorin B (SalB), which is devoid of significant affinity for the -opioid receptor (Chavkin et al. 2004), in rhesus monkey blood by este- rases (Schmidt 2005). Considering this SalA instability, it is necessary to investigate the stability of SalA and how to prevent its degradation for the future pharmacoki- netic study. ISSN 0049-8254 print/ISSN 1366-5928 online © 2009 Informa UK Ltd DOI: 10.1080/00498250902769967 Abstract 1. Salvinorin A is the main active psychoactive ingredient in Salvia divinorum, a Mexican plant that has been widely available as a hallucinogen in recent years. The aims of this study were to investigate the stability of salvinorin A in rat plasma, esterases responsible for its degradation, and estimation of the degradation products. 2. The apparent first-order rate constants of salvinorin A at 37°C, 25°C, and 4°C were 3.8 × 10 −1 , 1.1 × 10 −1 , and < 6.0 × 10 −3 h −1 , respectively. 3. Salvinorin A degradation was markedly inhibited by the addition of sodium fluoride, an esterase inhibitor. Moreover, phenylmethylsulfonyl fluoride (serine esterase inhibitor) and bis-p-nitrophenyl phosphate (carboxylesterase inhibitor) also inhibited salvinorin A degradation. In contrast, little or no suppression of the degradation was seen with 5,5´-dithiobis-2-nitrobenzoic acid (arylesterase inhibi- tor), ethopropazine (butyrylcholinesterase inhibitor), and BW284c51 (acetylcholineseterase inhibitor). These findings indicated that carboxylesterase was mainly involved in the salvinorin A hydrolysis in rat plasma. 4. The degradation products of salvinorin A estimated by liquid chromatography-mass spectrom- etry included the deacetylated form (salvinorin B) and the lactone-ring-open forms of salvinorin A and salvinorin B. This lactone-ring-opening reactions were involved in calcium-dependent lactonase. Keywords: Salvinorin A; rat plasma; degradation; carboxylesterase http://www.informapharmascience.com/xen
Transcript of In vitro stability and metabolism of salvinorin A in rat ... vitro stability and metabolism of...
Xenobiotica, 2009; 39(5): 391–398
R E S E A R C H A R T I C L E
In vitro stability and metabolism of salvinorin A in rat plasma
K. Tsujikawa, K. Kuwayama, H. Miyaguchi, T. Kanamori, Y. T. Iwata, and H. Inoue
National Research Institute of Police Science, Kashiwa, Japan
Address for Correspondence: K. Tsujikawa, National Research Institute of Police Science, 6-3-1, Kashiwanoha, Kashiwa 277-0882, Japan. E-mail: [email protected]
(Received 23 October 2008; revised 21 January 2009; accepted 22 January 2009)
Introduction
Salvia divinorum (Lamiaceae), which is native to Oaxaca in Central Mexico, has been used for traditional medi-cine and spiritual practices because of its hallucinogenic properties (Valdés et al. 1983). In recent years, this plant has been become widely available as a hallucinogen throughout the world due to internet trading. It is illegal at present to buy, sell or possess the plant or its active prin-cipal component in several countries such as Australia, Belgium, Denmark, Finland, Italy, South Korea, and Spain (Medana et al. 2006). In Japan, selling this plant has been controlled by the Pharmaceutical Affairs Law since 2007.
The main active ingredient in S. divinorum is salvinorin A (SalA), a non-nitrogenous neoclerodane diterpene (Siebert 1994; Valdés 1994). This compound is shown to be a potent and selective -opioid receptor agonist in vitro and in vivo (Roth et al. 2002; Chavkin et al. 2004; Butelman et al. 2004). SalA may be converted to a deacetylated metabolite salvinorin B (SalB), which is devoid of significant affinity for the -opioid receptor (Chavkin et al. 2004), in rhesus monkey blood by este-rases (Schmidt 2005). Considering this SalA instability, it is necessary to investigate the stability of SalA and how to prevent its degradation for the future pharmacoki-netic study.
ISSN 0049-8254 print/ISSN 1366-5928 online © 2009 Informa UK LtdDOI: 10.1080/00498250902769967
Abstract1. Salvinorin A is the main active psychoactive ingredient in Salvia divinorum, a Mexican plant that has
been widely available as a hallucinogen in recent years. The aims of this study were to investigate the stability of salvinorin A in rat plasma, esterases responsible for its degradation, and estimation of the degradation products.
2. The apparent first-order rate constants of salvinorin A at 37°C, 25°C, and 4°C were 3.8 × 10⁻¹, 1.1 × 10⁻¹, and < 6.0 × 10⁻³ h−1, respectively.
3. Salvinorin A degradation was markedly inhibited by the addition of sodium fluoride, an esterase inhibitor. Moreover, phenylmethylsulfonyl fluoride (serine esterase inhibitor) and bis-p-nitrophenyl phosphate (carboxylesterase inhibitor) also inhibited salvinorin A degradation. In contrast, little or no suppression of the degradation was seen with 5,5´-dithiobis-2-nitrobenzoic acid (arylesterase inhibi-tor), ethopropazine (butyrylcholinesterase inhibitor), and BW284c51 (acetylcholineseterase inhibitor). These findings indicated that carboxylesterase was mainly involved in the salvinorin A hydrolysis in rat plasma.
4. The degradation products of salvinorin A estimated by liquid chromatography-mass spectrom-etry included the deacetylated form (salvinorin B) and the lactone-ring-open forms of salvinorin A and salvinorin B. This lactone-ring-opening reactions were involved in calcium-dependent lactonase.
Keywords: Salvinorin A; rat plasma; degradation; carboxylesterase
http://www.informapharmascience.com/xen

392 K. Tsujikawa et al.
In rat, esterase activity in whole blood was mainly attributed to high plasma esterase activity (Minagawa et al. 1995). Rat plasma contains four kinds of pharma-cokinetically important esterases: butyrylcholinesterase (BChE, EC 3.1.1.8), acetylcholinesterase (AChE, EC 3.1.1.7), arylesterase (ArE, EC 3.1.1.2), and carboxy-lesterase (CES, EC 3.1.1.1). It is important for pharma-cokinetic studies to determine the responsible esterase species, because these esterases have broad but different substrate specificities. For example, CES is responsible for degradation of CPT-11 (Tsuji et al. 1991), while ArE is responsible for degradation of prulifloxacin (Tougou et al. 1998).
In this paper, we first evaluated the stability of SalA and its metabolite SalB in rat plasma, as well as the effects of sodium fluoride (NaF), an esterase inhibitor. Secondly, we attempted to characterize the esterases responsible for SalA degradation using selective inhibi-tors. Finally, we estimated degradation products of SalA using liquid chromatography-mass spectrometry (LC-MS) and the esterases responsible for the degrada-tion using inhibitors.
Materials and methods
Chemicals and materials
SalA was isolated from leaves of S. divinorum as previ-ously described with minor modifications (Tidgewell et al. 2004). SalB and SalA-d
3 were prepared from SalA
according to the method previously reported (Tidgewell et al. 2004). NaF, 5,5´-dithiobis-2-nitrobenzoic acid (DTNB), and ethylenediaminetetraacetic acid (EDTA) disodium salt dihydrate were obtained from Wako Pure Chemical Industry (Osaka, Japan). Sodium bis-p-nitrophenyl phosphate (BNPP), phenylmethylsulfonyl fluoride (PMSF), and BW284c51 were obtained from Sigma (St Louis, MO, USA). Ethopropazine hydro-chloride was obtained from Spectrum Chemical (New Brunswick, NJ, USA). Other chemicals were of reagent or high-performance liquid chromatography (HPLC) grade.
Fresh whole blood was collected from diethyl ether-anaesthetized male Wistar rats (Nihon Seibutsu Zairyo Center, Tokyo, Japan) into heparinized tubes. Plasma was separated by centrifugation at 1200g at 4°C for 10 min and pooled plasma was stored at −80°C. The fro-zen plasma was thawed at 4°C before assay.
Evaluation of SalA and SalB stability in rat plasma
The rat plasma (100 l) was pre-incubated at 37°C, 25°C or 4°C for 5 min. The reaction was initiated by adding 20 l of SalA solution (50 ng, in 2.5% v/v acetonitrile in
water). The assay was carried out at 37°C, 25°C or 4°C, which corresponded to body temperature, usual room temperature or short-term storage temperature in a refrigerator, respectively. At different time intervals (maximum incubation = 48 h), the reaction was stopped by addition of 50 l of saturated NaF solution and by placement of the tube on ice, and 350 l of 50 mM Tris-HCl buffer (pH 7.4) were added. Quantification of SalA and SalB in these samples was performed as described below.
Investigation of the effects of the esterases on SalA and SalB stability was carried out by adding NaF (10 mg ml−1) to the plasma before assay. These samples were also assayed as described above.
Effect of the various esterase inhibitors on SalA degradation
To characterize the esterases responsible for SalA degradation, SalA was incubated in the rat plasma in the presence of the various esterase inhibitors, such as PMSF, BNPP, ethopropazine, and DTNB. The rat plasma (100 l) was mixed with 350 l of 50 mM Tris-HCl buffer (pH 7.4) and either 50 l of the inhibitor solution (in 10% v/v dimethylsulfoxide in water) or 50 l of the 10% dimethylsulfoxide (as control). The reaction was initiated by adding 20 l of SalA solu-tion (50 ng, in 2.5% v/v acetonitrile in water). The mixtures were incubated at 37°C for 2 h. The reaction was stopped by adding 50 l of saturated NaF solution and the tube was placed on ice. Quantification of SalA and SalB in these samples was performed as described below. Uninhibited hydrolysis activity was calculated as follows:
Uninhibited hydrolysis activity= A B/ (1)
where A and B represent SalB amounts produced by the incubation with and without the inhibitor, respectively.
Quantitative analysis of SalA and SalB
After adding 10 l of SalA-d3 solution (1 g ml−1 in
acetonitrile) as an internal standard, the samples were extracted twice with 2 ml portions of chloroform/2-pro-panol (9:1, v/v) for 5 min. After centrifugation (1620g) for 5 min, the organic layer was transferred to a tapered glass tube and evaporated to dryness under nitrogen gas. The residues were dissolved in 100 l of a mixture of aqueous solution of 0.05% v/v formic acid/acetonitrile (7:3, v/v), followed by filtration through a 0.45 m mem-brane (UNIFILTER, Whatman, Clifton, NJ, USA) and a 5-l aliquot was used for analysis.
The separation and detection were carried out using a Waters liquid chromatography-tandem mass
Stability/metabolism of salvinorin A in rat plasma 393
spectrometry system (LC-MS/MS) (Milford, MA, USA) consisting of an Acquity Ultra Performance Liquid Chromatography system and a Quattro Premier XE triple quadrupole mass spectrometer equipped with an elec-trospray ionization (ESI) interface. Chromatographic separations were performed with an Acquity UPLC BEH C18 column ( 50 mm × 2. 1 mm, 1.7 m; Waters) maintained at 40°C. The mobile phase was 0.05% v/v formic acid in water/acetonitrile with a constant flow rate of 0.2 ml min−1. The acetonitrile percentages were: 0–0.3 min, 30%; 0.3–7.0 min, linearly from 30% to 70%; 7.0–9.0 min, linearly from 70% to 90%; 9.0–10.0 min, 100%; and 10.0–15.0 min (equilibration of the column), 30%. Measurement of SalA, SalA-d
3 and SalB was car-
ried out by selected reaction monitoring in the positive-ion mode. Monitoring ion pairs (precursor/product) were 433.0/372.7 for SalA, 435.9/372.5 for SalA-d
3 and
390.7/250.8 for SalB.The calibration curves were linear in the ranges of
10–500 ng ml−1 for SalA and 2–500 ng ml−1 for SalB, with correlation coefficients that were routinely greater than 0.997.
Data analysis
The kinetic data were calculated by the KaleidaGraph computer program (Synergy Software; Reading, PA, USA) and were fitted by non-linear least-squares regres-sion analysis. Kinetic parameters and their standard errors (SE) were calculated from mean values of tripli-cate determinations at each time point.
Estimation of SalA and SalB metabolites and their time-intensity profiles
Estimation of unknown SalA and SalB metabolites and their time-intensity profiles of the relative amounts were carried out using higher-concentrated samples. To 200 l of rat plasma, 5 l of SalA or SalB solution (each 1 mg ml−1 in dimethylsulfoxide) were added. The sam-ples containing 10 mg ml−1 of NaF or 3 mg ml−1 EDTA in the plasma were also prepared. After these samples were incubated at 37°C for 24 h (for estimation of the metabolites) and 0 h, 1 h, 2 h, 4 h, 8 h and 24 h (for the time-intensity profile study), they were mixed with 1 ml of acetonitrile and centrifuged at 10000g at 4°C for 10 min. After the supernatant was evaporated to dryness under nitrogen gas, the residue was dissolved in 100 l of a mixture of an aqueous solution of 0.05% v/v formic acid/acetonitrile (6:4, v/v), followed by filtration and a 20-l aliquot was used for analysis.
The separation and detection were carried out using a Waters LC-MS system consisting of a 2690 series high-performance liquid chromatography system and a ZQ single-quadrupole mass spectrometer with an
ESI interface in the negative mode. Chromatographic separations were performed with a Mightysil RP-18 col-umn (2. 0 mm × 150 mm, 5 m; Kanto Chemical, Tokyo, Japan), maintained at 40°C. The mobile phase was 0.05% v/v formic acid in water/acetonitrile with a con-stant flow rate of 0.2 ml min−1. The acetonitrile percent-ages were: 0–1 min, 40%; 1–16 min, linearly from 40% to 70%; 16–18 min, linearly from 70% to 100%; 18–21 min, 100%; and 21–35 min (equilibration of the column), 40%. Eluting materials were recorded in the scan mode (scan range = m/z 200–500) for estimation of the metabolites and in the selected ion monitoring mode (monitoring ions = m/z 389, 407, 431 and 449) for the time-intensity profile study.
Results and discussion
Effect of temperature and NaF on the SalA degradation
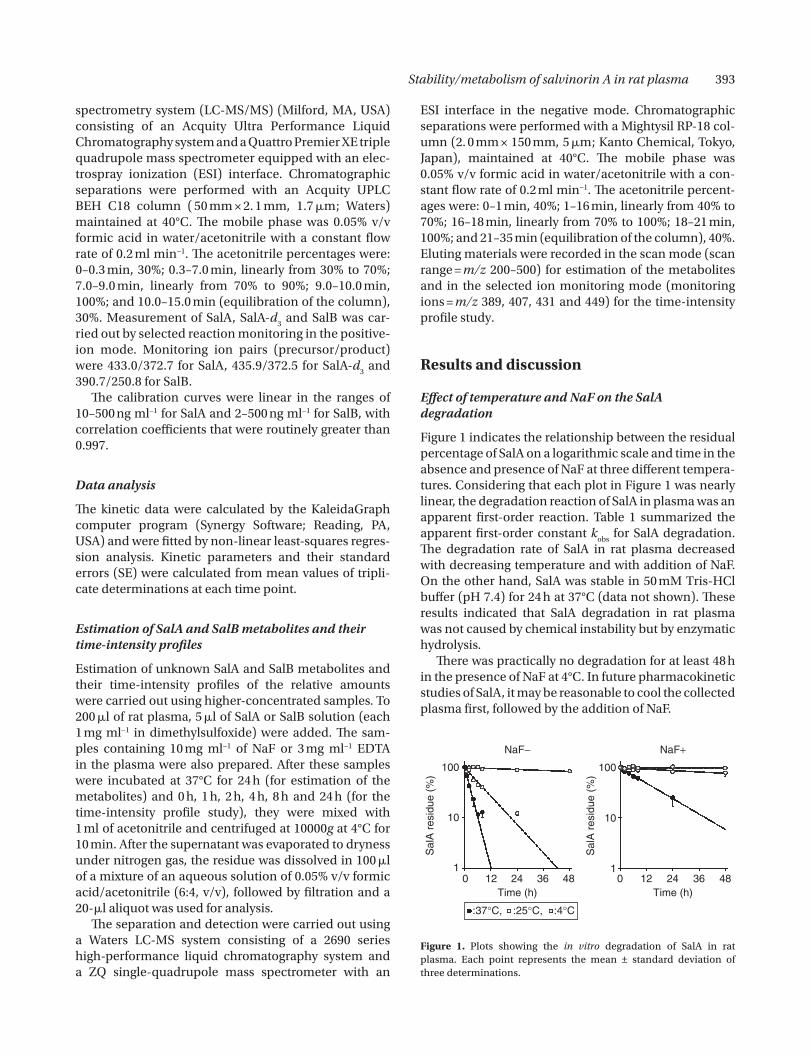
Figure 1 indicates the relationship between the residual percentage of SalA on a logarithmic scale and time in the absence and presence of NaF at three different tempera-tures. Considering that each plot in Figure 1 was nearly linear, the degradation reaction of SalA in plasma was an apparent first-order reaction. Table 1 summarized the apparent first-order constant k
obs for SalA degradation.
The degradation rate of SalA in rat plasma decreased with decreasing temperature and with addition of NaF. On the other hand, SalA was stable in 50 mM Tris-HCl buffer (pH 7.4) for 24 h at 37°C (data not shown). These results indicated that SalA degradation in rat plasma was not caused by chemical instability but by enzymatic hydrolysis.
There was practically no degradation for at least 48 h in the presence of NaF at 4°C. In future pharmacokinetic studies of SalA, it may be reasonable to cool the collected plasma first, followed by the addition of NaF.
1
10
100
0 12 24 36 48
NaF−
Time (h)
Sal
A r
esid
ue (
%)
Sal
A r
esid
ue (
%)
:37°C, :25°C, :4°C
1
10
100
0 12 24 36 48
NaF+
Time (h)
Figure 1. Plots showing the in vitro degradation of SalA in rat plasma. Each point represents the mean ± standard deviation of three determinations.

394 K. Tsujikawa et al.
Stability of SalB produced by SalA degradation
Table 1 indicates the residual SalA and SalB percentages of the initial SalA concentration after 24-h incubation in rat plasma. SalB increased with a decrease in SalA con-centration except for the NaF-present condition at 4°C. However, under the conditions where SalA was quickly degraded (for example, NaF-absence at 37°C), the sum of the residual percentages of SalA and SalB did not equal 100%. This result suggested that additional SalB degradation took place and/or the existence of other metabolic pathways of SalA.
Figure 2 indicates the time–concentration profiles of SalA and SalB at 37°C and 25°C in the absence of NaF. The profiles of SalB under these conditions showed not only an upward phase but also a downward phase. This result suggested that both SalA and SalB were degraded. On the assumption that these degradations were two consecutive reactions that followed first-order rate laws, the concentrations of SalB were expressed by the follow-ing equation:
C C k k k k t k t1 0 1 2 1 1 2= × − × − − −[ /( )] [exp( ) exp( )] (2)
where C0 represents the initial concentration of SalA;
C1 represents the concentrations of SalB at time t;
and k1 and k
2 represent the degradation constants of
SalA and SalB, respectively. The progress curves by the non-linear regression analysis gave reasonable fits to the above equations. The combinations of k
2/k
1
values at 37°C and 25°C were 2.7 × 10⁻²/4.3 × 10−1 h−1 and 7.3 × 10⁻³/2.0 × 10−1 h−1, respectively. The estimated
degradation constants of SalB (k2) were obviously
smaller than those of SalA (k1).
It was impossible to estimate the effects of NaF on the SalB degradation in this study because the downward phase in the SalB profiles was not shown in the presence of NaF. This may be attributed to slower hydrolysis of SalA under these conditions.
Effects of various esterase inhibitors on SalA degradation
The esterases responsible for the SalA degradation were characterized using the various esterase inhibitors. As demonstrated in Table 2, the hydrolytic activity in rat plasma was inhibited by BNPP and PMSF in a concen-tration-dependent manner. The inhibition of hydrolytic activity by BNPP (CES inhibitor) suggested that CES may be responsible for SalA degradation. The inhibi-tion by PMSF (serine esterase inhibitor) supported the involvement of CES, which is a serine esterase (Imai 2006). These results were consistent with the inhibition of the SalA degradation by adding NaF into rat plasma, because 10 mg ml−1 of NaF is a high enough concentra-tion to inhibit CES activity (Dean et al. 1991). On the
0
20
40
60
80
100
0 6 12 18 24
:SalA:SalB
Time (h)
Sal
A a
nd S
alB
res
idue
(%
) 37°C, NaF−
:SalA:SalB
0
20
40
60
80
100
Sal
A a
nd S
alB
res
idue
(%
)
0 12 24 36 48Time (h)
25°C, NaF−
Figure 2. Time profiles of SalA and SalB concentration in rat plasma at 37°C and 25°C in the absence of NaF. The SalA time profiles are same as those in Figure 1. The non-linear curve fittings for SalA and SalB are fitted to models of first-order and two consecutive with first-order rate (equation 2), respectively. Each point represents the mean ± standard deviation (SD) of three determinations.
Table 2. Effects of various esterase inhibitors on SalA degradation.
Inhibitors Concentration Uninhibited hydrolysis activity (%)
PMSF 100 M 10.5 ± 3.4
1 M 91.8 ± 13.5
BNPP 100 M 9.5 ± 2.0
1 M 26.4 ± 4.0
Ethopropazine 10 M 96.7 ± 25.1
BW284c51 10 M 113.8 ± 17.9
DTNB 1 mM 86.0 ± 18.9
Each value represents the mean ± standard deviation (SD) of three determinations.
Table 1. Apparent first-order constants (kobs
) for SalA degradation and residual SalA and SalB percentages after 24-h incubation in rat plasma.
Temperature (°C)
NaF (mg ml−1) k
obs (h−1)
Residue (%) after 24-h incubation
SalA SalB
37 0 3.8 ± 0.3 (× 10−1) < 2.0c 47.7 ± 2.4
10 5.9 ± 0.3 (× 10−2) 25.3 ± 8.1 38.1 ± 8.9
25 0 1.1 ± 0.2 (× 10−1) 12.2 ± 1.3 58.5 ± 8.9
10 < 6.0 × 10⁻³ a 82.8 ± 8.7 13.5 ± 1.8
4 0 < 6.0 × 10⁻³ a 88.1 ± 3.9 9.6 ± 1.1
10 −b 103.4 ± 8.1 2.1 ± 0.6
Each kobs
value represents the mean ± standard error (SE). Each residue (%) after 24-h incubation represents the mean ± standard deviation (SD) of three determinations. The initial SalA concentration was 50 ng in 120 l (100 l of rat plasma plus 20 l of the SalA solution) of the final incubation solution.aThe k
obs value of < 6.0 × 10⁻³ h−1 indicates that less than 25% of the
substrate was degraded within 48 h.bDegradation of SalA was not observed within 48 h.cThe residual percentage of < 2.0 means that the SalA concentration after 24 h was less than 10 ng ml−1 (the lowest concentration of the calibration curve).

Stability/metabolism of salvinorin A in rat plasma 395
other hand, ethopropazine (BChE inhibitor), BW284c51 (AChE inhibitor), and DTNB (ArE inhibitor) scarcely inhibited the hydrolytic activities of SalA. In the previous report, BChE, AChE, and ArE were sufficiently inhibited by 10 M of Ethopropazine, 10 M of BW284c51 and 1 mM of DTNB, respectively (Yamaori et al. 2006). Thus BChE and ArE scarcely contributed to the SalA hydroly-sis in rat plasma.
Distribution of blood esterase activity differs between animal species. In contrast to high CES activity in rat plasma, humans have CES activity not in plasma but in the red blood cell membrane (Minagawa et al. 1995; Li et al. 2005). If this study was repeated using human blood, it would also necessary to apply the red blood cell fraction.
Estimation of unknown SalA and SalB metabolites and their time-intensity profiles
Figure 3 illustrates a total ion current chromatogram and mass chromatograms obtained from the SalA-
spiked sample containing NaF. Three peaks (numbers 1−3) due to unknown metabolites were observed in the chromatograms. These reactions were not non- enzymatic but enzymatic, because these metabolites were not produced by the incubation in 50 mM Tris-HCl buffer (pH 7.4).
Peak 1, one of the major peaks, was observed in both the SalA-spiked sample and the SalB-spiked one. The mass spectrum of the peak 1 showed major ions at m/z 407, 443, and 445 (Figure 4a). These may correspond to the deprotonated molecule [M − H]− (m/z 407) and the chlorinated adduct of the molecular ion [M + Cl]− (m/z 443 and 445). The most probable structure for this metabolite M1 is the lactone-ring open form of SalB, which explains its earlier elution than SalB on the C
18
reversed-phase column.
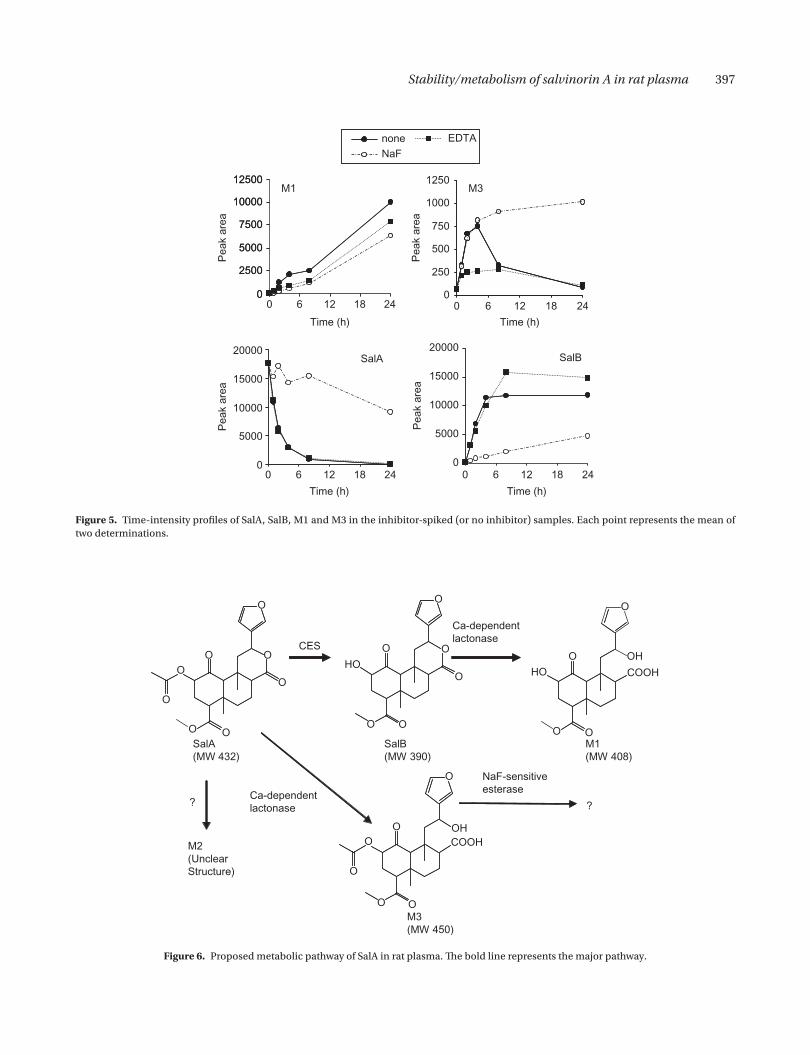
The production of M1 from SalB was inhibited by addition of EDTA. In addition, as shown in Figure 5, the EDTA (chelating agent for calcium)-present SalA-spiked sample indicated a lower M1 intensity course and a higher SalB intensity course than the no inhibitor sample despite no difference of the SalA profiles between two samples. Considering that rat has calcium- dependent lactonase in serum (Roth et al. 1967), these results sug-gested that calcium-dependent lactonase such as ArE was involved in hydrolysis of SalB to M1 (Teiber et al. 2003). On the other hand, NaF hardly affected the pro-duction of this metabolite from SalB. This suggested that NaF-sensitive esterase such as CES or BChE was not involved in this hydrolysis.
Peak 2 was a minor peak undetected on the total ion current chromatogram. The peak 2 was observed only from the NaF-present SalA-spiked sample under the condition of the metabolite estimation study. The mass spectrum of this peak showed major ions at m/z 389, 425, and 427 (Figure 4b). These may correspond to the deprotonated molecule [M − H]− (m/z 389) and the chlorinated adduct of the molecular ion [M + Cl]− (m/z 425 and 427). This spectrum pattern was similar to that of SalB (Figure 4c). This metabolite M2 was supposed to be an isomer of SalB. However, the information was not enough to propose the structure of this metabolite at this time.
This metabolite was detected only in the NaF-present sample incubated for more than 8 h even in the time-course experiment. Therefore, time course of this metabolite is omitted in Figure 5.
Peak 3 was a minor peak undetected on the total ion current chromatogram. This peak was observed only from the NaF-present SalA-spiked sample under the condition of the metabolite estimation study. The mass spectrum of the peak 3 showed a major ion at m/z 449 (Figure 4d), which was 18 Da higher than [M − H]− of
100
%
55
100
%
1
100
%
0
100
%
0
100
%
0
100
%
00 5 10
Retention time (min)
Rel
ativ
e In
tens
ity (
%)
15
#1
#2
#3
#1
SalB
SalB
SalB
SalA
SalA
1: Scan ES-TIC
3.22e7
1: Scan ES-407
2.37e6
1: Scan ES-389
8.41e5
1: Scan ES-425
4.80e6
1: Scan ES-449
5.04e5
1: Scan ES-431
1.88e6
Figure 3. Total ion current chromatogram and mass chromatograms obtained from the NaF-present SalA-spiked sample incubated for 24 h at 37°C.

396 K. Tsujikawa et al.
SalA (Figure 4e). The most probable structure for this metabolite M3 is the lactone-ring open form of SalA.
In the time-course experiment, this metabolite was detected in any samples. However, the time courses of M3 intensities were different between the samples. The intensity of the no inhibitor sample showed an upward phase until 4 h, followed by a downward phase. That of the NaF-present sample indicated a constant increase until 24 h. The increase of the intensity of the EDTA-present sample was inhibited in comparison with the two former samples. These results suggested that the
hydrolysis of SalA to M3 and the degradation of M3 were involved in calcium-sensitive lactonase and NaF-sensitive esterase, respectively. The degradate of M3 was not confirmed in this study.
The metabolic pathway of SalA in rat plasma is pro-posed in Figure 6. The pathway from SalA to SalB was advantageous in comparison with that to metabolites M2 and M3. However, considering deficient of CES activity in human serum and similar activities of serum lactonase between rat and human (Roth & Giarman 1966), the met-abolic pathway for M3 may be major in human serum.
100
%
0
100
%
0
100
%
0
100
%
0
100
%
0200 300 400 500
m/z
a, #1
b, #2
d, #3
c, SalB
e, SalA
O
O
O O
O
O O
O
O
O
O
O
O
O
O
O
OO
O
O O
O
O
HO
HO
OH
OH
COOH
COOH
[M-H]-
407
[M-H]-
389
[M-H]-
389
389
[M-H]-
44 9
[M-H]-
431
[M-CI]-
[M-CI]-
[M-CI]-
[M-CI]-
443445
425
425
427
427
467
477
469
O
Figure 4. Negative-ion ESI mass spectra of (a) peak 1, (b) peak 2, (c) SalB, (d) peak 3, and (e) SalA obtained from Figure 3.
Stability/metabolism of salvinorin A in rat plasma 397
0
2500
5000
7500
10000
12500
0 60
250
500
750
1000
1250
0 6 12 18 24
M3M1
Pea
k ar
ea
0
2500
5000
7500
10000
12500
12 18 24
Time (h)
Pea
k ar
ea
Time (h)
noneNaF
EDTA
10000
15000
20000
0 6 12 18 24
Time (h)
0
5000
10000
15000
20000
6 12 18 24
Pea
k ar
ea
Time (h)
0
5000
Pea
k ar
ea
SalA
0
SalB
Figure 5. Time-intensity profiles of SalA, SalB, M1 and M3 in the inhibitor-spiked (or no inhibitor) samples. Each point represents the mean of two determinations.
OO
O
O
O
O
O
O
O
O
O
O
HO
O
COOH
OH
O
O
O
HO
O
COOHOHO
O
O
O
O
M2(Unclear Structure)
M3(MW 450)
M1(MW 408)
SalB(MW 390)
SalA(MW 432)
CES
Ca-dependentlactonase
NaF-sensitiveesteraseCa-dependent
lactonase? ?
O
O
Figure 6. Proposed metabolic pathway of SalA in rat plasma. The bold line represents the major pathway.
398 K. Tsujikawa et al.
Conclusion
Degradation of SalA to SalB in rat plasma was catalysed by CES. SalB was additionally degraded to a presumptive metabolite, its lactone-ring open form. These findings will be very useful for future pharmacokinetic studies.
Acknowledgements
Declaration of interest: The authors report no conflicts of interest.
References
Butelman ER, Harris TJ, Kreek MJ. (2004). The plant-derived hallu-cinogen, salvinorin A, produces -opioid agonist-like discrimi-native effects in rhesus monkeys. Psychopharmacology (Berlin) 172:220–4.
Chavkin C, Sud S, Jin W, Stewart J, Zjawiony JK, Siebert DJ, Toth BA, Hufeisen SJ, Roth BL. (2004). Salvinorin A, an active component of the hallucinogenic sage Salvia divinorum is a highly effica-cious -opioid receptor agonist: structural and functional con-siderations. J Pharmacol Exp Ther 308:1197–203.
Dean RA, Christian CD, Sample RHB, Bosron WF. (1991). Human liver cocaine esterases: ethanol-mediated formation of ethylco-caine. FASEB J 5:2735–9.
Imai T. (2006). Human carboxylesterase isozymes: catalytic prop-erties and rational drug design. Drug Metab Pharmacokinet 21:173–85.
Li B, Sedlacek M, Manoharan I, Boopathy R, Duysen EG, Masson P, Lockridge O. (2005). Butyrylcholinesterase, paraoxonase, and albumin esterase, but not carboxylesterase, are present in human plasma. Biochem Pharmacol 70:1673–84.
Medana C, Massolino C, Pazzi M, Baiocchi C. (2006). Determination of salvinorins and divinatorins in Salvia divinorum leaves by liquid chromatography/multistage mass spectrometry. Rapid Comm Mass Spectrom 20:131–6.
Minagawa T, Kohno Y, Suwa T, Tsuji A. (1995). Species differences in hydrolysis of isocarbacyclin methyl ester (TEI-9090) by blood esterases. Biochem Pharmacol 49:1361–5.
Roth BL, Baner K, Westkaemper R, Siebert D, Rice KC, Steinberg S, Ernsberger P, Rothman RB. (2002). Salvinorin A: a potent natu-rally occuring nonnitrogenous opioid selective agonist. Proc Natl Acad Sci 99:11934–9.
Roth RH, Giarman NJ. (1966). -Butyrolactone and -hydroxybutyric acid – I. Distribution and metabolism. Biochem Pharmacol 15:1333–48.
Roth RH, Levy R, Giarman NJ. (1967). Dependence of rat serum lacto-nase upon calcium. Biochem Pharmacol 16:596–8.
Schmidt MS, Prisinzano TE, Tidgewell K, Harding W, Butelman ER, Kreek MJ, Murry DJ. (2005). Determination of salvinorin A in body fluids by high performance liquid chromatography- atmospheric pressure chemical ionization. J Chromatograph B 818:221–5.
Siebert DJ. (1994). Salvia divinorum and salvinorin A: new pharma-cologic findings. J Ethnopharmacol 43:53–6.
Teiber JF, Draganov DI, La Du BN. (2003). Lactonase and lactoniz-ing activities of human serum paraoxonase (PON1) and rabbit serum PON3. Biochem Pharmacol 66:887–96.
Tidgewell K, Harding WW, Schmidt M, Holden KG, Murry DJ, Prisinzano TE. (2004). A facile method for the preparation of deuterium labeled salvinorin A: synthesis of [2,2,2-2H3]-salvinorin A. Bioorgan Med Chem Lett 14:5099–102.
Tougou K, Nakamura A, Watanabe S, Okuyama Y, Morino A. (1998). Paraoxonase has a major role in the hydrolysis of prulifloxacin (NM441), a prodrug of a new antibacterial agent. Drug Metab Disposit 26:355–9.
Tsuji T, Kaneda N, Kado K, Yokokura T, Yoshimoto T, Tsuru D. (1991). CPT-11 converting enzyme from rat serum: purification and some properties. J Pharmacobio-Dynam 14:341–9.
Valdés III LJ. (1994). Salvia divinorum and the unique diterpene hallucinogen, salvinorin (divinorin) A. J Psychoactive Drug 26:277–83.
Valdés III LJ, Díaz JL, Paul AG. (1983). Ethnopharmacology of Ska María Pastora (Salvia divinorum, Epling and Játiva-M.). J Ethnopharmacol 7:287–312.
Yamaori S, Fujiyama N, Kushihara M, Funahashi T, Kimura T, Yamamoto I, Sone T, Isobe M, Ohshima T, Matsumura K, Oda M, Watanabe K. (2006). Involvement of human blood arylesterases and liver microsomal carboxylesterases in nafamostat hydroly-sis. Drug Metab Pharmacokinet 21:147–55.