In Vitro Dissolution Studies of Immediate-Release and Extended ...

Research ArticleIn Vitro Dissolution Profile of Dapagliflozin: Development,Method Validation, and Analysis of Commercial Tablets
Rafaela Zielinski Cavalheiro de Meira,1 Aline Biggi Maciel,1 Fabio Seigi Murakami,2
Paulo Renato de Oliveira,1 and Larissa Sakis Bernardi1
1Post-Graduation Program in Pharmaceutical Sciences, Department of Pharmacy, Universidade Estadual do Centro-Oeste (UNICEN-TRO), 85040-080 Guarapuava, PR, Brazil2Department of Pharmacy, Federal University of Parana, Curitiba, PR, Brazil
Correspondence should be addressed to Larissa Sakis Bernardi; [email protected]
Received 12 April 2017; Accepted 2 July 2017; Published 31 July 2017
Academic Editor: Troy D. Wood
Copyright © 2017 Rafaela Zielinski Cavalheiro de Meira et al. This is an open access article distributed under the CreativeCommons Attribution License, which permits unrestricted use, distribution, and reproduction in any medium, provided theoriginal work is properly cited.
Dapagliflozin was the first of its class (inhibitors of sodium-glucose cotransporter) to be approved in Europe, USA, and Brazil.As the drug was recently approved, there is the need for research on analytical methods, including dissolution studies for thequality evaluation and assurance of tablets. The dissolution methodology was developed with apparatus II (paddle) in 900mL ofmedium (simulated gastric fluid, pH 1.2), temperature set at 37 ± 0.5∘C, and stirring speed of 50 rpm. For the quantification, aspectrophotometric (𝜆 = 224 nm) method was developed and validated. In validation studies, the method proved to be specificand linear in the range from 0.5 to 15 𝜇g⋅mL−1 (𝑟2 = 0.998). The precision showed results with RSD values lower than 2%. Therecovery of 80.72, 98.47, and 119.41% proved the accuracy of the method. Through a systematic approach by applying Factorial 23,the robustness of the method was confirmed (𝑝 > 0.05).The studies of commercial tablets containing 5 or 10mg demonstrated thatthey could be considered similar through 𝑓1, 𝑓2, and dissolution efficiency analyses. Also, the developed method can be used forthe quality evaluation of dapagliflozin tablets and can be considered as a scientific basis for future official pharmacopoeial methods.
1. Introduction
The dapagliflozin (DAPA) is a highly potent, selective,and reversible inhibitor of sodium-glucose cotransporter 2(SGLT2). It acts by reducing the reabsorption of glucoseby the kidney, leading to excretion of excess glucose inthe urine, thereby improving glycemic control in patientswith type 2 diabetes mellitus [1]. DAPA (Figure 1) ischemically described as (1S)-1,5-anhydro-1-C-[4-chloro-3-[(4-ethoxyphenyl) methyl]phenyl]-D-glucito. It is a whitecrystalline powder, soluble in ethanol, methanol, dimethyl-sulfoxide (DMSO), and dimethylformamide [2]. Accordingto the European Medicines Agency (EMA), DAPA is classi-fied asClass III in theBiopharmaceuticsClassification System(BCS), being highly soluble and poorly permeable [3].
This drug was the first of its class to be approved by theEuropean Union [4] and the commercial formula, Forxiga�,was approved by the US Food and Drug Administration
(FDA) in January 2014. In Brazil, the approval of the HealthSurveillance Agency (ANVISA) occurred in July 2013 [5, 6].
The dissolution study is extremely important in assessingthe performance of a solid pharmaceutical formulation andconsidering that the literature does not report any studyregarding the dissolution profile of DAPA and that there is nopharmacopoeialmethod approved for dissolution evaluation,the aim of this work was to develop and validate a dissolutionmethodology to ensure the quality of the tablets in themarket and serve as a guidance for a future pharmacopoeialmonography. The quantification was carried out by UV-Vis spectrophotometry due to its high throughput capacityand low cost that were considered as great advantages foremployment in routine quality control laboratories.
2. Material and Methods
The DAPA propanediol monohydrate raw material wasobtained from Lianchuang Biological Pharmaceutical Co.
HindawiInternational Journal of Analytical ChemistryVolume 2017, Article ID 2951529, 6 pageshttps://doi.org/10.1155/2017/2951529

2 International Journal of Analytical Chemistry
ClO
OHHO
OH
O
HO
Figure 1: Chemical structure of dapagliflozin (DAPA).
(Anhui, China, Batch: 20150207). Five lots of Forxiga (As-traZeneca, Cotia, SP, Brazil) tablets, two lots containing 5mgof DAPA (identified in this study as lots A and B) and threelots containing 10mg of DAPA (C, D, and E), were bought incommercial pharmacies.
2.1. Dissolution Studies. For the preparation of the referencestock solution of DAPA, 10mg was weighted out and dilutedto volume with methanol into a 10mL volumetric flask. Thesolution was stored in refrigerator (4∘C) and protected fromlight.
The dissolution method was developed in a dissolutionequipment (708 DS, Agilent) with apparatus II (paddle) in900mL of medium and fixed temperature of 37 ± 0.5∘C.The tested media were as follows: simulated gastric fluidwithout enzymes pH 1.2, simulated intestinal fluid withoutenzymes pH 6.8, acetate buffer pH 4.5, ultrapure water(Milli-Q�, millipore), and HCl 0.1M. All dissolution mediawere previously degassed by vacuum filtration. Agitationspeeds of 50, 60, and 75 rpm were also evaluated [7]. Forthe quantification, a UV-Vis spectrophotometer was used at224 nm (Carry 100, Agilent). The study of the influence offilters was carried out by evaluating quantitative paper 28 𝜇m(J. Prolab), nylon syringe filter 0.22𝜇m (Sterlitech), and theFull Flow� filter 10 𝜇m (Agilent).
2.2. Validation of Analytical Methodology. The analytical dis-solution methodology was validated by analyzing the param-eters required by ICH Q2 (R1) and by USP 38, NF 33,Chapter 1092 (the dissolution procedure: development andvalidation), through specificity, linearity, limit of detection(LOD), limit of quantitation (LOQ), accuracy, precision, androbustness [8, 9]. In order to confirm the applicability of themethodology, the study of the dissolution profile of differentcommercial batches of DAPA was carried out.
2.2.1. Specificity. The specificity was carried out in order todemonstrate that there was no interference from placeboconstituents in the analysis [9]. The DAPA standard solutiondissolved in methanol was added to a vessel containing thedissolution medium, to obtain a theoretical final concentra-tion of 5.556𝜇g⋅mL−1. The powdered excipients were alsoadded in vessels containing the medium. The experimentswere carried out in triplicate and the rotation speed was setto 150 rpm. Aliquots of these samples were taken after 30
minutes of dissolution and the absorbance analyzed by UV-Vis spectrophotometry.
2.2.2. Linearity. Linearity was prepared from three standardsolutions. Initially, an amount of 10mg of DAPA was exactlyweighted out and diluted in 10mL volumetric flask withmethanol, to obtain a final concentration of 1mg⋅mL−1. Thissolution was then diluted in six levels (0.5, 1, 2, 5, 10, and15 𝜇g⋅mL−1) with dissolution media covering the lowest andthe highest concentration that were expected in the release ofthe drug during dissolution. This parameter was calculatedusing linear regression [9].
2.2.3. Limits of Detection and Quantitation. The limits ofdetection and quantification were calculated by the curveslope and standard deviation obtained from the average of theintercepts of the curves made in triplicate in the evaluation oflinearity [8].The values obtainedwere confirmed experimen-tally.
2.2.4. Accuracy. The accuracy was evaluated by the additionof the standard solution and excipients to the same ves-sel, to obtain the final concentrations of 4.445, 5.556, and6.667 𝜇g⋅mL−1 corresponding to 80, 100, and 120% of theconcentration defined for the validation, respectively. Theabsorbance values obtained that should present recoverywere95 to 105% relative to a standard solution at the concentrationdefined for validation [9].
2.2.5. Precision. Theprecision was determined by calculatingthe standard deviation from the dissolution of six tablets.The two dosages of DAPA tablets (5 and 10mg) were usedfor precision evaluation. The analyses were performed ondifferent days (interday) and by different analysts (between-analysts). The acceptance criterion was that the RSD valuesshould be lower than 2% [9].
2.2.6. Robustness. The robustness was studied by analyzingsmall changes in the dissolution conditions, such as pH(1.20 ± 0.2), salt (NaCl) concentration (2.00 ± 0.10 g), andvolume of the dissolutionmedium (900±50mL).The rotationspeed was kept at 50 rpm and sampling time was 30min. Byfollowing the recommendations of the new FDA Guidancefor Analytical Procedures and Methods for Validation ofDrugs and Biological Products, we applied a systematicapproach using a Factorial 23model (Statistica�V.8 software)for the selection of design points [10]. The statistical analyseswere performed using ANOVA and, to be valid, the changesshould not be significant (𝑝 > 0.05).2.3. Dissolution Profile Study. The dissolution profile studywas performed with two batches of 5mg DAPA (identifiedas A and B) and three lots of 10mg DAPA (identified asC, D, and E). For each batch, twelve tablets were used. Thedissolution sampling times were 0.5, 1, 1.5, 2, 3, 4, 5, 10, and20min. For each time point, 10mL of sample was withdrawnand immediately replaced with fresh medium. The sampleswere immediately filtered through a quantitative paper filterand quantitated by UV-Vis spectroscopy.
International Journal of Analytical Chemistry 3
The dissolution profile was also analyzed by applyingfactors𝑓1 (difference factor (1)) and𝑓2 (similarity factor (2)),setting randomly one of the batches of each dosage (5mg: A;10mg: D) as the reference [11]. These factors, proposed byMoore and Flanner (1996) [12], are specific models for thecomparison between the profiles.
𝑓1 = { ∑𝑛𝑡=1 |𝑅𝑡 − 𝑇𝑡|∑𝑛𝑡=1𝑅𝑡 } × 100, (1)
𝑓2 = 50 log{[1 + 1𝑛𝑛∑𝑡−1
(𝑅𝑡 − 𝑇𝑡)2]−0.5 × 100} . (2)
Thedissolution profiles can be considered similar if the valuesof 𝑓1 are between 0 and 15, and if 𝑓2 found are in the rangeof 50 to 100 [12, 13].
The dissolution efficiency (DE) was also applied in thecomparative analysis of the profiles. This model statisticallyevaluates the equivalence of the dissolution tests across thearea under the curve obtained from the percent dissolution ofthe drug over the time [14]. The results were analyzed usingStudent’s 𝑡-test for lots of DAPA 5mg and ANOVA for lots ofDAPA 10mg, with significance level of 0.05%.
3. Results and Discussion
3.1. Dissolution Studies. The development of the dissolutionmethod was carried out with the media previously degassedby vacuum filtration (0.44𝜇m cellulose membrane). If theair dissolved in the dissolution medium is not properlyeliminated, air bubbles can act as a barrier to the dissolutionprocess (if present on the tablet surface) and can adverselyaffect the reliability of the results. Furthermore, bubbles cancause particles to cling to the apparatus and vessel walls.Bubbles on the dosage unit may increase buoyancy, leadingto an increase in the dissolution rate, or may decrease theavailable surface area, leading to a decrease in the dissolutionrate.
The apparatus used in the tests was the paddle (apparatusII). Its use is recommendedwhen the tests are performedwithimmediate release tablets [9]. The filter test did not show anysignificant interference, since the assay of the samples filteredin quantitative paper filter (28𝜇m), Full Flow filter (10 𝜇m),and nylon syringe filter (0.22 𝜇m) was 100.38, 99.23, and98.85%, respectively. Since all variations were within ±2%,the quantitative paper filter paper was chosen for economicalreason.
Among the analyzed media, the simulated gastric fluidwas selected for the validation process. In less than 10minutesin this medium, the drug was practically totally dissolved,presenting increasing dissolution percentage from 5 to 15minutes and thus remaining constant until the last samplingtime, as shown in Figure 2. Additionally, these media aremore predictive of the in vivo behavior of the drug afteroral administration. TheMilli-Q water also showed excellentresults, but it is not among the media indicated by theUnited States Pharmacopeia [9] since the quality of the watermay vary from laboratory to laboratory, thus impairing thereproducibility of results.
0 10 20 30 40 50 600
20
40
60
80
100
120
Gastric fluidAcetate buffer Intestinal fluid
Milli-Q water
Time (Min)
Diss
olut
ion
(%)
HCl 0.1M
Figure 2:Dissolution profile ofDAPA in different dissolutionmediaat 50 rpm.
The results obtained during the development of the ana-lytical methodology for dissolution of DAPA tablets showedthat this drug presented a high dissolution percentage (>85%of the drug dissolved in 15 minutes of test, at 50 rpm insimulated gastric fluid). These results corroborate the BCSdata found in the literature that classifies DAPA as a Class IIIdrug [3].
The lower rotation speed (50 rpm) was chosen for pre-senting more discriminative results at the beginning of thedissolution, assisting in the observation of the profile. Therecommendation from the USP using apparatus II, for thedissolution of immediate release tablets, is that the agitationspeed should be between 50 and 75 rpm [9].Theother stirringvelocities also showed high dissolution percentage resultswith the simulated gastric fluid medium, which was verifiedby statistical analysis of the data (𝑓1 and 𝑓2), comparingthe lowest rotation with the other velocities studied. Thedifference factor (𝑓1) was 9.80 for 60 rpm and of 9.09 for75 rpm, and the similarity factor (𝑓2) was of 52.75 for 60 rpmand 56.94 for 75 rpm, always compared to 50 rpm. However,with a slower rotation speed, there is also the advantage ofmore easily detecting any deviation of quality in industrialproduction.
3.2. Validation of Analytical Methodology. In validation, themethod proved to be specific and the possible interferencefrom excipients was of 1.81%, not exceeding the limit of 2%,at the selected wavelength, compared to a standard solutionof DAPA.
The linearity was analyzed in the range from 0.5 to15 𝜇g⋅mL−1 (𝑦 = 0.052𝑥 − 0.008, 𝑟2 = 0.998). The analysis ofvariance (ANOVA) was performed, demonstrating a signifi-cant linear regression (𝑝 < 0.05) and no significant deviationfrom linearity (𝑝 > 0.05), validating the assay. The limitsof detection and quantification calculated and confirmedexperimentally were 0.05 and 0.15 𝜇g⋅mL−1, respectively.
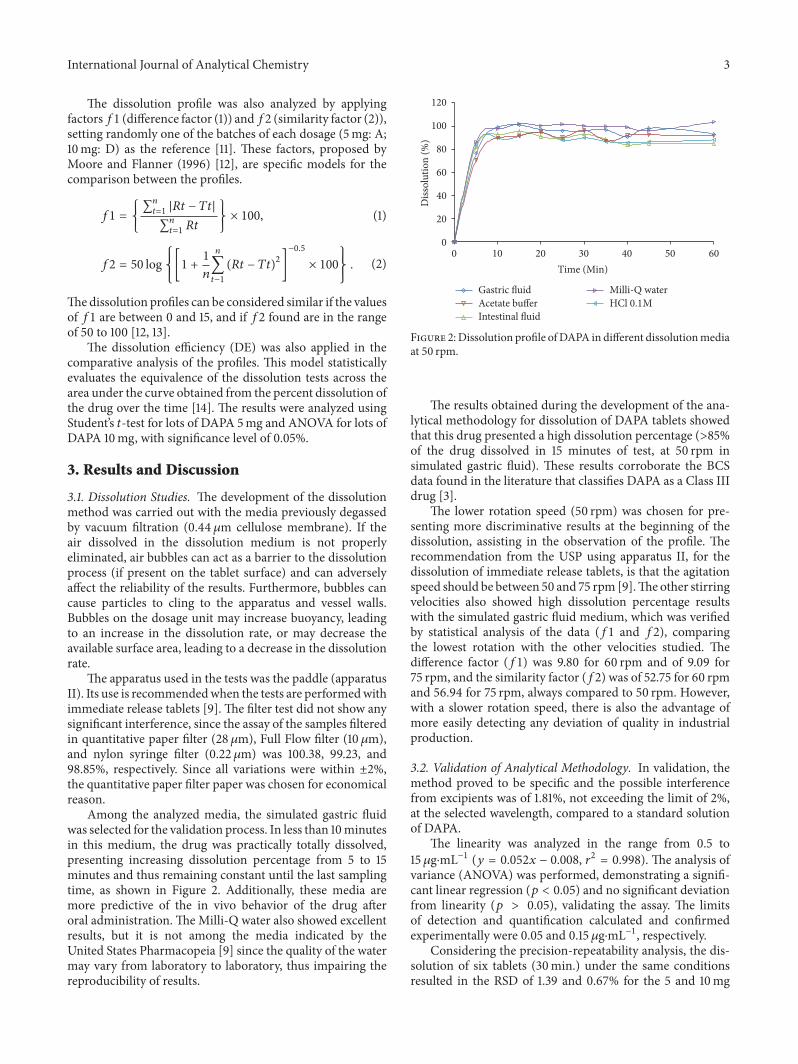
Considering the precision-repeatability analysis, the dis-solution of six tablets (30min.) under the same conditionsresulted in the RSD of 1.39 and 0.67% for the 5 and 10mg
4 International Journal of Analytical Chemistry
Table 1: Repeatability of the analytical method for the in vitrodissolution of dapagliflozin.
Repeatability (𝑛 = 6)Tablets 5mg Tablets 10mg
Absorbance Assay (%) Absorbance Assay (%)0.266 101.92 0.439 100.460.264 101.15 0.441 100.920.273 104.60 0.442 101.140.264 101.15 0.441 100.920.267 102.30 0.447 102.290.271 103.83 0.445 101.83
RSD (%) 1.39 0.67
Table 2: Accuracy of the analytical method for the in vitrodissolution of dapagliflozin.
Analysis Absorbance(80%)
Absorbance(100%)
Absorbance(120%)
1∘ 0.212 0.259 0.3142∘ 0.209 0.256 0.3083∘ 0.211 0.256 0.313RSD (%) 0.73 0.67 1.03Recovery (%) 80.72 98.47 119.41
tablets, respectively (Table 1).The interday precision obtainedfor the 5mg dosage was 0.11% (RSD) and for the 10mgdosagewas 0.41% (RSD).The between-analysts (two analysts)analysis resulted in RSD of 0.15% for the 5mg tablets and1.09% for 10mg DAPA tablets. Since all RSD values werelower than 5%, the method was considered precise for bothdosages.
The accuracy showed a recovery of 4.485, 5.470, and6.634 𝜇g⋅mL−1 of the DAPA standard solution added in thevessel containing all excipients, corresponding to 80.72, 98.47,and 119.41%, respectively, with RSDof 0.73, 0.67, and 1.03% foreach level.The results together with the absorbance values areshown in Table 2.
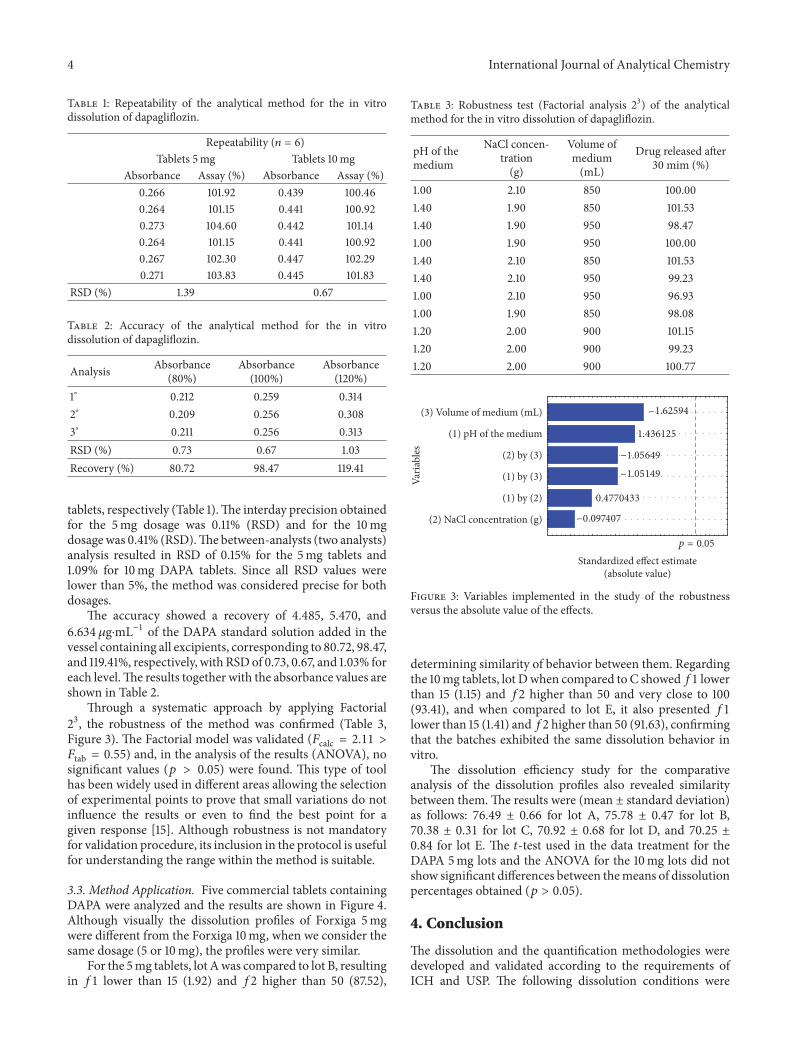
Through a systematic approach by applying Factorial23, the robustness of the method was confirmed (Table 3,Figure 3). The Factorial model was validated (𝐹calc = 2.11 >𝐹tab = 0.55) and, in the analysis of the results (ANOVA), nosignificant values (𝑝 > 0.05) were found. This type of toolhas been widely used in different areas allowing the selectionof experimental points to prove that small variations do notinfluence the results or even to find the best point for agiven response [15]. Although robustness is not mandatoryfor validation procedure, its inclusion in the protocol is usefulfor understanding the range within the method is suitable.
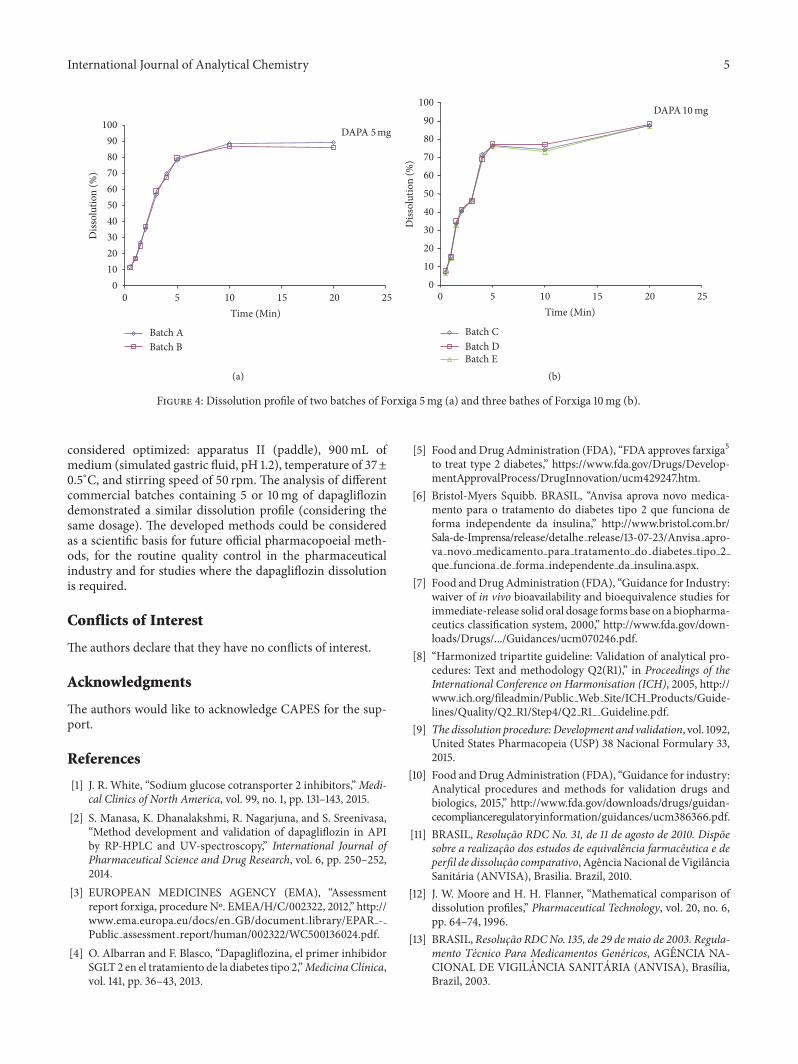
3.3. Method Application. Five commercial tablets containingDAPA were analyzed and the results are shown in Figure 4.Although visually the dissolution profiles of Forxiga 5mgwere different from the Forxiga 10mg, when we consider thesame dosage (5 or 10mg), the profiles were very similar.
For the 5mg tablets, lot Awas compared to lot B, resultingin 𝑓1 lower than 15 (1.92) and 𝑓2 higher than 50 (87.52),
Table 3: Robustness test (Factorial analysis 23) of the analyticalmethod for the in vitro dissolution of dapagliflozin.
pH of themedium
NaCl concen-tration(g)
Volume ofmedium(mL)
Drug released after30 mim (%)
1.00 2.10 850 100.001.40 1.90 850 101.531.40 1.90 950 98.471.00 1.90 950 100.001.40 2.10 850 101.531.40 2.10 950 99.231.00 2.10 950 96.931.00 1.90 850 98.081.20 2.00 900 101.151.20 2.00 900 99.231.20 2.00 900 100.77
Standardized effect estimate(absolute value)
(2) NaCl concentration (g)
(1) by (2)
(1) by (3)
(2) by (3)
(1) pH of the medium
(3) Volume of medium (mL)Va
riabl
es−1.62594
1.436125
−1.05649
−1.05149
0.4770433
−0.097407
p = 0.05
Figure 3: Variables implemented in the study of the robustnessversus the absolute value of the effects.
determining similarity of behavior between them. Regardingthe 10mg tablets, lot Dwhen compared to C showed𝑓1 lowerthan 15 (1.15) and 𝑓2 higher than 50 and very close to 100(93.41), and when compared to lot E, it also presented 𝑓1lower than 15 (1.41) and𝑓2 higher than 50 (91.63), confirmingthat the batches exhibited the same dissolution behavior invitro.
The dissolution efficiency study for the comparativeanalysis of the dissolution profiles also revealed similaritybetween them.The results were (mean ± standard deviation)as follows: 76.49 ± 0.66 for lot A, 75.78 ± 0.47 for lot B,70.38 ± 0.31 for lot C, 70.92 ± 0.68 for lot D, and 70.25 ±0.84 for lot E. The 𝑡-test used in the data treatment for theDAPA 5mg lots and the ANOVA for the 10mg lots did notshow significant differences between themeans of dissolutionpercentages obtained (𝑝 > 0.05).4. Conclusion
The dissolution and the quantification methodologies weredeveloped and validated according to the requirements ofICH and USP. The following dissolution conditions were
International Journal of Analytical Chemistry 5
0 5 10 15 20 250
102030405060708090
100
Batch A Batch B
Time (Min)
Diss
olut
ion
(%)
DAPA 5 mg
(a)
0 5 10 15 20 250
10
20
30
40
50
60
70
80
90
100
Time (Min)
Diss
olut
ion
(%)
Batch CBatch D Batch E
DAPA 10 mg
(b)
Figure 4: Dissolution profile of two batches of Forxiga 5mg (a) and three bathes of Forxiga 10mg (b).
considered optimized: apparatus II (paddle), 900mL ofmedium (simulated gastric fluid, pH 1.2), temperature of 37±0.5∘C, and stirring speed of 50 rpm. The analysis of differentcommercial batches containing 5 or 10mg of dapagliflozindemonstrated a similar dissolution profile (considering thesame dosage). The developed methods could be consideredas a scientific basis for future official pharmacopoeial meth-ods, for the routine quality control in the pharmaceuticalindustry and for studies where the dapagliflozin dissolutionis required.
Conflicts of Interest
The authors declare that they have no conflicts of interest.
Acknowledgments
The authors would like to acknowledge CAPES for the sup-port.
References
[1] J. R. White, “Sodium glucose cotransporter 2 inhibitors,”Medi-cal Clinics of North America, vol. 99, no. 1, pp. 131–143, 2015.
[2] S. Manasa, K. Dhanalakshmi, R. Nagarjuna, and S. Sreenivasa,“Method development and validation of dapagliflozin in APIby RP-HPLC and UV-spectroscopy,” International Journal ofPharmaceutical Science and Drug Research, vol. 6, pp. 250–252,2014.
[3] EUROPEAN MEDICINES AGENCY (EMA), “Assessmentreport forxiga, procedure Nº. EMEA/H/C/002322, 2012,” http://www.ema.europa.eu/docs/en GB/document library/EPAR -Public assessment report/human/002322/WC500136024.pdf.
[4] O. Albarran and F. Blasco, “Dapagliflozina, el primer inhibidorSGLT 2 en el tratamiento de la diabetes tipo 2,”MedicinaClınica,vol. 141, pp. 36–43, 2013.
[5] Food andDrug Administration (FDA), “FDA approves farxiga5to treat type 2 diabetes,” https://www.fda.gov/Drugs/Develop-mentApprovalProcess/DrugInnovation/ucm429247.htm.
[6] Bristol-Myers Squibb. BRASIL, “Anvisa aprova novo medica-mento para o tratamento do diabetes tipo 2 que funciona deforma independente da insulina,” http://www.bristol.com.br/Sala-de-Imprensa/release/detalhe release/13-07-23/Anvisa apro-va novo medicamento para tratamento do diabetes tipo 2que funciona de forma independente da insulina.aspx.
[7] Food andDrugAdministration (FDA), “Guidance for Industry:waiver of in vivo bioavailability and bioequivalence studies forimmediate-release solid oral dosage forms base on a biopharma-ceutics classification system, 2000,” http://www.fda.gov/down-loads/Drugs/.../Guidances/ucm070246.pdf.
[8] “Harmonized tripartite guideline: Validation of analytical pro-cedures: Text and methodology Q2(R1),” in Proceedings of theInternational Conference on Harmonisation (ICH), 2005, http://www.ich.org/fileadmin/Public Web Site/ICH Products/Guide-lines/Quality/Q2 R1/Step4/Q2 R1 Guideline.pdf.
[9] The dissolution procedure:Development and validation, vol. 1092,United States Pharmacopeia (USP) 38 Nacional Formulary 33,2015.
[10] Food andDrug Administration (FDA), “Guidance for industry:Analytical procedures and methods for validation drugs andbiologics, 2015,” http://www.fda.gov/downloads/drugs/guidan-cecomplianceregulatoryinformation/guidances/ucm386366.pdf.
[11] BRASIL, Resolucao RDC No. 31, de 11 de agosto de 2010. Dispoesobre a realizacao dos estudos de equivalencia farmaceutica e deperfil de dissolucao comparativo, AgenciaNacional deVigilanciaSanitaria (ANVISA), Brasilia. Brazil, 2010.
[12] J. W. Moore and H. H. Flanner, “Mathematical comparison ofdissolution profiles,” Pharmaceutical Technology, vol. 20, no. 6,pp. 64–74, 1996.
[13] BRASIL, Resolucao RDCNo. 135, de 29 de maio de 2003. Regula-mento Tecnico Para Medicamentos Genericos, AGENCIA NA-CIONAL DE VIGILANCIA SANITARIA (ANVISA), Brasılia,Brazil, 2003.

6 International Journal of Analytical Chemistry
[14] K. A. Khan, “The concept of dissolution efficiency,” Journal ofPharmacy and Pharmacology, vol. 27, no. 1, pp. 48-49, 1975.
[15] E. Karageorgou and V. Samanidou, “Youden test applicationin robustness assays during method validation,” Journal ofChromatography A, vol. 1353, pp. 131–139, 2014.

Submit your manuscripts athttps://www.hindawi.com
Hindawi Publishing Corporationhttp://www.hindawi.com Volume 2014
Inorganic ChemistryInternational Journal of
Hindawi Publishing Corporation http://www.hindawi.com Volume 201
International Journal ofInternational Journal ofPhotoenergy
Hindawi Publishing Corporationhttp://www.hindawi.com Volume 2014
Carbohydrate Chemistry
International Journal ofInternational Journal of
Hindawi Publishing Corporationhttp://www.hindawi.com Volume 2014
Journal of
Chemistry
Hindawi Publishing Corporationhttp://www.hindawi.com Volume 2014
Advances in
Physical Chemistry
Hindawi Publishing Corporationhttp://www.hindawi.com
Analytical Methods in Chemistry
Journal of
Volume 2014
Bioinorganic Chemistry and ApplicationsHindawi Publishing Corporationhttp://www.hindawi.com Volume 2014
SpectroscopyInternational Journal of
Hindawi Publishing Corporationhttp://www.hindawi.com Volume 2014
The Scientific World JournalHindawi Publishing Corporation http://www.hindawi.com Volume 2014
Medicinal ChemistryInternational Journal of
Hindawi Publishing Corporationhttp://www.hindawi.com Volume 2014
Chromatography Research International
Hindawi Publishing Corporationhttp://www.hindawi.com Volume 2014
Applied ChemistryJournal of
Hindawi Publishing Corporationhttp://www.hindawi.com Volume 2014
Hindawi Publishing Corporationhttp://www.hindawi.com Volume 2014
Theoretical ChemistryJournal of
Hindawi Publishing Corporationhttp://www.hindawi.com Volume 2014
Journal of
Spectroscopy
Analytical ChemistryInternational Journal of
Hindawi Publishing Corporationhttp://www.hindawi.com Volume 2014
Journal of
Hindawi Publishing Corporationhttp://www.hindawi.com Volume 2014
Quantum Chemistry
Hindawi Publishing Corporationhttp://www.hindawi.com Volume 2014
Organic Chemistry International
ElectrochemistryInternational Journal of
Hindawi Publishing Corporation http://www.hindawi.com Volume 2014
Hindawi Publishing Corporationhttp://www.hindawi.com Volume 2014
CatalystsJournal of