
In this Issue Indian Export Scenario for the year 2018 · Gems and jewellery is another leading...
16
In this Issue 1 Indian Export Scenario for the year 2018 4 United States-Mexico- Canada Agreement (USMCA) 5 India’s Agricultural Exports 6 India’s Bilateral Relaons with United Kingdom 7 Business Opportunies Seminar with Mullateral Development Banks 8 Success Story: Kumaon Earthcraſt 9 Exim Bank’s Lines of Credit 10 The Quarter That Was 11 Special Report: Asian Exim Banks Forum - Annual Meeng 12 Exim Bank Acvies 13 Country Scan 14 Currency Currents 15 Snippets on Indian Economy 16 Trade & Partnership Opportunies A Quarterly Publicaon by: EXPORT-IMPORT BANK OF INDIA www.eximbankindia.in www.eximmitra.in Head Office: Centre One Building, Floor 21, World Trade Centre Complex, Cuff Parade, Mumbai 400 005. Tel.: 022 2217 2600 Email : [email protected] India’s exports have witnessed resurgence aſter a prolonged period of stagnaon and decline. During April-October 2018, exports of goods and services from the country registered a robust growth of 12.8%, with export of services registering considerable growth of 24.8%. Most sectors of merchandise exports have witnessed strong growth, with sectors such as petroleum products, electronics, machinery, paper and Indian Export Scenario for the year 2018 DECEMBER 2018 VOL. XXXIV ISSUE IV related products, sports goods, plasc and rubber arcles, chemical and related products, transport equipment, and ores and minerals, registering double-digit growths during this period (Table 1). There has been moderaon/decline in exports only in select sectors, such as gems and jewellery, base metals, marine products, leather, plantaon goods, during the April-October 2018 period. TABLE 1 – INDIA’S EXPORTS BY SECTOR Sector Apr.-Oct. - US$ million % Growth 2018-19 % Share 2018-19 2017-18 2018-19 Project goods 3.3 10.4 217.0 - Petroleum crude & products 19533.8 28588.5 46.4 15.0 Office equipment 52.7 74.0 40.6 - Paper & related products 1454.6 1953.7 34.3 1.0 Sports goods 145.0 193.0 33.1 0.1 Electronics items 3343.3 4401.1 31.6 2.3 Plasc & rubber arcles 4103.0 5368.3 30.8 2.8 Machinery 13209.2 16866.7 27.7 8.9 Chemicals & related products 20270.9 24816.8 22.4 13.0 Transport Equipment 13173.3 14849.5 12.7 7.8 Total 168,642.2 190,623.7 13.0 100 Source: DGCI&S; - : Nil / Negligible SECTORAL OVERVIEW OF INDIA’S EXPORTS Chemicals and related products contributed 13% of export revenue, accounng for the largest share in exports aſter petroleum products. This sector registered considerable growth of 22.4% during April-October 2018, with large increases in export of ferlisers, organic chemicals and graphite, explosives and accessories. Gems and jewellery is another leading segment in terms of export value, contribung to 12.7% of India’s exports. Exports from the sector registered a decline of 1.6% during April-October 2018. Decline in shipment has been aributed to the connued decline in the export of gold medallions and coins, steep contracon in the export of silver jewellery and increase in the return of consignments by 18.9 per cent during the April- October 2018 period. Going forward, exports are expected to take off in the third and fourth quarters of 2018-19 on account of the ancipated increase in consumer spending during the fesve season and wedding seasons. Transport Equipment maintained its growth trend, registering growth of 12.7% during April- October 2018. Growth was led by increases in the export of railway transport equipment, bicycles, auto components, motor vehicles and auto tyres and tubes. This sector is expected to maintain the current growth levels, on account of demand revival and favourable policy support. The Automove Mission Plan 2016-26 aims to transform India as a global automove export hub, with the objecve of propelling India’s automove industry as a world leader in terms of engineering, manufacture and export of vehicles and auto components. Agriculture and allied products as a segment witnessed a marginal take off, registering a 0.92% growth, while plantaon goods registered y-o-y decline of 9.1% during the April-October 2018 period. The approval of the new Agricultural Export Policy in December 2018 is expected to enhance the performance of these sectors. The policy has been formulated to provide smulus to the agriculture sector with objecves of doubling
Transcript of In this Issue Indian Export Scenario for the year 2018 · Gems and jewellery is another leading...

1
In this Issue1 Indian Export Scenario
for the year 2018
4 United States-Mexico-Canada Agreement (USMCA)
5 India’s Agricultural Exports
6 India’s Bilateral Relations with United Kingdom
7 Business Opportunities Seminar with Multilateral Development Banks
8 Success Story: Kumaon Earthcraft
9 Exim Bank’s Lines of Credit
10 The Quarter That Was
11 Special Report: Asian Exim Banks Forum - Annual Meeting
12 Exim Bank Activities
13 Country Scan
14 Currency Currents
15 Snippets on Indian Economy
16 Trade & Partnership Opportunities
A Quarterly Publication by: EXPORT-IMPORT BANK OF INDIA
www.eximbankindia.in www.eximmitra.in
Head Office: Centre One Building, Floor 21, World Trade Centre Complex, Cuff Parade, Mumbai 400 005.
Tel.: 022 2217 2600 Email : [email protected]
India’s exports have witnessed resurgence after a prolonged period of stagnation and decline. During April-October 2018, exports of goods and services from the country registered a robust growth of 12.8%, with export of services registering considerable growth of 24.8%. Most sectors of merchandise exports have witnessed strong growth, with sectors such as petroleum products, electronics, machinery, paper and
Indian Export Scenario for the year 2018
DECEMBER 2018 VOL. XXXIV ISSUE IV
related products, sports goods, plastic and rubber articles, chemical and related products, transport equipment, and ores and minerals, registering double-digit growths during this period (Table 1). There has been moderation/decline in exports only in select sectors, such as gems and jewellery, base metals, marine products, leather, plantation goods, during the April-October 2018 period.
TABLE 1 – INDIA’S EXPORTS BY SECTOR
Sector Apr.-Oct. - US$ million % Growth 2018-19
% Share 2018-192017-18 2018-19
Project goods 3.3 10.4 217.0 -Petroleum crude & products 19533.8 28588.5 46.4 15.0Office equipment 52.7 74.0 40.6 -Paper & related products 1454.6 1953.7 34.3 1.0Sports goods 145.0 193.0 33.1 0.1Electronics items 3343.3 4401.1 31.6 2.3Plastic & rubber articles 4103.0 5368.3 30.8 2.8Machinery 13209.2 16866.7 27.7 8.9Chemicals & related products 20270.9 24816.8 22.4 13.0Transport Equipment 13173.3 14849.5 12.7 7.8Total 168,642.2 190,623.7 13.0 100
Source: DGCI&S; - : Nil / NegligibleSECTORAL OVERVIEW OF INDIA’S EXPORTS
Chemicals and related products contributed 13% of export revenue, accounting for the largest share in exports after petroleum products. This sector registered considerable growth of 22.4% during April-October 2018, with large increases in export of fertilisers, organic chemicals and graphite, explosives and accessories.
Gems and jewellery is another leading segment in terms of export value, contributing to 12.7% of India’s exports. Exports from the sector registered a decline of 1.6% during April-October 2018. Decline in shipment has been attributed to the continued decline in the export of gold medallions and coins, steep contraction in the export of silver jewellery and increase in the return of consignments by 18.9 per cent during the April-October 2018 period. Going forward, exports are expected to take off in the third and fourth quarters of 2018-19 on account of the anticipated increase in consumer spending during the festive season and wedding seasons.
Transport Equipment maintained its growth trend, registering growth of 12.7% during April-October 2018. Growth was led by increases in the export of railway transport equipment, bicycles, auto components, motor vehicles and auto tyres and tubes. This sector is expected to maintain the current growth levels, on account of demand revival and favourable policy support. The Automotive Mission Plan 2016-26 aims to transform India as a global automotive export hub, with the objective of propelling India’s automotive industry as a world leader in terms of engineering, manufacture and export of vehicles and auto components.
Agriculture and allied products as a segment witnessed a marginal take off, registering a 0.92% growth, while plantation goods registered y-o-y decline of 9.1% during the April-October 2018 period. The approval of the new Agricultural Export Policy in December 2018 is expected to enhance the performance of these sectors. The policy has been formulated to provide stimulus to the agriculture sector with objectives of doubling
2
farmer’s income by increasing exports and further integrating Indian farmers and agricultural products within the global value chains.
Textile is an important sector for the Indian economy from the perspective of output, employment and exports. While textiles segment registered marginal y-o-y export growth of 2.1% during the April-October 2018 period, certain sub-segments including readymade garments and jute textiles witnessed decline in exports.
The electronics industry registered a growth of 31.6 during April-October 2018. This is encouraging as the sector is responsible for approximately 28% of India’s trade deficit. Within the electronics sector, telecommunication instruments accounted for 44% of the trade deficit. Recognizing the need for capacity creation in the sector, and the multiple cross-sectional linkages with the industry has with key industries, the Government of India has attached high priority to electronics hardware manufacturing. The sector forms as an important pillar of both “Make in India” and “Digital India” programmes. The new Draft National Policy on Electronics 2018 has also been formulated and released for public consultation. The policy focuses extensively on the export orientation of this industry, providing attractive incentive packages for promoting indigenization and export of electronics.
Recent growth in the sector was driven by an expansion across all sub-segments of the electronics industry, with exponential take off in the segment of telecommunication instruments, followed by computer hardware and peripherals. Along with the growth in electronic exports, export of electrical machinery and equipment also registered more than 50% growth during April-October 2018, and contributed to 30% of export revenue in the machinery segment.
KEY MARKETS FOR INDIA’S EXPORTSThe USA and the UAE have consistently maintained their status as leading destinations for India’s exports, and
accounted for 16.1% and 9.3% of export value respectively during the April-October 2018 period. Other major destinations for export include China (share of 4.9%), Hong Kong (4.1%), Singapore (3.2%), and the UK (2.8%). Together these countries accounted for more than 50% of India’s exports. India has positioned itself as a critical regional trade partner and a key supplier of goods and services to neighbouring countries of Bangladesh, Nepal and Sri Lanka.
TABLE 2: KEY DESTINATIONS FOR INDIA’S EXPORTS
April – October 2017-18
April – October 2018-19
Destination % Share
Destination % Share
U S A 16.1 USA 16.1UAE 10.1 UAE 9.3Hong Kong 5.2 China 4.9China 4.0 Hong Kong 4.1Singapore 3.6 Singapore 3.2U K 3.1 UK 2.8Germany 2.8 Germany 2.7Bangladesh 2.6 Bangladesh 2.7Vietnam 2.5 Netherlands 2.5Nepal 2.0 Nepal 2.4
Source: DGCI&S
DRIVERS FOR EXPORT GROWTHIncrease in India’s exports has been in consonance with the growth in demand from developed and developing countries, and a concomitant increase in global trade. Exim Bank research indicates that India’s exports are responsive to global economic growth, and a 1% increase/ decrease in global GDP growth leads to a 3.1% increase/ decrease in India’s exports growth. Unsurprisingly, therefore, improvement in global demand has traditionally driven export growth from India. During 2017, global trade registered its largest increase in six years, on account of recovery in import demand from Asia and North America. This recovery in demand bode well for exports from India, especially given that these two geographies together account for more than two-third of India’s exports. Global GDP witnessed a further growth of 3%
during 2018, propelling India’s exports to a higher growth trajectory.
Rupee depreciation also contributed towards export growth during 2018. Exim Bank analysis indicates that depreciation has a positive impact on exports to the USA — one of India’s key export destinations — in the long run as well as in the short run. A 1% depreciation of Indian Rupee leads to a 0.3% increase in exports to the USA in the long run. In case of the Euro Area, another important export destination for India, a depreciation of one unit (cost of one unit of foreign currency given in units of local currency) leads to a 3.4% increase in exports.
The implementation of Cabotage Reform in Shipping and Logistics has also positively impacted India’s export performance. The relaxation of cabotage policy in May 2018 has liberalized coastal freight handling, previously the exclusive domain of Indian-flag ship operators. This has increased the value of transhipment in India over other port hubs of Colombo, Singapore etc., with container trade volumes increasing consistently. Implementation of the Government of India’s Sagar Mala programme is also set to enhance India’s shipping and coastal logistics through port modernisation, port connectivity enhancement and coastal community development.
Exim Bank research further indicates that nearly one-fourth of India’s exports are price sensitive. Rising commodity prices during most of 2018 is expected to have improved exports in the price-sensitive sectors. Crude oil prices reached levels as high as US$ 86 per barrel during October 2018, before plummeting in the following month. During April-October 2018, average crude oil (brent) prices registered a y-o-y growth of 44.6%. The high crude oil prices translated into high value of exports from segments such as petroleum products. Data indicates that India’s exports of petroleum products registered a y-o-y growth of 45.8% during the April-October 2018 period, at the back of improvement in oil prices during the year.

3
As price competitiveness has limited impact on most exports sector, India has made a conscious attempt to improve the non-price competitiveness of exports. Key reforms have targeted structural constraints to exports growth. The impacts of these reforms have been reflected in India’s improvement in the Ease of Doing Business Rankings published in World Bank’s Doing Business Report 2018. India recorded a jump of 23 positions against its rank of 100 in 2017 to be placed now at 77th rank among 190 countries assessed by the World Bank.
CHALLENGES TO EXPORT GROWTHWhile resurgence in global import demand, depreciation of Indian Rupee, and rising commodity prices supported India’s exports growth during 2018, newer challenges have emerged. Global tariff wars have decelerated the pace of global trade expansion, and are likely to affect India’s export growth prospects as well. According to the Economist Intelligence Unit, on account of the tariff wars and rising trade disputes, global trade growth is expected to slow during 2019-22, to an average of 3.5% a year as against a growth of 5.3% during 2017. This slowdown in global growth can impinge on India’s export growth. India’s export performance is extremely sensitive to global economic performance and more particularly, economic performance in the USA and China. Slowdown in the USA and China, triggered in part by the tariff wars, would have a severe impact on global economic prospects, and adversely impact the outlook for Indian exports.
But global tariff wars are just one of the many forms of protectionism which is adversely impacting exports. Exports from India face a number of non-tariff barriers across the world, especially in the developed countries. Moreover, trade agreements are also becoming increasingly more restrictive for India. The United States-Mexico-Canada Agreement, for example, calls for 40-45% of automobile content to be made by workers who earn at least US$ 16 an
hour by 2023, which shall induce car companies to use parts manufactured in North America versus cheaper parts from Asia. This shall impact the exports of transport equipment from India, which currently account for nearly 8% of India’s exports.
The Government of India offers incentives for exports to domestic manufacturers through its various programmes, such as the Merchandise Exports from India Scheme. Some of the export incentives have been challenged at the World Trade Organization (WTO) by the US government. Cognizant of these challenges, it will be imperative for the Government of India to put in place alternative schemes for promoting exports, which are in consonance with WTO guidelines for export incentives.
In the agriculture and allied sector, production has consistently outstripped demand in recent times, leading to substantial export capacities. However, India’s agri-exports have been facing constraints arising from conflicting policies relating to agri-production, storage, distribution, food security and pricing mechanisms. For example, policies related to Minimum Support Price has resulted in higher domestic prices in comparison to international prices of products of bulk exports such as sugar, wheat, rice etc., reducing the price-competitiveness of Indian exports. While timely utilisation of protectionism has provided support to the agriculture sector, restrictive policies have limited the potential of organic agriculture and agro-processing. In light of these challenges, the new Agriculture Export Policy assures that processed agricultural products and all kinds of organic products will not be brought under the ambit of any kind of export restriction even though the primary agricultural product or non-organic agricultural product is brought under some kind of export restrictions.
Global crude prices, which have a significant impact on the value of India’s exports, also dropped to US$ 54 per barrel in November 2018, on account
increasing production in the USA, Saudi Arabia and Russia, waiver to countries importing crude from Iran, as also weakening of crude oil demand. This decline in crude oil prices shall affect the value of exports of petroleum products – one of the largest category of exports – from the country.
In addition to these systemic and cyclical factors, one of the major challenges facing exporters in this year has been issues pertaining to refund of Goods and Services tax (GST) and the inadequate availability of affordable credit for exports in the current financial climate. Data pertaining to export credit indicates that outstanding advances to exporters have been consistently reducing since end-March 2017. According to a report on ‘Impact of Banking Misappropriation on Trade and Industry’, export credit which is part of the priority sector lending registered a decline of 24.4% at the end of fiscal 2017-18, and as a percentage of priority sector lending, it amounted to only 1.74%. The issue of delay in refund of IGST on export of goods and services has further restricted the availability of credit for export-oriented businesses, especially in the MSME segment, impacting the export performance of small businesses.
CONCLUSIONExim Bank’s forecast indicates that exports shall continue its upward trajectory and witness a growth of 7% during the third quarter of 2018-19. However, India’s exports, resurging after years of stagnation, are expected to face headwinds as global tariff wars escalate, and geopolitical events impact crude oil prices. However, a stronger domestic environment underpinned by the Goods and Services Tax regime, Insolvency and Bankruptcy Code 2016, Digital India campaign, Make in India initiative, and key infrastructure programs such as ‘Bharatmala Pariyojana’ and ‘Sagarmala Programme’ shall help the country in its quest for rapid export growth.

4 United States-Mexico-Canada Agreement (USMCA)
BACKGROUNDThe NAFTA (North American Free Trade Agreement), is a three-country accord negotiated by the governments of Canada, Mexico, and the United States, that entered into force in January 1994. The trade among the NAFTA nations stood at US$ 1.2 trillion in 2017, up from US$ 0.8 trillion in 2009. It may be noted that exports to the world from NAFTA economies were double when compared to exports within NAFTA. The average growth in trade during this period has been recorded at over 6%. NAFTA’s contribution to global exports as on 2017, was 13.5%.
RENEGOTIATIONS OF THE NAFTAOn September 30, 2018, the three economies of NAFTA, after a year-long negotiation, reached an agreement to update and significantly revise the status quo. The new deal between the three economies was signed on November 30, 2018 and came to be known as United States-Mexico-Canada Agreement, or USMCA. Some industries of interest to all the 3 nations have seen significant amendments to their earlier provisions. The new trilateral deal will last for 16 years, with a review to be made at a six-year mark. At that point, the three countries can extend the agreement or begin formal negotiations to fix any irritants. However, as it was before, any party can still decide at any time to exit the agreement after six months’ notice.
AUTOMOTIVE INDUSTRYOne of the important industries that is expected to see the benefits is the automotive sector, which could help spur investments in the North American region. from 2020, to qualify for zero tariffs within NAFTA region, a car or truck must have 75% of its components manufactured in Canada, Mexico or in the United States, a substantial boost from the current 62.5% requirement. Additionally, form 2020, cars and trucks should have at least 30% of the work on the vehicle done by workers earning US$ 16 an hour. This would gradually get enhanced to 40% for cars by 20231.
hinge on how provisions on steel and aluminium interact and influence the cost of production in this sector. This may have far reaching implications for many Asian countries including India, which are linked with automobile supply chains led by the American companies.
ROAD AHEAD FOR INDIA
The US trade policy under the current administration has shifted from multilateralism to bilateralism and is shaping trade agreements to align with its own economic interests. It is becoming all the way more vital for countries like India to carefully study the structure and implications of not only the USMCA but also other bilateral trade deals that the US is expected to initiate in the near future.
India is discussing its bilateral trade issues with the US as part of a ‘trade package’ of mutual concerns. However, a trade pact is unlikely to benefit India as tariffs on most goods are already low in the US, not leaving much scope for further reduction. On goods, India’s average tariffs are between 13% and 14%, while the US’ are less than 4%, leaving a huge gap for India to reduce duties. This could be a challenge for India if this issue is raised by the US during negotiations.
Therefore, Indian policy makers and trade negotiators have to brace for a carefully calibrated trade deal with the US which can serve business interests of both and, at the same time, align with their geo-strategic interests in the Indo-Pacific region.
CANADA’S DAIRY INDUSTRYEarlier, to ensure Canadian dairy farmers don’t go bankrupt, the Canadian government restricted the amount of dairy being produced in the country and imported by Canada. Further to the negotiations, Canada has given more market access to US producers. The USMCA will grant US producers/dairy farmers a 3.6% share of Canada’s domestic market.
A major victory for Canada in these negotiations was the retaining of Chapter 19 of the Agreement (NAFTA) - which allowed Canada, Mexico and the US to challenge one another’s anti-dumping and countervailing duties in front of a panel of representatives from each country. This is generally a much easier process than trying to challenge a trade practice in a U.S. court (proposed by the US).
POSSIBLE GLOBAL IMPLICATIONS OF USMCA
USMCA is expected to become a template for all future trade agreements of the US. This template will focus on rebalancing America’s trade relations with major trading partners. The US may use the USMCA as a guiding instrument for future multilateral trade negotiations at the WTO. Additionally, it is believed that its stringent rules of local content requirements will have a knock-on effect on global supply chains spread across the world. In case of the automobile sector, the potential gains from the USMCA will
India’s Agricultural Exports
2.0 1.6 2.0 2.3 2.4 2.4 2.5 2.3 2.2 2.4
16.0
12.3
15.1
18.1 18.4 18.9 18.9
16.4 15.9 17.6
0.0 2.0 4.0 6.0 8.0 10.0 12.0 14.0 16.0 18.0 20.0
2008 2009 2010 2011 2012 2013 2014 2015 2016 2017
NAFTA's exports to the world (In US$ Trillion) Total Global Exports (In US$ Trillion)
NAFTA’s exports to the world vis-a-via Global
Source: ITC Trade Map
1In the US, the average hourly pay for auto manufacturing workers was more than US$ 22 as of June 2018.

5India’s Agricultural Exports
OVERVIEW
India holds the second largest agricultural land in the world at 157.35 million hectares, with almost 55% of the population engaged in agriculture. The total food grains production in India is estimated to have reached an all-time high of 277.5 million tonnes (MT) in 2017-18 (as per second Advance Estimates). Rice and wheat production in the country is expected to stand at 111.01 MT and 97.11 MT as on 2017-18, respectively.
India has been the leading producer of milk, spices, jute globally, and the second largest producer of wheat and rice, after China. India is also the second largest producer of fruits and vegetables in the world; while being the leading producer of bananas, papayas, mangoes and guavas, and second largest producer of potatoes, green peas, tomatoes, cabbage and cauliflower.
It may be noted that India has witnessed a paradigm shift in food security, moving from a food deficit to a food surplus nation in the last few decades. The total food grain production in India has increased from 50.8 million tonnes in 1950-51 to nearly 277.5 million tonnes in 2017-18.
TRADE IN AGRICULTURE
The global agriculture exports1 were valued at US$ 1488 billion in 2017, marginally up from US$ 1471 billion in 2013, registering a marginal annual average growth rate (AAGR) of 0.5%, during this period. The major global exporters in 2017 were USA (9.5%); Netherlands (6.4%); Germany (5.5%); Brazil (5.2%); and China (4.9%).
India’s agriculture exports, on the other hand, were recorded at US$ 34.7 billion in 2017, down from US$ 41.7 billion in 2013, thereby recording an AAGR of (-) 3.6%, during this period. India, for long, has been a trade surplus nation, when it comes to agriculture. However, its trade surplus in the last 5 years has decreased from US$ 24.5 billion in 2013 to US$ 9.5 billion in 2017. Currently, India’s share in global exports of agriculture stands at
2.3% whereas the share in 2008 stood at 1.6%.
India’s agriculture export basket has been a mix of various products with the ‘Cereals’ (HS code-10) contributing the highest at 21.2% in 2017, followed by ‘Marine Products’ (HS code-03) at 19.2%; and Meat (HS code-02) at 12.4%. Major export destinations for Indian agricultural products in 2017 were Vietnam (14.8%); USA (13.3%); UAE (5.7%); Saudi Arabia (4.2%); and Iran (4.2%).
While India’s agricultural exports registered a negative growth rate over the last 5 years, the imports in the agricultural sectors registered an AAGR of 10%, during 2013 to 2017, rising from US$ 17.2 billion in 2013 to US$ 25.2 billion in 2017.
Within India’s import basket of agricultural products, almost 47.2% was contributed by ‘Animal or vegetable fats and oils’ (HS code-15) in 2017. This was followed by ‘Edible vegetables’ (HS code-07) at 15.7% and ‘Edible fruits’ (HS code- 08) at 13.6%. Major import sources for Indian agricultural imports in 2017 were Indonesia (21.7%); Ukraine (9.9%); Argentina (9.3%); Australia (8.2%); and Malaysia (6.3%).
AGRICULTURAL EXPORT POLICY
Government of India in 2018, brought out India’s Agricultural Export Policy. Apart from approving the draft policy, the Government also approved the
proposal for establishment of Monitoring Framework at Centre, with Department of Commerce as the nodal department, with representation from various ministries/departments and agencies and representatives of concerned State Governments, to oversee the implementation of the Policy.
OBJECTIVE AND VISION
• The National Agriculture Export Policy is formulated in line with the vision to double the farmer’s income and increase the share of agricultural exports from a little more than US$ 30 Billion as of now, to more than US$ 60 Billion by 2022.
• To boost high value and value added agricultural exports, focusing on perishables.
• To promote novel indigenous, organic, ethnic, traditional, and non-traditional categories.
• To provide an institutional mechanism for tackling market access barriers and deal with sanitary and phytosanitary issues.
• To become one of the top 10 exporting countries of agricultural products and strive to double India’s share in world agriculture exports.
• Focus on export centric clusters for integrated Commodity Focus Value Chain and Infrastructure Development.
41.7 38.0
30.6 29.5
34.7
17.2 19.4 20.9 22.0
25.2
24.5
18.6
9.8 7.4
9.5
0.0
5.0
10.0
15.0
20.0
25.0
30.0
0.0 5.0
10.0 15.0 20.0 25.0 30.0 35.0 40.0 45.0
2013 2014 2015 2016 2017
Exports (US$ Billion) Imports (US$ Billion) Trade Balance (US$ Billion)
India’s Trade Balance in Agriculture Products (US$ Billion)
Source: ITC Trade Map
1HS code 1 to 23 has been considered to assess agricultural exports

6 India’s Bilateral Relations with United Kingdom
India-United Kingdom bilateral relations have been progressively strengthening over the years and the two countries continue to have regular bilateral visits and interactions at the highest level. India and UK have a number of bilateral dialogue mechanisms in place, covering a wide spectrum of areas such as trade, investment, education, science & technology, defence, etc. Key institutional dialogues such as the India-UK Joint Economic & Trade Committee, Economic and Financial Dialogue, and India-UK Financial Partnership guide the bilateral economic and commercial relations between the two countries.
Bilateral trade between India and the UK doubled from US$ 7.1 billion in 2000-01 to US$ 14.5 billion in 2017-18. It peaked during 2013-14 at US$ 15.8 billion. The UK is among India’s major trading partners and during the year 2017-18, it ranked as India’s sixth largest export destination and 19th largest import source.
India’s exports to the UK increased by 13.6% to US$ 9.7 billion in 2017-18 from US$ 8.5 billion in 2016-17, accounting for 3.2% of India’s total exports to the world. Meanwhile, India’s imports from the UK also increased by 31.2% to US$ 4.8 billion in 2017-18 from US$ 3.7
billion in 2016-17. The UK accounted for 1.0% of India’s total imports during 2017-18.
The major commodities exported from India to United Kingdom during 2017-18 were machinery and mechanical appliances accounting for 10.5% of total exports. Other major exports included articles of apparel and clothing, not knitted or crocheted (9%), articles of apparel and clothing, knitted and crocheted (8.7%), pearls and precious stones (7.3%), pharmaceutical products (4.8%) and vehicles other than railway or tramway (4.6%), among others.
Pearls and precious stones were the major items imported by India from the UK, accounting for 19.2 % of India’s total imports from the UK in 2017-18. It was followed by machinery and mechanical appliances (14.8%), aluminium and its articles (7.3%), electrical machinery and equipment (7.1%) and optical, photographic and technical apparatus (6.6%). India has maintained a trade surplus with the UK in last ten years. India’s trade surplus with the UK stood at US$ 4.9 billion in 2017-18 remaining fairly constant as 2016-17.
As regards investments, UK is the fourth-largest source of FDI in India, with total FDI inflows from UK amounting to more
than US$ 26 billion (during April 2000 to June 2018), which accounted for 7% of India’s total FDI inflows. Top sectors attracting FDI inflows from the UK are petroleum, ports, services, roads and highways, and computer software. Some of the UK companies in India include, Aviva, British Telecom, British Petroleum, Barclays, Reuters, Cairn Energy, Unilever, etc.
Meanwhile, India continued to be the third largest investor in the UK and emerged as the second largest international job creator with Indian companies having created over 110,000 jobs in the UK. Indian FDI in joint ventures and wholly owned subsidiaries including equity, loan and guarantees issued (FDI outflow) in the UK stood at US$ 16.8 billion during April 1996 to November 2018. Indian investments in UK include significant investments in ICT, pharmaceuticals and chemicals. There are around 800 Indian companies in the UK of which Tata is the largest private sector employer in the UK. About 10% of these 800 Indian and India-focused companies based in the UK are listed on the London Stock Exchange. Other areas of cooperation between the two nations include defence, education, science and technology and cultural linkages.
Business Opportunities Seminar with Multilateral Development Banks
US$
billi
on
6.3 6.47.7
8.6 8.69.8 9.3 8.8 8.5
9.7
5.84.5
5.4 7.1
6.3 6.05.0 5.2
3.74.8
12.110.9
13.1
15.714.9
15.814.3 14.0
12.2
14.5
0.51.9 2.3 1.5 2.3
3.8
4.3 3.6
4.8 4.9
0
2
4
6
8
10
12
14
16
18
2008-09 2009-10 2010-11 2011-12 2012-13 2013-14 2014-15 2015-16 2016-17 2017-18Export Import Total Trade Trade Balance
India’s Bilateral Trade with the United Kingdom
Source: Ministry of Commerce and Industry, Government of India
7
Business Opportunities Seminar with Multilateral Development Banks
EXIM Bank has fostered a network of alliances and institutional linkages with multilateral agencies like the World Bank (WB), Asian Development Bank (ADB), and Asian Infrastructure Investment Bank (AIIB) which has evolved and strengthened over the years. The Bank in the process has been organising a series of business opportunities seminars (BOS) with such multilateral agencies at regular intervals.
Recently in November 2018, two such seminars were organized by EXIM Bank- one, in collaboration with WB, ADB and AIIB in New Delhi, and another, exclusively, in partnership with the ADB, in Bengaluru.
The World Bank (WB), through loans, grants, and technical assistance, has been supporting projects encompassing various sectors, across the world, especially in developing countries. Projects funded by the World Bank present attractive business opportunities for turnkey contractors, suppliers, construction firms, and consultants. Indian companies have been participating in the bids of the World Bank procurement and have achieved reasonable success. The seminar held in New Delhi, was
organised with a similar objective to facilitate the various process that a contractor has to go through in order to bag a project. It attempted to cover various sectors such as energy, transport, water supply & sanitation etc. The seminar also made an attempt to address various elements such as the upcoming business opportunities in MDBs funded projects, covering various regions. It also explained in detail the procurement framework of these agencies.
Akin to the World Bank, ADB at the regional level has been playing an equally pivotal role in improving the state of infrastructure across Asian economies. The ADB’s private sector operations exhibited a strong performance strongly in 2017, with a better project success rate. It facilitated more than US$ 8.2 billion of cumulative investments in various sectors. The ADB seminar held in Bengaluru also involved other prominent organizations such as FICCI; BAI; FIEO; and NHBF. Interesting projects such as ‘Sustainable Coastal Protection & Management Investment Program’ and ‘Supporting Kerala’s Addl. Skills Acquisition Program in Post-Basic Education’ were discussed. An online demo of ADB website on how
to access Country Operations Business Plan (COBP), Procurement Plans, and Consultant Services Recruitment Notices etc. was also given in order to facilitate the project executors who have to encounter the process.
In the wake of global economy recovering and high project needs especially in Africa and Asia, these workshops, provided useful insights to all stakeholders. Overall, both the workshops provided opportunities for Indian business participants to be aware of their prospects in various parts of the globe across sectors, while remaining vigilant on the rules and regulations.
EXIM Bank constantly endeavours to showcase Indian capabilities, both in public and private sector, in diverse fields covering engineering, consultancy, supply, procurement, audit, multidisciplinary engineering, software, construction, electrical equipment and encompassing sectors such as power, software, agriculture, engineering goods and energy. The Bank also actively participates in the Annual Meetings of MDBs including the WB, AIIB and ADB and plans to continue to be a part of these information dissemination events in areas of trade and investment.
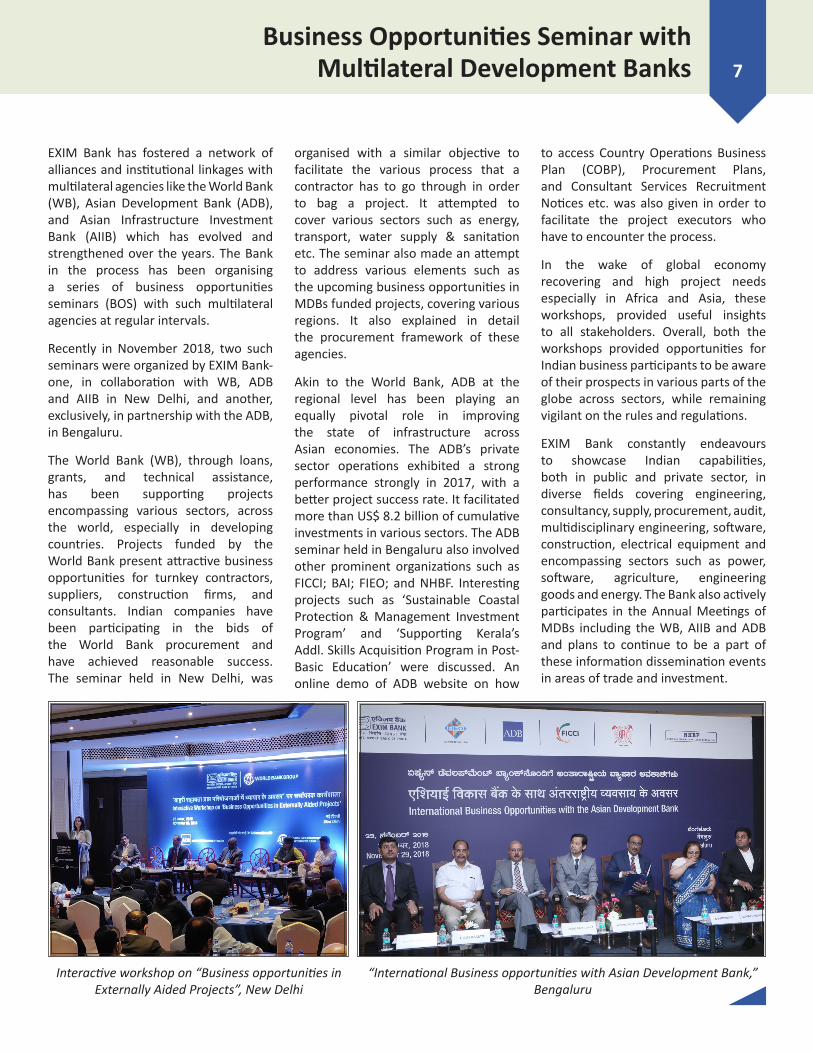
Interactive workshop on “Business opportunities in Externally Aided Projects”, New Delhi
“International Business opportunities with Asian Development Bank,” Bengaluru

8 Success Story: Kumaon Earthcraft
Earthcraft is a self-reliant cooperative society registered under the Uttaranchal Self–Reliant Cooperative Act, 2003. Earthcraft is promoted by Avani, a voluntary organization located in the central Himalayan region of India, working for the conservation of natural resources and the empowerment of disadvantaged women by providing them livelihood opportunities. The name “Avani” comes from the Hindi word for Earth.
Avani started a program with spinners and weavers in 1999 to preserve traditional heritage crafts and knowledge, and at the same time provide better livelihood to its members. Avani’s textile program attained enterprise status and was registered as the Kumaon Earthcraft Self Reliant Cooperative in the year 2005. This cooperative handles the entire business of textiles and other
natural products, including exports and is entirely producer-owned and managed, giving local women a rare opportunity to hold leadership positions. The overwhelming majority of beneficiaries are women with little or no education and they generally are from single woman households. As a result of Earthcraft’s efforts, these women are able to supplement their income from traditional agrarian activities.
Earthcraft is engaged in the production of textiles (woven/knit), natural dyes (dye powder, extract, pigment), art supplies (crayons, watercolour) and lifestyle products (soapnut, kumkum). A large variety of exquisite and high quality textiles in vibrant colors and natural materials have been created. The use of natural dyes for textile storage of dyeing has also evolved into a separate business line by itself
where Earthcraft is developing dye powders, extracts and pigments for use in natural and safe water color paints for children, dye extracts for natural dyers and pigments for applications on wood, natural crayons, cosmetics etc. Every item produced by Earthcraft is environment-friendly and 100% natural fact that six products of Earthcraft have received the UNESCO Seal of Excellence.
Earthcraft has been associated with Exim Bank since 2012, under the Bank’s Working Capital Term Loan Programme, towards part financing its working capital requirements. Their product range consists high quality silk and wool woven textiles, Knitted Products, Production of hand spun yarns in wool and silk Production of plant based dye materials, extract and pigments.

9Exim Bank’s Lines of Credit
Exim Bank of India has placed special emphasis on extension of Lines of Credit (LOCs) as an effective market entry mechanism with particular focus on small and medium enterprises. Exim Bank’s LOCs provide a risk-free, non-recourse export financing option to the Indian exporting community, which helps them to penetrate into new markets and enhance their export volumes in the existing markets overseas. Exim Bank extends LOCs to overseas financial institutions, regional development banks, sovereign governments and other entities overseas, to enable buyers in those countries to import developmental and infrastructural projects, equipment, goods and services from India, on deferred credit terms. Exim Bank also extends LOCs with the support of Government of India. Under the Lines of Credit extended with the support of Government of India, Exim Bank reimburses 100 per cent of contract value to the Indian exporters, upfront upon the shipment of goods and at least 75 per cent of goods and
services of total contract value should be sourced from India. LOCs have also enabled India to demonstrate project execution capabilities in the emerging markets. LOCs have helped to gather considerable momentum in the recent years, especially in the developing countries of Africa, Asia, Latin America, Oceania and the CIS. The Bank has now in place 238 Lines of Credit, covering over 62 countries in Africa, Asia, Latin America, Oceania and the CIS, with credit commitments of over USD 23.05 billion, available for financing exports from India. LOC is, thus, an effective instrument for promoting and facilitating India’s exports of projects, goods and services to developing countries.
A Line of Credit of USD 95 million was extended to the Government of the Republic of Mozambique for procurement of railway rolling stock including locomotives, coaches and wagons. With the above LOC, Exim Bank, till date, has extended thirteen
Success story: NigerExim Bank extended a GOI-supported LOC of USD 34.54 million to the Government of Niger for Solar electrification of 50 villages and solar photovoltaic system of 7 MW. Project scope included design, engineering, procurement & supply, erection, testing and commissioning of Solar Photo voltaic 7 megawatt power plant in Malbaza, Niger. H.E Brigy Rafini, Prime Minister of the Republic of Niger commissioned the plant in November 2018.
The project has helped reduce the power intake from Niger’s neighbouring country Nigeria. The existing natural conditions of Niger doesn’t permit higher power generation system, making it reliant on neighbouring countries for power supply. However, due to this project, power intake from Nigeria has reduced to 40% to 50 % at day time.
The solar power plant is connected to a 20 KV Malbaza-1 substation of Nigelec (the country’s power distribution agency) and the same substation is getting feed from Malbaza-2, a new substation of capacity 132KV/66 KV and 66KV/20 KV. The Power for the plant is distributed to surrounding areas such as Konni, Madava and Malbaza Village, and will be utilised for a cement factory at Malbaza, which is currently under construction.
LOCs to Mozambique, with the support of the Government of India (GOI), taking the total value of LOCs extended to USD 734.44 million. Projects covered under the LOCs extended to the Government of the Republic of Mozambique include rural electrification projects, transfer of water drilling technology and associated equipment, IT Park project, enhancing productivity of rice-wheat-maize cultivation, solar photo voltaic module manufacturing plant, Rehabilitation of Road between Tica, Buzi and Nova Sofala and construction of houses in Mozambique.
For further information, please contact
Nadeem PanjetanChief General ManagerExport-Import Bank of India,Office Block, Tower 1, 7th FloorAdjacent Ring RoadKidwai Nagar (East)New Delhi-110023Telephone: +91-11 24607700E-mail: [email protected]
7 MW Solar Power Plant in NigerInauguration of Solar Power Plant by
His Excellency Prime Minister of Niger
The project has helped local people with employment opportunities in relation to operation and maintenance of the project. The project has become an important milestone for the Government of Niger in its objective of achieving self-sufficiency in Power Generation.

10 The Quarter That WasSpecial Report: Asian Exim Banks Forum
- Annual Meeting
MANUFACTURING AND CHEMICALS, AMONG OTHERS, OFFER HIGH INVESTMENT POTENTIAL FOR INDIAN COMPANIES IN WEST AFRICA
Exim Bank’s study analyses the current investment scenario in the West African region and the opportunities that the region presents for Indian businesses. The study highlights the region’s significant economic progress in the last few decades and the continuous implementation of reforms which have improved the prospects of doing business in the region. Despite West Africa’s enormous investment potential, its integration into the global economy remains low mainly due to cross border constraints. In accordance with global investment trends witnessed in 2017, FDI into West Africa fell by 10.9 percent to US$ 11.3 billion in 2017 compared to US$ 12.7 billion in 2016, mainly due to decline in FDI to Nigeria and Ghana, receiving 27.1 percent of total FDI inflows into Africa. FDI prospects are expected to be relatively favourable for the region in 2018, benefitting from stronger commodity prices and improvements in infrastructure following high public investment. Nigeria, Ghana and Côte d’Ivoire have been the major drivers of foreign investment inflows during 2008 to 2017. Among the sectors, coal, oil
and natural gas remained the biggest capital investment attracting sector, followed by metals, communications, and alternative/renewable energy. Also, the top investors in the region include Canada, UK, South Africa, USA, China and France.
EXIM BANK’S STUDY IDENTIFIES OPPORTUNITIES FOR INCREASING INDIA’S EXPORTS TO THE LATIN AMERICA AND CARIBBEAN REGION
Export-Import Bank of India’s study titled “India-LAC Trade: Recent Trends and Opportunities in Select Countries” was released by Gen. (Dr.) V K Singh (Retd.), Minister of State for External Affairs, Government of India; and H.E. Mr. Eduardo Frei Ruiz-Tagle, Former President of Chile and Special Envoy of the President to Asia Pacific, Government of Chile, during the 8th
India-Latin America and Caribbean Conclave, held in Santiago, Chile on October 1, 2018.
Exim Bank’s study analyses the current trends in trade between LAC and India, and highlights the opportunities for further expanding trade relations between LAC and India. The study notes that bilateral trade between India and LAC has witnessed significant rise
in the recent years, with total trade between the two regions doubling from US$ 17.5 billion in 2008 to US$ 35.6 billion in 2017. The study identifies potential items for exports from India in order to increase the overall bilateral trade between the two countries, while also addressing the issue of India’s trade balance and enhance India’s ranking as LAC’s trade partner.
G-NEXID SUCCESSFULLY CONCLUDED THE THIRD EXCHANGE PROGRAMME
The Exchange Programme, the third initiative of G-NEXID after the Export-Import Bank of India in 2016 and the Brazilian Development Bank in 2017, organised by Indonesia Eximbank for G-NEXID members successfully concluded in October 2018 with fruitful exchanges in Jakarta and Bali. Driven by G-NEXID’s objective to facilitate cooperation among Exim banks and development finance Institutions in support of South-South trade, investment and project finance, the programme aimed at familiarising participants with Indonesia Eximbank’s financing facilities, in addition to providing opportunity for fruitful interactions with the Indonesian Ministry of Finance and the Central Bank (Bank Indonesia).
Release of Exim Bank’s Study during the 8th India - LAC conclave at Santiago, Chile

11
BACKGROUND
Export Credit Agencies [ECAs] or Exim Banks play a vital role in promoting and facilitating their countries’ international trade. Exim Banks have been set up, in most of the countries, by the Sovereign, or as a Sovereign driven initiative, in order to help their exporters to meet the global competition effectively. ECAs support their countries’ exports through a variety of financing programmes like Supplier’s Credit, Buyer’s Credit, Overseas Investment Finance and Lines of Credit. In that sense it may appear that ECAs in the world work in an environment competing with each other. However, synergies exist in their operations, and there are wide areas for collaboration amongst them.
The Asian Exim Banks Forum [AEBF] was conceived and initiated by Export-Import Bank of India in 1996, as a purely voluntary and informal grouping for Asian ECAs to exchange information and share ideas in a structured manner. The principal task of the Forum is to develop and enhance regional cooperation and forge stronger link among its member institutions, thereby fostering a long term relationship within the Asian ECA community. The founding members were ECAs of: India, Australia, China, Japan, Malaysia, South Korea and Thailand. Subsequently, ECAs of Indonesia, Philippines and Vietnam have also joined this initiative, and very recently, Turkey. The Asian Development Bank is a permanent Observer since 1999.
ANNUAL MEETINGS
During the first two Meetings held in India, the discussions focused on formalising an Annual Meeting and developing a common agenda. The periodicity of the meeting was made annual and each member ECA hosts the Annual Meeting by rotation.
Special Report: Asian Exim Banks Forum - Annual Meeting
Over the years, the Forum has served as an excellent platform for the CEOs of the Asian ECAs to discuss various topics of interest, be it areas of cooperation amongst ECAs, information exchange, promoting intra-regional trade, response to global financial crisis, challenges and sustainable growth mechanisms, regional cooperation and connectivity amongst others. Specific topics covered at each Annual Meeting are decided well in advance and reviewed during the time leading up to the meeting, in addition to any further ideas that emerge during the course of the year. For instance, on the backdrop of rising protectionism sentiments, the theme during 2017 was “Despite a marked slowdown in international trade, members within the leading cross-border trade and economic growth region of the world are well-positioned to lead global trade in the years to come”, and for 2018, “Industry 4.0 - Roles and Challenges for Asian Export Credit Agencies”, indeed most apt and appropriate for the present time.
SKILL DEVELOPMENT
Following the discussions held in the Annual Meeting in 2005, the AEBF has created various platforms to enhance knowledge sharing amongst its members through its training programs, held every year, in different areas of banking and trade. The diverse topics for the training workshops are selected carefully, and the workshop course contents designed through consultation. The objective of the training program is to equip participants with knowledge, and hands-on experience as well as to maximise information exchanges amongst members and invited guests. The program generally comprises of presentations and experience sharing by the faculties from member institutions as well as captains of industry.
Each ECA is one of its kind in its home country, and most times, compared with the commercial banks for lack of any other benchmark. Hence, the most understated benefit of the AEBF is perhaps the friendship and bonhomie that has developed over the years amongst its members.
WEBSITE
Exim Bank of India has also contributed to the development of the AEBF, and a brand new website [in lieu of the earlier portal] was launched at the recently concluded Annual Meeting hosted by Export-Import Bank of Thailand, in November 2018. The rationale behind setting up of this portal is to create competitive online presence, instant sharing of information and experiences, brand building, and eventually to facilitate conduct of business among member institutions.
IN SUM
The Asian Exim Banks’ Forum seeks to enhance economic cooperation and forge stronger linkages among its member institutions, thereby fostering a long-term relationship within the Asian Exim Banks’ community. At present, the AEBF has eleven members and the Asian Development Bank has permanent observer status in the Forum. While ECAs are generally considered as competitors as they support their respective national exports, the objective of the Forum is to collaborate while competing. Having traversed as an “Asian” forum for over two decades, it would be worthwhile to watch the Forum gradually transition to become an “Exim Banks Forum” also embracing the other non-Asian ECAs.

12
Exim Bank had organised a seminar on trade and investment opportunities in Latin America and Caribbean (LAC) region to explore the substantial untapped potential for Indian exporters, which present opportunities for India due to their high import demand in the LAC region. The seminar was organised during the visit of senior-level delegation of the Latin American Association of Development Financial Institutions (ALIDE). The objective of the seminar, held in Mumbai on October 25, 2018, was to provide a platform to bring together various stakeholders to discuss the trade and investment potential in LAC region. On this occasion, Exim Bank released a working paper titled ‘India-LAC Trade: Recent Trends and Opportunities in Select Countries’. The seminar was attended by high-level delegation from ALIDE, trade promotion bodies, Indian corporates, diplomats and region experts.
Exim Bank shared its recommendations to improve the export competiveness of Uttar Pradesh during a seminar on ‘Exports from Uttar Pradesh: Trends, Opportunities and Policy Perspectives’ organised at Greater Noida on October 31, 2018. The seminar had speakers from the government, industry chambers, DGFT, ECGC and Exim Bank. According to a research report by the Exim Bank, Uttar Pradesh has an untapped export potential of more than USD 8 billion and exports from the State could reach USD 30 billon by 2023 from its current levels of USD 13.8 billion (2017-18). In the short term, the State government can focus on increasing exports from sectors in which it has a competitive edge and where global demand growth has been robust such as animal and animal products; textile and garments; construction material; leather and leather products; and gems and jewellery. In the medium term, the State government can focus on improving competitiveness in the categories of machinery and mechanical appliances; electrical and electronic goods; optical, measuring, medical and similar instruments and parts; and pharmaceutical products.
MAS ACTIVITIESExim Bank has been supporting and curating grassroots enterprises and craftsmen across India, in the areas of product development, design & packaging sensitization, with the twin-objective of reviving the traditional arts and crafts of India, besides affording a sustainable means of livelihood to the artisans. The Bank, through its training programmes and workshops, has been able to motivate second generation artisans into learning ancestral crafts, build a sustainable business and help gain due recognition for the various arts and crafts, at several platforms across India and overseas.
Exim Bank, along with Centre for Microfinance & Livelihood (CML, an initiative of Tata Trusts), has organized “Design Development Training Workshops” for artisans in Thoubal District, Manipur to support the Kauna cluster through a series of capacity building workshops, as part of the Memorandum of Cooperation (MOC) with CML. The workshops are being conducted at various levels namely, for Master Craftsperson, Intermediate, Long term Design Workshops and Product Diversification. CML Program Managers, along with the ‘Livelihood Propulsion and Support Services’ (LPSS) - an entity of CML, and ODESH, are managing the entire training program and will also monitor the progress of the artisans involved, over a period of six months after the completion of the workshop, especially in the areas of business/ employment generation, thereby ensuring that the workshop results in concrete benefits for the artisans.
Exim Bank through its Marketing Advisory Services (MAS), plays a promotional role to create and enhance export capabilities and international competitiveness of Indian companies. Exim Bank assists in identification of opportunities overseas and seeks to help Indian exporting firms in their globalization efforts by proactively assisting in locating overseas distributors / buyers / partners for their products and services. The Bank extends support and promotes grassroots enterprises by providing specific interventions such as assistance in skill development, product development and export readiness.
For further information, please contact: [email protected]
EXPORT LEADING INDEXExim Bank forecasts India’s merchandise exports to witness a growth rate of 7% (increasing from US$ 77 billion to US$ 82.39 billion) and non-oil exports to witness a growth rate of 7.2% (increasing from US$ 66.65 billion to US$ 71.45 billion)during the third quarter of 2018-19 viz. October-December 2018, over the corresponding quarter of the previous year. The forecasts are based on Exim Bank’s Export Leading Index (ELI), which continued to show a positive growth momentum. Forecast of growth in India’s total merchandise exports and non-oil exports would continue to be released on a quarterly basis, during the first week of the months of June, September, December, and March for the corresponding quarters, with continuous improvisation to the model. The next growth forecasts for India’s exports for the quarter January-March 2019 would be released during the first week of March 2019.
The model and the forecast results have been reviewed by a standing technical committee of domain experts comprising Professor Saikat Sinha Roy, Professor & Coordinator, Centre for Advanced Studies, Department of Economics, Jadavpur University, Kolkata; Dr. Sarat Dhal, Director, Department of Economic and Policy Research, Reserve Bank of India, Kolkata; Professor N. R. Bhanumurthy, Professor, National Institute of Public Finance and Policy (NIPFP), New Delhi; and Professor C. Veeramani, Professor, Indira Gandhi Institute of Development Research (IGIDR), Mumbai.
As part of its continued research initiatives, Exim Bank has developed an in-house model to generate an Export Leading Index (ELI) for India to track and forecast the movement in India’s exports on a quarterly basis. The ELI gauges the outlook for the country’s exports and is essentially developed as a leading indicator to forecast growth in total merchandise and non-oil exports of the country, on a quarterly basis, based on several external and domestic factors that could impact exports of the country.
Exim Bank Activities
ACTIVITIES OF EXIMIUS CENTRE OF LEARNING

13
KENYA
Kenya’s real GDP growth is estimated to have accelerated to 5.8% of GDP in 2018, from 4.9% of GDP in 2017, and driven by agriculture (owing to favourable weather) and most service sectors, including tourism, communications, transport, real estate and retail. Real GDP growth is likely to remain buoyant in 2019, at a projected 5.8%—the same as the estimated outcome for 2018—underpinned by rising consumption and stronger investment. Average consumer price inflation to eased to an estimated 5% in 2018, after spiking at a five-year high of 8.7% in 2017, because of favourable rains and broadly stable food prices—despite costlier energy. Power tariff hikes in mid-2018 and tax rises imposed in September 2018, including VAT on fuel at 8%, combined with higher world oil prices are likely to maintain the upward pressure on energy costs. Consequently, average inflation is likely to rise to 6.2% in 2019, up from 5% in 2018. Kenya’s current-account deficit narrowed to an estimated US$ 4.8 billion (5.4% of GDP) in 2018 from US$ 5 billion (6.3% of the GDP) in 2017. The current-account deficit is expected to from an estimated 5.4% of GDP in 2018, to 4.6% of GDP in 2019 and 4% of GDP in 2020, helped by growth in earnings and nominal GDP.
PERU
Peru’s economic growth is estimated to have increased in 2018 to 3.7%, up from 2.5% in the previous year, owing to increasing investments. However, headwinds from a US-China bilateral trade war and a projected business cycle slowdown in the US are likely to affect Peru’s generally favourable domestic and external conditions, to deliver an annual average GDP growth rate of 3.9% during 2019-23. Inflationary pressures moderated in 2018, with average consumer price inflation moderating to 1.3%, from 2.8% in 2017. The central bank’s inflation targeting framework is expected to remain effective in anchoring
Country Scan
inflation expectations, which should ensure that inflation stays within the 1-3% target range over the forthcoming years. Peru’s current account balance worsened in 2018, with current account deficit widening to 2.2% of GDP, from 1.1% of GDP in 2017. The current-account deficit is forecast to average 2.3% of GDP in 2019-23. The deficit will be more than adequately financed by inward flows of FDI, which will average 3.4% of GDP in 2019-23.
QATAR
Economy of Qatar is estimated to have grown by a modest rate of 1.9% in 2018, as compared to 1.6% in 2017, owing to restricted oil production, in line with the recently extended OPEC agreement and the ongoing diplomatic crisis. Nonetheless, the impending launch of the long-awaited US$ 10 billion Barzan Natural Gas Development is expected to provide a partial offset to these negative trends. Economic growth is expected to get a boost in 2022 for World Cup to be hosted by Qatar, owing largely to the demand in the services sector—particularly tourism and transportation. High household incomes would also sustain private consumption, and government spending on capital projects is also expected to remain high by historical standards. Real GDP growth is expected to remain at an average of 1.9% during 2019-21 and accelerate to 3.8% in 2022 before easing back in 2023 to a projected rate of 3.1%. The opening up of new trade routes to “beat the blockade” has been bolstered by a planned expansion of Qatari LNG exports from 77 million to 110 million tonnes a year, further integrating the tiny state into the global economy. Qatar has made a decision recently to leave OPEC to shift its focus on expanding its natural gas exports moving away from the production and exports of crude oil as it has been a marginal player in crude producing 600,000 barrels a day compared to the other OPEC members.
Consumer price inflation is estimated to remain at 0.8% in 2018 compared to 0.4% in 2017. The boycott has had a variable impact on consumer price inflation, which has remained subdued throughout most of 2018, as the effect of rising global oil prices (and the consequent impact on transportation costs) was mostly offset by the impact of the stronger US dollar (to which the riyal is pegged) on import costs. The current account is expected to remain in surplus during 2018 at 8.7% of GDP increasing from 3.8% of GDP in 2017 due to increased trade surplus.
UZBEKISTANUzbekistan’s economic growth has been steady in 2018, with real GDP growth at an estimated 4.6% in 2018, slightly up from 4.5% in 2017. Over the forthcoming year, real GDP is forecast to rise by an average of 5.6% during 2019-23, driven by favourable prices for some of Uzbekistan’s main commodity exports, including gold, cotton and copper, as well as growth in small and medium businesses owing to the benefits of the new tax policy. Inflationary pressures have remained strong in 2018 and is estimated to have increased to an average of 18%, up from 14% in 2017, owing to the residual effect stemming from the depreciation of the som and driven by a pick-up in domestic demand. During the period 2019-23 inflation is likely to decelerate as the som appreciates moderately, growing by an average of 10.6% per year. According to the Central Bank of Uzbekistan (CBU), the current-account, which posted a surplus of US$ 111.6 million in the first quarter of 2018, moved into a deficit of US $ 1.2 billion in the second quarter, driven by a widening of the trade deficit. Export and import growth were robust in the first half of the year. However, exports fell in the third quarter, by 6.2% year on year, which is likely to lead to a further widening of the current-account deficit. In 2018, the current account to move into a deficit of an estimated 5.5% of GDP. The current account deficit is likely to be financed by increasing capital inflows.

14
INDIAN RUPEE
2018 has been a tumultuous year for the Indian rupee, which fell with frightening speed towards the end of the year. The Rupee lost more than one-tenth of its value, hitting a lifetime low of 74.4850 in October when global crude prices turned preposterous. Around the same time, a strengthening greenback and foreign fund outflows turned up the heat.
Though rupee found its feet in December, a host of risks both domestic and global, may keep it on the cliff and continue to puzzle market watchers by its indirection in 2019.
The US Federal Reserve’s policy stance of gradual tightening and anticipated three rate hikes in 2019, which is now being softened is one of the factors. Provided Fed continues with its normal rate tightening course, US bond yields will strengthen, which will have a bearing on our currency.
The ongoing US-China trade war, and Brexit outcome could add to uncertainty. Global investors would shy away from Emerging Market assets in the event of any risk re-assessment or would prefer cherry-picking at appropriate premium. The Rupee will not be insulated from any of the global eccentricities and will follow suit.
Back home, the upcoming general elections are a key risk to rupee. Markets expect a return of the incumbent government, though with reduced majority. That sentiment could go sour, if results throw up a fragile coalition, putting rupee under pressure.
A weakening rupee also peeved policy makers, prompting them into a humble public submission that none will come to its rescue, except market forces.
AUSTRALIAN DOLLAR
Brexit jitters, interest-rate differentials and dramatic swings in prices of natural resources were among the major currency drivers in 2018. But worries about global trade and US President Donald Trump’s tit-for-tat dispute with China may have delivered the most consistent and lasting blow to global currencies.
The consensus among market participants is, and was, that a trade war wouldn’t be good for anyone, but currencies reacted very differently to this theme.
The Australian dollar for one, generally considered a risk-sentiment barometer and a developed-market proxy for Chinese and global economic growth, ended up as the worst G-10 performer of 2018 against the US dollar.
Australia’s economy is deeply enmeshed with China’s thanks to its iron-ore exports used in Chinese infrastructure and construction sectors. Worries about the trade spat between Washington and Beijing, which still isn’t resolved, as a result, helped to push the Aussie dollar nearly 10% lower against the greenback in 2018.
Trade talks are due to pick back up in January, and hopes are high that a solution can be achieved. But if the renegotiation of the North American Trade Agreement—which took 15 months to complete—it might still be a while. So for Australia’s currency this means waiting and hoping.
And it’s not just the trade jitters that could bother the Aussie next year. Global economic growth is also expected to slow, which could result in further Aussie weakness.
VIETNAMESE DONG
The Vietnamese dong depreciated against the US dollar by 2.7 per cent but is
constrained against further depreciation because of Vietnam’s relatively high level of public debt (around 45 per cent) denominated in US dollars. As a result, Vietnam’s real effective exchange rate actually appreciated by an estimated 2.5 per cent.
Credit growth in the second half of 2018 moderated to around 17 per cent, compared to 19.5 per cent in the same period last year. But the overall credit-to-GDP ratio remains high at over 130 per cent.
The growth in public debt is being contained by a combination of state asset sales and tighter fiscal policy. But Vietnam still needs substantial investment in infrastructure and energy generation. For this to happen the government must involve the domestic private sector and encourage its development through structural reform.
Vietnam seems to have slipped behind reform in other countries and has fallen in the World Bank ‘Ease of Doing Business’ rankings from 68 to 69 (of 190 economies).
One promising trade development this year was Vietnam’s ratification of the Comprehensive and Progressive Agreement for Trans-Pacific Partnership (CPTPP) in November. This is an important step for Vietnam as the CPTPP involves a significant reduction in tariff and non-tariff measures (NTMs) for participating countries.
Despite challenges, the Vietnamese economy continued to show resilience overall. GDP growth is estimated to be sitting at around 6.8 per cent, inflation at 4 per cent and the current account is projected to stay in surplus at 2.2 per cent of GDP. Real wages grew by 3.2 per cent in the first half of 2018 and the reported unemployment rate remained at 2.2 per cent.
Currency Currents Snippets on Indian Economy
Import Trade BalanceExport
Source: MOCI
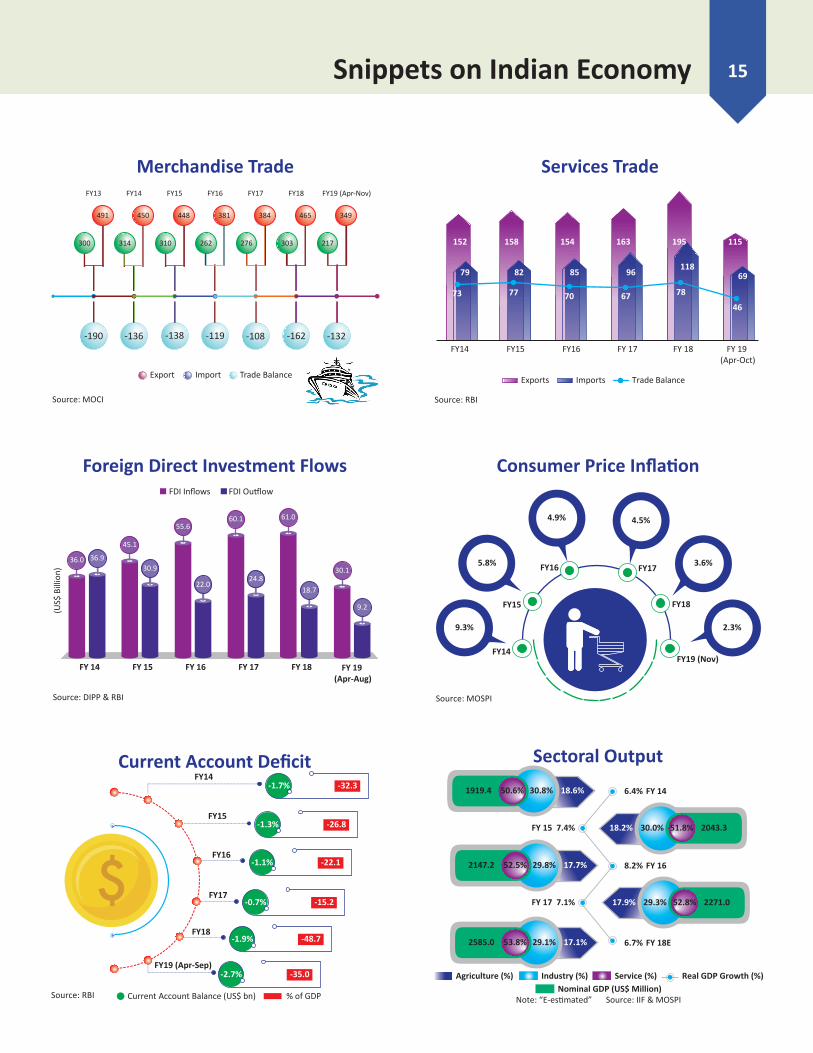
Merchandise Trade
-190
314
-136
450
310
-138
448
262
-119
381
276
-108
384
303
-162
465
-132
217
349
300
491
FY13 FY14 FY15 FY16 FY17 FY18 FY19 (Apr-Nov)
Foreign Direct Investment Flows
Source: DIPP & RBI
FY 14 FY 15 FY 16 FY 17 FY 18 FY 19 (Apr-Aug)
(US$
Bill
ion)
FDI Inflows FDI Outflow
36.0 36.9
45.1
30.9
22.0
55.6
24.8
60.1
9.2
30.1
18.7
61.0
Current Account DeficitFY14
-1.7%
FY15
FY16
FY17
FY18
FY19 (Apr-Sep)
-32.3
-1.3% -26.8
-1.1% -22.1
-0.7% -15.2
-1.9% -48.7
-2.7% -35.0
Source: RBI Current Account Balance (US$ bn) % of GDP
Services Trade
158 154 163 195 115
118
FY14 FY15 FY16 FY 17 FY 18 FY 19 (Apr-Oct)
Exports
Source: RBI
Imports Trade Balance
152
79
73 77 70 67 78
46
85 96 6982
Consumer Price Inflation
9.3%
5.8%
4.9% 4.5%
3.6%
2.3%
FY14
FY15
FY16 FY17
FY18
FY19 (Nov)
Source: MOSPI
Sectoral Output50.6% 30.8% 18.6% 6.4% FY 14
FY 15
8.2% FY 16
6.7% FY 18E
7.4%
FY 17 7.1%
1919.4
18.2% 30.0% 51.8% 2043.3
52.5% 29.8% 17.7%2147.2
17.9% 29.3% 52.8% 2271.0
53.8% 29.1% 17.1%2585.0
Nominal GDP (US$ Million)Note: “E-estimated” Source: IIF & MOSPI
Agriculture (%) Industry (%) Service (%) Real GDP Growth (%)
15Snippets on Indian Economy

16
TechnologyAn end-to-end dairy technology solutions company incubated by the IIT Madras Rural Technology Business Incubator (RTBI). The company provides cloud-based, mobile enabled technology for the Dairy segment.
Hand-KnitA self-reliant cooperative society working for the conservation of natural resources and the empowerment of disadvantaged women by providing them livelihood opportunities is engaged in the production of textiles.
Jute ProductsManufacturer of eco-friendly, natural fibre with golden and silky shine, 100% bio-degradable and recyclable jute bags. Jute bags offers a change for brand building and protection of environment.
HealthcareOne of the leading Oncology Consultants of the country having expertise in comprehensive cancer care. The quality services provided at all the centers are at affordable cost for one and all.
Wooden cutleryWooden Cutlery products such as spoons & forks, paper cutter and hair clips, lamp shades, photo frames, toys are made my artisans who still maintain this craft as livelihood, sell at exhibitions & fairs.
HandloomConnecting rural artisans with global consumers in order to develop sustainable livelihoods and revive India’s rich craft heritage. The organization aims to keep alive the rich tradition of the craftsmanship of artisans in a rapidly changing urban market.
Partnership Opportunities
Project Opportunities
(I) A company from Canada is interested in procuring tailor made shirts and pants in various sizes in bulk quantity for uniforms.
(II) A prospect from Sierra Leone, is interested in setting up a plant for converting waste material to energy. The nature of waste material, may be organic waste, solid waste, liquid waste or industrial waste. May write to us for the project authority details regarding land/other regulatory clearances needed – preferably an RFP-like document that would cover the techno economic parameter.
Interested parties may like to reach out to Marketing Advisory Services Group on contact details mentioned as under.
For more details, please contact:- Phone: 2217 2600, Extn : 2822/2737, Fax: 2218 8268, Email: [email protected]
Trade And Partnership OpportunitiesTrade Opportunities