
Breaking Up Is Hard To Do: Why Do Travellers Unlike Travel-Related Organizations?
Breaking Up Is Not Hard to DoMega-mergers always grab many headlines in the financial press. Lately, how-
ever, for every Intel (INTC)-Altera (ALTR) or Charter Communications (CHTR)-Time Warner Cable (TWC) merger, there seems to be another company announcing that it’s spinning off some piece of itself into a separate publicly traded entity.
For years, business schools taught that sometimes the whole is worth more than the sum of its parts. The synergies generated by merging companies—economies of scale, lower overhead, etc.—were the driving forces behind such corporate marriages. However, research by finance professor Anil Shivdasani, from the University of North Carolina’s Kenan-Flagler Business School, tries to debunk that notion. Shivdasani’s data indicates that smaller may actually be better. Specifically, split-offs and break-ups appear to provide increased financial strength and shareholder value to the new, smaller, separate entities. Instead of building empires, the data suggests, breaking up companies may allow execu-tives to perform better as part of a more narrowly focused company.
Shivdasani’s research shows that split-off rivals outperformed shares of their North American conglomerates by an average of 11.4% from 2000 to 2010. Furthermore, Shivdasani found that in the three months following a split an-nouncement, their shares outperformed their rivals by 6%. Another way to track the performance of spin-off companies is through the Guggenheim Spin-Off ETF (CSD). To be eligible for inclusion in the exchange-traded fund, a company must be spun off six to 30 months prior to the fund’s semiannual rebalance date and the stock must trade on a major U.S. exchange as a common stock. As of the close on June 1, shares of the ETF have gained an average of 20.2% a year over the last five years, compared to the S&P 500 index’s total return of 17.0% a year.
The notion that two companies are better than one has led several activist investors to pressure the boards of several high-profile companies to split them-selves up. Barington Capital Group publicly criticized Darden Restaurant’s (DRI) spin-off of its Red Lobster chain. In May 2014, Darden announced it was selling Red Lobster to Golden Gate Capital for $2.1 billion. Barington had been calling on Darden to break itself up, but it believed that the Red Lobster spin-off did not go far enough. Instead, it argued that Darden should divide its mature brands, including Red Lobster and Olive Garden, from its younger, faster-growing chains. Running several different restaurant chains was too complex, Barington argued.
Darden also faced off with hedge fund Starboard Value and lost. Starboard made headlines last year when it criticized Darden’s Olive Garden chain for wast-ing money by providing diners with unlimited breadsticks. In October, Starboard successfully placed its entire slate of nominated directors on Darden’s board. The new directors include Starboard’s CEO Jeffrey C. Smith. Starboard mounted its campaign to unseat the entire Darden board after the company demonstrated “contempt for shareholder interest.”
Last September, eBay (EBAY) made the surprise announcement that it was splitting off its PayPal payment-processing unit, which generates nearly half of eBay’s total revenue. This came just six months after the company rejected activ-ist investor Carl Icahn’s calls to spin off PayPal in what became a bitter contest. Icahn publicly criticized eBay as having failed its investors by not obtaining full
AAII Dividend Investing is produced by AAII. “The American Association of Individual Investors is an independent nonprofit corporation formed in 1978 for the purpose of assisting individuals in becoming effective managers of their own assets through programs of education, information and research.”
In This Issue
DI TablesPortfolio Alerts This Month 2Portfolio Holdings 3Performance of DI Portfolio 4Recent Earnings Announcements 5Dividend Payments 6Dividend Analysis 7
In-Depth Stock ReportsCaterpillar Inc. (CAT) 8
This powerhouse digs up value as the world’s largest construction and mining equipment manufacturer.
Invesco Ltd. (IVZ) 10Money manager continues to grow assets, earnings and dividends.
McDonald’s Corp. (MCD) 12New chief executive facing flagging sales trend, wage pressure and discontent among franchisees.
Microsoft Corp. (MSFT) 14Cloud revenue growth is a sign that customers are embracing Microsoft again.
DI Article Investors Prefer Dividend-Paying Companies in Market Downturns 16
An increase in yield plus the confidence a dividend signals make dividend stocks more valued during tough times.
Next Publication Date: July 2, 2015
June 2015Volume IV Issue 6
www.AAIIDividendInvesting.com
TM
2 June 2015
value for the sale of businesses such as Skype, the video chat service. As the feud dragged out, Icahn changed his demands, instead calling on eBay to sell 20% of PayPal to shareholders. Eventually, Icahn dropped his demands in exchange for two board seats and the PayPal spin-off. He also signed a confi-dentiality agreement.
Finally, Daniel Loeb’s Third Point LLC hedge fund has taken on Dow Chemi-cal (DOW), pushing it to spin off its slow-growing petrochemical business and focus on specialty materials. Last November, to avert a proxy fight with Third Point, Dow agreed to add four independent directors to its board—two nominees of Third Point and two nominees from Dow. The two sides also entered into a one-year standstill agreement, whereby Third Point will not publicly criticize Dow for that period of time.
Some DI Companies are Splitting
In the DI portfolio, PepsiCo Inc. (PEP) was pressured last year by activist inves-tor Nelson Peltz to split up its beverage and snack food operations; PepsiCo CEO Indra Nooyi has steadfastly refused, countering that separating snacks and drinks “loses significant synergies.”
Procter & Gamble Co. (PG) is divesting
roughly 100 of its lesser brands to focus on its core portfolio. This entails selling off pieces to other companies or po-tentially spinning them off as separate entities. Perhaps the most high profile of P&G’s divestitures has been the $4.7 billion sale of Duracell to Warren Buf-fett’s Berkshire Hathaway (BRK.B).
One DI portfolio component that has heeded the call to split up is Baxter International (BAX). In March of last year the company announced plans to create two independent health care companies. One, Baxalta, will focus on developing and marketing biopharma-ceuticals for the treatment of hemo-philia, immune deficiencies and other chronic and acute medical conditions. The “new” Baxter’s portfolio will focus on intravenous solutions and nutritional therapies, drug delivery and administra-tion systems and products and services to treat patients with end-stage renal disease.
On March 27, 2014, the day the company announced the spin-off, BAX shares gained nearly 4%. Since the an-nouncement, however, Baxter shares have lost 5.4%, while the DI portfolio’s comparison benchmark, the Dow Jones U.S. Index ETF (IYY), has generated a 16.2% return.
Echoing popular sentiment, Baxter and Baxalta’s management believe the
spin-off will offer “greater management focus” of the respective company’s products and services; “the ability to drive inno-vation and allocate nec-essary resources”; and “the flexibility” to pursue growth and investment strategies to generate “revenue acceleration,
improved profitability and enhanced returns.”
As a result of the spin-off, which is anticipated to take place on July 1, Bax-ter shareholders will receive one share of Baxalta common stock for every share of Baxter common stock held. Baxalta will not issue fractional shares of its common stock in the distribution, except for those participants in Baxalta’s dividend investment program. Baxter shareholders will receive a cash pay-ment based on the number of fractional shares they would have been entitled to receive. No record date has been set for the distribution. Baxter sharehold-ers do not need to take any action to receive the common stock of Baxalta except to own Baxter shares on the record date, whenever that may be. You will receive shares of Baxalta common stock through the same channels that you currently use to hold shares of com-mon stocks, i.e. your brokerage account. Baxalta has applied to have its com-mon stock listed on the New York Stock Exchange under the symbol “BXLT.” For more information about the spin-off, visit the dedicated website via Baxter’s investor relations site at www.baxter.com/investors.
We are studying how best to handle the new Baxalta shares. We are wait-ing for more information about the
Published monthly by the American Association of Individual Investors 625 N. Michigan Ave., Chicago, IL 60611 312-280-0170, www.aaii.com. Annual DI subscription, $199.
AAII Dividend Investing™ (DI) is not a registered investment adviser or a broker/dealer. This report is issued solely for informational purposes and should not be construed as an offer to sell or the solicitation of an offer to buy securities.
The opinions and analyses included herein are based on sources believed to be reliable and written in good faith, but no representation or warranty, expressed or implied, is made as to their accuracy, completeness, timeliness, or correctness. Neither we nor our information providers shall be liable for any errors or inaccuracies, regardless of cause,
or the lack of timeliness of, or any delay or interruptions in, the transmission thereof to the users. All information contained in this report should be independently verified with the companies mentioned.
© American Association of Individual Investors, 2015. AAII Dividend Investing is a trademark and service mark of the American Association of Individual Investors—All rights reserved. This publication may not be reproduced in whole or in part by any means without prior written consent.
“The American Association of Individual Investors is an independent nonprofit corporation formed in 1978 for the purpose of assisting individuals in becoming effective managers of their own assets through programs of education, information and research.”
Printed in the U.S.A.
Portfolio Alerts This MonthJune Portfolio Deletions
Portfolio Stock Total Index TotalAddition Return Since Return Since
Date Price Alert Date Purchase Purchaseno portfolio deletions for June
June Portfolio Additions
Company (Ticker) Latest PriceDividend
Yield Sector: Industryno portfolio additions for June
Company (Ticker)Portfolio Deletion Alert

June 2015 3
AAII DIvIDeND INvesTINg
expected revenues and earnings that the two separate companies will gener-ate. This will allow investors to get a better picture of the dividend policies and payouts of both firms. It has already been revealed that Baxter is targeting a dividend payout of approximately 35% of adjusted net income, while Baxalta is targeting a 15% payout ratio for its shareholders. Once we know more, we will discuss how to evaluate the two companies to determine how they fit into the framework of the DI portfolio and which stock should be deleted from the portfolio. Alternatively, if neither company captures the investment phi-losophy of the DI portfolio, then both will be deleted from the portfolio.
We will keep you posted on any devel-opments in the coming weeks.
Bond Yields Rising Like It’s 2013
The bond market has recently been showing signs of repeating 2013. Since the yield on the benchmark 10-year Treasury note reached a short-term closing low of 1.85% on April 17, 2015, yields have risen by a cumulative 46 basis points to 2.31% on Thursday, June
4, 2015. (A basis points equals one-hundredth of a percentage point, so 46 basis points equals 0.46%.)
By means of comparison, in 2013 yields rose by 51 basis points between May 2 and June 4, 2013 (1.63% to 2.14%). Yields kept rising in 2013, even-tually closing at 3.03%.
Speculation about a change in mon-etary policy was a contributing factor to the 2013 jump and is a contributing factor to this year’s move. Behind the speculation is economic growth, which is a good thing. As stock investors, we want economic growth to help boost corporate profits and thereby both share prices and dividend payments.
In writing this month’s commentary, we took a look back at the June 2013 DI Monthly. The 2013 jump in bond yields hurt some of our highest-yielding stocks back then, with Wisconsin Energy Corp. (WEC) falling 9.2% and AT&T Inc. (T) losing 6.6%. Though the drops were not repeated last month, Wisconsin Energy and many other utility stocks fell dur-ing the first week of this month (June 2015).
Though the magnitude of the recent jump in bond yields may seem large, it
is important to realize that yields are bouncing from a low absolute level and still remain very low now. Even with the increase, the rates available to corpo-rations issuing new debt remain very low, which means they can still finance expansion for a relatively low price. Plus, not only does the DI portfolio still offer a higher yield than Treasuries do, it also continues to provide for a growing stream of income in the future—some-thing that bonds do not.
DI Portfolio Alerts No changes were made to the DI
portfolio. This is the third consecutive month without any additions or dele-tions being announced.
Though our goal continues to be to limit transactions, a lack of quality candidates meeting our selection cri-teria remains the primary reason as to why we haven’t announced any recent changes. We can find good companies, we can find stocks with attractive divi-dend traits and we can find stocks trad-ing at relatively attractive valuations. Where we are struggling is finding good stocks with attractive dividend traits that are trading at discounts relative to
DI Pur- Latest Maychase Price Gain/ Div
Ticker Company Date Price Price (6/2/15) (Loss) Stock Index Yield IndustryAFL AFLAC Incorporated 12/31/11 $43.26 $45.04 $62.26 (1.3%) 51.4% 77.4% 2.5% Insurance (Accident & Health)AAPL Apple Inc. 4/4/14 $75.97 $75.26 $129.96 4.1% 76.7% 10.3% 1.6% Communications EquipmentT AT&T Inc. 12/31/11 $30.24 $30.48 $34.36 (0.3%) 35.7% 77.4% 5.5% Communications ServicesBAX Baxter International 9/6/13 $70.01 $71.34 $66.37 (3.1%) (0.4%) 29.0% 3.1% Medical Equipment & SuppliesCAT Caterpillar Inc. 11/7/14 $101.76 $102.36 $86.17 (1.8%) (14.4%) 5.0% 3.2% Construction & Agricultural MachineryCVX Chevron Corporation 12/31/11 $106.40 $110.91 $102.58 (7.3%) 1.4% 77.4% 4.2% Oil & Gas - IntegratedCMI Cummins Inc. 10/3/14 $135.10 $136.18 $135.76 (2.0%) 1.4% 9.2% 2.3% Misc. Capital GoodsDE Deere & Company 2/7/14 $86.56 $87.59 $92.75 3.5% 9.5% 18.5% 2.6% Construction & Agricul MachineryEMN Eastman Chemical Co. 2/6/15 $73.20 $74.67 $76.95 0.7% 3.6% 2.4% 2.1% Chemical ManufacturingETN Eaton Corporation 12/31/11 $43.53 $45.52 $72.35 4.2% 75.8% 77.4% 3.0% Electronic Instruments & ControlsIP International Paper Co. 4/4/14 $45.81 $45.69 $51.17 (3.5%) 16.2% 10.3% 3.1% Paper & Paper ProductsIVZ Invesco Ltd. 6/6/14 $38.18 $37.82 $39.86 (3.8%) 8.4% 10.2% 2.7% Investment ServicesMCD McDonald's Corp. 12/31/11 $100.33 $99.19 $96.29 (0.6%) 12.5% 77.4% 3.5% RestaurantsMSFT Microsoft Corp. 12/31/11 $25.96 $26.94 $46.92 (3.7%) 92.1% 77.4% 2.6% Software & ProgrammingOMC Omnicom Group Inc. 6/7/13 $63.93 $63.33 $74.61 (1.6%) 27.8% 26.3% 2.7% AdvertisingOXY Occidental Petroleum 1/9/15 $77.54 $75.96 $79.44 (2.4%) 5.6% 2.4% 3.8% Oil & Gas - IntegratedPEP PepsiCo, Inc. 12/31/11 $66.35 $66.66 $96.05 1.4% 55.1% 77.4% 2.9% Beverages (Non-Alcoholic)PG Procter & Gamble Co. 12/7/12 $70.29 $70.89 $78.54 (1.4%) 19.7% 55.3% 3.4% Personal & Household ProductsQCOM Qualcomm, Inc. 3/6/15 $71.51 $72.60 $69.35 2.5% (4.5%) 2.4% 2.8% SemiconductorsTGT Target Corporation 12/31/11 $51.22 $51.28 $80.00 0.6% 70.9% 77.4% 2.6% Retail (Department & Discount)TXN Texas Instruments 4/5/13 $34.20 $34.80 $55.25 3.2% 68.8% 40.6% 2.5% SemiconductorsTUP Tupperware Brands 11/8/13 $86.51 $86.94 $65.88 (1.7%) (20.0%) 22.4% 4.1% Personal & Household ProductsWFC Wells Fargo & Co. 12/7/12 $33.23 $33.40 $56.18 1.6% 80.3% 55.3% 2.7% Regional BanksWEC Wisconsin Energy Corp. 12/31/11 $34.96 $34.68 $47.45 (1.7%) 54.1% 77.4% 3.6% Electric UtilitiesData as of 6/2/2015. Sources: AAII Stock Investor Pro, Thomson Reuters, I/B/E/S and company releases.
Portfolio AlertTotal Return
Since Purchase
Portfolio Holdings
4 June 2015
$80,0001/3/2012 7/3/2012 1/3/2013 7/3/2013 1/3/2014 7/3/2014 1/3/2015
$90,000
$100,000
$110,000
$120,000
$130,000
$140,000
$150,000
$160,000
$170,000
$180,000Growth of $100,000
AAII Dividend Investing Portfolio
Performance
Dividend Yield 2.9% 1.7%
Total Return
Income Return
Capital Gain/(Loss)
Total Return
Income Return
Capital Gain/(Loss)
May (0.2%) 0.3% (0.5%) 1.4% 0.0% 1.4%2015 YTD 1.6% 1.2% 0.4% 3.3% 0.4% 2.9%2014 12.2% 3.0% 9.2% 12.9% 2.0% 10.9%2013 36.5% 3.6% 32.9% 32.6% 2.3% 30.3%2012* 10.2% 3.5% 6.7% 14.3% 2.2% 12.1%From Inception 71.4% 16.0% 55.4% 76.8% 10.1% 66.7%Performance as of 6/3/2015
Dividend Investing Portfolio Dow Jones U.S. Index (IYY)
Dividend Investing Portfolio* Dow Jones U.S. Index (IYY)
*The AAII Dividend Investing portfolio started on January 3, 2012. The portfolio is run as if managed by a subscriber and includes delays in reaction time to portfolio alerts, actual commissions and bid-ask spreads.
AAII Dividend Investing Portfolio
Performance of DI Portfolio
their five-year average valuations. It’s a story we’ve been repeating for
months, but it also is reflective of the ongoing market environment. Though there has been back and forth move-ment in stock prices, the major U.S. stock indexes continue to trade near their all-time record highs. Add in six years of a bull market run on top of that and valuations are no longer cheap on a relative basis for many stocks.
So, we wait, kicking tires while looking for the next good candidate. We’re confident that we will find one
without sacrificing our investment rules and principles. The timing is just a bit uncertain.
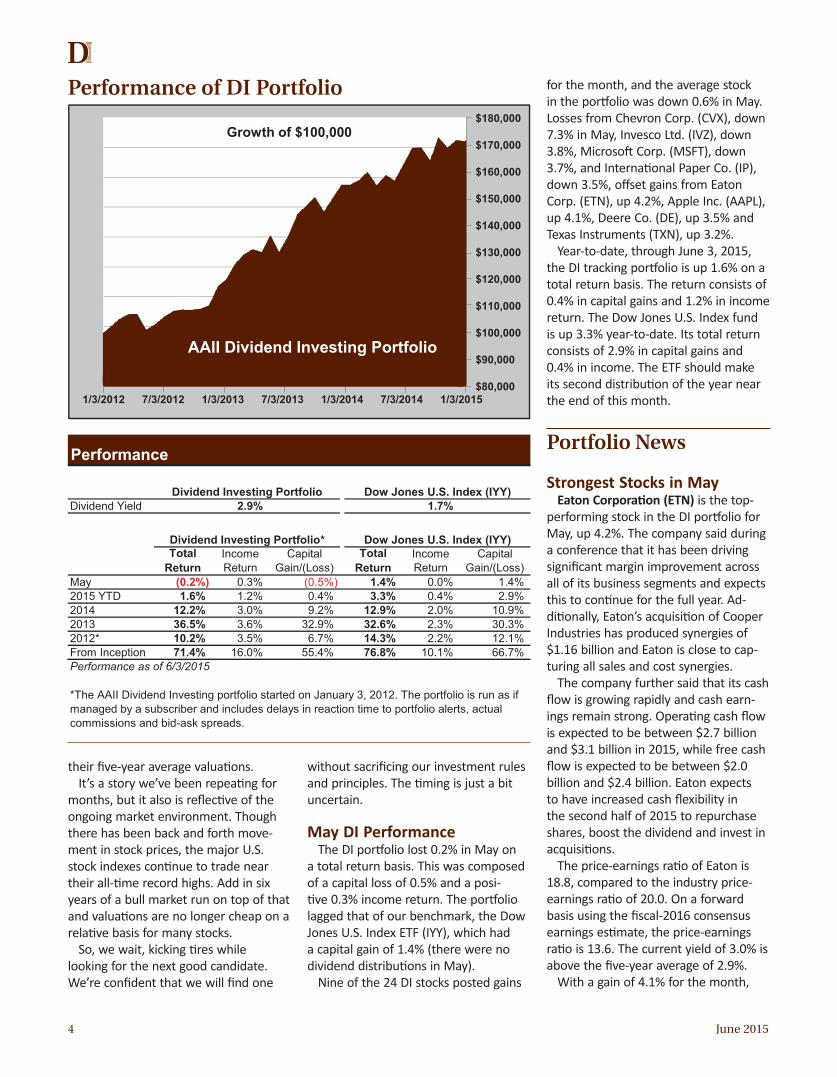
May DI PerformanceThe DI portfolio lost 0.2% in May on
a total return basis. This was composed of a capital loss of 0.5% and a posi-tive 0.3% income return. The portfolio lagged that of our benchmark, the Dow Jones U.S. Index ETF (IYY), which had a capital gain of 1.4% (there were no dividend distributions in May).
Nine of the 24 DI stocks posted gains
for the month, and the average stock in the portfolio was down 0.6% in May. Losses from Chevron Corp. (CVX), down 7.3% in May, Invesco Ltd. (IVZ), down 3.8%, Microsoft Corp. (MSFT), down 3.7%, and International Paper Co. (IP), down 3.5%, offset gains from Eaton Corp. (ETN), up 4.2%, Apple Inc. (AAPL), up 4.1%, Deere Co. (DE), up 3.5% and Texas Instruments (TXN), up 3.2%.
Year-to-date, through June 3, 2015, the DI tracking portfolio is up 1.6% on a total return basis. The return consists of 0.4% in capital gains and 1.2% in income return. The Dow Jones U.S. Index fund is up 3.3% year-to-date. Its total return consists of 2.9% in capital gains and 0.4% in income. The ETF should make its second distribution of the year near the end of this month.
Portfolio News
Strongest Stocks in MayEaton Corporation (ETN) is the top-
performing stock in the DI portfolio for May, up 4.2%. The company said during a conference that it has been driving significant margin improvement across all of its business segments and expects this to continue for the full year. Ad-ditionally, Eaton’s acquisition of Cooper Industries has produced synergies of $1.16 billion and Eaton is close to cap-turing all sales and cost synergies.
The company further said that its cash flow is growing rapidly and cash earn-ings remain strong. Operating cash flow is expected to be between $2.7 billion and $3.1 billion in 2015, while free cash flow is expected to be between $2.0 billion and $2.4 billion. Eaton expects to have increased cash flexibility in the second half of 2015 to repurchase shares, boost the dividend and invest in acquisitions.
The price-earnings ratio of Eaton is 18.8, compared to the industry price-earnings ratio of 20.0. On a forward basis using the fiscal-2016 consensus earnings estimate, the price-earnings ratio is 13.6. The current yield of 3.0% is above the five-year average of 2.9%.
With a gain of 4.1% for the month,

June 2015 5
AAII DIvIDeND INvesTINg
Apple Inc. (AAPL) is the second-best-performing DI stock in May. While speculation at its World Wide Develop-er’s Conference in June regarding Apple Watch sales and a possible Apple cable TV package being launched swirled around the company, there was little actual news to cite for May.
The company continued to benefit from the tailwind offered by its strong earnings report in April as analysts raised earnings estimates. The current estimate for the June quarter of 2015 is now $1.74 per share, compared to $1.73 per share a month ago, due to four upward revisions. Fiscal-2015 estimates have increased from $8.96 per share to $9.01 per share, while fiscal-2016 estimates have risen from $9.63 per share to $9.69 per share in the last month. There have been nine upward revisions to the fiscal-2015 con-sensus estimate, while there has been one downward revision.
Deere & Company (DE) is the third-strongest performer in the DI portfolio for May, adding 3.5%. Shares moved higher after Deere raised its profit forecast following its earnings release on May 22, 2015. Deere significantly beat the consensus estimate by 31%, though it did fall short of revenue estimates. The company also declared a dividend of $0.60 per share, which was unchanged from the prior quarter.
I/B/E/S consensus earnings estimates for the June quarter have risen from $1.38 per share to $1.43 per share in the last month. Full-year 2015 earnings estimates have climbed from $5.32 per share to $5.66 per share. There have been 20 upward revisions to the fis-cal-2015 consensus estimate in the last month.
Deere’s current yield is 2.6%, which is above its five-year average of 2.1%. The company’s price-earnings ratio is 12.9, which is well below the price-earnings ratio for the industry of 19.2.
With its 3.2% gain, Texas Instruments (TXN) is the fourth-best-performing stock in the DI portfolio for May. There was no company-specific news to account for the share price move. The industry however, saw merger
announcements between Broadcom (BRCM) and Avago (AVGO) as well as In-tel’s (INTC) acquisition of Altera (ALTR), which helped to push chip sector share prices higher. The Dow Jones U.S. Semi-conductors Index gained 8.8% in May.
Texas Instruments’ yield of 2.5% is above its five-year average of 2.3%. The price-earnings ratio for Texas Instru-ments is 20.0, compared to 25.9 for the industry.
Weakest Stocks in MayChevron Corporation (CVX) was the
weakest performer in the DI portfolio, down 7.3% in May. The company shut down its Wafra oil fields near the bor-der between Kuwait and Saudi Arabia. This was a loss of 250,000 barrels of oil a day. Kuwait further said the shut-down may become permanent after a two-week stop for maintenance. In discussing the shutdown, Chevron cited difficulties in securing work permits and materials. Chevron had planned to in-vest as much as $40 billion in the Wafra project, as it is the only international company with a concession to produce oil in either Saudi Arabia or Kuwait.
Goldman Sachs oil analysts identi-fied Chevron as a sell candidate due to the fact that it is burning through free cash flow and is likely to limit dividend growth in the coming quarters. The ana-lysts also said that 2017 oil production guidance is now at risk. Other analysts have also pointed out that even at $70 per barrel in 2017, which is Chevron’s current assumption, the company will not be cash flow neutral.
The company also reported news that several facilities in development, such as Big Foot and Wheatstone, are now facing delays.
I/B/E/S consensus earnings estimates for the June quarter have increased from $0.80 per share to $0.99 per share in the last month. Fiscal-2015 earnings estimates have climbed from $3.85 per share to $4.03 per share over the last month.
Invesco Ltd. (IVZ) shares fell 3.8% in May, making it the second-weakest performer in the portfolio. There was no company-specific news driving share performance in May, although mixed investment performance could have af-fected investment flows.
I/B/E/S consensus earnings estimates have declined marginally for the June quarter, with five downward revisions in the last month. Earnings estimates for fiscal 2015, though, have climbed from $2.65 per share to $2.66 per share on six upward revisions over the last month.
Invesco’s current price-earnings ratio is 16.3, which is less than that of its industry of 19.1. The yield is 2.7%, com-pared to the five-year average of 2.5%.
Microsoft Corp. (MSFT) is the third-worst performer in the DI portfolio, los-ing 3.7% for May. Shares sold off early in the month after Bloomberg reported that Microsoft was “weighing” a bid for Salesforce.com (CRM). Later rumors indicated that Microsoft had offered $55 billion to acquire Salesforce but that Salesforce was looking for $70 billion, which Microsoft passed on.
Microsoft also noted in its 10-Q (quarterly) filing that the goodwill on its books from the Nokia acquisition is be-ing revalued and is subject to an impair-ment. Any impairment would be a hit to net income and shareholder’s equity on the company’s financial statements.
The company’s consensus earnings
Recent earnings AnnouncementsDate Reported Expected Surprise
Ticker Company Reported Earnings Earnings %CVX Chevron Corporation May 1 $1.370 $0.788 73.9%DE Deere & Company May 22 $2.030 $1.550 31.0%OXY Occidental Petroleum May 6 $0.040 $0.040 0.0%TGT Target Corporation May 20 $1.100 $1.032 6.6%WEC Wisconsin Energy Corp. May 5 $0.900 $0.826 9.0%Data as of 6/2/2015. Sources: I/B/E/S and company releases.

6 June 2015
Months Ann'lDividend Ex-Dividend Date Ind Div Direct DRIP
Ticker Company Paid Date Payable Div Yield Invest PlanAFL AFLAC Incorporated 3, 6, 9, 12 Mon May 18, 2015 Mon Jun 1, 2015 $0.3900 $1.56 2.5% Yes YesAAPL Apple Inc. 2, 5, 8, 11 Thu May 7, 2015 Thu May 14, 2015 $0.5200 � $2.08 1.6% -- --T AT&T Inc. 2, 5, 8, 11 Wed Apr 8, 2015 Fri May 1, 2015 $0.4700 $1.88 5.5% Yes YesBAX Baxter International 1, 4, 7, 10 Thu May 28, 2015 Wed Jul 1, 2015 $0.5200 $2.08 3.1% Yes YesCAT Caterpillar Inc. 2, 5, 8, 11 Thu Apr 16, 2015 Wed May 20, 2015 $0.7000 $2.80 3.2% Yes YesCVX Chevron Corporation 3, 6, 9, 12 Fri May 15, 2015 Wed Jun 10, 2015 $1.0700 $4.28 4.2% Yes YesCMI Cummins Inc. 2, 5, 7, 10 Tue May 19, 2015 Mon Jun 1, 2015 $0.7800 $3.12 2.3% Yes YesDE Deere & Company 2, 5, 8, 11 Fri Jun 26, 2015 Mon Aug 3, 2015 $0.6000 $2.40 2.6% Yes YesEMN Eastman Chemical Co. 1, 4, 7, 10 Thu Jun 11, 2015 Wed Jul 1, 2015 $0.4000 $1.60 2.1% Yes YesETN Eaton Corporation 3, 5, 8, 11 Thu Apr 30, 2015 Fri May 22, 2015 $0.5500 $2.20 3.0% Yes YesIP International Paper Co. 3, 6, 9, 12 Thu May 21, 2015 Mon Jun 15, 2015 $0.4000 $1.60 3.1% Yes YesIVZ Invesco Ltd. 3, 6, 9, 12 Wed May 13, 2015 Fri Jun 5, 2015 $0.2700 � $1.08 2.7% Yes YesMCD McDonald's Corp. 3, 6, 9, 12 Thu May 28, 2015 Mon Jun 15, 2015 $0.8500 $3.40 3.5% Yes YesMSFT Microsoft Corp. 3, 6, 9, 12 Tue May 19, 2015 Thu Jun 11, 2015 $0.3100 $1.24 2.6% Yes YesOMC Omnicom Group Inc. 1, 4, 7, 10 Wed Jun 10, 2015 Fri Jul 10, 2015 $0.5000 $2.00 2.7% Yes YesOXY Occidental Petroleum 1, 4, 7, 10 Mon Jun 8, 2015 Wed Jul 15, 2015 $0.7500 � $3.00 3.8% -- YesPEP PepsiCo, Inc. 1, 3, 6, 9 Wed Jun 3, 2015 Tue Jun 30, 2015 $0.7025 � $2.81 2.9% Yes YesPG Procter & Gamble Co. 2, 5, 8, 11 Thu Apr 23, 2015 Fri May 15, 2015 $0.6629 � $2.65 3.4% Yes YesQCOM Qualcomm, Inc. 3, 6, 9, 12 Mon Jun 1, 2015 Wed Jun 24, 2015 $0.4800 � $1.92 2.8% Yes YesTGT Target Corporation 3, 6, 9, 12 Mon May 18, 2015 Wed Jun 10, 2015 $0.5200 $2.08 2.6% Yes YesTXN Texas Instruments 2, 5, 8, 11 Tue Apr 28, 2015 Mon May 18, 2015 $0.3400 $1.36 2.5% Yes YesTUP Tupperware Brands 1, 4, 7, 10 Tue Jun 16, 2015 Mon Jul 6, 2015 $0.6800 $2.72 4.1% -- --WFC Wells Fargo & Co. 3, 6, 9, 12 Wed May 6, 2015 Mon Jun 1, 2015 $0.3750 � $1.50 2.7% Yes YesWEC Wisconsin Energy Corp. 3, 6, 9, 12 Tue May 12, 2015 Mon Jun 1, 2015 $0.4225 $1.69 3.6% Yes Yes
� Quarterly dividend increased from prior quarter. Bold dates indicate dividend actions during this month.� Quarterly dividend decreased from prior quarter. Sources: AAII Stock Investor Pro, Thomson Reuters, I/B/E/S and company releases.
Data as of 6/2/2015.
Quarterly Dividend PaymentPaymentAmount
Dividend Payments
estimates have declined marginally for the June quarter as analysts have trimmed estimates in the last month. Earnings estimates for full-year 2015, though, have declined from $2.43 per share to $2.42 per share.
Microsoft’s current price-earnings ratio is 19.5, which is less than that of its industry at 34.1. The yield is 2.6%, slightly above its five-year average of 2.5%.
International Paper (IP) was also among the worst performers for May, losing 3.5%. The company’s stock price fell early in May after a new tax rule proposed by the Internal Revenue Service (IRS) stated that packaging companies should not be allowed to separate their containerboard opera-tions into tax-advantaged vehicles. The rules include a narrow definition of the timber-related activities that can be housed inside a master limited partner-ship, which doesn’t pay corporate-level
taxes in the U.S. Some shareholders were hoping International Paper would turn into a master limited partnership (MLP). One of the benefits of MLPs is the tax benefits associated with the structure. CEO Mark Sutton commented on the proposed IRS rules, “While we had not made any determination to proceed with the formation of an MLP, the IRS proposed regulations appear to take this option off the table.”
subscriber Question:
Q: Do you plan to include interna-tional stocks in your Dividend Investing “universe”?
A: We purposely exclude foreign companies from the DI portfolio for tax reasons. Dividends paid by U.S. corpora-tions qualify for the reduced tax rate of 15% (20% for high earners). Though
some countries do have tax treaties with the United States, we find it simpler to focus on U.S. companies. Doing so avoids having to determine what the tax treaty is as well as deal with any compli-cations involving foreign withholdings.
An exception to this rule may be made on a case-by-case basis, particularly in cases where a current holding merges with a foreign company or otherwise moves its headquarters. Eaton Corp. (ETN), which changed its incorporation from the United States to Ireland follow-ing the acquisition of Cooper Industries in 2012, is an example.
We’ll add that we also strive to keep the DI portfolio tax-friendly. This portfo-lio management choice means interna-tional companies, real estate investment trusts (REITs), master limited partner-ships (MLPs) and business development corporations (BDCs) are excluded from consideration as candidates from our portfolio. ▪
June 2015 7
AAII DIvIDeND INvesTINg
Ann’l Ind Div: The total dollar amount of cash dividends forecast to be paid over the next 12 months.Consecutive Years Div Raised: The number of current years the company has continuously increased the annual dollar amount of the dividend.Date Payable: The date a company will distribute (or has distributed) the most recent quarterly dividend.DI Purchase Price: The average cost basis per share of the stocks purchased for the real DI tracking portfolio. The average cost basis includes any commissions incurred for the purchase and is adjusted for stock splits and spin-offs, if appropriate.Direct Invest: Denotes companies that offer a direct investment program, which allows investors to buy their initial shares directly from a company, without having to go through a broker. Div Growth Rate (5 Yr): The compound annual percentage change in dividends per share over the past five years. Positive numbers show an increase in the dollar amount of dividends paid.Div Yield (or Current Dividend Yield): Projected dividend payments for the next 12 months divided by the current stock price. This number shows, in percentage form, how much income can be expected relative to the current stock price. Dividend Yield—1 Year Ago: The stock’s dividend yield (dividends divided by price) from
one year ago. 5 Year Average: The stock’s average dividend yield over the past five years.DRIP Plan: Denotes companies that offer a dividend reinvestment plan, which allows shareholders to use cash dividends to acquire additional shares of stocks, including partial amounts. Est EPS Growth Rate (3-5 Yr): The forecast annual growth rate in earnings per share for the next three to five years.Ex-Dividend Date: The date used by the exchanges to determine who owns shares of a company. This is two trading days before the record date. Investors must purchase shares prior to the ex-dividend date to receive the dividend.First Year Dividend Paid: The first year a company paid its dividend. If a dividend was suspended, the date is the first year the dividend was reinstated.Liab to Assets: Total liabilities divided by total assets. A measure of balance sheet strength, lower percentages signal a lower proportionate amount of debt.Market Cap (Mil): A measure of company size, this is the current share price multiplied by the number of shares outstanding, expressed in millions of dollars.Months Dividends Paid: The calendar months the company has typically paid dividends to shareholders (1 = January, 2 = February, 3 = March, etc.).
Est Consec- PayoutEPS Div First utive Ratio:
P/E Growth Growth Year Years FCFPS Liab MarketRatio 1 Yr 5 Yr Rate Rate Div Div 12 5 Yr (12 to Cap
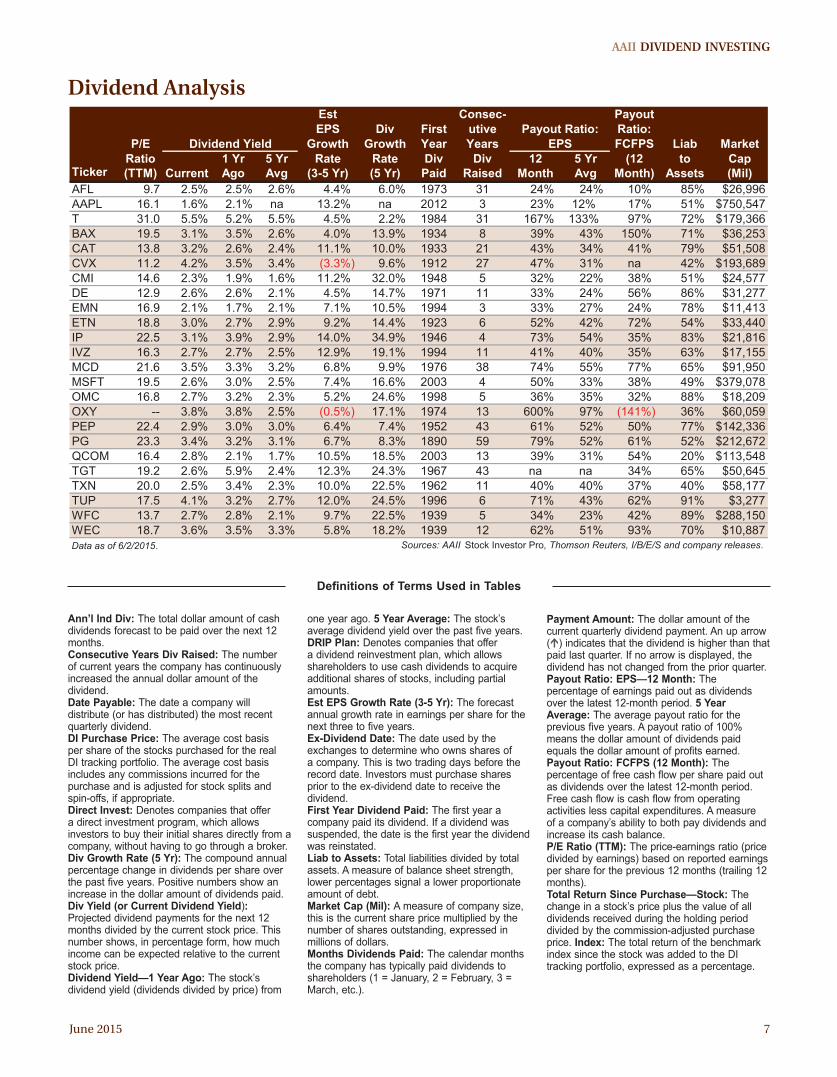
Ticker (TTM) Current Ago Avg (3-5 Yr) (5 Yr) Paid Raised Month Avg Month) Assets (Mil)AFL 9.7 2.5% 2.5% 2.6% 4.4% 6.0% 1973 31 24% 24% 10% 85% $26,996AAPL 16.1 1.6% 2.1% na 13.2% na 2012 3 23% 12% 17% 51% $750,547T 31.0 5.5% 5.2% 5.5% 4.5% 2.2% 1984 31 167% 133% 97% 72% $179,366BAX 19.5 3.1% 3.5% 2.6% 4.0% 13.9% 1934 8 39% 43% 150% 71% $36,253CAT 13.8 3.2% 2.6% 2.4% 11.1% 10.0% 1933 21 43% 34% 41% 79% $51,508CVX 11.2 4.2% 3.5% 3.4% (3.3%) 9.6% 1912 27 47% 31% na 42% $193,689CMI 14.6 2.3% 1.9% 1.6% 11.2% 32.0% 1948 5 32% 22% 38% 51% $24,577DE 12.9 2.6% 2.6% 2.1% 4.5% 14.7% 1971 11 33% 24% 56% 86% $31,277EMN 16.9 2.1% 1.7% 2.1% 7.1% 10.5% 1994 3 33% 27% 24% 78% $11,413ETN 18.8 3.0% 2.7% 2.9% 9.2% 14.4% 1923 6 52% 42% 72% 54% $33,440IP 22.5 3.1% 3.9% 2.9% 14.0% 34.9% 1946 4 73% 54% 35% 83% $21,816IVZ 16.3 2.7% 2.7% 2.5% 12.9% 19.1% 1994 11 41% 40% 35% 63% $17,155MCD 21.6 3.5% 3.3% 3.2% 6.8% 9.9% 1976 38 74% 55% 77% 65% $91,950MSFT 19.5 2.6% 3.0% 2.5% 7.4% 16.6% 2003 4 50% 33% 38% 49% $379,078OMC 16.8 2.7% 3.2% 2.3% 5.2% 24.6% 1998 5 36% 35% 32% 88% $18,209OXY -- 3.8% 3.8% 2.5% (0.5%) 17.1% 1974 13 600% 97% (141%) 36% $60,059PEP 22.4 2.9% 3.0% 3.0% 6.4% 7.4% 1952 43 61% 52% 50% 77% $142,336PG 23.3 3.4% 3.2% 3.1% 6.7% 8.3% 1890 59 79% 52% 61% 52% $212,672QCOM 16.4 2.8% 2.1% 1.7% 10.5% 18.5% 2003 13 39% 31% 54% 20% $113,548TGT 19.2 2.6% 5.9% 2.4% 12.3% 24.3% 1967 43 na na 34% 65% $50,645TXN 20.0 2.5% 3.4% 2.3% 10.0% 22.5% 1962 11 40% 40% 37% 40% $58,177TUP 17.5 4.1% 3.2% 2.7% 12.0% 24.5% 1996 6 71% 43% 62% 91% $3,277WFC 13.7 2.7% 2.8% 2.1% 9.7% 22.5% 1939 5 34% 23% 42% 89% $288,150WEC 18.7 3.6% 3.5% 3.3% 5.8% 18.2% 1939 12 62% 51% 93% 70% $10,887Data as of 6/2/2015. Sources: AAII Stock Investor Pro, Thomson Reuters, I/B/E/S and company releases.
Payout Ratio:Dividend Yield EPS
Dividend Analysis
Definitions of Terms Used in Tables
Payment Amount: The dollar amount of the current quarterly dividend payment. An up arrow () indicates that the dividend is higher than that paid last quarter. If no arrow is displayed, the dividend has not changed from the prior quarter.Payout Ratio: EPS—12 Month: The percentage of earnings paid out as dividends over the latest 12-month period. 5 Year Average: The average payout ratio for the previous five years. A payout ratio of 100% means the dollar amount of dividends paid equals the dollar amount of profits earned.Payout Ratio: FCFPS (12 Month): The percentage of free cash flow per share paid out as dividends over the latest 12-month period. Free cash flow is cash flow from operating activities less capital expenditures. A measure of a company’s ability to both pay dividends and increase its cash balance.P/E Ratio (TTM): The price-earnings ratio (price divided by earnings) based on reported earnings per share for the previous 12 months (trailing 12 months). Total Return Since Purchase—Stock: The change in a stock’s price plus the value of all dividends received during the holding period divided by the commission-adjusted purchase price. Index: The total return of the benchmark index since the stock was added to the DI tracking portfolio, expressed as a percentage.
8 June 2015
Caterpillar Inc. is best known for its big yellow tractors and CAT logo. The company operates in five segments: energy and transportation (38% of first-quarter 2015 revenue), construc-tion industries (37%), resource industries (15%), financial products (6%) and other (5%). The energy and transportation segment serves electric power, industrial, petroleum, marine application and rail-related markets. Construction offers a full line of machinery and parts in the heavy and general con-struction, mining and quarry, and aggregates markets. The resource industries segment provides machinery and electric control systems in mine and quarry applications, forestry, paving, tunneling, industrial and waste. The financial products segment provides equipment financing to Caterpillar dealers and customers. The company has products in nearly every country in the world, with more than half the company’s revenues realized outside of North America.
Caterpillar has grown throughout the years through both organic expansion and acquisitions. Notably, CAT acquired Bucyrus International in 2011, a manufacturer of min-ing equipment for the surface and underground mining industries.
Why Own CAT?Caterpillar has become either the first- or second-largest
manufacturer of every product it produces, with a strong dealer network and commitment to innovation. Caterpillar’s products are distributed worldwide through its extensive dealer network, which has proved to be a significant competi-tive advantage.
Sales have expanded on average at an 11.2% annual rate over the last five years, while net income has expanded at a 32.8% annualized growth rate and diluted earnings per share from continuing operations expanded at a 32.7% annual-ized growth rate over the same period. Caterpillar raised its fiscal-year 2015 earnings guidance from $4.75 per share to
$5.00 per share (excluding restructuring costs). Analysts are expecting earnings of $4.98 per share in 2015 and a three- to five-year average annual growth rate in earnings of 11.1%.
Caterpillar has an attractive valuation, with a current price-earnings ratio of 13.8. This is below its five-year average of 14.8 and the 19.2 median of the construction and agricultural machinery industry.
Dividend AnalysisCaterpillar has a history of returning excess cash to its
shareholders in the form of dividends and share buybacks. The company has paid a dividend every year since 1933 and increased its annual payout for 21 consecutive years. Its latest increase was announced on June 11, 2014, when the quar-terly dividend payment went up 16.7%, to $0.70 per share. The dividend has grown at a 14.1% annual rate over the last three years, and we expect Caterpillar to continue increasing its dividend going forward.
Caterpillar currently trades with a 3.2% dividend yield, above its five-year average of 2.4%. The current earnings pay-out ratio of 42.5% is above the five-year average of 34.5%.
The company generates strong cash flows, with $7.43 billion in operating cash flow, while spending $3.47 billion on capital expenditures. Its free-cash-flow payout ratio is 41.2%, and the strong cash flow has enabled the company to consistently repurchase shares, including 400 million shares in the first quarter of 2015.
RisksCaterpillar operates in a variety of highly competitive global
and regional markets. The company competes worldwide with a number of other manufacturers and distributors of similar products. Aggressive pricing by competitors, unantici-pated product and manufacturing delays and weak demand could all negatively impact Caterpillar.
Despite tepid global economic growth forecasts, significant risks and uncertainties remain that could hurt the company’s growth in 2016. Political conflicts and social unrests continue to disrupt economic activity, particularly in the Common-wealth of Independent States (CIS), Africa and the Middle East. The Chinese government’s push for structural reform is also slowing that country’s growth.
In the first quarter of 2015, the only two segments that saw positive operating profit were construction industries and energy and transportation (the two largest segments as well). Caterpillar expects headwinds related to its oil applications.
Caterpillar is expecting profits in each of the remaining quarters in 2015 to be lower than the first quarter. Analysts are anticipating full-year 2016 earnings to decline 4.6%, com-pared to full-year 2015 estimates.
Caterpillar’s ratio of liabilities to assets stands at 79.4%, below its five-year average of 80.6%, but above the industry median of 57.9%. ▪
Caterpillar Inc. (CAT)
Bullish Factors• Growing earnings, with analysts projecting three-to-five
year earnings per share growth of 11%• Current price-earnings ratio below historical average and
industry and sector medians• Company generates strong cash flows and is aggressive
at repurchasing shares
Bearish Factors• Significant risks and uncertainties remain regarding global
economic growth that could temper growth in 2016• Political unrest in the CIS, Africa and the Middle East has
continued to disrupt economic activity• Weak demand in mining equipment and headwinds
regarding the mining industry

June 2015 9
AAII DIvIDeND INvesTINg
CAT $86.17 ($111.46 - $78.19)
Addition Alert Date: 11/7/2014Price at Alert: $101.76 Risk Index: 2.08Market Cap (Million): $51,507.7Avg Daily Dollar Volume (Million): $484.3Primary Sector: Capital GoodsPrimary Industry: Construction & Agricultural Machinery
Indicated Annual Dividend: $2.80 Multiples Current 12/2014 12/2013 12/2012 12/2011 12/2010Latest Dividend Increase: (Date) Dividend Yield (%): Avg 3.2 2.7 2.6 2.1 2.0 2.4Latest Dividend Increase: (%) 16.7% Dividend Yield (%): High 3.1 2.9 2.6 2.7 3.4Dividend Yield: Current 3.2% Dividend Yield (%): Low 2.4 2.3 1.7 1.6 1.8Dividend Yield: 5-Year Avg (High-Low) Price/Earnings 13.8 16.8 15.6 11.5 12.4 17.5Dividend Paid Since: 1933 Price/Earnings (Industry) 19.2 20.6 16.4 16.0 15.5 18.4Number of Years of Div Increases: 21 Price/Book Value 3.0 3.6 2.8 3.6 4.6 4.2Direct Invest Option: Yes Price/Sales 0.9 1.1 1.0 1.0 1.0 1.1DRIP Plan: Yes Ratios Current 12/2014 12/2013 12/2012 12/2011 12/2010Declared Ex-Div Date Payable Amount Payout Ratio: EPS (%) 42.5 45.1 39.5 23.2 23.8 40.7
$0.7000 Payout Ratio: FCFPS (%) 41.2 35.6 26.1 1,220.6 38.7 45.3$0.7000 Gross Margin (%) 27.2 26.8 25.5 27.4 26.2 26.5$0.7000 Operating Margin (%) 9.8 9.7 10.1 13.0 11.9 9.3$0.7000 Operating Margin (%) (Ind) 10.3 9.7 10.1 10.5 9.8 8.0$0.6000 Net Margin (%) 7.1 6.7 6.8 8.6 8.2 6.3$0.6000 ROE (%) 21.2 19.7 19.8 37.4 41.6 27.6
Rel Strgth ROE (%) (Industry) 12.9 11.8 16.0 17.7 17.3 11.6Rank ROA (%) 4.6 4.4 4.4 6.7 6.8 4.4
4 Week 39% Current Ratio 1.4 1.4 1.4 1.4 1.3 1.413 Week 63% Liabilities to Assets (%) 79.4 80.2 75.5 80.3 84.1 83.126 Week 27% Liab to Assets (%) (Ind) 57.9 54.5 51.6 55.8 58.7 58.052 Week 34% Asset Turnover 0.6 0.7 0.6 0.8 0.8 0.7
Financial Statements TTM 12/2014 12/2013 12/2012 12/2011 12/2010Growth 5 Year Sales ($M) 54,645 55,184 55,656 65,875 60,138 42,588Dividends 10.0% Gross Income ($M) 14,855 14,793 14,201 18,024 15,736 11,307Sales 11.2% Depreciation ($M) -- -- -- -- -- --Net Income 32.8% Unusual/Extra ($M) 0 441 201 676 117 36EPS Basic 32.8% Operating Income ($M) 5,375 5,328 5,627 8,571 7,148 3,960EPS Dil Cont 32.7% Interest Expense ($M) 503 484 465 467 396 343
Pretax Income ($M) 5,296 5,083 5,128 8,236 6,725 3,750SUE Score Net Income ($M) 3,884 3,695 3,789 5,681 4,928 2,700
5.10 Operating Cash Flow ($M) 7,430 8,057 10,191 5,184 6,957 5,009(2.90) Investing Cash Flow ($M) (3,063) (3,627) (5,046) (6,190) (11,427) (1,595)
Annual Financing Cash Flow ($M) (1,967) (2,996) (4,511) 3,606 4,019 (4,613)12/2016 Capital Expenditures ($M) 3,466 3,379 4,446 5,076 3,924 2,586
23 Net Cash Flow ($M) 2,218 1,260 591 2,433 (535) (1,275)$4.75 EPS Basic ($) 6.35 5.99 5.87 8.71 7.64 4.28$4.81 EPS Diluted Cont ($) 6.24 5.88 5.75 8.48 7.40 4.15
# Rev Up 1 EPS DC Year/Year Chg (%) 6.1 2.3 (32.2) 14.6 78.3 190.2 # Rev Down 4 Dividends/Share ($) 2.70 2.70 2.32 2.02 1.82 1.74Three Mos. Ago $5.05 Dividend Year/Year Chg (%) 16.4 16.4 14.9 11.0 4.6 3.6Year/Year Chg (4.6%) Free Cash Flow/Share ($) 6.55 7.58 8.90 0.17 4.70 3.84
3/2015 12/2014 9/2014 6/2014 Total Cash ($M) 7,563 7,341 6,081 5,490 3,057 3,592$1.81 $1.23 $1.63 $1.57 $6.24 Goodwill/Intangibles ($M) 9,383 9,770 10,552 10,958 11,448 3,419$1.44 $1.54 $1.45 $1.45 $5.88 Total Assets ($M) 82,490 84,681 84,896 88,970 81,218 64,020
Long-Term Debt ($M) 26,803 27,784 26,719 27,752 24,944 20,4373/2015 12/2014 9/2014 6/2014 Total Total Liabilities ($M) 65,528 67,935 64,085 71,438 68,335 53,196
$21.00 $23.51 $22.16 $22.59 $89.26 Book Value/Share ($) 28.04 27.13 32.26 26.86 19.97 17.14$21.13 $22.57 $21.00 $22.50 $87.20 Avg Shares Outst'g (M) 605 617 645 653 645 632
Sources: AAII Stock Investor Pro, Thomson Reuters and I/B/E/S. Data as of 6/2/2015.
2.4% (3% - 2%)
May 20, 2015Jan 20, 2015Nov 20, 2014
Est Surprise
Feb 20, 2014Apr 17, 2014Apr 9, 2014
(15%)
Caterpillar Inc. is a manufacturer of construction and mining equipment, diesel and natural gas engines, industrial gas turbines and diesel-electric locomotives. It operates in two segments: machinery and power systems, and financial products. Machinery and power systems represents a total of construction industries, resource industries, power systems and all other segments and related corporate items and eliminations. Financial products include Cat Financial and Caterpillar Insurance Holdings Inc.
Jun 11, 2014 Jul 17, 2014
Rel StrgthDec 11, 2013 Jan 16, 2014
Apr 8, 2015Dec 10, 2014Oct 8, 2014 Oct 16, 2014
Jan 15, 2015Apr 16, 2015
May 20, 2014
Jan 27, 2015
% Surp
Gain
14.1%(2.8%)
TTM16.4%(1.9%)
5.8%
Index
$1.86$1.35
Apr 23, 2015
(7.4%)(7.8%)
0.75
6/2015Quarterly
Stock
1.030.83
0.97(2%)3%
12/2015
3 Year
(18%)
1.4%
6.1%
EPS
Year Ago
TTM
TTMSales/Sh (Qtr)
Year Ago
Current
EPS (Qtr)
0$4.74
(20.1%)
10
$1.41
2
(15.4%)
EPS Estimates# of Estimates
Month Ago
Jun 11, 2014
38.2%(12.9%)Annual
(9.2%)
Aug 20, 2014
20
$4.95$1.26
19$4.98
$1.25
0%
1%
2%
3%
4%
5%
6%
7%
8%
9%
10%
$0
$20
$40
$60
$80
$100
$120
$140
Jun 2010 Jun 2011 Jun 2012 Jun 2013 Jun 2014
Div
iden
d Yi
eld Share Price
10 June 2015
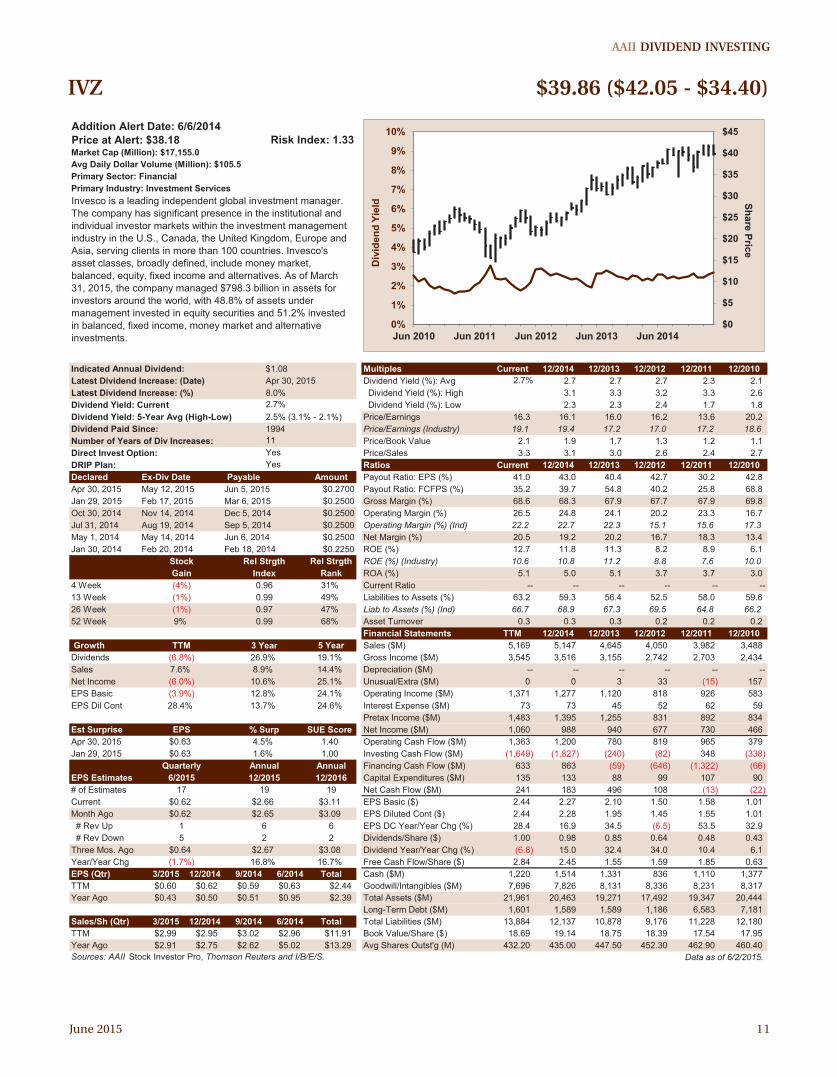
Invesco is a global asset management company. Its products include mutual funds, exchange-traded funds, closed-end funds, separately managed accounts, variable insurance prod-ucts and unit investment trusts. The company serves clients in the U.S. (67% of assets under management, or AUM), Canada (3%), the United Kingdom (13%), Europe (9%) and Asia (8%). Invesco manages money on behalf of both individual inves-tors (68%) and institutional investors (32%).
The company’s individual (“retail”) investor products are pri-marily distributed through third parties, including brokers and advisers, mutual fund platforms, retirement platforms [e.g., a 401(k) plan], banks and insurance and trust companies. Last year, Invesco ranked among the 10 largest non-proprietary fund complexes in the U.S. It also ranked among the 10 larg-est of Canadian fund complexes and is among the market leaders in both the U.K. and China.
Why Own IVZ?Invesco has enjoyed good growth and is forecast to contin-
ue to do so. Earnings per share have risen at a 24.6% annual-ized rate over the past five years, while sales and net income have increased at annualized rates of 14.4% and 25.1%, re-spectively. A widening of the operating margin from 16.7% in 2010 to 26.5% for the most recent trailing 12 months contrib-uted to the comparatively stronger levels of profit growth.
During the first quarter of 2015, adjusted earnings per share rose 5.0% from a year prior, to $0.63 per share. The result topped the I/B/E/S consensus estimate by 4.5%. First-quarter profits were helped by an increase in average AUM from $787.3 billion to $795.4 billion. CEO Martin Flanagan de-scribed the company’s first-quarter net inflows of $1.7 billion as being the highest the company has seen in two years.
Analysts expect Invesco to continue growing. The I/B/E/S
consensus estimate currently projects 16.8% earnings per share growth this year and 16.7% growth next year. Five ana-lysts are forecasting a long-term profit growth rate of 12.9%.
Invesco appears to be well-managed relative to its peers. More than 80% of its actively managed assets rank in the top half of their peer groups on a one-, three- and five-year basis. The 26.5% operating margin compares to an industry median of 22.2%. Similarly, Invesco realizes a higher return on equity than its industry peers.
Like other financial companies, Invesco saw sales fall during the financial crisis. It did, however, manage to stay profitable and paid dividends during 2007 and 2008. It also realized positive levels of operating income and free cash flow during those turbulent years.
Dividend AnalysisShares of Invesco currently yield 2.7%, compared to the
stock’s five-year average of 2.5%. It is a full percentage point above the investment services industry median of 1.6%, how-ever. Though domiciled in Bermuda, Invesco says its dividend will receive the same tax treatment as those paid by U.S. corporations.
The five-year dividend growth rate is 19.1%. At the end of April, the company announced an 8.0% increase in its quar-terly dividend to $0.27 per share. The increase followed an 11.1% increase in 2014 and a 30.4% hike in 2013. Invesco has raised its dividend for 11 consecutive years.
Invesco’s free cash flow payout ratio is 35.2% and its earn-ings payout ratio is 41.0%. Both ratios suggest the company has the financial flexibility to raise its dividend further. The company’s executives have previously listed growing the dividend as a priority for cash flow. During the first-quarter 2015 earnings conference call, Flanagan said he would use unexpected excess cash to “have a rising dividend or stock buybacks” as well as building up the company’s cash balance.
RisksAbout half of the company’s AUM is invested in equity
funds. This ties Invesco’s performance to the state of the stock market. Market corrections or bear markets will likely lead to asset outflows, potentially causing the stock to fall even further than the broad market.
Invesco’s mutual funds have average expenses, and more than two-thirds of them are load funds, according to Morn-ingstar. Though large, Invesco is a second-tier fund company in terms of size relative to industry leaders such as Vanguard, BlackRock and Fidelity.
The past two dividend increases were smaller both in absolute size and percentage change than in 2012 and 2013. There has not been a clear pattern in the size of the dividend increases since the company domiciled in Bermuda in 2007, so it’s difficult to judge what an uncharacteristically small future dividend increase would be. ▪
Invesco Ltd. (IvZ)
Bullish Factors• Earnings growth has been strong and analysts project
double-digit percentage growth into the foreseeable future
• 11 consecutive years of dividend growth, and executives seem intent on continuing to raise the dividend
• The yield is above the stock’s five-year average and is more than a full percentage above the industry median
Bearish Factors• Dependent on the performance of the stock market,
with about half of AUM invested in the company’s equity funds
• The company’s size and the cost structure of its funds are disadvantages against larger competitors with lower-cost offerings
• The size of the dividend increase has decreased for two consecutive years
June 2015 11
AAII DIvIDeND INvesTINg
Addition Alert Date: 6/6/2014Price at Alert: $38.18 Risk Index: 1.33Market Cap (Million): $17,155.0Avg Daily Dollar Volume (Million): $105.5Primary Sector: FinancialPrimary Industry: Investment Services
Indicated Annual Dividend: $1.08 Multiples Current 12/2014 12/2013 12/2012 12/2011 12/2010Latest Dividend Increase: (Date) Dividend Yield (%): Avg 2.7% 2.7 2.7 2.7 2.3 2.1Latest Dividend Increase: (%) 8.0% Dividend Yield (%): High 3.1 3.3 3.2 3.3 2.6Dividend Yield: Current 2.7% Dividend Yield (%): Low 2.3 2.3 2.4 1.7 1.8Dividend Yield: 5-Year Avg (High-Low) Price/Earnings 16.3 16.1 16.0 16.2 13.6 20.2Dividend Paid Since: 1994 Price/Earnings (Industry) 19.1 19.4 17.2 17.0 17.2 18.6Number of Years of Div Increases: 11 Price/Book Value 2.1 1.9 1.7 1.3 1.2 1.1Direct Invest Option: Yes Price/Sales 3.3 3.1 3.0 2.6 2.4 2.7DRIP Plan: Yes Ratios Current 12/2014 12/2013 12/2012 12/2011 12/2010Declared Ex-Div Date Payable Amount Payout Ratio: EPS (%) 41.0 43.0 40.4 42.7 30.2 42.8
$0.2700 Payout Ratio: FCFPS (%) 35.2 39.7 54.8 40.2 25.8 68.8$0.2500 Gross Margin (%) 68.6 68.3 67.9 67.7 67.9 69.8$0.2500 Operating Margin (%) 26.5 24.8 24.1 20.2 23.3 16.7$0.2500 Operating Margin (%) (Ind) 22.2 22.7 22.3 15.1 15.6 17.3$0.2500 Net Margin (%) 20.5 19.2 20.2 16.7 18.3 13.4$0.2250 ROE (%) 12.7 11.8 11.3 8.2 8.9 6.1
Rel Strgth ROE (%) (Industry) 10.6 10.8 11.2 8.8 7.6 10.0Rank ROA (%) 5.1 5.0 5.1 3.7 3.7 3.0
4 Week 31% Current Ratio -- -- -- -- -- --13 Week 49% Liabilities to Assets (%) 63.2 59.3 56.4 52.5 58.0 59.626 Week 47% Liab to Assets (%) (Ind) 66.7 68.9 67.3 69.5 64.8 66.252 Week 68% Asset Turnover 0.3 0.3 0.3 0.2 0.2 0.2
Financial Statements TTM 12/2014 12/2013 12/2012 12/2011 12/2010Growth 5 Year Sales ($M) 5,169 5,147 4,645 4,050 3,982 3,488
Dividends 19.1% Gross Income ($M) 3,545 3,516 3,155 2,742 2,703 2,434Sales 14.4% Depreciation ($M) -- -- -- -- -- --Net Income 25.1% Unusual/Extra ($M) 0 0 3 33 (15) 157EPS Basic 24.1% Operating Income ($M) 1,371 1,277 1,120 818 926 583EPS Dil Cont 24.6% Interest Expense ($M) 73 73 45 52 62 59
Pretax Income ($M) 1,483 1,395 1,255 831 892 834SUE Score Net Income ($M) 1,060 988 940 677 730 466
1.40 Operating Cash Flow ($M) 1,363 1,200 780 819 965 3791.00 Investing Cash Flow ($M) (1,649) (1,827) (240) (82) 348 (338)
Annual Financing Cash Flow ($M) 633 863 (59) (646) (1,322) (66)12/2016 Capital Expenditures ($M) 135 133 88 99 107 90
19 Net Cash Flow ($M) 241 183 496 108 (13) (22)$3.11 EPS Basic ($) 2.44 2.27 2.10 1.50 1.58 1.01$3.09 EPS Diluted Cont ($) 2.44 2.28 1.95 1.45 1.55 1.01
# Rev Up 6 EPS DC Year/Year Chg (%) 28.4 16.9 34.5 (6.5) 53.5 32.9 # Rev Down 2 Dividends/Share ($) 1.00 0.98 0.85 0.64 0.48 0.43Three Mos. Ago $3.08 Dividend Year/Year Chg (%) (6.8) 15.0 32.4 34.0 10.4 6.1Year/Year Chg 16.7% Free Cash Flow/Share ($) 2.84 2.45 1.55 1.59 1.85 0.63
3/2015 12/2014 9/2014 6/2014 Total Cash ($M) 1,220 1,514 1,331 836 1,110 1,377$0.60 $0.62 $0.59 $0.63 $2.44 Goodwill/Intangibles ($M) 7,696 7,826 8,131 8,336 8,231 8,317$0.43 $0.50 $0.51 $0.95 $2.39 Total Assets ($M) 21,961 20,463 19,271 17,492 19,347 20,444
Long-Term Debt ($M) 1,601 1,589 1,589 1,186 6,583 7,1813/2015 12/2014 9/2014 6/2014 Total Total Liabilities ($M) 13,884 12,137 10,878 9,176 11,228 12,180$2.99 $2.95 $3.02 $2.96 $11.91 Book Value/Share ($) 18.69 19.14 18.75 18.39 17.54 17.95$2.91 $2.75 $2.62 $5.02 $13.29 Avg Shares Outst'g (M) 432.20 435.00 447.50 452.30 462.90 460.40
Sources: AAII Stock Investor Pro, Thomson Reuters and I/B/E/S. Data as of 6/2/2015.
12/2015
% Surp4.5%1.6%
13.7%
EPS Estimates
(1.7%)
15
$0.64
Apr 30, 2015
2$2.67
6
AnnualQuarterly
# of EstimatesCurrent
Jan 30, 2014 Feb 20, 2014
6/2015
EPS$0.63$0.63
7.6%
Jan 29, 2015
Year Ago
TTM
TTMSales/Sh (Qtr)
Feb 18, 2014
EPS (Qtr)
$0.62
17
$2.65$0.62
8.9%10.6%12.8%
$2.66
16.8%
Year Ago
Est Surprise
Month Ago
19
Invesco is a leading independent global investment manager. The company has significant presence in the institutional and individual investor markets within the investment management industry in the U.S., Canada, the United Kingdom, Europe and Asia, serving clients in more than 100 countries. Invesco's asset classes, broadly defined, include money market, balanced, equity, fixed income and alternatives. As of March 31, 2015, the company managed $798.3 billion in assets for investors around the world, with 48.8% of assets under management invested in equity securities and 51.2% invested in balanced, fixed income, money market and alternative investments.
Jul 31, 2014
Apr 30, 2015
Apr 30, 2015Jan 29, 2015Oct 30, 2014 Nov 14, 2014
Feb 17, 2015
May 1, 2014
26.9%
2.5% (3.1% - 2.1%)
28.4%
(6.8%)3 Year
Jun 5, 2015Mar 6, 2015Dec 5, 2014
Aug 19, 2014
(4%)
0.99
0.990.97
TTM
Gain
(3.9%)(6.0%)
(1%)(1%)9%
May 12, 2015
Index
Sep 5, 2014
Rel Strgth
Jun 6, 2014
0.96
Stock
May 14, 2014
0%
1%
2%
3%
4%
5%
6%
7%
8%
9%
10%
$0
$5
$10
$15
$20
$25
$30
$35
$40
$45
Jun 2010 Jun 2011 Jun 2012 Jun 2013 Jun 2014
Div
iden
d Yi
eld Share Price
IvZ $39.86 ($42.05 - $34.40)

12 June 2015
McDonald’s Corp. is the largest fast-food company in the world, franchising and operating McDonald’s restaurants. At the end of March 2015, there were 36,290 restaurants in 125 countries. Of these, 29,556 are franchised, licensed or affiliated and the company operates the rest. In 2013, 66.2% of sales came from company-owned stores and 33.8% from franchised, licensed and affiliated restaurants.
McDonald’s restaurants offer a substantially uniform menu, with some geographic variations, that includes hamburgers, Filet-O-Fish, chicken sandwiches, Chicken McNuggets, Snack Wraps, french fries, salads, ice cream drinks and desserts and beverages. In the U.S. and many international markets, a full or limited breakfast menu is also offered.
Starting on July 1, the company will operate under a new organizational structure: U.S. (over 40% of 2014 operating income); international lead markets, which includes established markets such as Australia, Canada, France, Germany and the U.K. (roughly 40%); high-growth markets, which consists of markets with relatively higher restaurant expansion and fran-chising potential such as China, Russia, and South Korea (rough-ly 10%); and foundational markets, which are the remaining markets in the system and also includes corporate activities.
Why Own MCD?Faced with changing consumer tastes and declining same-
store sales, the company promoted Stephen Easterbrook to president and CEO. On May 4, he outlined a turnaround plan for the company that includes a new organization structure; accelerating the pace of re-franchising to include 3,500 stores by the end of 2018 and increasing global franchised stores to 90% from 81%; delivering approximately $300 in net annual SG&A (selling, general and administrative expense) savings, most of which will be realized by the end of 2017; and return-ing $8 billion to $9 billion to shareholders in 2015.
Accelerating its refranchising program will reduce the com-pany’s capital requirements and boost margins and profitabil-ity, while not negatively affecting free cash flow. Its franchisee
and affiliate system provides an annuity-like revenue stream of rent and royalties.
Despite the company’s size, there is still plenty of room for expansion. According to Euromonitor International, McDon-ald’s accounted for almost 4% of the global restaurant indus-try’s sales in 2014, double that of its closest competitor, Yum! Brands (YUM) (KFC, Pizza Hut and Taco Bell).
Consensus earnings estimates suggest an earnings de-cline in fiscal 2015, followed by a rebound of 9.4% in 2016. Analysts polled by I/B/E/S are expecting earnings to grow, on average, by 6.8% over the next three to five years.
While the company is currently trading at a premium to its historical five-year price-earnings ratio (21.6 versus 17.3), looking forward its price-earnings ratio based on 2016 fore-casted earnings of $5.20 is a more reasonable 18.5.
Dividend AnalysisSince its first dividend payment in 1976, the company has
increased it every year. MCD shares currently trade with a 3.5% dividend yield, which is above its five-year average yield of 3.2%. On September 18, 2014, the company announced a 4.9% dividend increase. Over the last three years the dividend has grown by 9.0% on average.
McDonald’s current earnings payout ratio is 74.3%, which is its highest level in seven years. Over the last 12 months, the company paid out 77.5% of free cash flow as dividends. Their high payout ratios and declining earnings in the near term could limit dividend increases. This is reflected in the most recent dividend increase, which was well below the historical dividend growth rate.
McDonald’s has a long history of returning cash to share-holders via share repurchases. The company plans to return $18 billion to $20 billion to shareholders between 2014 and 2016, a 10% to 20% increase over the amount it returned between 2011 and 2013.
RisksMcDonald’s has been facing difficult comparable sales for
the last several quarters, a trend the company expects to con-tinue as it will take time to see if its current initiatives will spur top-line growth. In addition, it has missed consensus earnings estimates for the last two quarters. The company is facing challenges on multiple fronts: a weak global economy, chang-ing consumer tastes and increased competition. It has also had some product and marketing missteps in recent years.
McDonald’s focus on its value menu offerings boosted traf-fic in recent quarters but has narrowed operating margins, hurting earnings.
The company operates in a fiercely competitive market-place. Historical rivals such as Burger King Worldwide (BKW) and Wendy’s Co. (WEN) have been aggressively revamping their menus and lowering prices. Yum! Brands is looking to expand its footprint in prime markets such as Russia, India and Europe. ▪
McDonald’s Corp. (MCD)
Bullish Factors• Maintains leading market position in almost every
country in which it operates• Rising number of franchises should boost margins and
earnings, while lowering capital expenditures• Long history of dividend increases and solid dividend yield
Bearish Factors• Rising operating costs associated with value menu focus,
rising wages worldwide and increasing commodity costs• Fierce competition from historical rivals and new
concept restaurants may hurt sales and margins• Tepid macro environment will pressure margins and
earnings in the short term

June 2015 13
AAII DIvIDeND INvesTINg
MCD $96.29 ($102.62 - $87.62)
Addition Alert Date: 12/31/2011Price at Alert: $100.33 Risk Index: 1.22Market Cap (Million): $91,950.3Avg Daily Dollar Volume (Million): $691.9Primary Sector: ServicesPrimary Industry: Restaurants
Indicated Annual Dividend: $3.40 Multiples Current 12/2014 12/2013 12/2012 12/2011 12/2010Latest Dividend Increase: Date Dividend Yield (%): Avg 3.5% 3.4 3.2 3.1 2.9 3.2Latest Dividend Increase: % 4.9% Dividend Yield (%): High 3.7 3.5 3.4 3.5 3.7Dividend Yield: Current 3.5% Dividend Yield (%): Low 3.2 3.0 2.8 2.5 2.8Dividend Yield: 5-Year Avg (High-Low) Price/Earnings 21.6 19.9 17.4 17.3 16.4 15.5Dividend Paid Since: 1976 Price/Earnings (Industry) 31.4 28.3 25.4 18.8 15.3 16.8Number of Years of Div Increases: 38 Price/Book Value 8.1 7.3 6.0 6.1 6.2 5.2Direct Invest Option: Yes Price/Sales 3.5 3.4 3.4 3.4 3.3 3.1DRIP Plan: Yes Ratios Current 12/2014 12/2013 12/2012 12/2011 12/2010Declared Ex-Div Date Payable Amount Payout Ratio: EPS (%) 74.3 67.6 55.8 53.0 47.5 48.7
$0.8500 Payout Ratio: FCFPS (%) 77.5 77.6 72.5 74.0 59.1 57.3$0.8500 Gross Margin (%) 38.0 38.1 38.8 39.2 39.6 40.0$0.8500 Operating Margin (%) 28.8 29.0 31.2 31.2 31.6 31.0$0.8100 Operating Margin (%) (Ind) 5.8 6.2 5.7 7.2 6.3 6.5$0.8100 Net Margin (%) 16.3 17.3 19.9 19.8 20.4 20.5$0.8100 ROE (%) 32.3 33.0 35.7 36.8 37.9 34.5
Rel Strgth ROE (%) (Industry) 10.4 11.2 10.1 11.3 12.9 12.7Rank ROA (%) 12.4 13.4 15.5 16.0 16.9 15.9
4 Week 41% Current Ratio 1.3 1.5 1.6 1.4 1.3 1.513 Week 43% Liabilities to Assets (%) 64.5 62.5 56.3 56.8 56.4 54.226 Week 48% Liab to Assets (%) (Ind) 59.8 62.8 56.3 56.2 57.4 56.852 Week 44% Asset Turnover 0.8 0.8 0.8 0.8 0.8 0.8
Financial Statements TTM 12/2014 12/2013 12/2012 12/2011 12/2010Growth 5 Year Sales ($M) 26,700 27,441 28,106 27,567 27,006 24,075Dividends 9.9% Gross Income ($M) 10,141 10,456 10,903 10,816 10,687 9,637Sales 3.8% Depreciation ($M) -- -- -- -- -- --Net Income 0.9% Unusual/Extra ($M) (133) (137) (199) (144) (86) (50)EPS Basic 3.1% Operating Income ($M) 7,690 7,949 8,764 8,605 8,530 7,473EPS Dil Cont 3.2% Interest Expense ($M) 582 585 537 533 507 463
Pretax Income ($M) 6,843 7,372 8,205 8,079 8,012 7,000SUE Score Net Income ($M) 4,365 4,758 5,586 5,465 5,503 4,946
(1.20) Operating Cash Flow ($M) 6,523 6,730 7,121 6,966 7,150 6,342(1.80) Investing Cash Flow ($M) (2,046) (2,305) (2,674) (3,167) (2,571) (2,056)
Annual Financing Cash Flow ($M) (4,857) (4,618) (4,043) (3,850) (4,533) (3,729)12/2016 Capital Expenditures ($M) 2,407 2,583 2,825 3,049 2,730 2,136
27 Net Cash Flow ($M) (1,109) (721) 463 0 (51) 591$5.20 EPS Basic ($) 4.47 4.85 5.59 5.41 5.33 4.64$5.16 EPS Diluted Cont ($) 4.45 4.82 5.55 5.36 5.27 4.58
# Rev Up 12 EPS DC Year/Year Chg (%) (19.2) (13.2) 3.5 1.7 15.1 11.4 # Rev Down 6 Dividends/Share ($) 3.32 3.28 3.12 2.87 2.53 2.26Three Mos. Ago $5.35 Dividend Year/Year Chg (%) 5.1 5.1 8.7 13.4 11.9 10.2Year/Year Chg 9.4% Free Cash Flow/Share ($) 4.28 4.23 4.30 3.88 4.28 3.95
3/2015 12/2014 9/2014 6/2014 Total Cash ($M) 1,635 2,078 2,799 2,336 2,336 2,387$0.84 $1.13 $1.09 $1.40 $4.46 Goodwill/Intangibles ($M) 2,594 2,735 2,873 2,804 2,653 2,586$1.21 $1.40 $1.52 $1.38 $5.51 Total Assets ($M) 32,156 34,281 36,626 35,387 32,990 31,975
Long-Term Debt ($M) 14,292 14,990 14,130 13,633 12,134 11,4973/2015 12/2014 9/2014 6/2014 Total Total Liabilities ($M) 20,752 21,428 20,617 20,093 18,600 17,341$6.20 $6.80 $7.14 $7.27 $27.42 Book Value/Share ($) 11.87 13.11 16.04 15.14 13.94 13.73$6.77 $7.15 $7.34 $7.07 $28.34 Avg Shares Outst'g (M) 960.60 980.50 998.40 1,010.10 1,032.10 1,066.00
Sources: AAII Stock Investor Pro, Thomson Reuters and I/B/E/S. Data as of 6/2/2015.
(19.5%)
Sep 18, 2014
9$4.98
8
Annual
2412/2015
% Surp(4.5%)(7.2%)
(2.9%)
Sep 16, 2014
Rel Strgth
Jun 16, 2014Mar 17, 2014
EPS (Qtr)
$1.23
24
$4.77$1.24
(11.6%)
94
$1.29
Month Ago
0.5%(4.7%)(3.1%)
$4.76
(1.3%)
Quarterly
# of EstimatesCurrent
Jan 29, 2014 Feb 27, 2014Stock
6/2015
EPS$1.01$1.13
(5.3%)
Est Surprise
Jan 23, 2015
(19.2%)
EPS Estimates
Year Ago
TTM
TTMSales/Sh (Qtr)
Year Ago
Index
McDonald's Corp. franchises and operates McDonald's restaurants in the global restaurant industry. These restaurants serve a varied, limited, value-priced menu in more than 100 countries around the world. All restaurants are operated either by the company or by franchisees, including conventional franchisees under franchise arrangements and foreign affiliated markets and developmental licensees under license agreements. The company and its franchisees purchase food, packaging, equipment and other goods from various independent suppliers.
Jul 17, 2014
Apr 22, 2015
May 21, 2015Jan 28, 2015Sep 18, 2014 Nov 26, 2014
Feb 26, 2015
May 21, 2014
9.0%
Aug 28, 2014
(2%)(3%)(1%)(5%)
May 29, 2014
(20.9%)
3.2% (3.6% - 2.9%)
5.1%3 Year
Jun 15, 2015Mar 16, 2015Dec 15, 2014
0.98
0.86
0.970.97
TTM
Gain
May 28, 2015
0%
1%
2%
3%
4%
5%
6%
7%
8%
9%
10%
$0
$20
$40
$60
$80
$100
$120
Jun 2010 Jun 2011 Jun 2012 Jun 2013 Jun 2014
Div
iden
d Yi
eld Share Price
14 June 2015
Microsoft Corp. (MsFT)Microsoft is a worldwide leader in software, services and
solutions for individuals and businesses. The company’s products include operating systems for personal computers (PCs), servers, phones and other intelligent devices; server applications for distributed computing environments; produc-tivity applications; business solution applications; desktop and server management tools; software development tools; video games; and online advertising. The company has recently reorganized and now only distinguishes its operations as two distinct segments: devices and consumer, which includes revenues from Windows, Office, Xbox, Surface and phone and related sales; and commercial, which includes server and enterprise products, Microsoft consulting services and other commercial products and related revenues.
Why Own MSFT?Microsoft has been gaining momentum in the cloud, with
another quarter of triple-digit revenue growth, while still protecting its valuable franchises such as Office. This reflects changes the new CEO, Satya Nadella, has been putting in place. Indicative of this new mindset is Microsoft’s attempted purchase of Salesforce.com (CRM) for a rumored $55 billion. The Microsoft under Nadella walked away from a reported asking price of $70 billion rather than overpay for Sales-force. Shares have continued slowly appreciating as investors embrace Nadella’s vision for the company. Offering more of Microsoft’s venerable offerings on competing products is part of his vision.
In addition, as computing becomes more cloud-based, Mi-crosoft’s enterprise services division continues to strengthen. The company’s size and scale offers Microsoft a considerable advantage, with the ability to offer competitive prices on complete enterprise services.
The new CEO has also shown a willingness to adapt to con-sumer demands. Microsoft has quickly developed Windows 10, incorporating negative feedback from Windows 8 users. We believe this adaptability will benefit Microsoft. Windows 10 is set to launch on July 29, 2015.
Microsoft currently trades at a price-earnings ratio of 19.5. Although this is above its five-year average of 13.3, Microsoft is trading at a significant discount compared to the current median price-earnings ratio for the software and program-ming industry of 34.1. Sales have increased at an 8.2% annual rate over the last five years, while net income has expanded at an 8.7% annual growth rate and diluted earnings per share have grown at a 10.2% annual rate. The positive impact of share buybacks is highlighted by earnings per share growth well above net income growth.
Analysts are expecting earnings of $2.42 per share for fiscal 2015 ending in June and $2.78 per share for fiscal 2016.
Dividend AnalysisMicrosoft has a 12-year history of returning excess cash to
its shareholders in the form of dividends and share buybacks. Its dividend yield is currently 2.6%, slightly above its five-year average of 2.5%. Microsoft has increased its dividend aggres-sively over the past few years. Dividends have expanded at a 16.6% annual rate over the last five fiscal years. Its last divi-dend increase was 10.7%, declared on September 16, 2014.
Even with the aggressive dividend hikes, Microsoft has a current earnings payout ratio of 46.8%, and its pre-dividend free-cash-flow payout ratio is 37.6%. The company is also now sitting on about $95 billion in cash and short-term invest-ments, and it continues to generate substantial free cash flow before dividends. This high cash balance coupled with the company’s ability to generate additional cash leads us to believe that Microsoft will continue to aggressively increase dividends and buy back its shares.
RisksMicrosoft is going through firm-wide changes. The company
reorganized its business segments in an effort to act faster to changes in the competitive landscape. These are major changes that take significant management time and energy and may not produce the intended benefits.
Recently, the company said in its 10-Q filing that the good-will from its Nokia purchase is being reviewed to determine if an impairment charge might be necessary. Goodwill on Mi-crosoft’s books from the Nokia transaction totals more than $5 billion, which if written down would hurt net income and shareholder’s equity.
The continued weakness in the PC sector remains an area of concern. First-quarter PC sales growth declined 6.7%, according to market research firm IDC. While the move to mobile computing is an undeniable trend, IDC is forecasting a temporary bump in sales from the launch of Windows 10. Microsoft’s new CEO is attempting to position the company for the new mobile reality, but the company is playing catch-up to Android- and iOS-based systems. While enterprise and server revenue will likely benefit, Microsoft still generates a majority of its revenues from Windows and Office. A decline in use of these two products is an area of concern. ▪
Bullish Factors• Trading at discount relative to its industry, sector and
the market• Financially stable with very strong cash flow• CEO’s changes are paying dividends in the form of
increased growth in key segments
Bearish Factors• Proliferation of mobile devices and cloud computing
means uncertainty for Windows and Office• It is unclear if the path set by new CEO will yield long-
term benefits for investors• A possible impairment charge from Nokia acquisition

June 2015 15
AAII DIvIDeND INvesTINg
Addition Alert Date: 12/31/11Price at Alert: $25.96 Risk Index: 2.47Market Cap (Million): $379,077.5Avg Daily Dollar Volume (Million): $1,821.2Primary Sector: TechnologyPrimary Industry: Software & Programming
Indicated Annual Dividend: $1.24 Multiples Current 6/2014 6/2013 6/2012 6/2011 6/2010Latest Dividend Increase: Date Dividend Yield (%): Avg 2.6 2.6 2.8 2.7 2.4 1.9Latest Dividend Increase: % 10.7% Dividend Yield (%): High 3.2 3.5 3.0 2.7 2.3Dividend Yield: Current 2.6% Dividend Yield (%): Low 2.2 2.4 2.4 2.2 1.6Dividend Yield: 5-Year Avg (High-Low) Price/Earnings 19.5 16.1 12.6 14.8 9.9 12.9Dividend Paid Since: 2003 Price/Earnings (Industry) 34.1 27.8 29.7 24.9 24.1 25.0Number of Years of Div Increases: 4 Price/Book Value 4.2 3.9 3.5 3.8 4.0 5.2Direct Invest Option: Yes Price/Sales 4.0 4.1 3.5 3.4 3.2 3.8DRIP Plan: Yes Ratios Current 6/2014 6/2013 6/2012 6/2011 6/2010Declared Ex-Div Date Payable Amount Payout Ratio: EPS (%) 46.8 42.1 35.2 39.6 23.4 24.4
$0.3100 Payout Ratio: FCFPS (%) 37.6 34.8 31.4 22.9 22.1 20.7$0.3100 Gross Margin (%) 65.0 69.0 74.0 76.2 77.7 80.2$0.3100 Operating Margin (%) 34.9 31.8 34.1 29.5 38.8 38.6$0.2800 Operating Margin (%) (Ind) (2.7) (1.9) 0.0 1.5 2.8 2.9$0.2800 Net Margin (%) 21.1 25.4 28.1 23.0 33.1 30.0$0.2800 ROE (%) 22.1 26.2 30.1 27.5 44.8 43.8
Rel Strgth ROE (%) (Industry) 4.8 5.9 7.6 10.6 10.9 8.5Rank ROA (%) 11.5 14.0 16.6 14.8 23.8 22.9
4 Week 33% Current Ratio 2.9 2.5 2.7 2.6 2.6 2.113 Week 72% Liabilities to Assets (%) 49.0 47.9 44.6 45.3 47.5 46.426 Week 46% Liab to Assets (%) (Ind) 49.4 48.4 49.7 49.2 49.3 47.852 Week 75% Asset Turnover 0.5 0.6 0.6 0.6 0.7 0.8
Financial Statements TTM 6/2014 6/2013 6/2012 6/2011 6/2010Growth 5 Year Sales ($M) 94,782 86,833 77,849 73,723 69,943 62,484
Dividends 16.6% Gross Income ($M) 61,617 59,899 57,600 56,193 54,366 50,089Sales 8.2% Depreciation ($M) -- -- -- -- -- --Net Income 8.7% Unusual/Extra ($M) 6,566 5,054 5,357 10,762 4,222 4,063EPS Basic 10.3% Operating Income ($M) 33,108 27,653 26,556 21,763 27,161 24,098EPS Dil Cont 10.2% Interest Expense ($M) 703 597 429 380 295 151
Pretax Income ($M) 26,840 27,820 27,052 22,267 28,071 25,013SUE Score Net Income ($M) 20,000 22,074 21,863 16,978 23,150 18,760
3.50 Operating Cash Flow ($M) 31,778 32,231 28,833 31,626 26,994 24,073(0.10) Investing Cash Flow ($M) (26,844) (18,833) (23,811) (24,786) (14,616) (11,314)
Annual Financing Cash Flow ($M) (8,818) (8,394) (8,148) (9,408) (8,376) (13,291)6/2016 Capital Expenditures ($M) 5,493 5,485 4,257 2,305 2,355 1,977
33 Net Cash Flow ($M) (4,158) 4,865 (3,134) (2,672) 4,105 (571)$2.78 EPS Basic ($) 2.43 2.66 2.61 2.02 2.73 2.13$2.78 EPS Diluted Cont ($) 2.41 2.63 2.58 2.00 2.69 2.10
# Rev Up 2 EPS DC Year/Year Chg (%) (9.7) 1.9 29.0 (25.7) 28.1 29.6 # Rev Down 2 Dividends/Share ($) 1.21 1.12 0.92 0.80 0.64 0.52Three Mos. Ago $2.90 Dividend Year/Year Chg (%) 13.1 21.7 15.0 25.0 23.1 0.0Year/Year Chg 14.8% Free Cash Flow/Share ($) 3.22 3.22 2.93 3.49 2.90 2.51
3/2015 12/2014 9/2014 6/2014 Total Cash ($M) 95,156 85,465 76,775 63,040 52,772 36,788$0.61 $0.71 $0.54 $0.55 $2.41 Goodwill/Intangibles ($M) 28,691 27,108 17,738 16,622 13,325 13,552$0.68 $0.78 $0.62 $0.59 $2.67 Total Assets ($M) 176,683 172,384 142,431 121,271 108,704 86,113
Long-Term Debt ($M) 27,644 20,645 12,601 10,713 11,921 4,9393/2015 12/2014 9/2014 6/2014 Total Total Liabilities ($M) 86,551 82,600 63,487 54,908 51,621 39,938$2.66 $3.22 $2.81 $2.84 $11.53 Book Value/Share ($) 11.04 10.82 9.43 7.90 6.72 5.24$2.46 $2.94 $2.22 $2.38 $10.01 Avg Shares Outst'g (M) 8,167 8,299 8,375 8,396 8,490 8,813
Sources: AAII Stock Investor Pro, Thomson Reuters and I/B/E/S. Data as of 6/2/2015.
Mar 10, 2015Dec 3, 2014Sep 16, 2014Jun 10, 2014Mar 11, 2014
Sep 11, 2014
2.5% (3% - 2.2%)
1.07
May 19, 2015
0.96
Jun 12, 2014Dec 11, 2014
Feb 17, 2014
Mar 31, 2014Feb 18, 2014
Jun 11, 2015
Index
Nov 18, 2014Aug 19, 2014May 13, 2014
26
$0.57
$0.62
(9.7%)
20.5%
(1.6%)(0.9%)
% Surp20.6%(0.4%)
26
Annual6/2015
$2.392
7.5%
EPS$0.61$0.71
Quarterly6/2015
3 Year
(0.7%)
13.1%13.7%(10.8%)
(9.7%)
Microsoft is a worldwide leader in software, services and solutions for individuals and businesses. The company’s products include operating systems for personal computers, servers, phones and other intelligent devices; server applications for distributed computing environments; productivity business solution applications; desktop and server management tools; software development tools; video games; and online advertising. The company has reorganized and now only distinguishes its operations as two distinct segments: devices and consumer, which includes revenues from Windows, Office, Xbox, Surface and phones; and commercial, which includes server and enterprise products.
Sep 16, 2014
Est SurpriseApr 23, 2015
(4%)7%(2%)16%
Stock
TTM
Jun 12, 2014
Rel StrgthNov 19, 2013
0.96
Gain
1.06
# of Estimates
Jan 26, 2015
EPS (Qtr)
Year Ago
Current
EPS Estimates
$2.42
011
Year Ago
TTM
TTMSales/Sh (Qtr)
Month Ago
2.5% (8.1%)
$2.43$0.56
0%
1%
2%
3%
4%
5%
6%
7%
8%
9%
10%
$0
$10
$20
$30
$40
$50
$60
Jul 2010 Jul 2011 Jul 2012 Jul 2013 Jul 2014
Div
iden
d Yi
eld Share Price
MsFT $46.92 ($50.05 - $39.86)
16 June 2015
It may not be comforting, but individuals are rewarded over the long term for investing in stocks because stock prices can go up or down. Short-term market volatility and uncertainty creates a risk premium to entice investors to buy and hold stocks. It is important to note, however, that all stocks do not react equally to stock market moves.
One attraction of dividend-paying stocks is their regular cash income. Your total return from investing in stocks is composed of any capital gain or loss along with the income generated by your investment. Dividend-paying stocks may not offer as much capital appreciation potential as higher growth, non-dividend-paying stocks, but they tend to offer some downside protection when the market swoons.
There are at least two elements that contribute to the downside protection. The obvious element is the regular quarterly cash dividend that investors receive from dividend-paying stocks. During overall market declines the dividend yield will actually increase for stocks, potentially drawing in fresh income-seeking investors or at least keeping some inves-tors from fleeing a given stock. The greater the stock decline, the higher the yield grows. As long as a company’s future looks promising and its dividend is perceived as secure, the regular income stream is an attractive enticement to wait for an improvement in the market environment. The other con-sideration is the signaling element of the dividend payment.
Dividend Payment as Signal
Companies have contractual obligations to pay interest on borrowed money, but there is no legal requirement to pay cash dividends to shareholders. The board of directors determines whether to pay a dividend, as well as its amount and timing. The dividend payment is an important signal from the company to investors. Dividends convey informa-tion about future earnings, cash flow and capital investment expectations from management and the board of directors. In general, unexpected increases are good news and unexpected decreases are bad news.
Research from Fuller and Goldstein in the paper “Dividend Policy and Market Movement” asserts that the commitment to pay dividends allows the firm to send a signal that the fu-ture prospects for the firm remain positive. More importantly, investors know when to expect the signal. A dividend-paying firm has a relatively regular schedule regarding dividend dec-laration, record date and payment. Stock prices reflect market expectations. When investors have more certainty regarding expected return, as with receiving dividend payments, more value (a higher premium) is placed on the stock price.
Dividends’ Value in Up & Down MarketsThe authors take the theory a bit further by proclaiming
that investors value dividend-paying companies (and manage-ment’s signals) more in down markets than in up markets. “Whether the signal is the maintenance or increase in future earnings or the reduction of waste of free cash flows, the abil-ity to signal should be most valuable in periods of poor overall stock market performance.” In the study, down markets are defined as months that the S&P 500 index had a negative monthly return, while an up month was when the S&P 500 had a positive monthly return from 1970 to 2000.
There were 217 months in the sample where the S&P 500 had a positive return (“up markets”) and 155 months where it did not (“down markets”). The data showed that, overall, dividend-paying firms outperformed non-dividend-paying firms by 0.37% per month. During up markets, non-dividend-paying stocks returned 3.72% on average, while dividend-paying stocks had an average return of 3.88%. During down months, however, non-dividend-paying stocks lost 3.03% on average, while dividend-paying stocks lost just 2.13%.
The authors of the study also looked at the performance of dividend-paying versus non-dividend-paying stocks during bull and bear market periods between 1970 and 2000, as defined by Ned Davis Research. Overall, there were 259 bull months and 113 bear months in the study. During bull markets non-dividend-paying stocks returned 2.09% on average per month, while dividend-paying stocks had an average return of 2.23%. Again, during bear markets the difference was even greater: Non-dividend-paying stocks lost 2.37% on average, while dividend-paying stocks lost just 0.53%.
Impact of Dividend AnnouncementsThe authors of the study also looked at the impact of divi-
dend announcements, increases and decreases over different market environments. Price reactions to dividend increases are less in up markets than in down markets. In addition, divi-dend decreases have smaller negative returns if announced during down markets than up markets. Further, firms that maintained their current dividend payments in down markets experienced positive abnormal returns. Thus, when firms cut dividends when the market is doing well, it is a clearer signal that they are having problems. However, if firms cut dividends when the market is doing poorly, there is less information in the dividend cut or the market may view the cut as an appropriate step by management to undertake given current economic conditions.
ConclusionThe study results paint an interesting picture for investors to
look at. It may not be emotionally easy to hold onto to your stocks during a bear market, but dividend-paying stocks can help reduce some of that angst. ▪
Investors Prefer Dividend-Paying Companies in Market Downturns


