
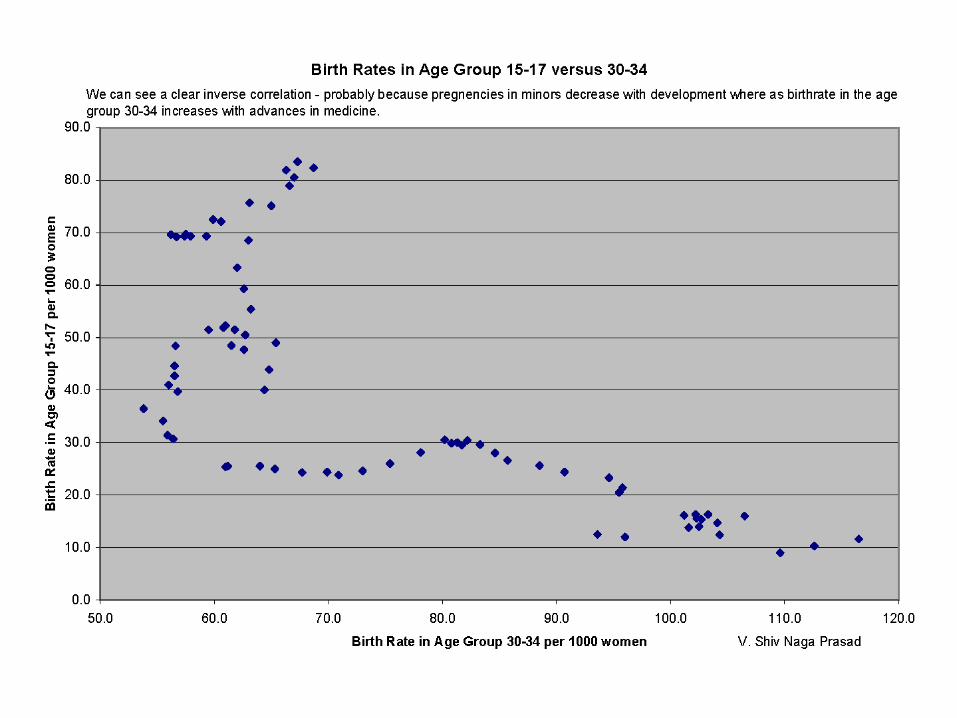
In the U.S. there appears to be something of a correlation between Teenage Birth Rate, and the...
53
T eenage B irth R ate vs.B irth R ate in the U .S . 0 10 20 30 40 50 60 70 80 0 5 10 15 20 25 30 B irth R ate Teenage B irth R ate In the U.S. there appears to be something of a correlation between Teenage Birth Rate, and the overall birth rate, but the correlation is not that strong. Justin Domke
-
date post
20-Dec-2015 -
Category
Documents
-
view
218 -
download
1
Transcript of In the U.S. there appears to be something of a correlation between Teenage Birth Rate, and the...

Teenage Birth Rate vs. Birth Rate in the U.S.
0
10
20
30
40
50
60
70
80
0 5 10 15 20 25 30
Birth Rate
Te
en
ag
e B
irth
Ra
te
In the U.S. there appears to be something of a correlation between Teenage Birth Rate, and the overall birth rate, but the correlation is not that strong.
Justin Domke

Life Expectancy at Birth
0
10
20
30
40
50
60
70
80
90
1880 1900 1920 1940 1960 1980 2000 2020
Year
Lif
e E
xp
ec
tan
cy
There was great growth in life expectancy in the first half of the 20th century, but it appears to be leveling off.
Justin Domke
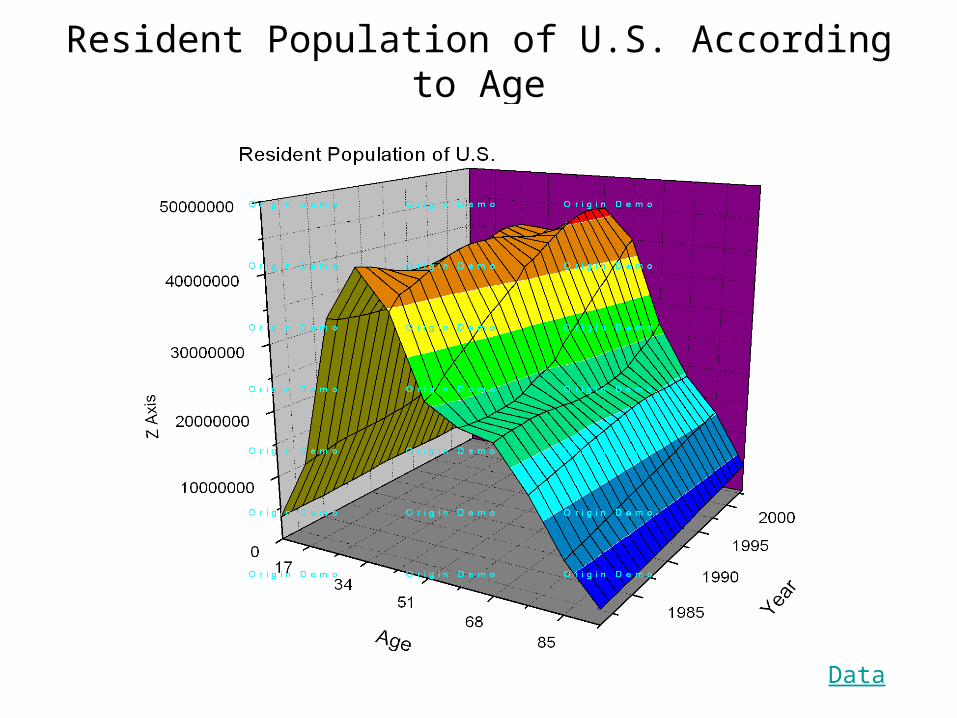
Cigarette Smoking According to Gender
Although there has been a decrease in cigarette smoking, about 25% of men and 20% of female were current smokes in year 2002.
Although there has been a decrease in cigarette smoking, about 25% of men and 20% of female were current smokes in year 2002.

0
5
10
15
20
25
30
35
40
18-24
25-34
35-44
45-64
65 & over
Age Group
(%)
Smok
ers
White MalesBlack MalesWhite FemalesBlack Females
Cigarette Smoking According to Age & Gender (2002)
African American females have one of the lowest rate of cigarette smoking.
Cigarette smoking decreases as white males get older.
African American females have one of the lowest rate of cigarette smoking.
Cigarette smoking decreases as white males get older.

0
5
10
15
20
25
30
35
(%)
Smok
ers
No high school diplomaor GED
High school diploma orGED
Some college Bachelor's degree orhigher
Education
All Smokers
Cigarette Smoking According to Education (2002)
Smoking is highly correlated with educational attainment.
Adults with less than high school diploma were 3 times more likely to smoke than those with bachelor’s degree.
Smoking is highly correlated with educational attainment.
Adults with less than high school diploma were 3 times more likely to smoke than those with bachelor’s degree.

Mustafa Bilgic
• Percentage of women who gave birth• Aids Cases• Deaths related to motor vehicle related injury

Women who had not at least 1 live birth
0.0
10.0
20.0
30.0
40.0
50.0
60.0
70.0
80.0
90.0
100.0
1960
1970
1980
1986
1988
1990
1992
1994
1996
1998
2000
2002
Years
Pe
rce
nt
15-19
20-24
25-29
30-34
35-39
40-44
Percentage for 20-24, 25-29, and 30-34 dramatically increased, but percentagefor 40-44 remained almost constant. So, did the “increased portion” gave birthwhen they turned 40? Or some other explanation?

• One wonders what happened between 1985 and 1995, and what changed between 1995 and 2000.
0
10,000
20,000
30,000
40,000
50,000
60,000
70,000
80,000
# of Cases
1985 1990 1995 2000 2001 2002 2003
Years
AIDS Cases

Deaths due to motor vehicle-related injury:per 100,000 by sex
Male, 22.1, 70%
Female, 9.6, 30%
Deaths due to motor vehicle-related injury:per 100,000 by race
White, 22.4, 23%
African American, 23.2, 24%
American Indian, 39.0,
42%
Asian, 10.8, 11%
• Do women drive more safely? Or, is the percentage of women who drive is less? Or do the women drive less on the rush hours?
• Why is the rate for American Indians is twice and the rate for Asians half as the rate for Whites and African Americans?
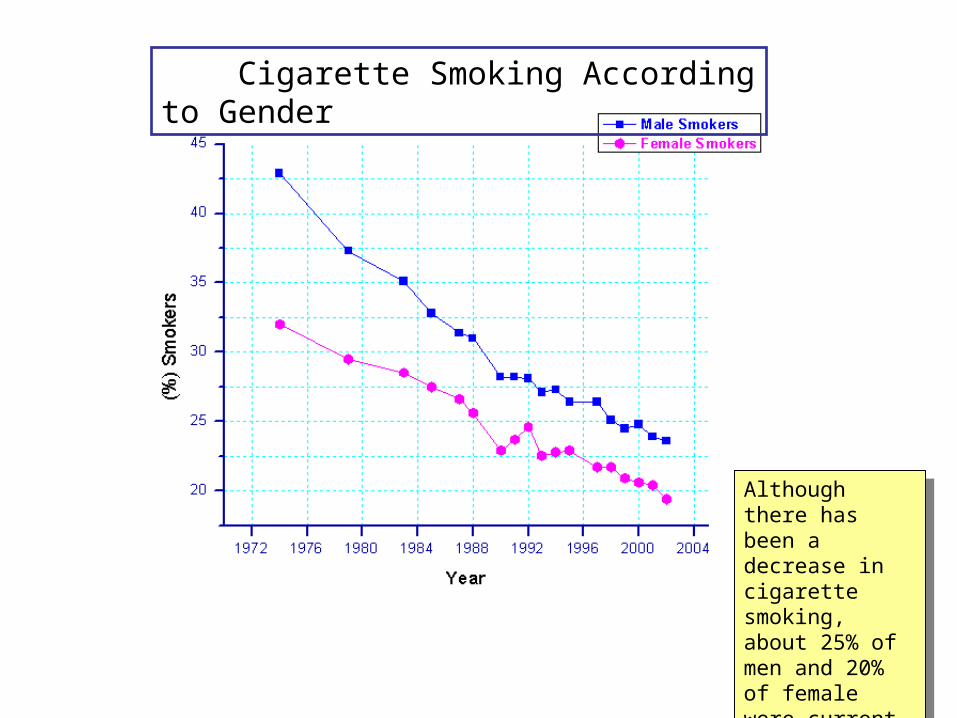
Live births by age and race of mother: United States preliminary 2003 Ming Luo
0
200, 000
400, 000
600, 000
800, 000
1, 000, 000
1, 200, 000
0-14 15-19 20-24 25-29 30-34 35-39 40-44 45-54
Age of mother (years)
Liv
e bi
rths
Al l racesWhi teBl ackAmeri can I ndi anAsi an or Paci fi c I sl ander

Live births by age and race of mother: United States preliminary 2003 Ming Luo
0
200, 000
400, 000
600, 000
800, 000
1, 000, 000
1, 200, 000
0-14 15-19 20-24 25-29 30-34 35-39 40-44 45-54
Age of mother (years)
Liv
e bi
rths Al l races
Whi teBl ackAmeri can I ndi anAsi an or Paci fi c I sl ander

0-14 15-19 20-24 25-29 30-34 35-39 40-44 45-54
Al l racesWhi te
Bl ackAmeri can I ndi an
Asi an or Paci fi c I sl ander
0
200, 000
400, 000
600, 000
800, 000
1, 000, 000
1, 200, 000
Liv
e bi
rths
Age of mother (years)
Live births by age and race of mother: United States preliminary 2003 Ming Luo
Al l racesWhi teBl ackAmeri can I ndi anAsi an or Paci fi c I sl ander

Percent of cigarette smokers vs Education level
0.0
5.0
10.0
15.0
20.0
25.0
30.0
35.0
40.0
45.0
50.0
1974 1979 1983 1985 1987 1988 1990 1991 1992 1993 1994 1995 1997 1998 1999 2000 2001 2002Year
Per
cen
t
No high school diploma or GED High school diploma or GED
College, no bachalor's degree Bachelor's degree or higher
By Mei Huang
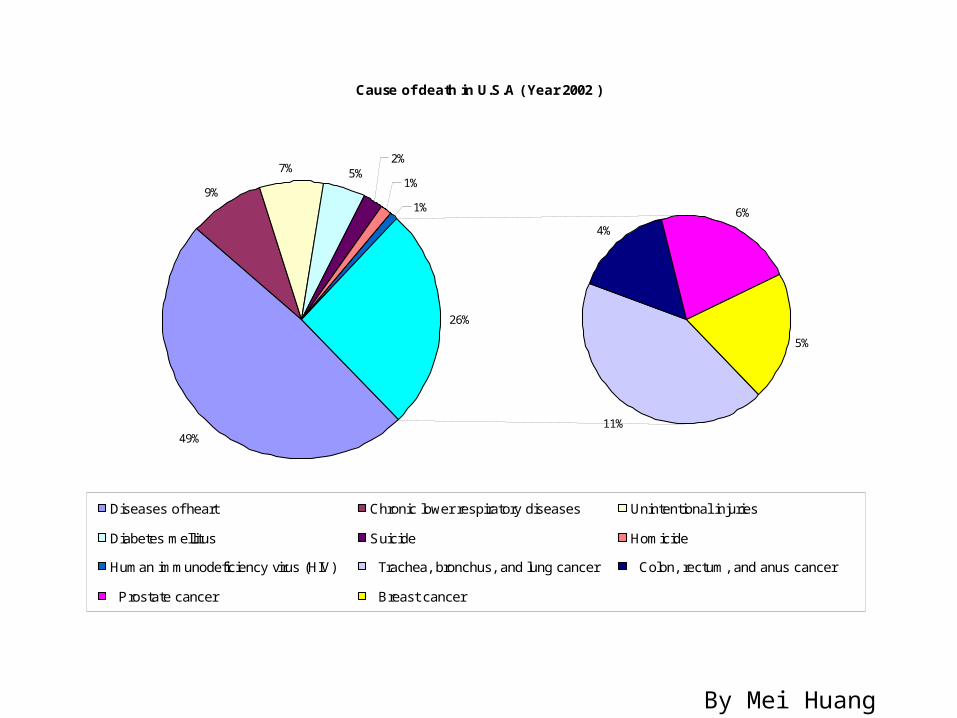
Cause of death in U.S.A ( Year 2002 )
49%
9%
7% 5%2%
1%
1%
11%
4%
6%
5%
26%
Diseases of heart Chronic lower respiratory diseases Unintentional injuries
Diabetes mellitus Suicide Homicide
Human immunodeficiency virus (HIV) Trachea, bronchus, and lung cancer Colon, rectum, and anus cancer
Prostate cancer Breast cancer
By Mei Huang

Newborn Eval uati on vs Mother Age (year 2000~2002)
0
2
4
6
8
10
12
14
16
18
<18 18-19 20-24 25-29 30-34 35+Age groups
Perc
ent
Preterm Bi rth RateLow Bi rthwei ght Rate
By Mei Huang

Doctors of medicine
0
100,000
200,000
300,000
400,000
500,000
600,000
700,000
800,000
900,000
1949
1960
1970
1980
1990
1994
1995
1996
1997
1998
1999
2000
2001
2002
Year
Do
cto
rs
Inactive doctors
Pediatrics specialists
Internal medicine specialists
Pediatrics
Internal medicine
General/family practice
Other active doctors
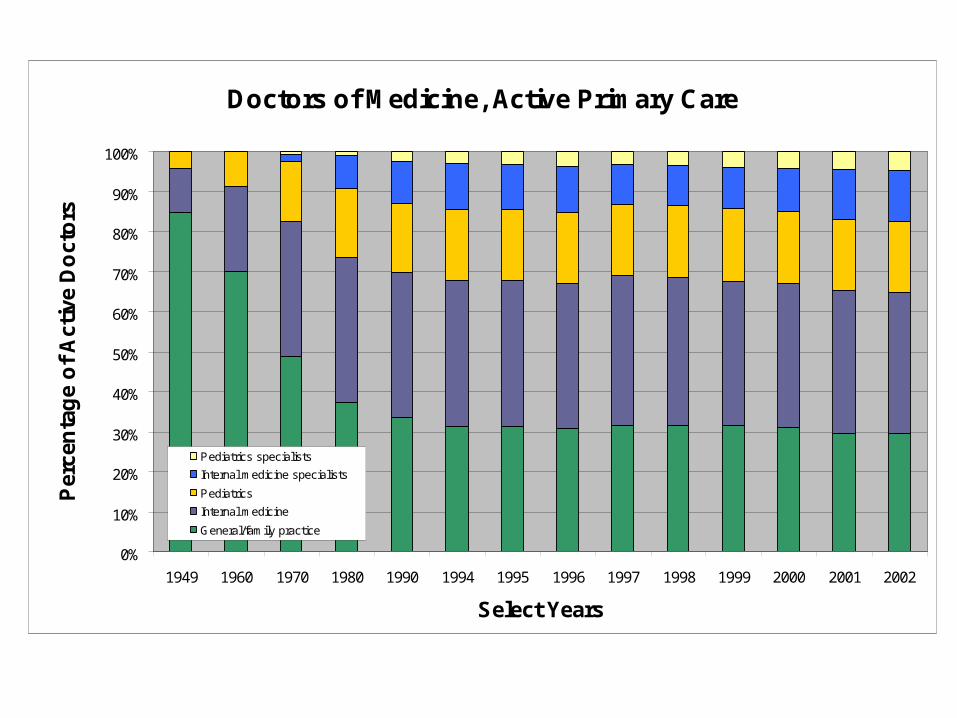
Doctors of Medicine, Active Primary Care
0%
10%
20%
30%
40%
50%
60%
70%
80%
90%
100%
1949 1960 1970 1980 1990 1994 1995 1996 1997 1998 1999 2000 2001 2002
Select Years
Per
cen
tag
e o
f A
ctiv
e D
oct
ors
Pediatrics specialists
Internal medicine specialists
Pediatrics
Internal medicine
General/family practice

Doctors by Specialty, 1970 v 2002
58%
17%
12%
5%1%0%
7%
49%
10%
12%
6%
5%
2%
16%
Other active doctors
General/family practice
Internal medicine
Pediatrics
Internal medicine specialists
Pediatrics specialists
Inactive doctors
1970
2002

Birth Rates By Age During 1980-1999
0.0
20.0
40.0
60.0
80.0
100.0
120.0
140.0
1980
1982
1984
1986
1988
1990
1992
1994
1996
1998
Year
Liv
e B
irth
s /
1,00
0 W
om
en10-14
15-17
18-19
20-24
25-29
30-34
35-39
40-44
45-54
Age Group
This graph shows the variation in birth rate over the years from 1980 until 1999, separated by age group. The birth rate of 20-29 year olds stays pretty much the same, while that of 30-39 is ever increasing, and the birth rate of 15-19 year olds goes up around 1992 but then lessens once again. The birth rate of women aged 40-44 increases slightly as well. The birth rate of women age 45-54 and 10-14 are so small to see significant change.
Louis Licamele

Birth Rate of Women Under 20
0.0
10.0
20.0
30.0
40.0
50.0
60.0
70.0
80.0
90.0
1990 1991 1992 1993 1994 1995 1996 1997 1998 1999
Year
Liv
e B
irth
s /
1,00
0 W
om
en
Asian
White
American Indian
Hispanic
Black
The birth rate of women under 20 who are of different races is shown over the last decade. Some obvious differences among and within races can be seen. The birth rate among Asian women under 20 is very small, followed next by White women. The birth rate of Black and Hispanic women are the largest. The birth rate of Black women, which was the largest in the beginning of the decade, has decreased the fastest and has put the birth rate of Hispanic women as the largest towards the end of the decade. The general pattern is that the birth rate in all women under 20 has decreased regardless of race.
Louis Licamele
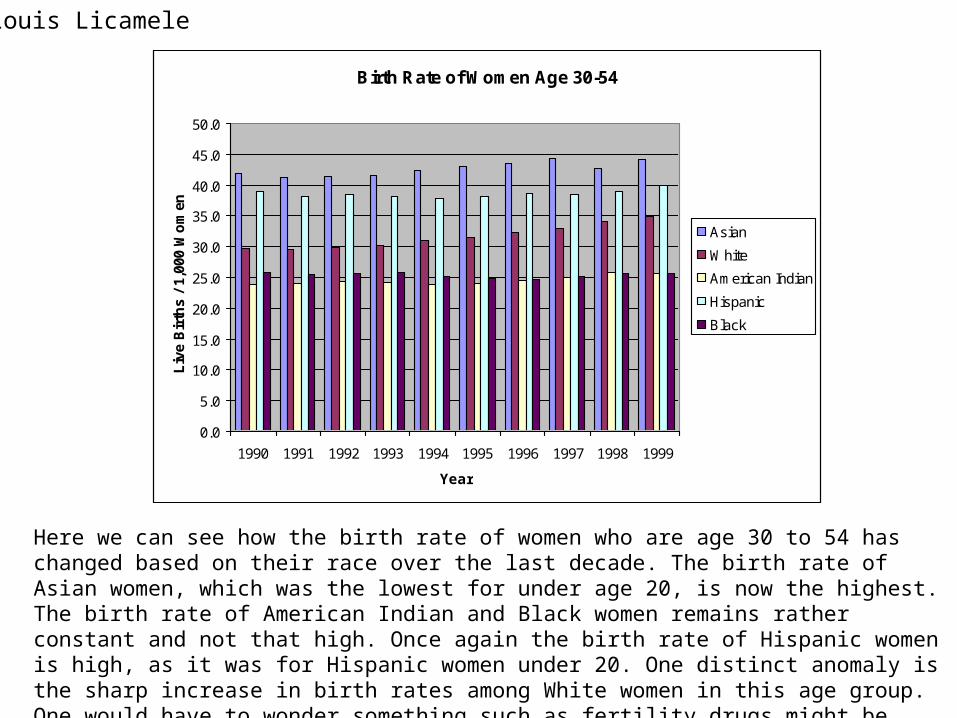
Birth Rate of Women Age 30-54
0.0
5.0
10.0
15.0
20.0
25.0
30.0
35.0
40.0
45.0
50.0
1990 1991 1992 1993 1994 1995 1996 1997 1998 1999
Year
Liv
e B
irth
s /
1,00
0 W
om
en
Asian
White
American Indian
Hispanic
Black
Louis Licamele
Here we can see how the birth rate of women who are age 30 to 54 has changed based on their race over the last decade. The birth rate of Asian women, which was the lowest for under age 20, is now the highest. The birth rate of American Indian and Black women remains rather constant and not that high. Once again the birth rate of Hispanic women is high, as it was for Hispanic women under 20. One distinct anomaly is the sharp increase in birth rates among White women in this age group. One would have to wonder something such as fertility drugs might be playing a role in this change.

0%
10%
20%
30%
40%
50%
60%
70%
80%
90%
100%
Percent
1950 1960 1970 1980 1990 2000
Year
U.S Population Composition by Age
>=65
45~64
25~44
0~24
By Chunyuan Liao

Percent of American in Poverty
0.0
5.0
10.0
15.0
20.0
25.0
30.0
35.0
40.0
1987 1988 1989 1990 1991 1992 1993 1994 1995 1996 1997 1998 1999 2000 2001 2002
Year
Pe
rce
nt
White
Black/African American
Asian
Hispanic/Latino
By Chunyuan Liao

Percent of persons with serious psychological distress
0.0
0.5
1.0
1.5
2.0
2.5
3.0
3.5
4.0
1997-98 1999-2000 2001-02
Year
Per
cen
t
Northeast
Midw est
South
West
By Chunyuan Liao

Kenny Weiss
CMSC 828S
Excel Data Visualization
NCHS Datasets
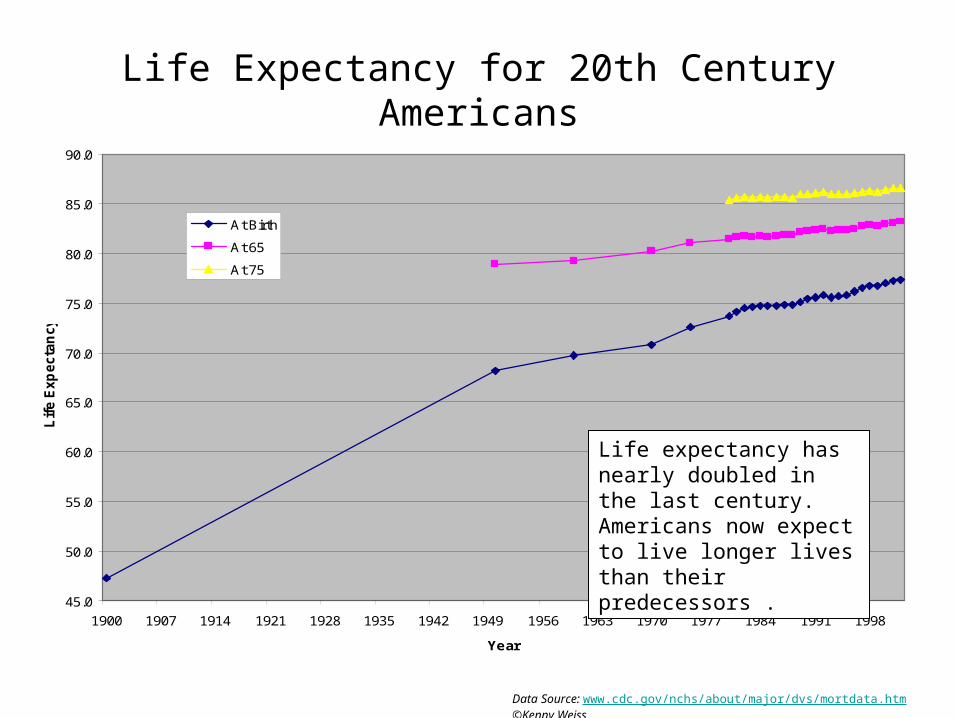
Life Expectancy for 20th Century Americans
45.0
50.0
55.0
60.0
65.0
70.0
75.0
80.0
85.0
90.0
1900 1907 1914 1921 1928 1935 1942 1949 1956 1963 1970 1977 1984 1991 1998
Year
Lif
e E
xp
ecta
ncy
At Birth
At 65
At 75
Life expectancy has nearly doubled in the last century. Americans now expect to live longer lives than their predecessors .
Data Source: www.cdc.gov/nchs/about/major/dvs/mortdata.htm ©Kenny Weiss

Age Distribution in America1950, 2000 and 2050
1950
3%6%
Under 65
65-75
75+
2000
6%
7%
2050 (Projected)
79%
9%
12%
The percentage of senior citizens in the population has steadily increased in the past 50 years and is projected to continue increasing.
Data Source: ftp://ftp.cdc.gov/pub/Health_Statistics/NCHS/Publications/Health_US/hus04tables/Table027.xls ©Kenny Weiss

40.0
45.0
50.0
55.0
60.0
65.0
70.0
75.0
80.0
85.0
1900
1950
1960
1970
1975
1980
1981
1982
1983
1984
1985
1986
1987
1988
1989
1990
1991
1992
1993
1994
1995
1996
1997
1998
1999
2000
2001
2002
Year
Exp
ecte
d L
ifet
ime
Female
Male
Expected Lifetimes by Gender of Americans in the 20th Century
Women continue to live longer than men, but the gap is slowly closing in.
Data Source: www.cdc.gov/nchs/about/major/dvs/mortdata.htm ©Kenny Weiss

As Americans age, they increasingly embrace some form of complementary alternative medicine (CAM). However, for most therapy types, usage peaks between the ages of 40 and 60, which then drops off over time. The gap is bridged by the increasingly important role prayer plays in alternative healing
for Americans as they age beyond 60.
Complimentary Alternative Medicine (CAM)Therapy Type Usage by Age Group
0
20
40
60
80
100
18–29 30–39 40–49 50–59 60–69 70–84 85+
Age
Po
pu
lati
on
Usa
ge
(%) CAM - All Therapy Types
CAM - No Megavitamin or Prayer
Mind-Body
Mind-Body - No Prayer
Biological
Biological - No Megavitamin
Manipulative Body
Alternative Medecine
Energy
Amy Karlson

The likelihood an individual will use a form of comparative alternative medicine (CAM) therapy generally correlates with higher levels of completed
education. However, the most widely practiced type of CAM, mind-body therapy, does not follow this trend. People at all levels of education are
generally equally likely to practice mind-body therapy, but the less educated the individual, the more likely the practice includes some type of prayer.
Amy Karlson
Comparative Alternative Medicine (CAM) Therapy Usage by Education Level
0
10
20
30
40
50
60
70
Less
than
High
Schoo
l
High S
choo
l/GED
Colleg
e - No
Degree
Assoc
iate
Degre
e
B.A. o
r B.S
.
M.S
., PhD, D
DS
Level of Education
Po
pu
lati
on
Us
ag
e (
%)
Mind-BodyBiologicalMind-Body - No PrayerManipulative BodyAlternative MedecineEnergy

Alternative medicine in America is practiced considerably across all races. Taking into account all therapy types, a higher percentage of Black Americans practice alternative forms of healing than individuals of other ethnicities. However, this relative percentage falls below
those of other races when Megavitamin and Prayer therapies are removed from consideration, at which point Asian Americans practice CAM at the highest rate. Overall, over one third of
the population practices some form of CAM, and if prayer is included, the percentage rises to nearly two-thirds.
Amy Karlson
Complementary Alternative Medicine (CAM) Therapy Usage by Race
60.461.461.7
71.3
62.1
35.935.1
26.2
43.1
28.3
0
10
20
30
40
50
60
70
80
All Black Asian Hispanic White
Race
Po
pu
lati
on
Usa
ge
(%)
CAM - All Therapy Types CAM - Excluding Megavitamin and Prayer
United StatesMortality Trends
1950 - 2002
Nitin Madnani

0.0
200.0
400.0
600.0
800.0
1,000.0
1,200.0
1,400.0
1,600.0
1950 1960 1970 1980 1990 2000 2001 2002
Year
Death
s p
er
100,0
00
62.0
64.0
66.0
68.0
70.0
72.0
74.0
76.0
78.0
1950 1960 1970 1980 1990 2000 2001 2002
Year
Lif
e E
xpecta
ncy (
in y
ears
)
Overall Mortality Trend
Last 50 Years
Higher Life Expectancy
Lower Death Rates

Heart DiseaseCancerStrokeRespiratory DiseaseUnintentional Injuries
Causes of Mortality
Leading causes of death have
not changed.
Deaths in 2002
Deaths due to all causes except
respiratory diseases have declined.
0.0
50.0
100.0
150.0
200.0
250.0
300.0
350.0
400.0
450.0
1980 1985 1990 1995 2000 2001 2002
0.0
50.0
100.0
150.0
200.0
250.0
300.0
350.0
Heart Disease
CancerStroke
Respiratory Disease
Unintentional Injuries
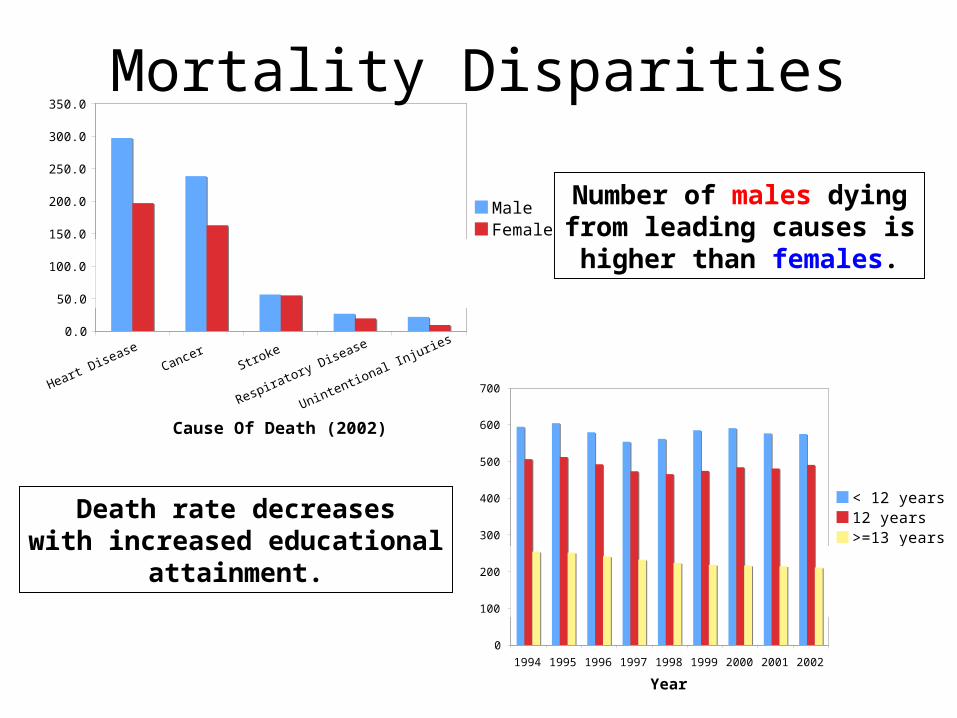
Cause Of Death (2002)
Death
s p
er
10
0,0
00
MaleFemale
Mortality Disparities
Number of males dyingfrom leading causes ishigher than females.
0
100
200
300
400
500
600
700
1994 1995 1996 1997 1998 1999 2000 2001 2002
Year
Death
s p
er
10
0,0
00
(2
5-6
4)
< 12 years12 years>=13 years
Death rate decreaseswith increased educational
attainment.


Total Resident Population of U.S.

Resident Population of U.S. Male and Female


• Dataset taken from National Vital Statistics Reports, Vol. 52, No. 2, September 15, 2003
Submitted by :
Sanket Sinha
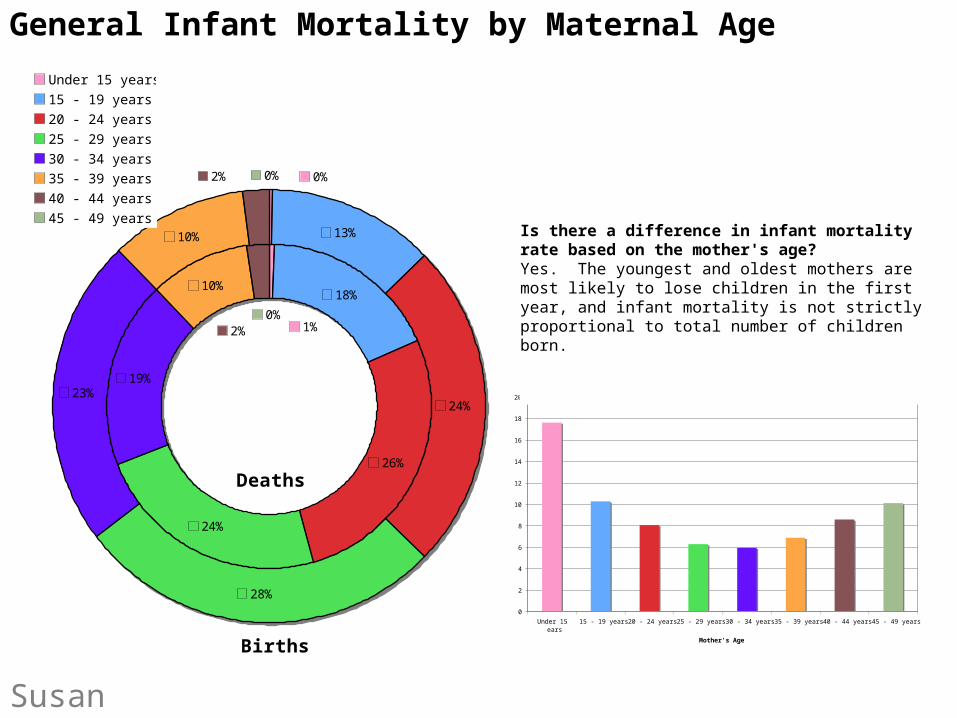
Infant Mortality by Mother's Age
0
2
4
6
8
10
12
14
16
18
20
Under 15years
15 - 19 years 20 - 24 years 25 - 29 years 30 - 34 years 35 - 39 years 40 - 44 years 45 - 49 years
Mother's Age
Death
s p
er
1000 liv
e b
irth
s
Susan Campbell
18%
26%
24%
19%
10%
13%
24%
28%
23%
10%
1%2%0%
0%0%2%
Under 15 years
15 - 19 years
20 - 24 years
25 - 29 years
30 - 34 years
35 - 39 years
40 - 44 years
45 - 49 years
Deaths
Births
Is there a difference in infant mortality rate based on the mother's age?Yes. The youngest and oldest mothers are most likely to lose children in the first year, and infant mortality is not strictly proportional to total number of children born.
General Infant Mortality by Maternal Age

Prenatal Care Percentages
0
0.05
0.1
0.15
0.2
0.25
0.3
0.35
0.4
0.45
0.5
1st month 2nd month 3rd month 4th month 5th month 6th month 7th month 8th month 9th month No prenatalcare
Unknown ornot stated
Start of Prenatal Care
Pro
po
rtio
n o
f b
irth
sUnder 15 years
15 - 19 years
20 - 24 years
25 - 29 years
30 - 34 years
35 - 39 years
40 - 44 years
45 - 49 years
Susan Campbell
When do expectant mothers start prenatal care?Women of different ages appear to seek prenatal care in different parts of pregnancy. The youngest women appear to be most likely to delay prenatal care, but the pattern differs for different age groups.
Gestational age where prenatal care starts

Infant Mortality by Prenatal Care and Mother's Age
0
10
20
30
40
50
60
70
80
1st month 2ndmonth
3rdmonth
4th month 5th month 6th month 7th month 8th month 9th month Noprenatal
care
Unknownor notstated
Start of Prenatal Care
Death
s p
er
1000 liv
e b
irth
s
Under 15 years
15 - 19 years
20 - 24 years
25 - 29 years
30 - 34 years
35 - 39 years
40 - 44 years
45 - 49 years
Susan Campbell
Does prenatal care have a differential effect based on the age of the mother?The previous graph suggests that the youngest mothers tend to get prenatal care later or not at all, and, unfortunately, as shown below, their infants are more likely not to survive if they do not get adequate prenatal care. This data is correlational, but it does suggest that improving access to prenatal care for very young mothers might improve infant mortality rates.
Prenatal care and birth outcomes by age

Education AttainmentPresentation Assignment
Jerry Alan Fails

Education Attainment on the Rise
0%
10%
20%
30%
40%
50%
60%
70%
80%
90%
100%
1940 1950 1960 1970 1980 1990 2000
Pe
rce
nt
of
Po
pu
lati
on
(%
)
4+ yrs of college
1-3 yrs of college
4 yrs of high school
1-3 yrs of high school
8th grade or less
Education attainment in the United States from 1940 to 2000 for people between the ages of 25 and 34.

Education Attainment by Sex
Female Education Attainment
0%
20%
40%
60%
80%
100%
1940 1950 1960 1970 1980 1990 2000
4+ yrs of college
1-3 yrs of college
4 yrs of high school
1-3 yrs of high school
8th grade or less
Male Education Attainment
0%10%20%30%40%50%60%70%80%90%
100%
1940 1950 1960 1970 1980 1990 2000
4+ yrs of college
1-3 yrs of college
4 yrs of high school
1-3 yrs of high school
8th grade or less
Education attainment in the United States from 1940 to 2000 for people between the ages of 25 and 34.
Completed 4+ Yrs of College
0%
5%
10%
15%
20%
25%
30%
35%
1940 1950 1960 1970 1980 1990 2000
Per
cent
of P
opul
atio
n G
roup
(%)
Male
Female

Education Attainment by RaceWhite Education Attainment
0%
20%
40%
60%
80%
100%
1940 1950 1960 1970 1980 1990 2000
4+ yrs of college
1-3 yrs of college
4 yrs of high school
1-3 yrs of high school
8th grade or less
Black Education Attainment
0%
20%
40%
60%
80%
100%
1940 1950 1960 1970 1980 1990 2000
4+ yrs of college
1-3 yrs of college
4 yrs of high school
1-3 yrs of high school
8th grade or less
Hispanic Education Attainment
0%
20%
40%
60%
80%
100%
1940 1950 1960 1970 1980 1990 2000
4+ yrs of college
1-3 yrs of college
4 yrs of high school
1-3 yrs of high school
8th grade or less
Education attainment in the United States from 1940 to 2000 for people between the ages of 25 and 34.
Completed 4+ Yrs of College
0%
5%
10%
15%
20%
25%
30%
35%
1940 1950 1960 1970 1980 1990 2000Per
cen
t o
f P
op
ula
tio
n G
rou
p (
%)
White
Black
Hispanic