In-Situ Investigation of Notifications in Multi-Device ...
6
In-Situ Investigation of Notifications in Multi-Device Environments Dominik Weber, Alexandra Voit, Philipp Kratzer , Niels Henze VIS, University of Stuttgart – Stuttgart, Germany {firstname.lastname}@vis.uni-stuttgart.de – [email protected] ABSTRACT Smart devices have arrived in our everyday lives. Being able to notify the user about events is a core feature of these devices. Related work investigated interruptions caused by notifications on single devices. In this paper, we investigate notifications in multi-device environments by analyzing the results of a week-long in-situ study with 16 participants. We used the Experience Sampling Method (ESM) and recorded the partic- ipants’ interaction with smartphones, smartwatches, tablets and PCs. Disregarding the type or content of notifications, we found that the smartphone is the preferred device on which to be notified. Further, we found that the proximity to the de- vice, whether it is currently being used and the user’s current location can be used to predict if the user wants to receive notifications on a device. The findings can be used to design future multi-device aware smart notification systems. ACM Classification Keywords H.5.m. Information Interfaces and Presentation (e.g. HCI): Miscellaneous Author Keywords Multi-Device; Notifications; Experience Sampling Method; Context-Awareness; In-Situ INTRODUCTION AND BACKGROUND Smart devices are becoming more and more ubiquitous. From desktop computers to laptops, smartphones, tablets and smart- watches — always connected devices have arrived in our ev- eryday lives. One of the core features of smart devices is the ability to notify the user about various events, such as new messages or software updates. Depending on the application, notifications about an event can be shown on one or on mul- tiple devices at the same time. Figure 1 shows an exemplary multi-device scenario where a user is interacting with a laptop, while wearing a smartwatch, with a smartphone and tablet placed on the desk. Assuming every device in this scenario has an email client installed, a single email causes all four Permission to make digital or hard copies of all or part of this work for personal or classroom use is granted without fee provided that copies are not made or distributed for profit or commercial advantage and that copies bear this notice and the full citation on the first page. Copyrights for components of this work owned by others than ACM must be honored. Abstracting with credit is permitted. To copy otherwise, or republish, to post on servers or to redistribute to lists, requires prior specific permission and/or a fee. Request permissions from [email protected]. UbiComp ’16, September 12-16, 2016, Heidelberg, Germany © 2016 ACM. ISBN 978-1-4503-4461-6/16/09. . . $15.00 DOI: http://dx.doi.org/10.1145/2971648.2971732 Figure 1. An exemplary multi-device environment with a laptop, smart- phone, tablet and smartwatch. devices to notify the user. Disruptive effects caused by no- tifications are therefore amplified by the increasing number of devices around us. On the other hand, a text message on the smartphone might not be shown on other devices. This might prompt the user to pick up the smartphone and therefore interrupts the current work on the laptop. A body of related work already investigated interruptions caused by notifications and resulting distractive effects on different types of devices. Iqbal and Horvitz conducted a field study about email notifications on computers at the work- place [9]. They show that notifications can disrupt the users’ current task. In the field study, they disabled email notifica- tions for two weeks and noticed that some participants inter- rupted themselves to check for new emails. The researchers conclude that, while notifications are distracting, they are val- ued by users because they enable “passive awareness”. Pielot et al. conducted an in-situ study of mobile notifications with 15 participants [12]. Participants in the study received on average 63.5 notifications per day. Even in silent mode, notifications were viewed withing minutes. Sahami Shirazi et al. assessed mobile notifications using a research in the large approach [14, 16]. Using an Android app, the researchers collected almost 200 million notifications from more than 40,000 users. They conclude that important notifications are about messaging, people and events. While not all kinds of notifications are im- portant, many were clicked within 30 seconds. Sahami Shirazi and Henze also conducted an in-situ study about notifications on smartwatches [15]. The results of the study show that on smartwatches participants favored notifications from calendar and VOIP applications.
Transcript of In-Situ Investigation of Notifications in Multi-Device ...
In-Situ Investigation of Notificationsin Multi-Device Environments
Dominik Weber, Alexandra Voit, Philipp Kratzer�, Niels HenzeVIS, University of Stuttgart – Stuttgart, Germany
{firstname.lastname}@vis.uni-stuttgart.de – �[email protected]
ABSTRACTSmart devices have arrived in our everyday lives. Being ableto notify the user about events is a core feature of these devices.Related work investigated interruptions caused by notificationson single devices. In this paper, we investigate notificationsin multi-device environments by analyzing the results of aweek-long in-situ study with 16 participants. We used theExperience Sampling Method (ESM) and recorded the partic-ipants’ interaction with smartphones, smartwatches, tabletsand PCs. Disregarding the type or content of notifications, wefound that the smartphone is the preferred device on whichto be notified. Further, we found that the proximity to the de-vice, whether it is currently being used and the user’s currentlocation can be used to predict if the user wants to receivenotifications on a device. The findings can be used to designfuture multi-device aware smart notification systems.
ACM Classification KeywordsH.5.m. Information Interfaces and Presentation (e.g. HCI):Miscellaneous
Author KeywordsMulti-Device; Notifications; Experience Sampling Method;Context-Awareness; In-Situ
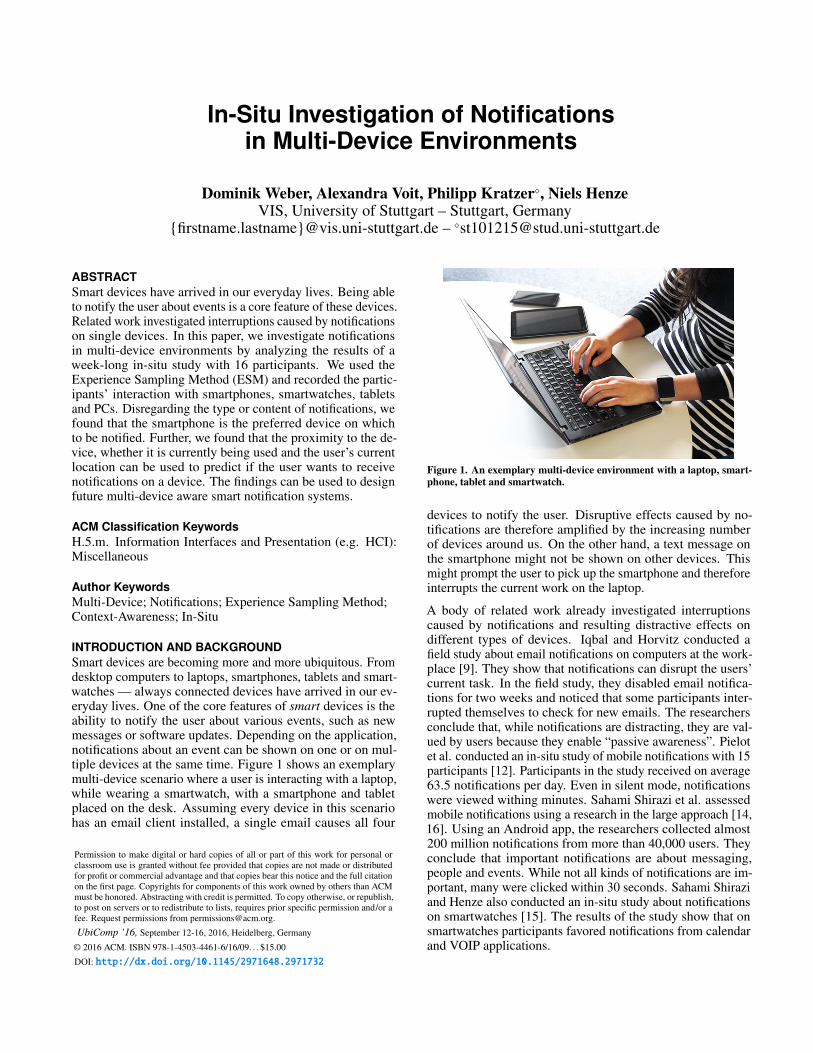
INTRODUCTION AND BACKGROUNDSmart devices are becoming more and more ubiquitous. Fromdesktop computers to laptops, smartphones, tablets and smart-watches — always connected devices have arrived in our ev-eryday lives. One of the core features of smart devices is theability to notify the user about various events, such as newmessages or software updates. Depending on the application,notifications about an event can be shown on one or on mul-tiple devices at the same time. Figure 1 shows an exemplarymulti-device scenario where a user is interacting with a laptop,while wearing a smartwatch, with a smartphone and tabletplaced on the desk. Assuming every device in this scenariohas an email client installed, a single email causes all four
Permission to make digital or hard copies of all or part of this work for personal orclassroom use is granted without fee provided that copies are not made or distributedfor profit or commercial advantage and that copies bear this notice and the full citationon the first page. Copyrights for components of this work owned by others than ACMmust be honored. Abstracting with credit is permitted. To copy otherwise, or republish,to post on servers or to redistribute to lists, requires prior specific permission and/or afee. Request permissions from [email protected].
UbiComp ’16, September 12-16, 2016, Heidelberg, Germany
© 2016 ACM. ISBN 978-1-4503-4461-6/16/09. . . $15.00
DOI: http://dx.doi.org/10.1145/2971648.2971732
Figure 1. An exemplary multi-device environment with a laptop, smart-phone, tablet and smartwatch.
devices to notify the user. Disruptive effects caused by no-tifications are therefore amplified by the increasing numberof devices around us. On the other hand, a text message onthe smartphone might not be shown on other devices. Thismight prompt the user to pick up the smartphone and thereforeinterrupts the current work on the laptop.
A body of related work already investigated interruptionscaused by notifications and resulting distractive effects ondifferent types of devices. Iqbal and Horvitz conducted afield study about email notifications on computers at the work-place [9]. They show that notifications can disrupt the users’current task. In the field study, they disabled email notifica-tions for two weeks and noticed that some participants inter-rupted themselves to check for new emails. The researchersconclude that, while notifications are distracting, they are val-ued by users because they enable “passive awareness”. Pielotet al. conducted an in-situ study of mobile notifications with 15participants [12]. Participants in the study received on average63.5 notifications per day. Even in silent mode, notificationswere viewed withing minutes. Sahami Shirazi et al. assessedmobile notifications using a research in the large approach [14,16]. Using an Android app, the researchers collected almost200 million notifications from more than 40,000 users. Theyconclude that important notifications are about messaging,people and events. While not all kinds of notifications are im-portant, many were clicked within 30 seconds. Sahami Shiraziand Henze also conducted an in-situ study about notificationson smartwatches [15]. The results of the study show that onsmartwatches participants favored notifications from calendarand VOIP applications.

To lessen the impact of interruptions caused by notifications,prior work mainly focused on detecting opportune moments,so called breakpoints, to notify the user. In a diary study, Cz-erwinski et al. showed that returning to tasks after being inter-rupted is hard [4]. Fisher et al. investigated episodes of mobilephone activity as indicators of opportune moments to delivernotifications [5]. Iqbal and Bailey investigated effects of in-telligent notification management on users and their tasks [8].The researchers built a system that uses statistical models todefer notifications until breakpoints, resulting in reduced frus-tration and reaction time. Using a context-aware computingdevice, Ho and Intille detected activity transitions [7]. Theyfound that messages delivered in this activity transitions werebetter received. Using machine learning techniques, Pielotet al. investigated the possibility to predict the user’s atten-tiveness for text messages [13]. In a large-scale observationalstudy Leiva et al. investigated the cost of mobile app interrup-tions showing that in some cases the completion of tasks wasdelayed by up to four times [10]. Recent work by Okoshi et al.investigated the possibility of reducing the perceived mentaleffort of interruptive notifications in multi-device mobile en-vironments, in this case smartphones and smartwatches [11].The researchers developed a middleware that identifies break-points for notification delivery. According to the researchers,determining on which device to notify the user is a challengefor future research.
In summary, most prior research on notifications and interrup-tions only focused on single devices. What is missing is anunderstanding of how future notification systems should bedesigned with multiple devices in mind. In this paper, we gainfirst insights about notifications in multi-device environments.We report a week-long Experience Sampling Method (ESM)study with 16 participants and 4 different types of smart de-vices. We analyze if the device proximity, interaction andlocation are indicators for whether or not a device should beused to notify the user. The findings can be used to designfuture multi-device aware smart notification systems.
METHOD OF THE STUDYTo reduce the effect of interruptions caused by notifications,previous work focused mainly on the time to display notifi-cations. While this is certainly important, the large numberof devices, including PCs, smartphones, smartwatches andtablets, suggests that the device that displays notifications isalso important. Therefore, we conducted a study to investigatenotifications in multi-device environments. In the followingwe describe the design of the study, the used apparatus, theprocedure and the participants that took part.
DesignIn the study, participants used a smartphone, a tablet, a smart-watch and a PC, the four most commonly used devices thatare able to display notifications. Over the course of one weekwe collected responses from participants using the ExperienceSampling Method (ESM) [2, 3, 6]. To reduce interference withother tasks, we designed the ESM questionnaire in a way thatallows completing it without any text input. The questionnaireconsists of two questions and two statements (see Figure 2):
Figure 2. Screenshots of the ESM questionnaire app.
• Q1: Where are you? Possible answers are In transit, Athome, Work/uni, Restaurant, Sport, and Other. When se-lecting Other an optional text field appears. Participantscan select multiple answers to allow combinations such asworking on a train or doing a workout at home.
• Q2: How many people are in your surroundings? Pos-sible answers are “0”, “1-3”, “4-10”, “11-50”, and “morethan 50”. Here only one answer could be selected.
• Q3: The mentioned device is in my proximity. Followedby a 5-point Likert scale for each device (smartphone, tablet,PC, smartwatch).
• Q4: I want to receive a notification on the mentioneddevice. Followed by a 5-point Likert scale for each device(smartphone, tablet, PC, smartwatch).
Participants received EUR 0.20 at the end of the study for eachcompleted questionnaire. In addition to the ESM responses,we recorded activity data on each of the participants’ fourdevices. For example, we recorded screen-on events and if theuser is interacting with the device.
ApparatusTo not interfere with the participants’ device usage, we useda dedicated device to present the ESM questionnaires. Allparticipants were equipped with an additional smartphone forthe sole purpose of collecting ESM responses. Therefore, weimplemented an ESM survey Android application that con-sists of a background service and the survey view itself. Thebackground service triggers a survey every 45 to 90 minutes.Between 0am and 6am, no surveys are triggered. We askedthe participants to carry the ESM device with them duringthe active times, and told them that they are free to changethe volume/vibration. When a survey is triggered, a surveynotification is shown and clicking it opens the survey view.If the notification is not clicked on within 10 minutes, it isremoved. The ESM answers are stored locally. For the study,we disabled all other apps and data connections on the ESMdevice, resulting in a battery life of over one week. Therefore,participants could carry the ESM device for the entire durationof the study without having to charge it.
We implemented logging applications for Android devices(smartphone, tablet, smartwatch) and Windows PCs to recordthe status of each of the four devices. The Android application

consists of a background service, set to “high priority” to avoidtermination by the Android system. Because we were con-cerned about causing a noticeable impact on the battery, whichcould influence the study results, the application only collectsevent-based information. The collected events are displayon/off, connection status (WiFi/mobile/offline), power on/off,headset connected and charging/not charging. In addition,the app records touch events using a transparent layer aboveother apps. This, too, was limited and we only logged onetouch event per minute. We use Google Play Services APIsto record the current location and the current activity. TheActivity Recognition API returns a probability for the eventsfoot, bicycle, still, running, tilting, walking and unknown with-out negatively affecting the device’s battery life. The loggingapplication runs on all devices with Android 4.3 (or newer)including smartphones, tablets and smartwatches.
The Windows application also consists of a background pro-cess and automatically adds an entry to the Windows auto start.The application records log-in and log-out events and timesof inactivity. Times of inactivity are calculated similar to ascreen-saver. Once a minute, the application checks if the userhas interacted with the computer by either moving the mouseor typing on the keyboard. If there was no interaction, theinactivity was logged with a timestamp and another timestamponce the mouse was moved again or something was typed onthe keyboard. We also record the name of the current fore-ground process to detect, for example, when a video is beingwatched and therefore no interaction happened.
ProcedureTo capture weekdays and weekends, the duration of the studystudy was 7 full days for each participant. On the day beforethe start of the study, we invited participants to sign a con-sent form and to fill a demographic questionnaire. We alsogave them a smartwatch and the additional ESM device, andexplained how to use them. If the participant did not own atablet, we also handed out a tablet. Because all participantsowned Android smartphones, they were already familiar withthe operating system on the tablets. We installed the loggingapplications together with the participants and explained indetail what information is recorded and that they should useall devices as usual. The day after the study, we again invitedparticipants to export the locally stored data, retrieve the de-vices, and hand out the monetary rewards depending on howmany ESM questionnaires were completed. This resulted in atotal participation time of nine days.
ParticipantsWe recruited participants using a university mailing list bydescribing the study and stating that we are looking for par-ticipants with an Android 4.3 smartphone and a Windows PCor laptop. We also stated that owning a tablet is preferredbut not required. In total, 18 people participated in the study.However, we excluded two participants. In the first case, ex-porting the log file from the smartwatch failed, resulting inan incomplete set of log files. In the second case, the partic-ipant only answered one ESM questionnaire in seven days.Of the remaining 16 participants, 4 were female and 12 male.They were between 19-58 years old (M = 26.25,SD = 8.76).
Figure 3. Total number of completed ESM questionnaires from all par-ticipants for each hour of the day. Between 0am and 6am no question-naires were triggered.
Eleven participants were students, 4 employees and one re-tiree. All participants used their own smartphone and PC.Ten participants used their own tablet, and we handed out sixtablets. Of the ten participants who used their own tablet, twoshared a tablet with their partner, but used different profiles.Furthermore, we handed out smartwatches (Motorola Moto360) and the additional ESM devices (Samsung Nexus S) to allparticipants. Only one participant used a smartwatch before.
RESULTSAt the end of the study, we collected the ESM responses andthe automatically recorded data. In the following, we providean overview of the collected ESM responses. We investigateif the participants’ location, the proximity of the device, andthe number of people in their surrounding have an effect onparticipants’ preference for receiving notifications on the fourdevices. Afterwards, we investigate the effect of device usageon participants’ preference. Finally, we analyze the correlationbetween the answered questions in the questionnaire (Q1, Q2and Q3), the corresponding logged events, and the preferreddevice to receive an incoming notification (Q4).
Analysis of the ESM questionnairesParticipants answered between 14 and 90 ESM questionnaires(M = 60.31,SD = 21.26) which totals to 965 answered ques-tionnaires. On working days, more questionnaires were an-swered than on the weekend. However, even on Sundays, theday with the lowest amount of answered questionnaires, morethan 110 questionnaires were answered. Figure 3 shows thetotal number of answered questionnaires for each hour of theday between 6am-0am (the time the ESM questionnaires weretriggered). The number of answered questionnaires increasesas the day progresses, with highest number of answers between1pm-2pm. A second peak can be seen between 10pm-11pm.
According to the participants’ recorded locations (Q1), wefound that the participants were mostly at home (70.55%),followed by work/uni (14.01%), in transit (11.04%), other(2.66%), restaurant (0.92%) and sport (0.82%). One par-ticipant mentioned that he did not carry any device whenworking out and therefore might have missed questionnaires.According to the second question (Q2), most of the time par-ticipants were either with “1-3” other people (47.46%) oralone (35.54%), followed by “4-10” people people (10.78%),“11-50” (4.77%) and “more than 50” people (1.45%).

Figure 4. Agreements to “The mentioned device is in my proximity” (Q3)for smartphone, smartwatch, tablet and PC.
We used a Friedman test to investigate if the proximity ofthe devices is significantly different (Q3, see Figure 4). Weused Wilcoxon signed-rank post hoc tests with Bonferronicorrection (resulting in a significance level of p ≤ 0.008) forpairwise comparison. We found that the proximity of thefour devices significantly differ, χ2(3) = 19.390, p < .001.The device closest to the participants was the smartphone(M = 4.31,SD = 0.60) and smartwatch (M = 4.31,SD =0.79), followed PC (M = 3.53,SD = 1.38) and tablet (M =2.69,SD = 1.20). The smartphone is significantly closerthan the tablet (U =−3.22, p = 0.001). Similarly, the smart-watch is significant closer to the participant than the tablet(U =−3.09, p = 0.002). There are no significant differencesfor all other combinations, p ≥ 0.035.
We again used a Friedman test and Wilcoxon signed-ranktests to investigate the preferred device for receiving notifi-cations (Q4, see Figure 5). We found that the device has asignificant effect on participants’ preference, χ2(3) = 21.401,p < .001. The most preferred device to receive notifications isthe smartphone (M = 4.12,SD = 1.26), followed by the smart-watch (M = 3.69,SD = 1.40), the PC (M = 2.56,SD = 1.31)and the tablet (M = 1.63,SD = 0.81). Participants ratedthe smartphone significantly higher than the tablet (U =−3.33, p = 0.001) and the PC (U = −2.66, p = 0.008). Therating for the smartwatch is significant higher than the tablet(U =−3.10, p = 0.002). There are no significant differencesfor all other combinations, p ≥ 0.055.
Analysis of the device usageRegarding the device usage, the device with the most screen-on events per day (see Figure 6a) is the smartwatch (M =120.57,SD = 87.79), followed by the smartphone (M =73.25,SD = 43.74) and the tablet (M = 7.35,SD = 9.38). Thedevice with the most touch events per day (Figure 6b) isthe smartphone (M = 98.39,SD = 84.89), followed by thetablet (M = 20.56,SD = 40.69) and the smartwatch (M =20.51,SD = 19.14). The device with the highest average ac-tive time per day (see Figure 6c) is the PC (M = 4 : 32h,SD =3 : 48h), followed by the smartphone (M = 1 : 50h,SD = 1 :38h), the tablet (M = 0 : 39h,SD = 1 : 03h), and the smart-watch (M = 0 : 17h,SD = 0 : 14h). For PC, the active time isthe time between logging in and out minus the time withoutuser interaction. For Android devices, the active time is thetime the screen was on.
Figure 5. Agreements to “I want to receive a notification on the mentioneddevice” (Q4) for smartphone, smartwatch, tablet and PC.
(a) Screen-on events (b) Touch events (c) Time activeFigure 6. Average daily number of screen-on events, touch events andactive time.
CorrelationsWe analyzed the correlations between the device proximity(Q3) and whether participants want to be notified on the deviceor not (Q4) (see Figure 7). First, we calculated the correla-tion coefficient r for the proximity to the devices and if theparticipants want to be notified on the devices for every par-ticipant and every device. Then we calculated the averagecorrelation for all participants for the four devices. For a betteroverview, we only report average effect sizes of r > ±0.1.Using Cohen’s conventions [1] to describe the effect size, forall devices we found moderate to strong positive correlationsbetween the device proximity and whether or not notifica-tions should be shown on the device. We found the strongestcorrelation for PC (M = 0.73,SD = 0.21), followed by smart-watch (M = 0.63,SD = 0.30), tablet (M = 0.61,SD = 0.24)and smartphone (M = 0.45,SD = 0.26).
Furthermore, we calculated the correlations of participants’location (Q1) and Q4. For in transit, we found weak negativecorrelations for PC (M =−0.27,SD = 0.17) and tablet (M =−0.22,SD = 0.20). For at home, we found weak to moderatepositive correlations for tablet (M = 0.30,SD = 0.33) and PC(M = 0.26,SD= 0.31), and weak to moderate negative correla-tions for smartwatch (M =−0.25,SD = 0.35) and smartphone(M = −0.09,SD = 0.23). For at work/uni we found a weakpositive correlation for smartwatch (M = 0.26,SD= 0.23) anda weak negative correlation for tablet (M =−0.18,SD= 0.30).Restaurant and sport were not selected often enough for mean-ingful results.
We calculated the correlations of the number of people inparticipants’ surrounding (Q2) and Q4. When alone, wefound weak positive correlations for the PC (M = 0.26,0.15)

(a) Smartphone (b) Smartwatch (c) Tablet (d) PCFigure 7. Correlations between the proximity to the devices and if the participants want to receive notifications on the devices. The size of the points inthe scatter plots represents the frequency of occurrence of the single, normalized ratings.
and tablet (M = 0.13,SD = 0.22). When with “4-10” peo-ple, we found weak negative correlations for PC (M =−0.17,SD = 0.23) and tablet (M =−0.14,SD = 0.18). Whenwith “11-50” people, we found weak positive correlationsfor smartphone (M = 0.10,SD = 0.11) and smartwatch (M =0.14,SD = 0.26), and weak negative correlations for PC(M =−0.14,SD = 0.14) and tablet (M =−0.13,SD = 0.14).“More than 50” was not selected often enough for meaningfulresults.
We also calculated the correlations between screen-on eventsright before or after a questionnaire was triggered and Q4. Wefound moderate positive correlations for smartwatch (M =0.34,SD = 0.24) and tablet (M = 0.31,SD = 0.28), and aweak correlation for smartphone (M = 0.18,SD = 0.20). Wedid not log screen-on events for the PC. We also calculated thecorrelations between whether the devices were still (using theActivity Recognition API) and Q4. We found weak negativecorrelations for smartwatch (M = −0.29,SD = 0.30), tablet(M =−0.27,SD = 0.25) and smartphone (M =−0.13,SD =0.24). Again, the PC is excluded because no activity recogni-tion events were logged. We also calculated the correlationsbetween the active time and Q4. We found a strong positivecorrelation for PC (M = 0.51,SD = 0.20), a moderate positivecorrelation for the tablet (M = 0.37,SD = 0.32), and weakpositive correlations for smartwatch (M = 0.20,SD = 0.12)and smartphone (M = 0.18,SD = 0.20).
DISCUSSION AND LIMITATIONSWe conducted an ESM study with 16 participants and 4 dif-ferent types of smart devices for 7 days. All participants usedtheir own smartphones and PCs. Ten participants also usedtheir own tablets. We handed out smartwatches for all par-ticipants. Although all participants were used to the Androidplatform, in the future we plan to investigate if longer deviceusage has an influence on the preferred notification location.
On average, participants preferred to be notified on the smart-phone, followed by the smartwatch, the PC and the tablet.The smartwatch ranking second is interesting, because onlyone participant had used a smartwatch before. Comparingthe device usage of smartphones and smartwatches, we sawmore touch events on smartphones but more screen-on eventson smartwatches. This is likely because the screen of thesmartwatch turns on automatically when tilting the device.
We found that the device proximity has an influence forwhether or not the user wants to be notified on the device.To an extend, this finding seems obvious, as notificationswill not be noticed when the device is not near the user. Re-gardless, this is something that should be considered whencreating future multi-device aware notification systems. Pastresearch investigated the possibility of inferring where phonesare kept [17], work which should be extended to other devices.For the smartphone, the correlation was only moderate, butthis can be attributed to the fact that the smartphone was al-most always with the participants. Further, the participantspreferred to receive notifications on devices which have anactivated screen and they are currently interacting with. On theother hand, still devices are less suitable for notifications. Re-garding the user’s current location, PC and tablet both showednegative correlations for in transit but positive for at home. Atwork/uni the smartwatch was favored.To keep the questionnaire simple, we purposely did not spec-ify details about the incoming notification in Q4. In futureresearch, the type and content of notifications should be con-sidered by, for example, conducting interviews. Furthermore,notifications might be device specific (e.g. available updates)or independent (e.g. email, messaging). We also did not ad-dress which modalities should be used to notify the user, whichis another important aspect for future research.
CONCLUSIONIn this paper, we investigated notifications in multi-deviceenvironments. We conducted a 7-day in-situ study using theExperience Sampling Method (ESM) with 16 participants and4 different types of smart devices (smartphone, smartwatch,tablet and PC). Apart from ESM answers, we also collecteddevice usage data, such as screen-on events, touch events andwhether or not the device has been moved lately. Disregardingthe type or content of notifications, we found that the smart-phone is the preferred device on which to be notified, followedby the smartwatch, PC and tablet. Further, we found that theproximity to the device, whether the device is currently beingused and the user’s current location can be used to predictif the user wants to receive notifications on a device. Thefindings can be used to design future multi-device aware smartnotification systems. Future work should investigate the roleof the notification type and content, and collect qualitativedata to gain further insights.
ACKNOWLEDGMENTSThis work is supported by the German Ministry of Educationand Research (BMBF) within the DAAN project (13N13481)and by the DFG within the SimTech Cluster of Excellence(EXC 310/2).
REFERENCES1. Jacob Cohen. 1988. Statistical Power Analysis for the
Behavioral Sciences. 2nd edn. Hillsdale, New Jersey: L.(1988).
2. Sunny Consolvo and Miriam Walker. 2003. Using theExperience Sampling Method to Evaluate UbicompApplications. IEEE Pervasive Computing 2, 2 (2003),24–31. DOI:http://dx.doi.org/10.1109/MPRV.2003.1203750
3. Mihaly Csikszentmihalyi and Reed Larson. 2014.Validity and Reliability of the Experience-SamplingMethod. In Flow and the Foundations of PositivePsychology. Springer, 35–54.
4. Mary Czerwinski, Eric Horvitz, and Susan Wilhite. 2004.A Diary Study of Task Switching and Interruptions. InProceedings of the SIGCHI Conference on HumanFactors in Computing Systems (CHI ’04). ACM, NewYork, NY, USA, 175–182. DOI:http://dx.doi.org/10.1145/985692.985715
5. Joel E. Fischer, Chris Greenhalgh, and Steve Benford.2011. Investigating Episodes of Mobile Phone ActivityAs Indicators of Opportune Moments to DeliverNotifications. In Proceedings of the 13th InternationalConference on Human Computer Interaction with MobileDevices and Services (MobileHCI ’11). ACM, New York,NY, USA, 181–190. DOI:http://dx.doi.org/10.1145/2037373.2037402
6. Joel M Hektner, Jennifer A Schmidt, and MihalyCsikszentmihalyi. 2007. Experience Sampling Method:Measuring the Quality of Everyday Life. Sage.
7. Joyce Ho and Stephen S. Intille. 2005. UsingContext-aware Computing to Reduce the PerceivedBurden of Interruptions from Mobile Devices. InProceedings of the SIGCHI Conference on HumanFactors in Computing Systems (CHI ’05). ACM, NewYork, NY, USA, 909–918. DOI:http://dx.doi.org/10.1145/1054972.1055100
8. Shamsi T. Iqbal and Brian P. Bailey. 2008. Effects ofIntelligent Notification Management on Users and TheirTasks. In Proceedings of the SIGCHI Conference onHuman Factors in Computing Systems (CHI ’08). ACM,New York, NY, USA, 93–102. DOI:http://dx.doi.org/10.1145/1357054.1357070
9. Shamsi T. Iqbal and Eric Horvitz. 2010. Notifications andAwareness: A Field Study of Alert Usage andPreferences. In Proceedings of the 2010 ACM Conferenceon Computer Supported Cooperative Work (CSCW ’10).ACM, New York, NY, USA, 27–30. DOI:http://dx.doi.org/10.1145/1718918.1718926
10. Luis Leiva, Matthias Böhmer, Sven Gehring, andAntonio Krüger. 2012. Back to the App: The Costs of
Mobile Application Interruptions. In Proceedings of the14th International Conference on Human-computerInteraction with Mobile Devices and Services(MobileHCI ’12). ACM, New York, NY, USA, 291–294.DOI:http://dx.doi.org/10.1145/2371574.2371617
11. Tadashi Okoshi, Julian Ramos, Hiroki Nozaki, JinNakazawa, Anind K. Dey, and Hideyuki Tokuda. 2015.Reducing Users’ Perceived Mental Effort Due toInterruptive Notifications in Multi-device MobileEnvironments. In Proceedings of the 2015 ACMInternational Joint Conference on Pervasive andUbiquitous Computing (UbiComp ’15). ACM, New York,NY, USA, 475–486. DOI:http://dx.doi.org/10.1145/2750858.2807517
12. Martin Pielot, Karen Church, and Rodrigo de Oliveira.2014a. An In-Situ Study of Mobile Phone Notifications.In Proceedings of the 16th International Conference onHuman-computer Interaction with Mobile Devices &Services (MobileHCI ’14). ACM, New York, NY, USA,233–242. DOI:http://dx.doi.org/10.1145/2628363.2628364
13. Martin Pielot, Rodrigo de Oliveira, Haewoon Kwak, andNuria Oliver. 2014b. Didn’t You See My Message?:Predicting Attentiveness to Mobile Instant Messages. InProceedings of the 32Nd Annual ACM Conference onHuman Factors in Computing Systems (CHI ’14). ACM,New York, NY, USA, 3319–3328. DOI:http://dx.doi.org/10.1145/2556288.2556973
14. Alireza Sahami Shirazi, Niels Henze, Tilman Dingler,Martin Pielot, Dominik Weber, and Albrecht Schmidt.2014. Large-scale Assessment of Mobile Notifications. InProceedings of the SIGCHI Conference on HumanFactors in Computing Systems (CHI ’14). ACM, NewYork, NY, USA, 3055–3064. DOI:http://dx.doi.org/10.1145/2556288.2557189
15. Alireza Sahami Shirazi and Niels Henze. 2015.Assessment of Notifications on Smartwatches. InProceedings of the 17th International Conference onHuman-Computer Interaction with Mobile Devices andServices Adjunct (MobileHCI ’15). ACM, New York, NY,USA, 1111–1116. DOI:http://dx.doi.org/10.1145/2786567.2794338
16. Dominik Weber, Alireza Sahami Shirazi, and NielsHenze. 2015. Towards Smart Notifications UsingResearch in the Large. In Proceedings of the 17thInternational Conference on Human-ComputerInteraction with Mobile Devices and Services Adjunct(MobileHCI ’15). ACM, New York, NY, USA,1117–1122. DOI:http://dx.doi.org/10.1145/2786567.2794334
17. Jason Wiese, T. Scott Saponas, and A.J. Bernheim Brush.2013. Phoneprioception: Enabling Mobile Phones to InferWhere They Are Kept. In Proceedings of the SIGCHIConference on Human Factors in Computing Systems(CHI ’13). ACM, New York, NY, USA, 2157–2166. DOI:http://dx.doi.org/10.1145/2470654.2481296