In-situ High Temperature Phase Transformations in Ceramicstemperature phase transformation behavior....
91
In-situ High Temperature Phase Transformations in Ceramics Final Performance Report Prepared by Dr. Pankaj Sarin and Prof. Waltraud M. Kriven University of Illinois at Urbana-Champaign, Department of Materials Science and Engineering Submitted to the AFOSR Program Manager Dr. Joan Fuller AFOSR/NA (703) 696-7236 DSN 426-7236 FAX (703) 696-8451 E-Mail: [email protected] Contract/Grant #: FA 9550-06-1-0386 Reporting Period: 15 May 2006 to 31 March 2009 Date: July 28 th , 2009
Transcript of In-situ High Temperature Phase Transformations in Ceramicstemperature phase transformation behavior....

In-situ High Temperature Phase Transformations in Ceramics
Final Performance Report
Prepared by
Dr. Pankaj Sarin and Prof. Waltraud M. Kriven University of Illinois at Urbana-Champaign,
Department of Materials Science and Engineering
Submitted to the AFOSR
Program Manager Dr. Joan Fuller
AFOSR/NA (703) 696-7236 DSN 426-7236 FAX (703) 696-8451
E-Mail: [email protected]
Contract/Grant #: FA 9550-06-1-0386
Reporting Period: 15 May 2006 to 31 March 2009
Date: July 28th, 2009
masona
Typewritten Text
-A
masona
Typewritten Text
masona
Typewritten Text
AFRL-OSR-VA-TR-2012-0435
masona
Typewritten Text
masona
Typewritten Text

Table of Contents Section Page List of Tables
List of Figures 1. ABSTRACT 1
2. INTRODUCTION 2
2.1 Limitations, Issues and Concerns of Past Studies 2 2.2 Summary of Known, Non-ferroelectric Phase Transformations in Oxides 3 2.3 Applications of Phase Transformations 10
2.3.1 Transformation Toughening 10 2.3.2 Overall Toughening by Transformation Weakening 11 of Debonding Interphases 2.3.3 Ferroelasticity, Shape Memory Behavior and Large Force Actuation 12 2.3.4 Long Term Vision for Phase Transformations Study 14
3. STATEMENT OF OBJECTIVES 15
4. METHODS AND APPROACH 16
4.1 Outline of General Plan of Work 16 4.2 Literature Survey 17 4.3 Experimental Procedures and Instrumentation 21
4.3.1 High Temperature Thermal Analysis by TGA/DSC and Dilatometry 21 4.3.2 In situ High Temperature X-ray diffraction 21 4.3.3 Instrumentation for In situ High Temperature X-ray diffraction 22
4.3.3.1 Quadrupole Lamp Furnace (QLF) 23 4.3.3.2 Curved Image Plate (CIP) Detector 25
5. RESULTS AND DISCUSSION 28
5.1 Literature Search 28 5.2 In situ High Temperature X-Ray Diffraction using Synchrotron Radiation 35 5.2.1 Rapid High Temperature XRD using QLF and CIP detector 35 5.2.2 Relevance of Understanding the Crystallographic Thermal Expansion 37 Behavior of Material Systems 5.3 High Temperature Studies on Candidate Material Systems 41 5.3.1 Y2SiO5 41 5.3.2 CaWO4 53 5.3.3 CePO4 61 5.3.4 YTaO4 68
6. SUMMARY 74
7. REFERENCES 75
List of Tables Table 1. Examples of First Order Displacive Transformations in Ceramics.
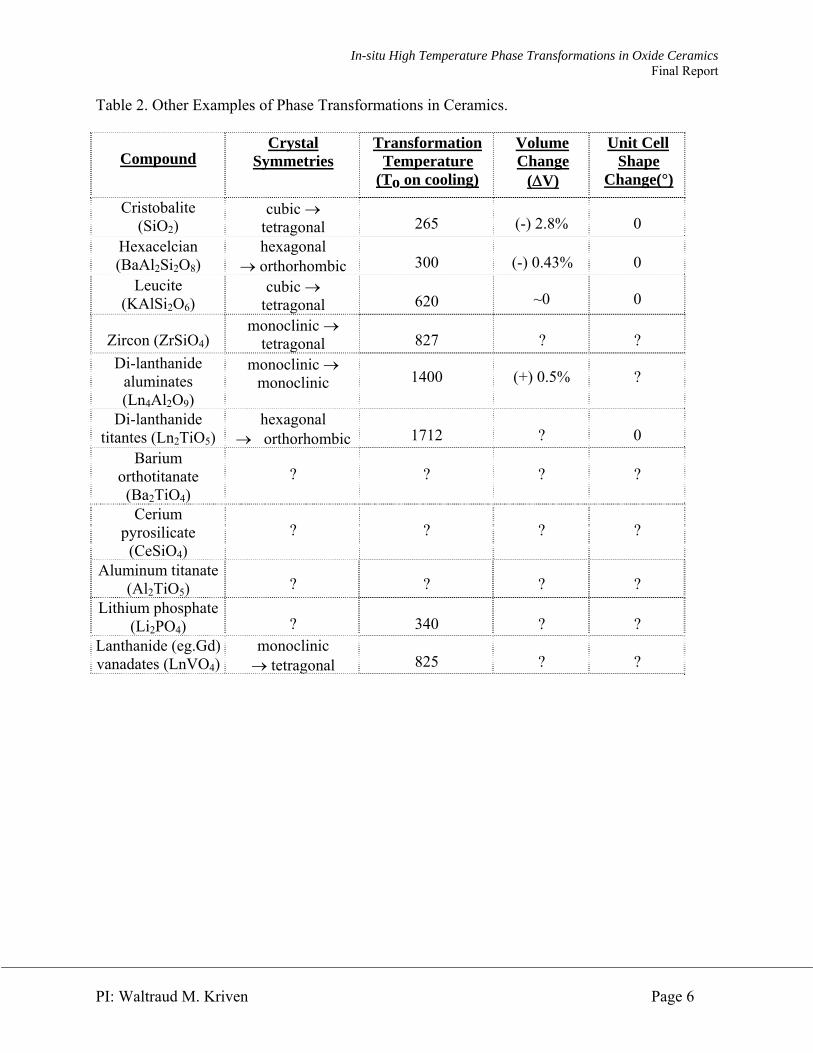
Table 2. Other Examples of Phase Transformations in Ceramics.
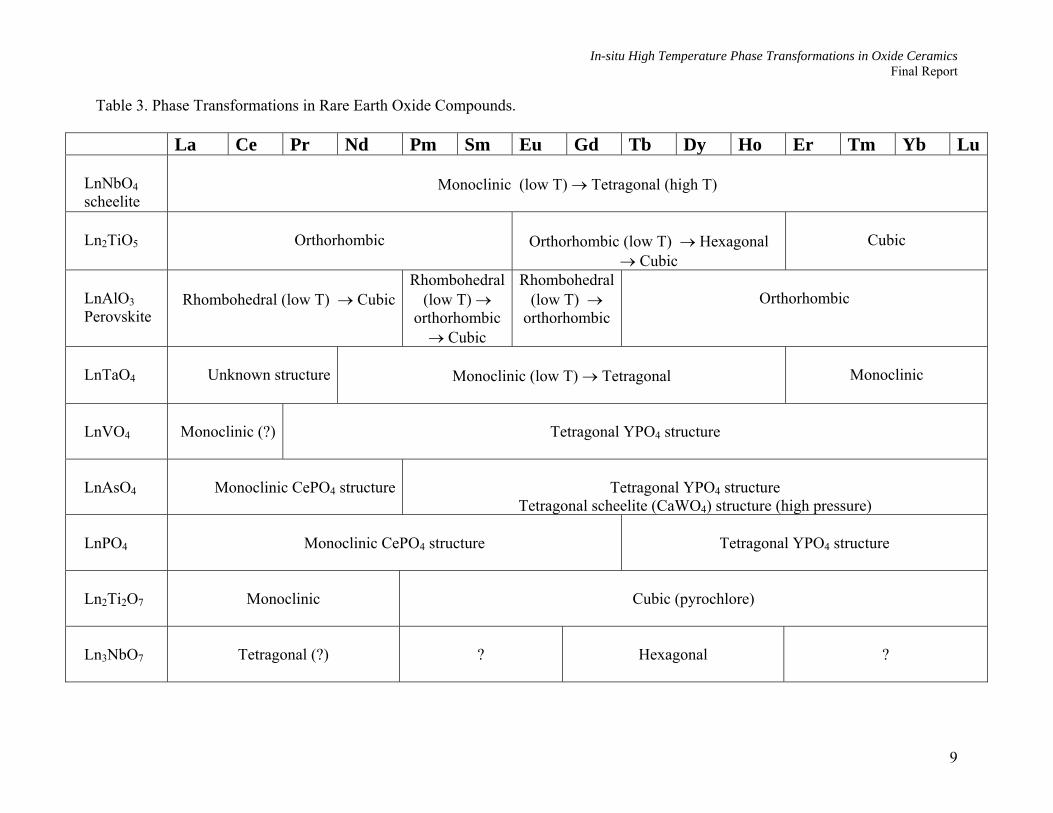
Table 3. Phase Transformations in Rare Earth Oxide Compounds.
Table 4. Crystal chemical classes of pure inorganic ferroelastics. 71
Table 5. Comprehensive listing of available databases for this project.
Table 6. List of elements excluded from search for high temperature phase transformation properties.
Table 7. Comprehensive listing of availab e databases for this project. l
Table 8. Reported polymorphs of Y2SiO5.
Table 9. Thermal expansion of HT-Y2SiO5 as determined from HTXRD studies using synchrotron radiation. Polynomial expressions for CTEs along each of the crystal axis, and for volume expansion are reported for 20 to 1455 ºC temperature range.
Table 10. Thermal expansion of HT-Y2SiO5 as determined from HTXRD studies using synchrotron radiation. Polynomial expressions for the eigenvectors for the thermal expansion tensor reported for 500 to 1450 ºC temperature range.
Table 11. Thermal expansion of CaWO4 as determined from HTXRD studies using synchrotron radiation. Polynomial expressions for CTEs along each of the crystal axis, their Linear Average and for volume expansion are reported for the 700 to 1450 ºC temperature range.
Table 12. Thermal expansion of CePO4 as determined from HTXRD studies using synchrotron radiation. Polynomial expressions for CTEs along each of the crystal axis, their Linear Average and for volume expansion are reported for 20 to 1575 ºC temperature range.

List of Figures Figure 1. Lattice parameters a, b and c of mullite [(a) to (c), respectively], as a function of
temperature. Full circles are experiments on grey mullite, triangles are experiments on annealed white mullite. Error bars are smaller than the symbols. The uncertainty of temperature was about ±10 K. Solid and dotted lines are only guides to the eyes.2
Figure 2. Thermal expansion of HfO2 measured by dilatometry in an inert atmosphere. Samples were heated at 10 ºC/min up to 2800 ºC in argon atmosphere. The inset shows the sintered specimen before and after the measurements. The monoclinic to tetragonal transformation occurred at ~1820 °C.
Figure 3. Schematic diagram illustrating the mechanism of “transformation weakening of ceramic interphases” leading to overall toughening of fiber reinforced, fibrous monolithic or laminated ceramic matrix composites.49 50 ,
Figure 4. Comparison of hysteresis curves for ferroic materials.
Figure 5. Schematic presentation of the ferroelastic hysteresis loop showing the characteristic quantities es or (εs) indicating the macroscopic spontaneous distortion of the crystal without external stress. The coercive stress is defined by the intersection of the hysteresis with the stress axis at zero strain.
Figure 6. Suggested research and potential applications of phase transformations in ceramics.
Figure 7. Photographs of the (a) Netzsch Simultaneous Thermal Analyzer (STA 409 CD) and (b) Netzsch Dilatometer (DIL 402 E) equipment used for DTA/DSC/TGA and dilatometric studies, respectively.
Figure 8. Schematic to show the intersection of the real images of lamp filaments to generate the thermal image or the “hot spot”.74
Figure 9. Photograph of the quadrupole lamp furnace in operation at the UNICAT 33BM beamline at APS, Argonne National Laboratory, Argonne, IL.
Figure 10. A side-view of the CIP detector at the 33-BM UNICAT facility at APS, ANL, Argonne, IL.
Figure 11. Comparison of FWHM measured using the LaB6 standard for different capillary sizes, at the same incident wavelength. The FWHM measured using an analyzer crystal is also included for comparison.37
Figure 12. The Periodic Table of elements showing the expanse of the literature search, to identify ceramic materials with reported high temperature phase transformation properties.

Figure 13. Screenshot of the browse phase feature of the database. In this view, the user can look for phases of a compound by name or formula, or the user can view phases ordered by temperature.
Figure 14. Screenshot of a single compound within the database. All data entered for that compound is shown in a concise view. Since the database features dynamic properties of unlimited type and number, properties that do not have an entry for the current compound are not shown.
Figure 15. Screenshot of the phase transformation search feature of the database. Searches are available across all compounds and allow data ranges. The “similar series” box shows part of the fuzzy search feature. In the box is another phase transformation that the database thinks might be of use to the user.
Figure 16. Screenshot of the property search feature. Searches are available across all transformations and allow data ranges. The “similar series” box shows part of the fuzzy search feature. In the box is another compound that the database thinks might be of use to the user.
Figure 17. Schematic of the HTXRD experiments conducted with the CIP detector and QLF.87
Figure 18. Crystallographic thermal expansion measurements of MgO from HTXRD studies using the CIP detector and QLF. (Note: TSet = 1000 ºC actually corresponds to approximately 1600 ºC actual sample temperature).
Figure 19. In situ HTXRD studies of the monoclinic to tetragonal transformation in hafnia (HfO2) on heating. (a) Variation of lattice parameters (b) Variation of volume to indicating a -2.71% change.
Figure 20. Three dimensional representation of the thermal expansion coefficients (CTEs) of HfO2 determined from powder XRD patterns acquired at (a) 70 ºC and (b) 1825 ºC. The CTE values along the x, y, and z-axis are in x 10-6/ ºC.
Figure 21. Phase diagram of the Y2O3-SiO2 system where the oxide ratios of compounds are given as Y2O3:SiO2.99
Figure 22. Crystal structure of the HT-Y2SiO5.
Figure 23. Processing flowchart of the Y2SiO5 ceramic powders by the PVA method.
Figure 24. Room temperature XRD patterns from the synthesized Y2O3.SiO2 sample powders when heat treated to 800ºC, 1300ºC, and to 1500ºC in air for 1 hour each.
Figure 25. DSC/TGA studies on HT-Y2SiO5.
Figure 26. Dilatometry studies on HT-Y2SiO5.
Figure 27. In-situ HTXRD patterns of HT-Y2SiO5.

Figure 28. Lattice expansion of HT-Y2SiO5.
Figure 29. CTEs along different crystallographic axes in HT-Y2SiO5.
Figure 30. Plot showing CTE vs T along the principal axes in HT-Y2SiO5.
Figure 31. Orientation of eigenvectors wrt crystallographic a- and c-axes in HT-Y2SiO5.
Figure 32. Graphic representation of the orientation of eigenvectors wrt crystallographic a- and c-axes in HT-Y2SiO5 at 850ºC and at 1450 ºC.
Figure 33. Thermal ellipsoid or thermal expansion diagram for HT-Y2SiO5 at 1450 ºC.
Figure 34. Unit and primitive cell of CaWO4 scheelite structure.111
Figure 35. HTXRD patterns for CaWO4 collected from 20 ºC to 1450 ºC, in air using synchrotron radiation.
Figure 36. Lattice expansion of CaWO4 along its crystallographic axes.
Figure 37. Unit cell volume expansion of CaWO4.
Figure 38. CTEs along different crystallographic axes in CaWO4.
Figure 39. Anisotropy in expansion of the CaWO4 crystal.
Figure 40. Crystal structure of CePO4 viewed down the b-axis.
Figure 41. Flow chart of synthesis of CePO4.
Figure 42. Room temperature XRD pattern of the synthesized CePO4 phase.
Figure 43. Dialtometric studies on CePO4.
Figure 44. HTXRD patterns collected using powder CePO4 specimen and synchrotron radiation over a temperature range from 20 ºC to 1575 ºC in air.
Figure 45. Lattice expansion of CePO4 along different crystallographic axes.
Figure 46. Change in the monoclinic angle and the unit cell volume with temperature in the CePO4 system.
Figure 47. Coefficient of thermal expansion of CePO4 along different crystallographic axes.
Figure 48. Coefficient of volume expansion of CePO4 as determined using HTXRD.
Figure 49. Crystal structure of YTaO4; b-axis projection.
Figure 50. Flow chart for synthesis of YTaO4.

Figure 51. XRD pattern of the synthesized monoclinic YTaO4 phase.
Figure 52. TGA/DSC studies on powder sample of YTaO4 system.
Figure 53. Dilatometry studies of YTaO4 suggest possible transformation on cooling at ~1400 ºC. The solid line represents strain (dL/L0) while the dotted line is the calculated α, linked to the Y axis on the right hand side.
Figure 54. HTXRD studies on powder sample of YTaO4 using the QLF and a Si-linear strip detector. (Note: The temperature labeled in the figure is only Tset and is approximately 200 ºC lower than the actual sample temperature).

In-situ High Temperature Phase Transformations in Oxide Ceramics Final Report
1. Abstract
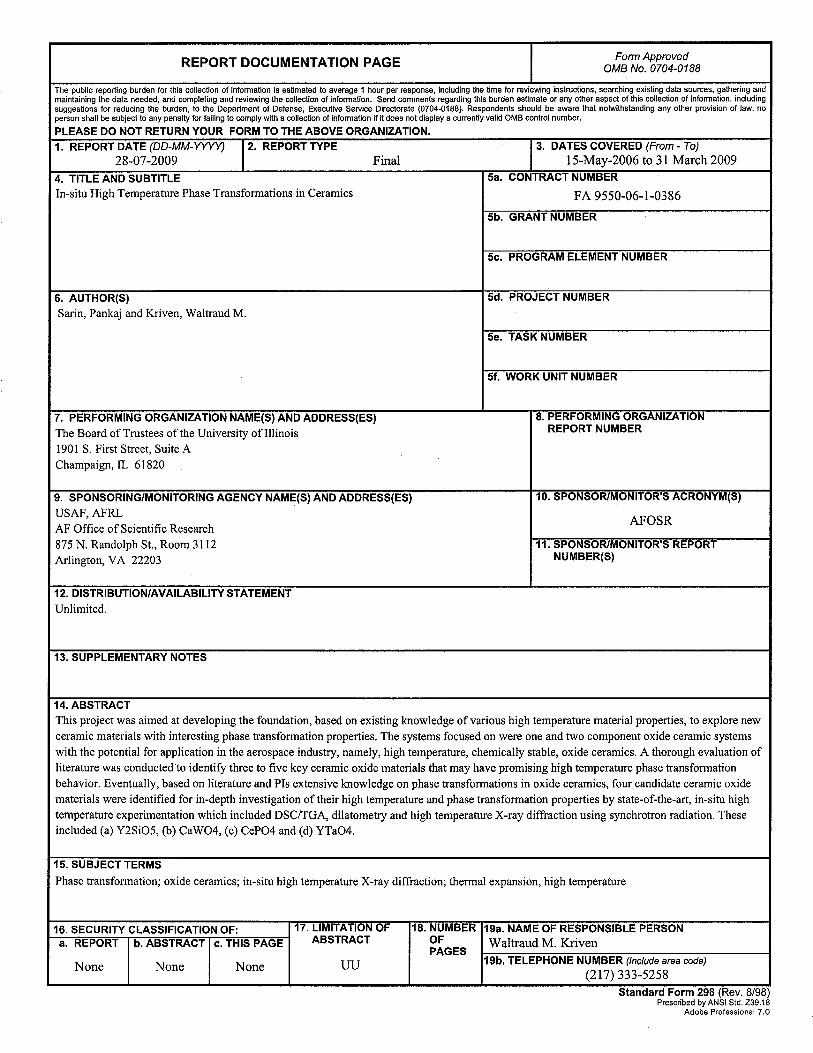
This project was aimed at developing the foundation, based on existing knowledge of various high temperature material properties, to explore new ceramic materials with interesting phase transformation properties. The systems focused on were one and two component oxide ceramic systems with the potential for application in the aerospace industry, namely, high temperature, chemically stable, oxide ceramics. A thorough evaluation of literature was conducted to identify three to five key ceramic oxide materials that may have promising high temperature phase transformation behavior. Eventually, based on literature and PIs extensive knowledge on phase transformations in oxide ceramics, four candidate ceramic oxide materials were identified for in-depth investigation of their high temperature and phase transformation properties by state-of-the-art, in-situ high temperature experimentation which included DSC/TGA, dilatometry and high temperature X-ray diffraction using synchrotron radiation. These included (a) Y2SiO5, (b) CaWO4, (c) CePO4 and (d) YTaO4.
PI: Waltraud M. Kriven Page 1

In-situ High Temperature Phase Transformations in Oxide Ceramics Final Report
2. Introduction To meet the challenge in designing new, high temperature materials for current and future aerospace needs, it is necessary to carry out basic scientific research on the fundamental physical and chemical properties of ceramics. The discovery of new phase transformations has many potential applications: for example in reliable, high temperature materials for the next generation of fuel efficient airplane engines, ultra high temperature materials for space exploration and re-entry vehicles, MEMS devices and smart materials systems, as well as heavy duty ground-based motors. Furthermore, with the nano-revolution, it is quite possible to engineer ceramic components with microstructural control and thus to tailor their properties as desired. This is where fundamental knowledge on anisotropic behavior of materials can be suitably exploited. However, this warrants accurate information on behavior of materials (both thermal expansion as well as transformation) along different crystallographic axes as a function of temperature - which is often missing for even some of the key, known, ceramic materials. 2.1 Limitations, Issues and Concerns of Past Studies In the past, the behavior and properties of ceramics have been measured using essentially an engineering approach. Literature reports sometimes describe conventionally prepared, incompletely reacted ceramics or those containing grain boundary amorphous phases. Such “composites” were studied by X-ray diffraction (XRD), dilatometry, thermal analyses (thermo gravimetric analysis - TGA, differential scanning calorimetry - DSC) optical microscopy, without much knowledge of the microstructure, porosity, strain or presence of microcracks within the material. More recently, studies by electron microscopy (scanning electron microscopy - SEM and transmission electron microscopy - TEM), have identified important microstructural considerations, such as the critical particle size effect controlling the onset of transformation.1 Phase transformations and phase diagrams were predominantly examined by “ex situ” studies, relying on the assumption that quenching would capture high temperature phases. This however, is not necessarily so, particularly in the case of displacive transformations having low activation energies. Erroneous results have been reported from metastable phases and those with partially quenched-in lattice parameters.
Earlier, in situ studies were able to access only modest temperatures and needed inert atmospheres or vacuum for higher temperatures. However, in the case of oxides, measurements under vacuum or reducing atmospheres can be erroneous, due to the unsaturated state of oxygen chemistry leading to defects such as oxygen vacancies, and shifting or total suppression of phase transformations. A classic example of this is fully or partially stabilized zirconia,1 where the addition of Ca2+, Mg2+, Y3+ or Ce4+ cations disturbs the oxygen equilibrium composition in zirconia, necessitating oxygen vacancy defects and stabilizing the high temperature phases in cubic or tetragonal symmetry.
Crystallographic parameters and thermal expansion coefficients of oxides depend on their level of oxygen saturation, which is a function of their processing conditions as well as experimental measurement conditions. For example, Fig. 1 illustrates why oxide phase diagrams need to be measured in air. Phase transformations can be suppressed, temperatures of invariant reactions can be shifted, and crystallographic parameters can be varied significantly. This has been quantitatively demonstrated, for example, in another classic example of mullite
PI: Waltraud M. Kriven Page 2

In-situ High Temperature Phase Transformations in Oxide Ceramics Final Report
Temperature [K] Temperature [K] Temperature [K]
Latti
ce P
aram
eter
‘a’ [
Å]
Latti
ce P
aram
eter
‘b’ [
Å]
Latti
ce P
aram
eter
‘c’ [
Å]
(a) (b) (c)
Temperature [K] Temperature [K] Temperature [K]
Latti
ce P
aram
eter
‘a’ [
Å]
Latti
ce P
aram
eter
‘b’ [
Å]
Latti
ce P
aram
eter
‘c’ [
Å]
(a) (b) (c)
Figure 1. Lattice parameters a, b and c of mullite [(a) to (c), respectively], as a function of temperature. Full circles are experiments on grey mullite, triangles are experiments on annealed white mullite. Error bars are smaller than the symbols. The uncertainty of temperature was about ±10 K. Solid and dotted lines are only guides to the eyes.2
(3Al2O3•2SiO2), which is white as a normal oxygen saturated ceramic, and black or gray when it is oxygen deficient.2, 3 Bulk samples of mullite were hot pressed under vacuum in a graphite die and appeared black upon densification. Their crystallographic lattice parameters were measured by in situ, hot stage, neutron diffraction to 1600 °C. Due to heating in air, the sample had turned white, and was oxygen saturated.
When the in situ measurements were repeated, a different set of lattice and thermal expansion parameters were observed, and subsequent cycled measurements indicated that the parameters of the oxygen saturated mullite were then reproducible. The behavior was observed for the crystallographic unit cell volume, which was calculated from the crystallographic axes, each of which was different due to oxygen deficiency. Similarly, the thermal expansion of HfO2 measured by dilatometric methods under inert atmospheric conditions was also compromised by the oxygen vacancies, as is evident from the change in color of the sample (see Fig. 2). Therefore it is important that phase transformation behavior, lattice parameters, and thermal expansion properties of ceramic oxides are measured in air. 2.2 Summary of Known, Non-ferroelectric Phase Transformations in Oxide Ceramics
Reviews of published literature on non-ferroelectric phase transformations in ceramics and minerals have been carried out by the PI4-8 over the years, summarizing reports of phase transformations. A current working summary is listed in Tables 1, 2 and 3. It should be noted that the Tables are only two dimensional, in that only one transformation is listed per each composition. In reality, each compound may be a system exhibiting a sequence of transformations. For example, the dicalcium silicate system exhibits a sequence of six phases with five transformations separating them during cooling from high temperatures.9-14
PI: Waltraud M. Kriven Page 3

In-situ High Temperature Phase Transformations in Oxide Ceramics Final Report
HfO2 Dilatometry Samples
Before After
Figure 2. Thermal expansion of HfO2 measured by dilatometry in an inert atmosphere. Samples
were heated at 10 ºC/min up to 2800 ºC in argon atmosphere. The inset shows the sintered specimen before and after the measurements. The monoclinic to tetragonal transformation occurred at ~1820 °C.
Over the past 40 years, the PI and co-workers have been studying phase transformations
in oxide ceramics using predominantly TEM techniques. The systems studied include dicalcium silicate,9-14 zirconia,1, 15-21 lanthanide sesquioxides,22-25 rare earth aluminates,26, 27 hexacelsian (BaAl2Si2O8),28, 29 nickel sulfide (NiS),30, 31 enstatite (MgO•SiO2),32 rare earth niobates (Ln NbO4)33-35 and rare earth titanates (LnTiO5).36 In addition, the PI has accurately measured the axial thermal expansion coefficients of mullite (3AlsO3•2SiO2) to 1400 °C in air,2, 37 was well as of hexacelsian (BaAl2Si2O8) to 850 °C.28, 29
PI: Waltraud M. Kriven Page 4

In-situ High Temperature Phase Transformations in Oxide Ceramics Final Report
Table 1. Examples of First Order Displacive Transformations in Ceramics.
Compound
Crystal Symmetries
TransformationTemperature
(To on cooling)
Volume Change (ΔV)
Unit Cell Shape
Change(°)
ZrO2 tetragonal→ monoclinic
950
(+)4.9% (R.T.)
9
Ln2O3 (type)
monoclinic→ cubic
600–2200 (+)10% 10
Ca2SiO4 (K2SO4-type)
monoclinic→ orthorhombic
490 (+)12% 4.6
Sr2SiO4 (K2SO4-type)
orthorhombic → monoclinic
90 0.2% 2
NiS rhombohedral → hexagonal
379 (+)4% —
2Tb2O3.Al2O3 (type)
orthorhombic → monoclinic
1070 (+)0.67% 18.83
PbTiO3 cubic→ tetragonal
445 (+)1% 0
KNbO3 tetragonal → orthorhombic
225 ~0% 0
LuBO3 hexagonal → rhombohedral
1310 (+)8% —
MgSiO3 (CaSiO3-type) (FeSiO3-type)
orthorhombic → monoclinic
865 (-)5.5% 18.3
YNbO4 (LnNbO4-type)
tetragonal → monoclinic
900 (-) 1.8% 4.53
LnBO3(type) hexagonal → hexagonal
550–800 (-)8.2% —
PI: Waltraud M. Kriven Page 5
In-situ High Temperature Phase Transformations in Oxide Ceramics Final Report
PI: Waltraud M. Kriven Page 6
Table 2. Other Examples of Phase Transformations in Ceramics.
Compound Crystal
Symmetries Transformation
Temperature (To on cooling)
Volume Change
(ΔV)
Unit Cell Shape
Change(°)
Cristobalite (SiO2)
cubic → tetragonal 265 (-) 2.8% 0
Hexacelcian (BaAl2Si2O8)
hexagonal → orthorhombic 300 (-) 0.43% 0
Leucite (KAlSi2O6)
cubic → tetragonal 620 ~0 0
Zircon (ZrSiO4) monoclinic →
tetragonal 827 ? ? Di-lanthanide
aluminates (Ln4Al2O9)
monoclinic → monoclinic 1400 (+) 0.5% ?
Di-lanthanide titantes (Ln2TiO5)
hexagonal →�orthorhombic 1712 ? 0
Barium orthotitanate (Ba2TiO4)
? ? ? ?
Cerium pyrosilicate
(CeSiO4) ? ? ? ?
Aluminum titanate (Al2TiO5) ? ? ? ?
Lithium phosphate (Li2PO4) ? 340 ? ?
Lanthanide (eg.Gd) vanadates (LnVO4)
monoclinic → tetragonal 825 ? ?
In-situ High Temperature Phase Transformations in Oxide Ceramics Final Report
Table 3. Phase Transformations in Rare Earth Oxide Compounds.
La Ce Pr Nd Pm Sm Eu Gd Tb Dy Ho Er Tm Yb Lu LnNbO4 scheelite
Monoclinic (low T) → Tetragonal (high T)
Ln2TiO5
Orthorhombic
Orthorhombic (low T) → Hexagonal
→ Cubic
Cubic
LnAlO3 Perovskite
Rhombohedral (low T) → Cubic
Rhombohedral (low T) →
orthorhombic→ Cubic
Rhombohedral (low T) →
orthorhombic
Orthorhombic
LnTaO4
Unknown structure
Monoclinic (low T) → Tetragonal
Monoclinic
LnVO4
Monoclinic (?)
Tetragonal YPO4 structure
LnAsO4
Monoclinic CePO4 structure
Tetragonal YPO4 structure
Tetragonal scheelite (CaWO4) structure (high pressure) LnPO4
Monoclinic CePO4 structure
Tetragonal YPO4 structure
Ln2Ti2O7
Monoclinic
Cubic (pyrochlore)
Ln3NbO7
Tetragonal (?)
?
Hexagonal
?
9
High Temperature Phase Transformations in Oxide Ceramics PI: Waltraud M. Kriven
2.3 Applications of Phase Transformations 2.3.1 Transformation Toughening
The phase transformation in zirconia has been widely studied around the world, and is
now a well-documented example of “transformation toughening” of ceramics.1, 15-21, 38-46 The toughening arises from the tetragonal to monoclinic crystal structure change which is accompanied by a 3.04% volume increase on cooling through its transformation temperature at 950 °C. Through doping and the creation of oxygen vacancies, as well as microstructural control, the transformation can be metastably retained in the tetragonal solid solution phase down to room temperature, where (including the accumulated thermal contraction) the zirconia undergoes a total volume expansion of 4.9%. This set off a wave of global studies on the mechanism of transformation toughening for over 25 years. Toughened zirconia-based ceramics have found widespread applications ranging from wear resistant, diesel engine components, thermal shock resistant, tundra dishes for pouring of molten steels, to zirconia ferrules, to toughened, ceramic hip implants. It is fair to state that the ceramics community, including the PI have learnt a lot about the design of transformation toughened ceramics from the now well-documented case study of zirconia-toughened ceramics.
Since the toughening in zirconia was attributed to the positive volume change accompanying the transformation, Kriven postulated the existence of other possible transformation tougheners alternative to zirconia.5-8 It was found that those transformations having large positive volume changes on cooling were difficult to initiate under normal three-point flexure conditions. However, for applications in ceramic armor, with the application of extremely large stresses and shock waves accompanying ballistic impacts, these concepts should be revisited. Examples of systems investigated are the following.
Preliminary evidence has been found for transformation toughening of a calcium zirconate matrix by a dicalcium silicate toughener, which undergoes a +12 % volume change, particularly with judicial design of the critical particle size and microstructure.12, 47, 48 Likewise, preliminary work indicates the possibility of high temperature (> 1000 ºC) transformation toughening of magnesia by dispersed, second phase particles of terbia (Tb2O3).22, 32
The monoclinic to cubic transformation in the lanthanide sesquioxides is accompanied by an +8.5% volume change on cooling through 1590°C in Tb2O3. However, relaxation effects at such high temperature suggest the possibility of a limited application region due to microstructural instability. Further work needs to be done to ascertain the potential of transformation toughening with rare earth oxides. The ~4% volume increase in NiS particles dispersed in the compressed surface zone of tempered glass was found to be deleterious and led to shattering of the glass.30, 31
2.3.2 Overall Toughening by Transformation Weakening of Debonding Interphases
While transformation toughening with zirconia has yielded an approximately threefold increase in toughness in zirconia based ceramics such as partially stabilized zirconia (PSZ), zirconia tetragonal polycrystals (ZTP), and zirconia toughened alumina (ZTA), it is known that even larger toughening effects can be realized in fiber reinforced, ceramic matrix composites (CMCs). Toughness of up to 30 MPa•m1/2 have been achieved in silicon carbide reinforced with continuous, graphite-coated, silicon carbide fibers. The graphite acts as a debonding layer around
10

High Temperature Phase Transformations in Oxide Ceramics PI: Waltraud M. Kriven
the fiber, which, due to its superior strength, is able to carry the load, even though the matrix is significantly microcracked. The debonding occurring at the fiber matrix interface is an essential requirement for decoupling the matrix so that the fiber can exert crack closure forces. While this is an impressive achievement, the SiC system is limited to use under vacuum, since for example, airplane engines operate in air or a highly oxidizing atmosphere, and usually at very high temperatures conducive to oxidation.
Since a positive volume change led to transformation toughening, it was reasoned by Kriven4-8, 32, 49-51 that a negative volume change should lead to “transformation weakening.” This was postulated to be responsible for the deleterious effect of the orthorhombic (clinoenstatite) to monoclinic (orthoenstatite) transformation in enstatite (MgO•SiO2). TEM studies revealed this assumption to be correct.4-8, 51 Enstatite, a pyroxene, chain silicate is the major component of steatite ceramics, which were mysteriously observed to disintegrate when the
Figure 3. Schematic diagram illustrating the mechanism of “transformation weakening of ceramic interphases” leading to overall toughening of fiber reinforced, fibrous monolithic or laminated ceramic matrix composites.49, 50
enstatite was above a 7 μm critical grain size. Recently, this mechanism of toughening has been demonstrated50 with the cubic to tetragonal transformation of a cristobalite (SiO2) interphase in a mullite-cordierite, laminated matrix, and a US patent was granted.52
Fig. 3 49, 50 is a schematic diagram illustrating “transformation weakening of ceramic interphases” leading to overall toughening of a ceramic matrix composite. In thermally induced transformations, all interphases are pre-transformed before the approach of a crack, with some consequent loss of overall strength of the material. In the ideal, shear-stress induced case, an oncoming crack induces a transformation in its immediate environment, with strength only minimally reduced throughout the bulk. Maximum toughening is achieved, since the propagating crack needs to do work to overcome the nucleation barrier and cause transformation, and onset of the other synergistic toughening mechanisms (e.g., crack formation) occurs.
11

High Temperature Phase Transformations in Oxide Ceramics PI: Waltraud M. Kriven
2.3.3 Ferroelasticity, Shape Memory Behavior and Large Force Actuation
Ferroic behavior is observed in ferroelectric, ferroelastic and ferromagnetic materials.53-68 Their behavior is compared in the text book example of Fig. 4. They share the common feature of a hysteresis loop arising from poling of electric, magnetic or anisotropic domains.
Figure 4. Comparison of hysteresis curves for ferroic materials.
Figure 5. Schematic presentation of the ferroelastic hysteresis loop showing the characteristic quantities es or (εs) indicating the macroscopic spontaneous distortion of the crystal without external stress. The coercive stress is defined by the intersection of the hysteresis with the stress axis at zero strain.
12

High Temperature Phase Transformations in Oxide Ceramics PI: Waltraud M. Kriven
Ferroic domains arise from a ferroic (ferroelectric, ferromagnetic or ferroelastic) transformation, in which there is a group-subgroup symmetry relationship.68 A ferroic transformation involves a crystal structure change, but ferroic domain rearrangements do not, as they are rearrangements in the microstructure without any change in crystal structure. Basically the domains try to align themselves in the direction of the coercive force, be it electric, magnetic or mechanical. The detailed parameters for ferroelasticity are marked in Fig. 5.
Shape memory behavior in metals is crystallographically and microstructurally similar to ferroelastic domain rearrangement.69, 70 Furthermore, it is feasible that large force actuation may be realized by the ferroic alignment of domains under electric, magnetic or mechanical coercive forces. The current actuator widely used is lead zirconate titanate system (PZT) whose transformation is accompanied by a relatively small spontaneous strain of 0.01 %. While this strain allows cycling through the transformation with kilohertz frequencies, its magnitude relegates PZT to be a very small force actuator. Furthermore it cannot be used above its relatively low Curie temperature of ~120° C.
Table 4. Crystal chemical classes of pure inorganic ferroelastics. 71
While ferroelastic transformations in perovskites and ferroelectricity have been relatively widely studied, ferroelasticity has received relatively little attention. Salje63 has written a mathematical, theoretical treatment based on Group Theory in his book. The PI has found the publication of Dudnik and Kiosse71 in the former Soviet Union to be a good framework for choosing a ferroelastic system for study. According to their perspective, the reason that perovskite-based structures such as PZT have such small spontaneous strains is that they are based on a “cage structure” with limited atomic mobility and structural rearrangements.
13

High Temperature Phase Transformations in Oxide Ceramics PI: Waltraud M. Kriven
According to their classification in Table 4 71 phase transformations accompanied by large force actuations should be found in structures containing “ortho groups” such as the palmierites and fergussonite structures. On the basis of this thinking, the PI had studied the rare earth niobates and observed spontaneous strains of 6.35 % in the tetragonal to monoclinic RNbO4 transformations, confirming Dudnik and Kiosse’s hypothesis.33, 34 2.3.4 Long Term Vision for Phase Transformations Study
Fig. 6 below summarizes the PI’s long term view of research in phase transformations with tentative applications indicated, depending on the volume changes and/or unit cell shape changes.
Long term vision for study of phase transformations in structural ceramics and composites
Displacive phase transformations an be accompanied by volume changes and/or by shape changes
Large volume changes (ΔV)
• Transformation toughening (e.g. zirconiaceramics, rare-earth oxides)
• Transformation weakening of interphases, giving overall toughening of fiber-reinforced composites or fibrous monoliths (e.g. enstatite, cristobalite)
Structural ceramics for airplane and Ground-based turbine engines
Unit cell shape changes (Δβ)
• Ferroelastic phase transformations• Ferroelasticity• Toughening by twin flipping
Large force actuation (e.g. for MEMS devices)Shape memory ceramics
Long term vision for study of phase transformations in structural ceramics and composites
Displacive phase transformations an be accompanied by volume changes and/or by shape changes
Large volume changes (ΔV)
• Transformation toughening (e.g. zirconiaceramics, rare-earth oxides)
• Transformation weakening of interphases, giving overall toughening of fiber-reinforced composites or fibrous monoliths (e.g. enstatite, cristobalite)
Structural ceramics for airplane and Ground-based turbine engines
Unit cell shape changes (Δβ)
• Ferroelastic phase transformations• Ferroelasticity• Toughening by twin flipping
Large force actuation (e.g. for MEMS devices)Shape memory ceramics
Unit cell shape changes (Δβ)
• Ferroelastic phase transformations• Ferroelasticity• Toughening by twin flipping
Large force actuation (e.g. for MEMS devices)Shape memory ceramics
Figure 6. Suggested research and potential applications of phase transformations in ceramics.
14

High Temperature Phase Transformations in Oxide Ceramics PI: Waltraud M. Kriven
3. Statement of Objectives
There is a genuine need for development of materials that undergo phase transformations at high temperatures in air. The current understanding of this important property of some materials, which can find use in advanced technological applications, is flawed or incomplete. This is most likely to be due to the experimental limitations and difficulties in gathering such data. The primary goal of this project was to identify three to five key ceramic oxide materials that may have promising high temperature phase transformation behavior, and to thoroughly investigate their transformation properties by state-of-the-art, in-situ high temperature experimentation. The focus was on oxide materials with potential for application in the aerospace industry, for high temperature uses. The ultimate objective was to introduce an efficient, and comprehensive methodology, including experimentation, to identify and investigate high temperature properties and behavior of materials based on fundamental crystallographic measurements performed in-situ at high temperatures.
15

High Temperature Phase Transformations in Oxide Ceramics PI: Waltraud M. Kriven
4. Methods and Approach 4.1 Outline of General Plan of Work The work proposed in the project can be broadly classified into the following tasks/categories:
I. Literature Search II. Preliminary Investigations using screening techniques (TGA, DSC, dilatometry)
III. Phase Transformation Studies
Literature Search: The primary objective of this task was to identify the key ceramic oxide materials, both single phase and binary oxides, by exhaustively combing the existing literature on phase transformations. The PI’s extensive research has underscored the need for a structured approach towards “discovery” of new materials as well as a frame of reference for high temperature applications of importance to aerospace applications In this research project a focused effort was undertaken to identify key ceramic oxide materials, both single phase and binary oxides, by exhaustively combing the existing literature on phase transformations. The purpose of the this search was to shortlist candidate material systems for further investigations of their high temperature properties. The criteria for selection of compounds included (a) stability in air at high temperatures, (b) presence of, or promise for, high temperature phase transformations which are accompanied with significant volume/shape changes. Emphasis was on identifying compounds which were light weight. The scientific literature was extensively searched for any reported high temperature properties of these materials, including thermal expansion, phase transformation etc.
Preliminary Investigations: Powder samples of the candidate compounds, identified from the screening of existing scientific literature and from the PI's vast experience, were procured or prepared, as required. Preliminary screening of the high temperature phase transformation behavior was conducted on powder samples using thermal analysis methods (DTA/DSC/TGA) and on sintered samples using dilatometry. Powder samples of phases which could be not be procured commercially, were prepared by the PI's patented organic-inorganic steric entrapment method. These powders were crystallized at higher temperatures followed by attritor milling to fabricate fine, highly sinterable oxide powders of homogeneous composition.
Phase Transformation Studies: The results of preliminary investigations were used as a guide to further evaluate the selected compounds for their high temperature thermal expansion and phase transformation behavior using high temperature X-ray diffraction (HTXRD). These experimental investigations were aimed at developing an in-depth understanding of the thermal expansion and any thermally-induced phase transformation behavior. The high temperature X-ray data was analyzed rigorously using whole pattern fitting methods such as the Rietveld method 72 and Pawley’s method73, in order to crystallographically follow the thermal expansion and the phase transformation behavior.
16

High Temperature Phase Transformations in Oxide Ceramics PI: Waltraud M. Kriven
4.2 Literature Survey
A thorough examination of literature spanning over a century of research constituted the first phase of the project. The PI guided a thorough screening of the scientific literature using the extensive resources available through subscriptions through the library system at University of Illinois and via the internet. Table 5 includes a listing of the databases that were used to collect information on phase transformations and thermal properties of single oxides and binary oxide ceramic materials. Although each and every relevant thermal property of these materials was considered, it was considered beyond the scope of the current project to catalog this information. The main purpose of the search was to shortlist at least twelve different compounds. The broad criteria for selection of compounds included (a) stability in air at high temperatures, (b) presence of, or promise for, high temperature phase transformations which are accompanied with significant volume/shape changes. Emphasis was on identifying compounds which are light weight. Together with the known fundamental high temperature properties of these materials, such as thermal expansion etc., essential details on the methods used for their measurement were also noted. Table 5. Comprehensive listing of available databases for this project.
S.NO. DATABASE NAME SCOPE AND COVERAGE REMARKS
1 Aerospace & high technology database
Identifies publications on aeronautical and aerospace engineering and space sciences.
1960-present in Cambridge Scientific Abstracts
2 Ceramic abstracts World ceramics abstracts (Alternate title for Ceramic abstracts/World ceramics abstracts)
Identifies journal articles and conference literature in ceramics and glass.
3 Ceramic abstracts/World ceramics abstracts
Identifies journal articles and conference literature in ceramics and glass.
1975-present in Cambridge Scientific Abstracts
4 Ceramics abstracts (Alternate title for Engineered materials abstracts, ceramics)
Identifies the research and trade literature in ceramic materials.
5 Ceramics subfile (Alternate title for Engineered materials abstracts, ceramics)
Identifies the research and trade literature in ceramic materials.
6 Chem abstracts (Alternate title for Chemical abstracts on CD)
Identifies publications in chemistry and medicine.
7 Chemical abstracts on CD Identifies publications in 1987-Present in
17

High Temperature Phase Transformations in Oxide Ceramics PI: Waltraud M. Kriven
S.NO. DATABASE NAME SCOPE AND COVERAGE REMARKS
chemistry and medicine. Chemical Abstracts Service
8 COMPENDEX - 1970 to present (Engineering Index--updated weekly) (Alternate title for Engineering Village)
Identifies articles in engineering and physics literature. Includes the Compendex, NTIS, and INSPEC databases.
9 Composites industry abstracts
Provides access to literature on polymer and ceramic composite materials.
1986-present in Cambridge Scientific Abstracts
10 Conference papers index Identifies papers and poster sessions presented at major scientific meetings.
1982-present in Cambridge Scientific Abstracts
11 CSA Materials Collection (Alternate title for Materials Collection Databases)
Identifies abstracts from aerospace, aluminum, and ceramic industries, among others.
12 Current contents Identifies journal articles and books in the sciences, social sciences, and arts and humanities.
1993-present in Ovid
13 DAO (Alternate title for ProQuest digital dissertations)
Identifies doctoral dissertations from U.S. & Canadian institutions.
14 Digital dissertations (Alternate title for ProQuest digital dissertations)
Identifies doctoral dissertations from U.S. & Canadian institutions.
15 Dissertation abstracts online (Alternate title for ProQuest digital dissertations)
Identifies doctoral dissertations from U.S. & Canadian institutions.
16 EI Village (Alternate title for Engineering Village)
Identifies articles in engineering and physics literature. Includes the Compendex, NTIS, and INSPEC databases.
17 Engineered materials abstracts
Identifies the research and trade literature in polymer, ceramic, and composite materials.
1986-present in Cambridge Scientific Abstracts
18 Engineered materials abstracts, ceramics
Identifies the research and trade literature in ceramic materials.
1986-present in Cambridge Scientific Abstracts
18

High Temperature Phase Transformations in Oxide Ceramics PI: Waltraud M. Kriven
S.NO. DATABASE NAME SCOPE AND COVERAGE REMARKS
19 Engineering Village Identifies articles in engineering and physics literature. Includes the Compendex, NTIS, and INSPEC databases.
1884-present (Compendex) 1968-present (INSPEC) in UIUC Library Database Collection
20 Geo ref (Alternate title for GeoRef)
Identifies articles, books and other publications on geology and earth sciences.
21 GeoRef Identifies articles, books and other publications on geology and earth sciences.
1785-present in SilverPlatter(also in Cambridge Scientific Abstracts)
22 GeoScience World GeoScienceWorld (GSW) identifies geologic and other geoscience journal content from various not-for-profit and independent geoscience publishers.
in UIUC Library Database Collection
23 INSPEC - 1970 to present (Physics/Computer & Electrical Engineering--updated weekly) (Alternate title for Engineering Village)
Identifies articles in engineering and physics literature. Includes the Compendex, NTIS, and INSPEC databases.
24 ISI citation databases (Alternate title for Web of science)
Identifies articles in science, social science, and arts and humanities, and the articles that cite them.
25 Materials Business File Identifies trade and industry literature in metals and materials.
1985-present in Cambridge Scientific Abstracts
26 Materials Collection Databases
Identifies abstracts from aerospace, aluminum, and ceramic industries, among others.
coverage dates that vary by resource in Cambridge Scientific Abstracts
27 National Technical Information Service (NTIS)
Identifies government-sponsored technical reports in science, engineering, and business.
1964-present in UIUC Library Database Collection
28 ProQuest digital dissertations
Identifies doctoral dissertations from U.S. & Canadian institutions.
1861-present in ProQuest
29 SciELO: Scientific Electronic Library Online
Identifies scientific literature published in Spain and
coverage dates that vary with resource in SciELO
19

High Temperature Phase Transformations in Oxide Ceramics PI: Waltraud M. Kriven
S.NO. DATABASE NAME SCOPE AND COVERAGE REMARKS
Central and South America. Brazil 30 Science Citation Index (ISI
Web of Science) (Alternate title for Science Citation Index Expanded)
Identifies research articles and cited references in science, engineering and medicine.
31 Science Citation Index Expanded
Identifies research articles and cited references in science, engineering and medicine.
1982-present in Thomson-ISI
32 Science.gov It provides a unified search of the U.S. government's scientific and technical information.
in UIUC Library Database Collection
33 Scirus Scirus is a science-specific Internet search engine searching over 167 million science-specific Web pages.
in UIUC Library Database Collection
34 Scopus Identifies scientific articles in over 14,000 peer-reviewed journals from more than 4,000 international publishers. Multidisciplinary coverage includes health, agriculture, chemistry, physics, life sciences, mathematics, engineering, earth and environmental sciences.
1960-Present in UIUC Library Database Collection
35 WCA (Alternate title for Ceramic abstracts/World ceramics abstracts)
Identifies journal articles and conference literature in ceramics and glass.
36 Web of science Identifies articles in science, social science, and arts and humanities, and the articles that cite them.
1980-present in Thomson-ISI
37 Weldasearch Identifies journal articles and report literature in the fields of welding, soldering, metallurgy, and corrosion.
1967-present in Cambridge Scientific Abstracts
38 World ceramics abstracts (Alternate title for Ceramic abstracts/World ceramics abstracts)
Identifies journal articles and conference literature in ceramics and glass.
20

High Temperature Phase Transformations in Oxide Ceramics PI: Waltraud M. Kriven
4.3 Experimental Procedures and Instrumentation 4.3.1 High Temperature Thermal Analysis by TGA/DSC and Dilatometry
The conventional thermal analysis techniques, TGA/DSC and dilatometry, were used as
preliminary investigation tools to (a) identify the onset of crystallization in amorphous sample powders which were synthesized, (b) determine phase transformation temperatures, and (c) study the thermal expansion behavior of polycrystalline bulk samples in the wide temperature ranges afforded by the instruments in the PI's research group (see Fig. 7(a, b)). The TGA data, which was acquired simultaneously along with DSC, served as a secondary check to monitor any associated weight changes in the samples upon heating.
(a) (b) Figure 7. Photographs of the (a) Netzsch Simultaneous Thermal Analyzer (STA 409 CD) and (b)
Netzsch Dilatometer (DIL 402 E) equipment used for DTA/DSC/TGA and dilatometric studies, respectively.
4.3.2 In situ High Temperature X-ray diffraction
High temperature X-ray diffraction (HTXRD) is a useful technique for measurement of physical properties such as thermal expansions and phase transformations, etc. of ceramic materials. Any phase transformations identified by thermal analysis studies were more closely studied by quantitative synchrotron HTXRD. In this way the crystallographic and compositional parameters could be determined for phase transformations or any invariant reactions identified. Using HTXRD, the prepared/procured crystalline powder samples of the candidate materials were characterized for (a) quantitative phase composition, (b) thermal expansion of each component phase and (c) phase transformation behavior using synchrotron radiation. The lattice parameters and phases present at transformation were also determined. Information on the
21

High Temperature Phase Transformations in Oxide Ceramics PI: Waltraud M. Kriven
structure-property relationships, measured in situ, is necessary to develop advanced ceramic materials for use in extremely demanding applications.
In a typical high temperature XRD experiment, samples (powder or sintered rods/plates) were heated using the Quadrupole Lamp Furnace (QLF)74, 75, see section 4.3.3.1, and the crystal structural changes are simultaneously recorded as XRD patterns using synchrotron radiation and an X-ray detector (e.g. scintillation counter). Experiments could be conducted in both transmission and reflection modes. The XRD patterns are analyzed using whole pattern fitting techniques (e.g. Rietveld method72) to extract the crystallographic information. These analyses used crystal structure information from commercially available databases, and where required, a suitable refined structure of the concerned phase was determined. 4.3.3 Instrumentation for In-situ High Temperature X-ray Diffraction
Different methods that have been used to generate high temperatures in X-ray diffraction experiments include devices based on resistance heating, gas flame heating, induction heating and radiation heating.76 In the past, a compact furnace using commercially available, small, ellipsoidal, halogen IR-reflector lamps was fabricated for in situ X-ray powder diffraction studies.74, 75, 77 With two such lamps, the double ellipsoidal, mirror heater was capable of heating a capillary sample up to a maximum temperature of 1500 °C in air. Since the technological niche of oxide ceramics lies in its usefulness for applications at temperatures beyond 1500 °C, a compact, quadrupole, ellipsoidal, thermal-image furnace, designed by the PI, incorporated four lamps arranged in such a manner that a temperature of 2000 °C could be achieved at their common “hot-spot” focus point. 74
Traditional powder X-ray diffraction methods employ either a slit or analyzer crystal that is step-scanned over the range of angles. Not only are these methods slow, but are also very inefficient since only a small fraction of the available diffracted intensity spectrum is measured at each point, resulting in low Signal/Noise ratio. Moreover, measurements on samples that change with time at high temperatures are often impossible.
Simultaneous acquisition of high quality X-ray diffraction data over a range of 2θ is a desirable alternative for HTXRD experiments. There has been significant efforts in the last few years to increase the quality of data and to reduce the amount of time required for a single measurement. The different approaches can be broadly classified into (a) multi detector systems78, and (b) position sensitive x-ray detectors, which include linear sensitive proportional counters (such as INEL), Charge Coupled Devices (i.e. CCDs, for example from AXS Bruker), or image plate (IP) systems. Although the multi detector set-up, when used along with the analyzer crystals, provides for unparalleled resolution in X-ray diffraction data, it could still require a number of hours to collect diffraction patterns suitable for structure solution.78 The position sensitive detectors based on CCDs or linear proportional counters are limited in their spatial resolution or could be very expensive if designed to cover the broad range of angles usually required in powder diffraction experiments. The IP-detectors, on the other hand have been developed in various configurations ranging from flat plates79-81, to cylindrical curved plates.82-86 The usual limitations encountered with the IP detectors pertain to the requirement for an external IP scanner. This can compromise the reproducibility in the IP position, besides involving a time-consuming readout step for these two-dimensional plates. Other limitations encountered are a small accessible angular range in flat plate geometry and low spatial resolution due to short sample-to-plate distances.
22

High Temperature Phase Transformations in Oxide Ceramics PI: Waltraud M. Kriven
A new one-dimensional curved image plate (CIP) detector has been developed by the PI in collaboration with scientists from the Hamburger Synchrotronstrahlungslabor (HASYLAB) at the Deutsches Elekronen-Synchrotron (DESY), Hamburg, Germany as well as scientists at the 33BM-C beamline at the Advanced Photon Source (APS) at Argonne National Laboratory (ANL), Argonne, IL, USA. This detector is based on the OBI detector previously developed at HASYLAB 87. The restriction of the detector to one dimension (as opposed to a two-dimensional IP) reduces the complexity of the mechanics and the time for the readout of the IP. The CIP detector is a significant improvement over the previous version, particularly in terms of resolution. The detector has been designed for operation in conjunction with a quadrupole lamp furnace to conduct in situ HTXRD studies on polycrystalline (or powder) specimens, in real time, up to 2000 °C in air 87. In this project, this detector was calibrated and used to conduct HTXRD investigations on candidate material systems. In addition, a linear silicon strip detector (Si-Li detector) was also used in studies conducted at the National Synchrotron Light Source (NSLS) at the Brookhaven National Laboratory (BNL), Upton, NY. In the following sections brief details on the QLF and the CIP detector are presented.
4.3.3.1 Quadrupole Lamp Furnace The Quadrupole Lamp Furnace (QLF) consists of four infrared halogen lamps (OSRAM
Xenophot HLX64635; 15V, 150W each) with ellipsoidal reflectors.74, 75, 77 The radiation emitted by these halogen lamps extends from the visible range to the far infra-red range (approximately 500 nm to 2500 nm). According to the manufacturer’s specifications, the relative spectral intensity distribution for these lamps shows an asymmetric distribution with a maximum intensity at ~ 800 nm, gradually sloping towards the higher wavelengths. The reflecting surface is coated with gold, to enhance infrared reflectivity, and is a part of an ellipsoid with a long axis of 27.5 mm, and a short axis of 22 mm. The bulb is cemented in the reflector housing such that the center of the tungsten filament, with dimensions 3 mm x 1 mm x 5 mm (length x width x height), is located at one focus of the ellipsoid. The real image of the lamp filament is expected to form at the second focus, approximately 19 mm away from the edge of the reflector, in free space. The four lamps are arranged in a water-cooled brass housing such that the second focus is common to all the four reflecting ellipsoidal surfaces. The schematic in Fig. 8 shows the intersection of the real images of the lamp filaments to generate the expected thermal image or the “hot spot”. The bulb housing, where the bulb is cemented into the reflector, and the body of the furnace is water cooled. The QLF is used in conjunction with synchrotron radiation to collect high resolution in situ HTXRD data on polycrystalline/powder oxide ceramics in air. A specially designed stage is used to mount the furnace on a Huber 4-circle goniometer. Fig. 9 shows the furnace set up at the 33BM-C beamline at APS, ANL, Argonne, IL. The furnace has a circular port for the synchrotron beam entry and a vertical slit of 4.2 cm (height) x 0.7 cm (width) on the detector end, for the diffracted beam. This finite beam slot imposes a restriction on the accessible 2θ span of ~35° for the diffracted beam. In order to obtain a reasonably useful powder pattern X-ray radiation with a wavelength λ ≤ 0.75Å was used in HTXRD investigations conducted either at X-14A beamline at NSLS, or the 33BM-C beamline at APS.
23

High Temperature Phase Transformations in Oxide Ceramics PI: Waltraud M. Kriven
Figure 8. Schematic to show the intersection of the real images of lamp filaments to generate the
thermal image or the “hot spot”.74
Figure 9. Photograph of the quadrupole lamp furnace in operation at the UNICAT 33BM
beamline at APS, Argonne National Laboratory, Argonne, IL.
The four halogen lamps in the QLF are connected in series and the temperature at the hot-spot of the furnace is controlled to within ±2°C using a control thermocouple (Type B, Pt30%Rh -Pt6%Rh; Omega Engineering, Inc., CT, USA) with a temperature controller (Honeywell Universal Digital Controller UDC3300, Honeywell, Inc.). A peculiarity of the thermal-image technique is that the temperature of the sample in the focused thermal image hot-spot itself is dependent upon various factors, notably its absorptivity, emissivity and thermal conductivity, at
24
High Temperature Phase Transformations in Oxide Ceramics PI: Waltraud M. Kriven
the wavelength of the lamps used. Therefore, the control thermocouple is used just as a guide for temperature selection for the purpose of furnace ramp-up, i.e., only to control power supply to the lamps. It does not reflect the actual sample temperature, which is determined experimentally, using an internal thermometer material which has a well characterized thermal expansion behavior (e.g. Pt).
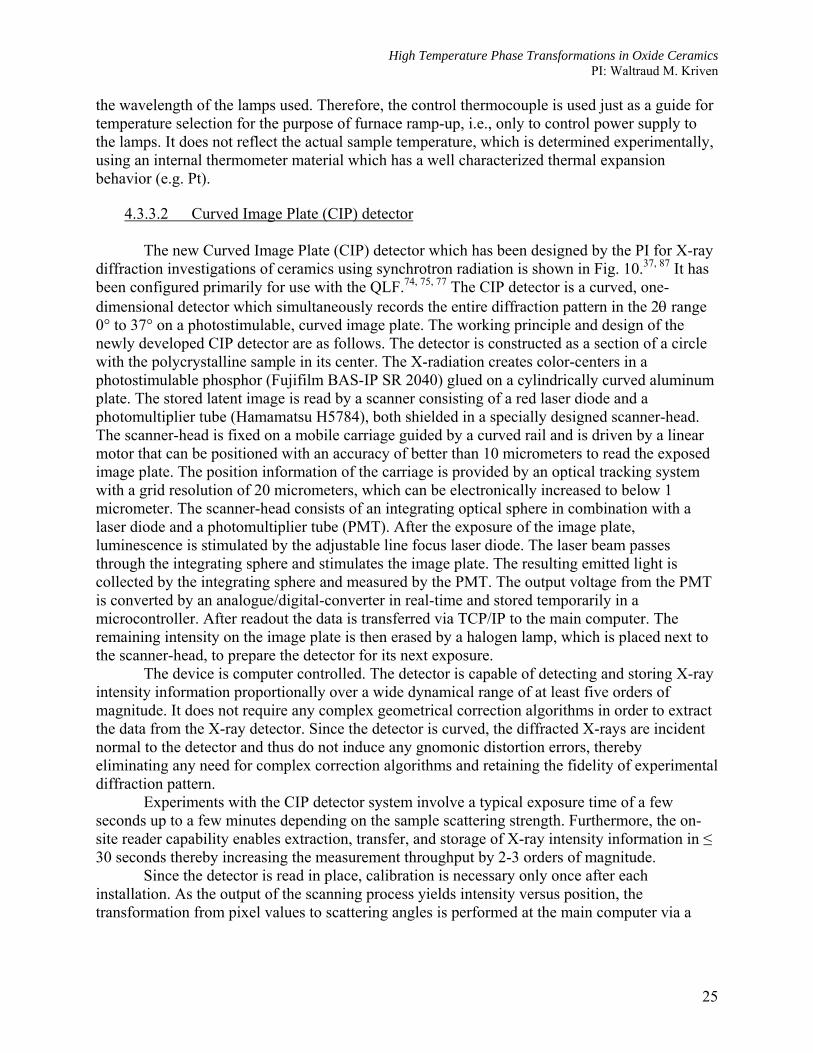
4.3.3.2 Curved Image Plate (CIP) detector
The new Curved Image Plate (CIP) detector which has been designed by the PI for X-ray diffraction investigations of ceramics using synchrotron radiation is shown in Fig. 10.37, 87 It has been configured primarily for use with the QLF.74, 75, 77 The CIP detector is a curved, one-dimensional detector which simultaneously records the entire diffraction pattern in the 2θ range 0° to 37° on a photostimulable, curved image plate. The working principle and design of the newly developed CIP detector are as follows. The detector is constructed as a section of a circle with the polycrystalline sample in its center. The X-radiation creates color-centers in a photostimulable phosphor (Fujifilm BAS-IP SR 2040) glued on a cylindrically curved aluminum plate. The stored latent image is read by a scanner consisting of a red laser diode and a photomultiplier tube (Hamamatsu H5784), both shielded in a specially designed scanner-head. The scanner-head is fixed on a mobile carriage guided by a curved rail and is driven by a linear motor that can be positioned with an accuracy of better than 10 micrometers to read the exposed image plate. The position information of the carriage is provided by an optical tracking system with a grid resolution of 20 micrometers, which can be electronically increased to below 1 micrometer. The scanner-head consists of an integrating optical sphere in combination with a laser diode and a photomultiplier tube (PMT). After the exposure of the image plate, luminescence is stimulated by the adjustable line focus laser diode. The laser beam passes through the integrating sphere and stimulates the image plate. The resulting emitted light is collected by the integrating sphere and measured by the PMT. The output voltage from the PMT is converted by an analogue/digital-converter in real-time and stored temporarily in a microcontroller. After readout the data is transferred via TCP/IP to the main computer. The remaining intensity on the image plate is then erased by a halogen lamp, which is placed next to the scanner-head, to prepare the detector for its next exposure.
The device is computer controlled. The detector is capable of detecting and storing X-ray intensity information proportionally over a wide dynamical range of at least five orders of magnitude. It does not require any complex geometrical correction algorithms in order to extract the data from the X-ray detector. Since the detector is curved, the diffracted X-rays are incident normal to the detector and thus do not induce any gnomonic distortion errors, thereby eliminating any need for complex correction algorithms and retaining the fidelity of experimental diffraction pattern.
Experiments with the CIP detector system involve a typical exposure time of a few seconds up to a few minutes depending on the sample scattering strength. Furthermore, the on-site reader capability enables extraction, transfer, and storage of X-ray intensity information in ≤ 30 seconds thereby increasing the measurement throughput by 2-3 orders of magnitude.
Since the detector is read in place, calibration is necessary only once after each installation. As the output of the scanning process yields intensity versus position, the transformation from pixel values to scattering angles is performed at the main computer via a
25

High Temperature Phase Transformations in Oxide Ceramics PI: Waltraud M. Kriven
Figure 10. A side-view of the CIP detector at the 33-BM UNICAT facility at APS, ANL,
Argonne, IL.
polynomial function. The parameters of this polynomial are determined from a reference pattern of a suitable standard that has to be measured after alignment of the setup.
Assuming parallel beam geometry the main contribution to the instrumental resolution function in this setup is the projection of the capillary on the imaging plate. Therefore, reflection half-widths and peak shapes are influenced by the capillary diameter and the distance between capillary and image plate. Taking into account the sample-to-detector distance of 1045 mm in the designed CIP detector, the size of the focal spot of the laser beam, the grain size of the image plate materials and the typical size of a sample, a full width at half maximum (FWHM) below 0.02 degrees is easily possible for the Bragg reflections. The intrinsic resolution of the CIP detector was measured as 0.007º for a typical wavelength of 0.7 Å with a 0.1mm capillary sample of SRM 660a, LaB6 standard for powder X-ray diffraction. This translates into accuracy of at least 0.001° in peak position or approximately 0.0001 Å in lattice spacing. Fig. 11 compares the
26

High Temperature Phase Transformations in Oxide Ceramics PI: Waltraud M. Kriven
Figure 11. Comparison of FWHM measured using the LaB6 standard for different capillary sizes, at the same incident wavelength. The FWHM measured using an analyzer crystal is also included for comparison.37
FWHM of the SRM 660a standard peaks measured using the CIP detector with a Si (111) analyzer.
27

High Temperature Phase Transformations in Oxide Ceramics PI: Waltraud M. Kriven
5. Results and Discussion 5.1 Literature Search
A comprehensive search of the available literature from 1890’s on thermally-induced phase transformations in ceramic oxides, conducted in this project, has resulted in collection of > 8000 articles. The elements included in the search are shown in the Periodic Table in Fig. 12. The elements excluded and the reason(s) for exclusion from the search are presented in Table 6. The search was restricted to crystalline mono and binary compounds which included: borates, carbonates, aluminates, silicates, phosphates, gallates, germanates, titanates, niobates, and tantalates. The focus of the research was on phase transformations, crystal structures and thermal properties, and appropriate keywords were identified for an exhaustive search. For example, phase transformation is the preferred usage for ceramists while, phase transition is more common amongst physicists and chemists. Several bibliographic files with details on all the reference articles have been created and digital copies of the articles were collected.
Figure 12. The Periodic Table of elements showing the expanse of the literature search, to
identify ceramic materials with reported high temperature phase transformation properties.
28
High Temperature Phase Transformations in Oxide Ceramics PI: Waltraud M. Kriven
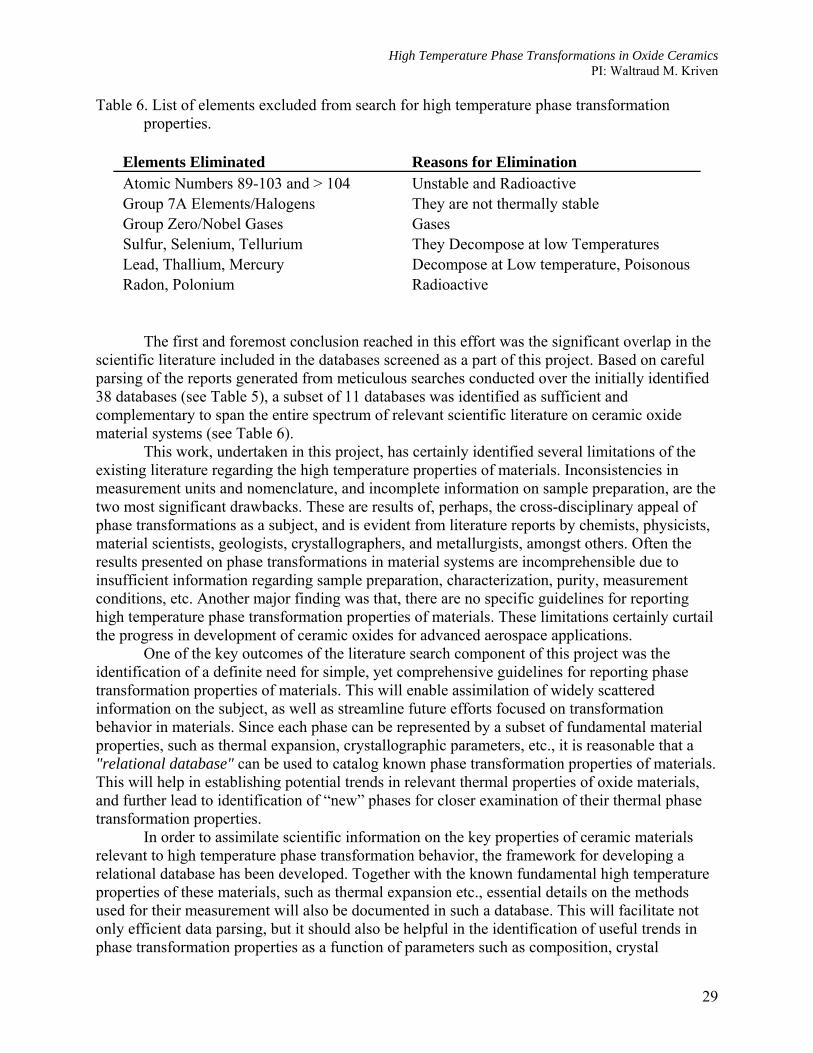
Table 6. List of elements excluded from search for high temperature phase transformation properties.
Elements Eliminated Reasons for Elimination Atomic Numbers 89-103 and > 104 Unstable and Radioactive Group 7A Elements/Halogens They are not thermally stable Group Zero/Nobel Gases Gases Sulfur, Selenium, Tellurium They Decompose at low Temperatures Lead, Thallium, Mercury Decompose at Low temperature, Poisonous Radon, Polonium Radioactive
The first and foremost conclusion reached in this effort was the significant overlap in the scientific literature included in the databases screened as a part of this project. Based on careful parsing of the reports generated from meticulous searches conducted over the initially identified 38 databases (see Table 5), a subset of 11 databases was identified as sufficient and complementary to span the entire spectrum of relevant scientific literature on ceramic oxide material systems (see Table 6).
This work, undertaken in this project, has certainly identified several limitations of the existing literature regarding the high temperature properties of materials. Inconsistencies in measurement units and nomenclature, and incomplete information on sample preparation, are the two most significant drawbacks. These are results of, perhaps, the cross-disciplinary appeal of phase transformations as a subject, and is evident from literature reports by chemists, physicists, material scientists, geologists, crystallographers, and metallurgists, amongst others. Often the results presented on phase transformations in material systems are incomprehensible due to insufficient information regarding sample preparation, characterization, purity, measurement conditions, etc. Another major finding was that, there are no specific guidelines for reporting high temperature phase transformation properties of materials. These limitations certainly curtail the progress in development of ceramic oxides for advanced aerospace applications.
One of the key outcomes of the literature search component of this project was the identification of a definite need for simple, yet comprehensive guidelines for reporting phase transformation properties of materials. This will enable assimilation of widely scattered information on the subject, as well as streamline future efforts focused on transformation behavior in materials. Since each phase can be represented by a subset of fundamental material properties, such as thermal expansion, crystallographic parameters, etc., it is reasonable that a "relational database" can be used to catalog known phase transformation properties of materials. This will help in establishing potential trends in relevant thermal properties of oxide materials, and further lead to identification of “new” phases for closer examination of their thermal phase transformation properties.
In order to assimilate scientific information on the key properties of ceramic materials relevant to high temperature phase transformation behavior, the framework for developing a relational database has been developed. Together with the known fundamental high temperature properties of these materials, such as thermal expansion etc., essential details on the methods used for their measurement will also be documented in such a database. This will facilitate not only efficient data parsing, but it should also be helpful in the identification of useful trends in phase transformation properties as a function of parameters such as composition, crystal
29

High Temperature Phase Transformations in Oxide Ceramics PI: Waltraud M. Kriven
Table 7. Comprehensive listing of available databases for this project.
S.No.Database Name
Remarks
1 Chemical Abstracts on CD
1987-Present in the Chemical Abstracts Service
2 Conference Papers Index
1982-Present in the Cambridge Scientific Abstracts
3 Current Contents 1993-Present in OVID
4 Engineering Village
Includes COMPENDEX, INSPEC, NTIS. 1884-COMPENDEX,1968-INSPEC
5 GeoRef 1785-Present in the Cambridge Scientific Abstracts
6 Materials Collection Database
Includes Aerospace and High technology database, World Ceramic Abstracts, Ceramic Abstracts, Composites Industry Abstracts, Engineered Materials Abstract, Materials Business File and Weldasearch. Present in Cambridge Scientific Abstracts
7 ProQuest Digital Dissertations
1861-Present in ProQuest
8 Science.gov In UIUC Library Database Collection 9 Scirus In UIUC Library Database Collection 10 Scopus 1960-Present in UIUC Library Database
Collection 11 Web of Science Includes ISI citation Databases and Science
Citation Index expanded. 1980-Present in Thomson-ISI
structure, ionic size, etc. Key features of a Phase Transformations Database are presented here in Figs. 13-16. The Phase Transformations database, if developed, will serve as the repository for all of the data collected in the scientific literature search. All data will be stored in a structured format so that precise queries can be made on the database. Data input will function with a simple web form so that any designated user can do data population from anywhere. Each entry made can be screened by database administrator(s). Since the information in the database will be from published peer reviewed scientific literature, with the details of the publication included as a reference, only the correctness of property entries and their conformity with the pre-defined guidelines such as units of measurement etc. will have to be monitored.
The structured nature of the data in the database will allow users to search for specific requirements without the concern that their query will miss records because the data was presented in a different—though equivalent—notation. This normalization of the data will open the door to effective data mining unlike any system currently available. If the user desires, fuzzy
30

High Temperature Phase Transformations in Oxide Ceramics PI: Waltraud M. Kriven
Figure 13. Screenshot of the browse phase feature of the database. In this view, the user can look
for phases of a compound by name or formula, or the user can view phases ordered by temperature.
searches will look for data that is near the target the user specified, but not quite on target. This will allow researchers to find materials that they may not have considered previously.
The database should allow for easy access to all of our collected data via any web browser on any platform. It is conceivable that the database will not be restricted to internet-only use—an advanced query language can be developed that will allow for database query for users who do not wish to use the form-based search. This advanced query language can also have interoperability with XQuery allowing for external applications, such as MATLAB, to use the database and data directly. The Phase Transformations database if developed using open source software such as Python, Django, MySQL, and Ubuntu Linux will allow for interoperability between operating systems, ease of use, cost-benefit ratio, and performance scalability. Open standards will be used whenever feasible. This approach means that the database will not be confined to legacy systems years from now.
31

High Temperature Phase Transformations in Oxide Ceramics PI: Waltraud M. Kriven
Figure 14. Screenshot of a single compound within the database. All data entered for that
compound is shown in a concise view. Since the database features dynamic properties of unlimited type and number, properties that do not have an entry for the current compound are not shown.
32

High Temperature Phase Transformations in Oxide Ceramics PI: Waltraud M. Kriven
Figure 15. Screenshot of the phase transformation search feature of the database. Searches are
available across all compounds and allow data ranges. The “similar series” box shows part of the fuzzy search feature. In the box is another phase transformation that the database thinks might be of use to the user.
33

High Temperature Phase Transformations in Oxide Ceramics PI: Waltraud M. Kriven
Figure 16. Screenshot of the property search feature. Searches are available across all
transformations and allow data ranges. The “similar series” box shows part of the fuzzy search feature. In the box is another compound that the database thinks might be of use to the user.
34

High Temperature Phase Transformations in Oxide Ceramics PI: Waltraud M. Kriven
5.2 In situ High Temperature X-Ray Diffraction Using Synchrotron Radiation
In the past few years, the PI’s research group at the University of Illinois at Urbana-Champaign has developed the Quadrupole Lamp Furnace (QLF) to enable in situ high temperature X-ray diffraction (HTXRD) investigations of oxide ceramics to 2000 °C using synchrotron radiation.74, 75, 77 The QLF, which is a thermal image furnace, has been successfully used to study phase transformations in rare earth niobates and titanates.33, 34, 36 In thermal-image furnaces, radiation emanating from the heat source (filament) is typically concentrated (focused) onto the sample using some kind of mirrors thereby affording two major advantages over conventional resistance heating systems.88-90 Firstly, the highly localized heating which allows temperatures in excess of 2000 °C to be reached in air or in an oxidizing atmosphere. Secondly, there is no sample contamination from volatile furnace components since the sample is heated through the absorption of a focused, high intensity light beam. More recently, The PI’s research group has successfully designed and implemented a curved image plate (CIP) detector37 with support from an AFOSR DURIP award (Award # FA9550-07-1-0490). The CIP detector has been configured for use at the Advanced Photon (synchrotron) Source (APS) at Argonne National Laboratory (ANL). The performance and suitability of the CIP detector to collect XRD patterns at high resolutions and at high speeds was calibrated during this project. As a result, rapid HTXRD investigations on oxide ceramic systems in air, were made possible and used in this project. 37, 87
The unique instruments and characterization methods explained above were strategic for success in exploring and understanding high temperature properties including high temperature thermal expansion and phase transformations in oxide ceramics. These methods allow for a variety of in-situ investigations to probe the mechanism of transformation at high temperatures in air. In the following sections (section 5.2.1 and 5.2.2) key results on the performance of the CIP detector for rapid HTXRD studies and the relevance of studying crystallographic thermal expansion using HTXRD are discussed with suitable examples.
5.2.1 Rapid High Temperature XRD using QLF and CIP detector
The CIP detector has been developed for time-efficient XRD measurements with reasonably high resolution suitable for structural refinement.87 The use of QLF for HTXRD investigations on ceramic materials up to 2000 °C in air has already been successfully demonstrated.74, 75, 77 The combination of CIP detector and QLF enabled rapid HTXRD experiments to study thermal expansions, phase transformations, phase diagrams and kinetics of high temperature processes such as decompositions. In a typical high temperature XRD experiment, samples are heated with the QLF, and the crystal structural changes will be simultaneously recorded as XRD patterns, using synchrotron radiation and the CIP detector. The schematic shown in Fig. 17 illustrates the setup for the HTXRD experiments using the CIP detector. This was the configuration in which all the experiments were conducted at 33BM-C beamline at APS. In the case of the studies conducted at X-14A beamline at NSLS, a Si-Li detector91 was used instead, although the overall experiment and the data acquisition and analysis procedures remained the same. With these setup it is possible to conduct HTXRD experiments in both transmission and reflection modes. Powder samples were mounted in sapphire capillaries for transmission mode studies, while a specially designed Pt-20%Rh sample holder was used for
35

High Temperature Phase Transformations in Oxide Ceramics PI: Waltraud M. Kriven
reflection mode HTXRD experiments. The sample temperature was determined experimentally with an internal thermometer material, which has a well characterized thermal expansion
Figure 17. Schematic of the HTXRD experiments conducted with the CIP detector and QLF.87
behavior (e.g. Pt92, 93). ), and was mixed with the sample powders. The XRD patterns are analyzed by whole pattern fitting techniques (e.g. Rietveld method72) using the JADE software (MDI, Inc., Livermore, CA, USA) to extract the crystallographic information.
In order to demonstrate the suitability of the QLF+CIP detector configuration for rapid HTXRD investigations, MgO and Pt, two standard materials with well known thermal expansion behavior,72, 92, 93 were selected. Fine particle size (0.15 – 0.45 mm) Pt powder (Aldrich, Milwaukee, WI) was mixed with MgO powders (Fisher Scientific, Pittsburgh, PA) using a mortar and pestle to prepare homogenous powder mixtures. The binary sample mixture contained approximately 1% by weight of Pt. These sample powders were mounted in the refractory (Pt-20%Rh) crucible, and HTXRD patterns were acquired over a range of temperatures while heating. The experiments were conducted in asymmetric reflection geometry with an incident angle of θ = 5° coupled with rocking for ± 2° for improved counting statistics. The asymmetric diffraction conditions used for this experiment were not optimized to reproduce symmetric mode (θ−2θ scan) or transmission mode intensity distribution in the XRD pattern. However, the data was adequate for extraction of lattice constants of the component phases to determine the thermal expansion coefficients. The sample temperature and displacement is determined by whole pattern fitting of the reference phase (Pt).
The series of HTXRD patterns acquired from room temperature to a set temperature (TSet) of 1000 ºC are shown in Fig. 18. The expansion of the MgO and Pt lattices is apparent in the gradual shift in the peak positions towards larger d-spacings. Although the shift in the peaks could also be a result of displacement of the sample holder, this effect can be suitably accounted for during whole pattern fitting procedures.59 These patterns were acquired at 100 ºC temperature intervals with an exposure time of only 60 seconds at each temperature, an incident slit size of 0.1 mm (H) X 3 mm (W) and 0.700573 Å wavelength. To increase counting statistics and the S/N ratio, the same exposure of the IP was read out two times. The readout and erasure of the IP
36

High Temperature Phase Transformations in Oxide Ceramics PI: Waltraud M. Kriven
took about 6 seconds each and the data conversion and transfer about 10 seconds. The change of temperature was the slowest step in these experiments. The PID values on the temperature controller were conservatively set in order to avoid any overshooting of the temperature. The entire series of experiments which involved acquisition of 11 X-ray diffraction patterns, from room temperature to 1000 ºC could be completed in 72 minutes. The time required for HTXRD data acquisition using the CIP detector, which also included 1 minute of exposure time, was only 23 minutes for the 11 XRD scans. In comparison, a similarly designed experiment using a scintillation detector, which is step scanned from 5º to 35º 2θ in steps of 0.01º, would take about 11 hrs (or 6600 minutes), and still produce data with less than half the resolution afforded by the CIP detector.
Figure 18. Crystallographic thermal expansion measurements of MgO from HTXRD studies using the CIP detector and QLF. (Note: TSet = 1000 ºC actually corresponds to approximately 1600 ºC actual sample temperature).
5.2.2 Relevance of Understanding the Crystallographic Thermal Expansion Behavior of Material Systems
Thermal expansion is one of the commonly studied material properties. Thermal expansion coefficients often change dramatically with temperature, especially when phase transformations are involved. It is well known that there exists in solids two kinds of phase transformations: the first-order, and the second-order (continuous transformations, Curie points, lambda-points; transformations of higher order). The first-order transformations are characterized by discontinuous changes in energy, volume and crystal structure and singularities in the first order derivatives of free energy. On the other hand, second-order transformations are accompanied by continuous changes in energy and volume with singularities in the second-order derivatives of the free energy. Generalizing this, a transformation is one of nth-order if it has a discontinuity in the nth derivative of the free energy. In terms of thermal expansion, the above can be summed up as follows. At first-order phase transformations there are discontinuities in volume and strain, at second-order transformations there are discontinuities in coefficients of thermal expansion, and at third-order transformations, discontinuities in the slopes of the expansion coefficients.
37

High Temperature Phase Transformations in Oxide Ceramics PI: Waltraud M. Kriven
While the preceding understanding is fairly straightforward, it is important to appreciate that at the microscopic level, a phase transformation is generally accompanied by a change of the global or local atomic configuration. The structural data, i.e. the specification of the differences in atomic configurations between two phases, or the study of the local ordering precursor to a transformation, are thus essential clues to the understanding of the mechanism of the transformation considered. In this project, focused on furthering the understanding of phase transformations in oxide ceramics, this was one of the primary motivations. Therefore, standard crystallographic considerations, aimed at the determination of the characteristics of a lattice and of a basis were fundamental in this study of phase transformations. In this context, it becomes important to briefly outline the current understanding and classification of this very important property of materials.
There are a wide variety of structural phase transformations and the task of classifying them has been attempted from several standpoints. The most important distinction is that made between reconstructive and non-reconstructive transformations. This distinction stems from a comparison of the crystal structures of the two phases. In a reconstructive transformation the distances between certain atoms change by amounts similar to the dimension of the unit cell, and certain chemical bonds between neighboring atoms are then necessarily broken. If, instead, a transformation preserves approximately the configuration of the chemical bonds between constituents, the transformation is non-reconstructive.
There are other classifications which partly overlap with the preceding one such as displacive transformations, diffusionless and diffusion assisted transformations, order-disorder transformations, and martensitic transformations. However, owing to insufficient understanding of the observations, the relationships between these various classifications is not fully clear at present. It is therefore reasonable to restrict the terminology structural phase transformations to the situation of only a fraction of the phase transformations that take place in solids and imply a modification of the crystal structure. These are part of non-reconstructive transformations between homogenous crystalline phases. It is customary to specify that a structural transformation only slightly alters the chemical bond lengths (by less than e.g. 0.1A) and their relative orientation (by less than e.g. a few degrees).94
Experimentally, such transformations are characterized by small values of heat of transformation (less than a few calories per gram), weak discontinuities in the relevant physical quantities (e.g. lattice parameters) and the occurrence of a symmetry relationship between the two phases surrounding the transformation.
In the simplest case, this relationship consists of the fact that the space group of one of the phases is a subgroup of the space group of the other phase, and that there is a specific correspondence between the symmetry elements of the two phases. The group-subgroup relationship that exists, in the standard situation, between the space groups of the two phases adjacent to a structural transformation implies that the point group of one phase is either a subgroup of the point group of the other phase or is identical to it. If the two point groups are identical, the corresponding transformation is classified as non-ferroic.94 In the general case, the point group of one phase is a strict subgroup of the point group of the other phase. The transformation is then classified as ferroic.94 This classification provides a guiding framework for the experimental investigations.
As stated earlier, phase transformations are accompanied and characterized by discontinuous changes of derivatives of the free energy. Since the thermal expansion β is a second-order derivative, discontinuities or changes of slope in the β(T) curve are used to detect
38
High Temperature Phase Transformations in Oxide Ceramics PI: Waltraud M. Kriven
and to describe phase transformations. Thermal expansion is a symmetric second rank tensor (denoted by αij ) because it relates strain (uij, a second rank tensor) with temperature (a scalar entity). Thermal expansion, i.e. α (or β for volume expansion), is proportional to the compressibility, which, in turn, is a rough measure of the interatomic and intermolecular forces. In general,
1. Covalent bonds are associated with very small thermal expansions, whereas van der Waals bonds give rise to large thermal expansions
2. In layer-like structures, the maximum thermal expansion occurs normal to the layers. 3. Thermal expansion decreases when the density of weak bonds decreases
Thermal expansion of a solid is a consequence of the anharmonicity of interatomic
forces.95 If the potentials were harmonic, the atoms would oscillate (even with large amplitudes) symmetrically about their equilibrium positions and their mean central position would remain unchanged. In order to describe thermal expansion, the anharmonicity is most conveniently accounted for by means of the so-called ‘quasiharmonic approximation’, assuming the lattice vibration frequencies to be independent of temperature but dependent on volume. Anharmonicity is taken into account by letting the crystal expand, but it is assumed that the atoms vibrate about their new equilibrium positions harmonically, i.e. lattice dynamics are still treated in the harmonic approximation.
In order to measure the thermal expansion of a crystal, at least as many independent measurements are necessary as the αij tensor has independent components. It is advisable, however, to carry out more measurements than are necessary.95 In this case (of redundancy), a ‘best’ set of tensor components is to be determined by least-squares methods. Furthermore, instead of determining the tensor components of a triclinic or monoclinic crystal in a direct way, it is also possible to determine first the temperature change of the crystallographic unit cell and then, by formulae given e.g. by Schlenker et al. (1978),96 to deduce the thermal expansion tensor components. The direct approach is recommended, however, for reasons of the propagation of errors.97
The experimental techniques of measuring relative length changes Δl/l that are most widely used include diffraction, optical interferometry, pushrod dilatometry and electrical capacitance methods. Since, thermal expansion expresses itself, on a microscopic scale, by a change of the interplanar spacings of lattice planes, it can be measured by use of diffraction methods from changes of Bragg angles θ. Differentiation of the Bragg equation 2d sin θ = λ, giving Δdhkl /dhkl = cotθhklΔθhkl, yields the thermal expansions in directions normal to lattice planes (hkl).95 Although the strain tensor uij and the thermal expansion tensor αij in general contain components with i ≠ j (shear strains), in practice only longitudinal effects, i.e. relative length changes Δl/l with temperature changes ΔT, are measured along different directions and the results are later transformed to a common coordinate system. Diffraction methods directly yield this ratio Δl/l. Other measuring techniques require separate measurements of Δl and l. The error in the measurement of l can usually be neglected. Thus, the accuracies of Δl and ΔT limit the accuracy of thermal expansion coefficients. Since, in fact, thermal expansion depends on temperature, in principle, smaller intervals should be chosen, which, in turn, enlarge the error of ΔT.95 Therefore accurate determination of sample temperature is very important.
Using HTXRD, it is possible to determine the “true thermal expansion”, i.e. thermal changes in crystal structure parameters which describe the arrangement of atoms within the
39

High Temperature Phase Transformations in Oxide Ceramics PI: Waltraud M. Kriven
crystallographic cell. An HTXRD pattern from a powder sample, which constitutes reflections from numerous crystallographic planes in the lattice, allows for simultaneous and accurate determination of expansion observed in several directions as a function of temperature. It thus provides a sensitive, yet robust, probe to investigate the anharmonicity in the atomic vibrations and various other crystal properties which are relevant to understanding phase transformation behavior at high temperatures. For example, it is reasonably arguable that by determining the orientation relationship between the instantaneous thermal expansion tensors for prototype phase and the transformed phase at the transformation temperature, the plane of invariant strain can be determined. This can be very useful in understanding the mechanism leading to the structural transformation. In an ongoing effort, the PI’s research group is developing software to determine the thermal expansion tensor from HTXRD studies for all the crystal classes. This is expected to facilitate a clearer understanding of the thermal expansion properties of a material system in any crystallographic direction, or along any atomic bonds. It can be further developed to derive structural relationships between the parent and transformed phase.
Example HTXRD studies of hafnia (HfO2) in air are presented below. The HfO2 material system was not studied as a part of this project, however, it serves as a good example to demonstrate the potential of the method developed by the PI to study high temperature properties of material systems in air. The thermal expansion coefficient for hafnia was determined for both the monoclinic and the tetragonal phase, as well as a -2.71% volume change was observed at ~1820 °C on heating through the transformation (Fig. 19 ). Fig. 20 shows the polar diagram representing the magnitude of the coefficient of thermal expansion of HfO2 in three dimensions.
(a) (b)
Figure 19. In situ HTXRD studies of the monoclinic to tetragonal transformation in hafnia (HfO2) on heating. (a) Variation of lattice parameters (b) Variation of volume to indicating a -2.71% change.
40

High Temperature Phase Transformations in Oxide Ceramics PI: Waltraud M. Kriven
(a) (b)
Figure 20. Three dimensional representation of the thermal expansion coefficients (CTEs) of HfO2 determined from powder XRD patterns acquired at (a) 70 ºC and (b) 1825 ºC. The CTE values along the x, y, and z-axis are in x 10-6/ ºC.
5.3 High Temperature Studies on Candidate Material Systems
In the following sections, results from experimental studies conducted on candidate material systems in this project are presented. Detailed analysis has not been included in this report as it is still underway, and will be presented in archival publications in the near future, and copies will be forwarded to the Program Manager. 5.3.1 Y2SiO5 Background:
Exposure to steam in high temperature combustion environments leads to accelerated oxidation of Si-based ceramics and composites, such as silicon carbide (SiC) fiber-reinforced SiC ceramic matrix composites (SiCf/SiC CMCs) and monolithic silicon nitride (Si3N4), and severely limits their application in gas turbine engines. The research has focused on identifying a new top coat, to replace the current BSAS (1-xBaO-xSrO-Al2O3-2SiO2, 0≤x≤1) top coat, that has 1482 ºC (2700 ºF) temperature capability and chemical/mechanical compatibility with the mullite or mullite + BSAS intermediate coat at 1400 ºC (2552 ºF) or higher.98 Considerable research in the development of environmental barrier coatings (EBCs) has indicated the superiority of rare-earth silicate based EBCs over aluminosilicate based second generation EBC systems, both with respect to high temperature capability and durability due to their low thermal expansion and phase stability. Yttrium silicate (Y2SiO5), which is monoclinic in structure and has at least two known polymorphs, is one of the promising materials for an oxidation protection coating for Si-based composites, partly because it has good erosion
41

High Temperature Phase Transformations in Oxide Ceramics PI: Waltraud M. Kriven
Figure 21. Phase diagram of the Y2O3-SiO2 system where the oxide ratios of compounds are
given as Y2O3:SiO2.99 resistance and low oxygen permeability at high temperatures. However, thermal expansion mismatch between the coating and substrate materials and volume changes on phase transformation, if any, can lead to microcracking, which will eventually result in reduced lifetime of the component. A comprehensive understanding of the thermal expansion behavior and any phase transformation in Y2SiO5 is essential in order to develop coherent and oxidation resistant EBC.
The Y2O3 - SiO2 phase diagram which is typical of the rare earth phase diagrams is shown in Fig. 21 above. In this project the 1:1 composition, i.e. yttrium monosilicate (Y2SiO5) was selected for further exploration of its thermal behavior at high temperatures in air. The crystal of yttrium silicate has two polymorphs, both of which are monoclinic with space groups P121/c1 for the low-temperature (termed LT) phase and I12/a1 for the high-temperature (HT) phase.100 The transformation temperature reported so far ranges from 1190 ºC to 850ºC. The lattice parameters of the LT and the HT phase are included in Table 8, and the crystal structure of the HT phase is shown in Fig. 22. The crystal structure of the HT phase consists of YO6 octahedra and SiO4 tetrahedra. For the LT phase, there are two types of Y sites; one is coordinated by nine oxygen atoms, and the other is coordinated by seven oxygen atoms. The atomic arrangements in the two structures are quite different from each other; hence, the phase transformation is expected to be of the reconstructive type.100 The high- temperature phase is
42
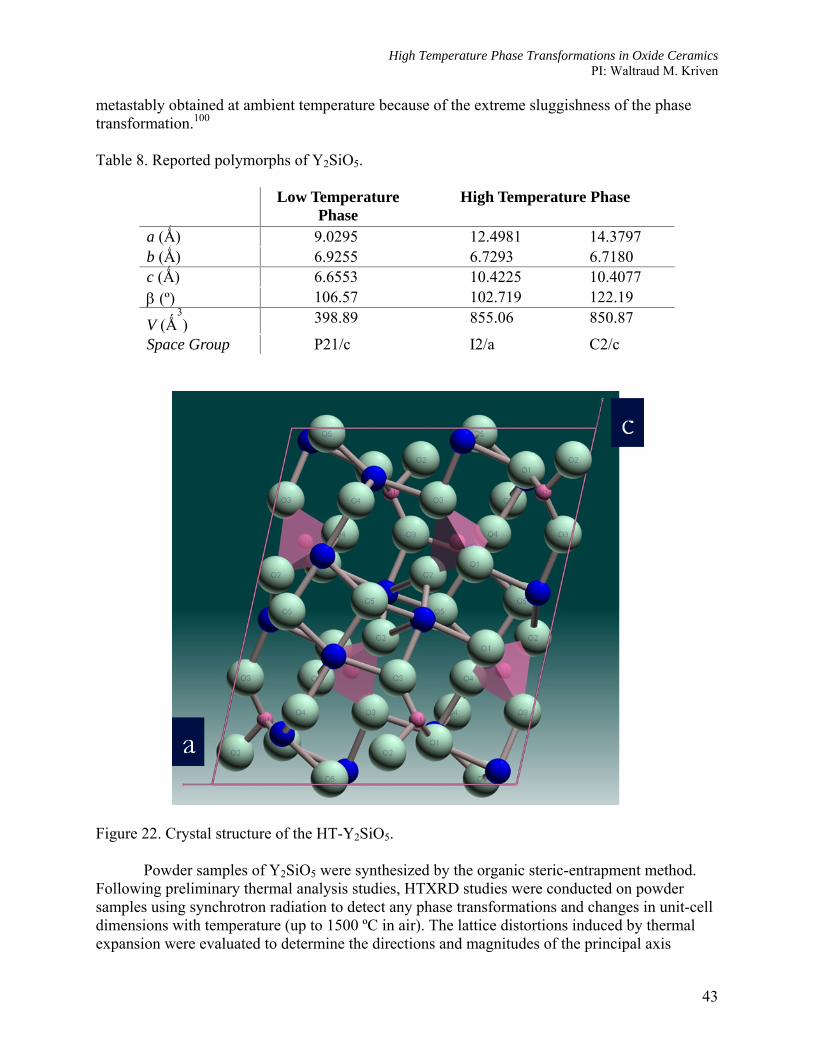
High Temperature Phase Transformations in Oxide Ceramics PI: Waltraud M. Kriven
metastably obtained at ambient temperature because of the extreme sluggishness of the phase transformation.100 Table 8. Reported polymorphs of Y2SiO5.
Low Temperature Phase
High Temperature Phase
a (Ǻ) 9.0295 12.4981 14.3797 b (Ǻ) 6.9255 6.7293 6.7180 c (Ǻ) 6.6553 10.4225 10.4077 β (º) 106.57 102.719 122.19
V (Ǻ3) 398.89 855.06 850.87
Space Group P21/c I2/a C2/c
Figure 22. Crystal structure of the HT-Y2SiO5.
Powder samples of Y2SiO5 were synthesized by the organic steric-entrapment method. Following preliminary thermal analysis studies, HTXRD studies were conducted on powder samples using synchrotron radiation to detect any phase transformations and changes in unit-cell dimensions with temperature (up to 1500 ºC in air). The lattice distortions induced by thermal expansion were evaluated to determine the directions and magnitudes of the principal axis
43

High Temperature Phase Transformations in Oxide Ceramics PI: Waltraud M. Kriven
components of the thermal expansion tensor. Detailed analysis of the observed thermal expansion behavior of Y2SiO5 was conducted. Experimental Procedures:
Yttrium monosilicate (Y2SiO5) powders were synthesized using the organic steric entrapment (PVA) method101-103 followed by powder attrition milling. The processing flowchart for synthesis of Y2SiO5 powder is shown in Fig. 23. Yttrium nitrate hexahydrate (Y(NO3)3•6H2O) (reagent grade, Aldrich Chemical Co., Milwaukee, WI) was used as a source for Y, while Ludox SK colloidal SiO2 (25 wt% SiO2 sol, DuPont, Wilmington, DE) was used to provide the SiO2. These cation sources were mixed in stoichiometric ratios in deionized water. To improve the solubility of the Ludox SK, the pH value of the solution was adjusted by addition of nitric acid. Once the cations sources were completely dissolved, the 5 wt% PVA solution (polyvinyl alcohol, 205S, Celanese chemicals Inc., Dallas, TX, USA) was added. Water was evaporated by continuous magnetic stirring and later, hand stirring with glass rods during heating on a hot plate, until the decomposition of the organic/inorganic precursors. The products of the decomposed organic/inorganic precursors were ground and annealed at a heating rate of 5 ºC/min, in air atmosphere in a box furnace at 800 ºC for 1 h, and white powders were obtained. To obtain finer and more uniform particles, the annealed powder derived from the PVA technique was subjected to wet attrition milling using 5 mm ZrO2 balls as milling media, and isopropyl alcohol (IPA) as the solution. The IPA was subsequently evaporated at 125 ºC in an oven, and the powders obtained were sieved through a 30~40 micron sieve. The powder was subjected to further heat treatment in air atmosphere at different temperatures (800, 1000, 1300, 1500 and 1650 ºC) holding for 1 h, using a heating rate of 5 ºC/min and cooled down at 5~10 ºC/min, to identify the optimum conditions to obtain crystalline Y2SiO5 powders. Crystalline composition of the as-milled and as-annealed yttrium silicate powder at different temperatures was evaluated by powder X-ray diffraction using the Rigaku D/Max diffractometer (Rigaku, Tokyo, Japan) equipped with a CuKα radiation source. XRD patterns were acquired over a wide 2θ range (5 to 75º) at a scanning speed of 0.4º/min with a sampling interval of 0.02º, and are included in Fig. 24. When calcined at 800 ºC, the diffraction peaks were wide and low in intensity, suggesting the presence of low crystallinity in the sample. When annealed at 1300 ºC for 1 h, low temperature Y2SiO5 phase, i.e. LT-Y2SiO5, was the predominant crystalline phase detected. Upon heating to 1500 ºC, high temperature Y2SiO5 phase, i.e. HT-Y2SiO5, was the only crystalline phase present. The XRD pattern acquired using powders heated to higher temperatures did not show any change, thereby confirming that pure HT-Y2SiO5 could be successfully synthesized at 1500 ºC. Since all the XRD patterns (in Fig 24) were acquired at room temperatures, it was concluded that the HT-Y2SiO5 was stable and did not transform back to the LT-Y2SiO5 phase upon cooling. The HT-Y2SiO5 powder samples were used to conduct preliminary TGA/DSC studies to verify phase stability and identify any phase transformations occurring upon heating. Sintered cylindrical bars were also prepared and studied using dilatometric methods. Lastly, the HTXRD studies were conducted using HT-Y2SiO5 powder samples to understand the thermal expansion behavior of this material system.
44

High Temperature Phase Transformations in Oxide Ceramics PI: Waltraud M. Kriven
Figure 23. Processing flowchart of the Y2SiO5 ceramic powders by the PVA method.
Y(NO3)3•6H2O De‐ionized water
PVA solution
Ludox
Precursor solution preparation by PVA
route:
Heated on a hot plate; magnetic stirring and hand stirring
Water evaporation Magnetic stirring
Powder calcination 800 oC/1h, in a furance
Powder wet attrition milling 50 rpm/1h, with a ball to charge weight ratio of ~23
Solvent evaporation
Sample powder
Annealing
125 oC, in an oven
T/t
45

High Temperature Phase Transformations in Oxide Ceramics PI: Waltraud M. Kriven
Figure 24. Room temperature XRD patterns from the synthesized Y2O3.SiO2 sample powders
when heat treated to 800ºC, 1300ºC, and to 1500ºC in air for 1 hour each. Preliminary Investigations:
Powder samples of the synthesized HT-Y2SiO5 phase were studied using DSC/TGA. Results of these studies are included in Fig. 25 for a cooling run where the sample was cooled from 1500 ºC to 25 ºC at the rate of 25 ºC/min in air. The TGA curve was invariant with temperature indicating no change in weight, and confirmed that the sample was stable and did not undergo any decomposition or volatilization up to 1500 ºC. No evidence of any phase transformation or change was detected in the DSC curve, once again confirming that the HT-Y2SiO5 phase was stable. This was also confirmed from the dilatometric studies (see Fig. 26) where a sintered cylindrical bar (approximately 95% dense) was cycled through heating, soaking, and cooling in the temperature range extending from 25 ºC to 1500 ºC in air at the rate of 3 ºC/min. The decrease in length observed in Fig. 27 was a result of sintering of the sample.
46

High Temperature Phase Transformations in Oxide Ceramics PI: Waltraud M. Kriven
Figure 25. DSC/TGA studies on HT-Y2SiO5.
Figure 26. Dilatometry studies on HT-Y2SiO5.
47

High Temperature Phase Transformations in Oxide Ceramics PI: Waltraud M. Kriven
Figure 27. In-situ HTXRD patterns of HT-Y2SiO5. HTXRD Studies:
HTXRD investigations were conducted on powder samples of the synthesized HT-Y2SiO5 phase using the QLF at X14A beamline at NSLS. X-rays with wavelength λ = 0.738236 Å were used along with a 640 channel Si-linear strip detector. A powder sample was mounted in a sapphire capillary which was rotated during data acquisition in transmission geometry. Sample temperature was determined from the expansion of Pt, which was mixed with the sample powder. Only a segment of the acquired 2θ range in the HTXRD patterns is presented in Fig. 27 to highlight the changes upon heating as well as cooling. The Bragg peaks moved towards lower 2θ values when the sample was heated, signifying lattice expansion, and moved toward higher 2θ on cooling, signifying lattice contraction. The HTXRD dataset was analyzed by whole pattern fitting methods using JADE software (MDI, Inc., Livermore, CA, USA). Continuous expansion was observed along all crystallographic axes and the monoclinic angle decreased from 122.2º to 121.9º (see Fig. 28). This data was used to calculate the coefficient of thermal expansion (CTE) along the a-, b- and the c-axes, and also the crystal volume. Fig. 29 shows the variation of the CTEs with temperature and the representative polynomial expressions are included in Table 9. Second order polynomials were used as they fit the CTE data best, both in terms of the statistical goodness-of-fit parameter as well as the randomness of residuals.
48
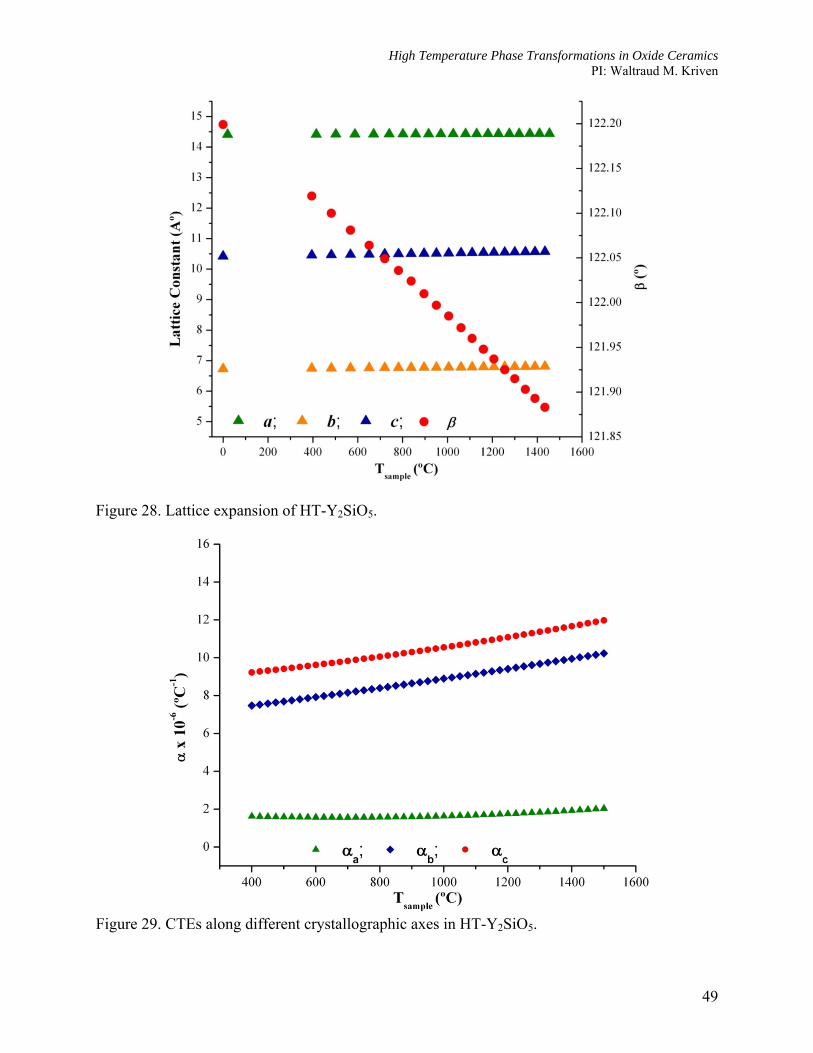
High Temperature Phase Transformations in Oxide Ceramics PI: Waltraud M. Kriven
Figure 28. Lattice expansion of HT-Y2SiO5.
Figure 29. CTEs along different crystallographic axes in HT-Y2SiO5.
49

High Temperature Phase Transformations in Oxide Ceramics PI: Waltraud M. Kriven
Table 9. Thermal expansion of HT-Y2SiO5 as determined from HTXRD studies using synchrotron radiation. Polynomial expressions for CTEs along each of the crystal axis, and for volume expansion are reported for 20 to 1455 ºC temperature range.
Lattice Parameter Coefficient of Thermal Expansion (ºC-1) Temperature (°C)
a αa = 1.89 x 10⁻⁶ – 9.57 x 10⁻¹⁰ (T-20) + 7.17 x 10⁻¹³ (T-20)2 20 - 1455
b αb = 6.67 x 10⁻⁶ + 2.01 x 10⁻⁹ (T-20) + 2.67 x 10⁻¹³ (T-20)2 20 - 1455
c αc = 8.61 x 10⁻⁶ + 1.39 x 10⁻⁹ (T-20) + 5.95 x 10⁻¹³ (T-20)2 20 - 1455
Volume β = 1.87 x 10⁻⁵ + 3.96 x 10⁻⁹ (T-20) + 1.01 x 10⁻¹² (T-20)2 20 - 1455
The thermal expansion coefficient of the crystal can be easily calculated from the
polynomial that represents the lattice parameter as a function of the temperature. However, in the general case, these data do not allow one to describe completely the thermal behavior of the crystal. Since the strain in crystals is described by a second-rank tensor, correspondingly, the thermal expansion is also represented by the second-rank tensor. It is more convenient to represent the tensor in the form reduced to the principal axes, i.e., in the Cartesian coordinate system in which the tensor is described by the diagonal matrix. The crystal symmetry imposes limitations on the thermal expansion tensor. There is a definite relationship between the Cartesian coordinate system of the CTE tensor and the crystallographic axes. In crystals of the cubic crystal system, all diagonal components of the thermal expansion tensor (α1, α2, α3) are equal to each other, the other components are identically equal to zero, and the principal axes can be chosen in an arbitrary manner (it is common practice to choose them in parallel to the crystallographic axes). Crystals of the oblique crystal systems (monoclinic, triclinic), however, occupy a special place. In this case, the problem associated with the determination of orientation of the principal axes and the principal components of the thermal expansion tensor with respect to the crystal axes is not straightforward. The solution of this problem requires additional calculations, and researchers often restrict themselves only to the calculation of the thermal expansion coefficients along the crystallographic axes.
In the case of HT-Y2SiO5, the thermal expansions perpendicular to several hkl planes (more than 200) were used to determine the thermal expansion tensor by least squares methods. Subsequently, the tensor was transformed to principal axes components or eigenvectors. Fig. 30 shows the variation of the CTE tensors principal axis components with temperature and the representative polynomial expressions are included in Table 10. Since the coefficients of thermal expansion depend on temperature, the directions of the principal axes of the quadrics in triclinic and monoclinic crystals also changes with temperature (except the principal axis parallel to the two-fold axis in monoclinic crystals). In Fig. 31 the variation in the angle between the principal axes of the CTE tensor and the a- and c-axes of the HT-Y2SiO5 monoclinic crystal, as a function of temperature is shown. Fig. 32 shows a graphical representation of orientation relationship between the principal axes and the crystal system axes at two different temperatures, namely 850 ºC and 1450 ºC. One of the principal axes is oriented parallel to the two-fold crystal axis, the b-axis, and the other two lie in the 010 plane.
50

High Temperature Phase Transformations in Oxide Ceramics PI: Waltraud M. Kriven
Figure 30. Plot showing CTE vs T along the principal axes in HT-Y2SiO5. Table 10. Thermal expansion of HT-Y2SiO5 as determined from HTXRD studies using
synchrotron radiation. Polynomial expressions for the eigenvectors for the thermal expansion tensor reported for 500 to 1450 ºC temperature range.
Eigenvector Coefficient of Thermal Expansion (ºC-1) Temperature (°C)
α1 α1 = 1.77 x 10⁻⁶ + 1.75 x 10⁻⁹ T - 7.60 x 10⁻¹³ T2 500 - 1450
α2 α2 = 7.41 x 10⁻⁶ + 1.37 x 10⁻¹⁰ T + 1.33 x 10⁻¹² T2 500 - 1450
α3 α3 = 1.05 x 10⁻⁵ + 5.98 x 10⁻⁹ T - 1.47 x 10⁻¹² T2 500 - 1450
αavg αavg = 6.57 x 10⁻⁶ + 2.62 x 10⁻⁹ T - 2.99 x 10⁻¹³ T2 500 - 1450
Volume β = 1.97 x 10⁻⁵ + 7.867 x 10⁻⁹ T - 0.9 x 10⁻¹² T2 500 - 1450
51

High Temperature Phase Transformations in Oxide Ceramics PI: Waltraud M. Kriven
Figure 31. Orientation of eigenvectors wrt crystallographic a- and c-axes in HT-Y2SiO5.
Figure 32. Graphic representation of the orientation of eigenvectors wrt crystallographic a- and
c-axes in HT-Y2SiO5 at 850ºC and at 1450 ºC.
When investigating the thermal expansion of crystals, there exists one more problem that of constructing the thermal expansion diagram, whose graphical representation makes it possible to visualize qualitatively and quantitatively the thermal expansion anisotropy of crystals. The thermal expansion diagram is an indicatrix of the tensor. The magnitudes of the radius vectors of the points at the indicatrix indicate the magnitude (coefficient) of thermal expansion in the
52

High Temperature Phase Transformations in Oxide Ceramics PI: Waltraud M. Kriven
direction of this radius vector. The thermal ellipsoid or the thermal expansion diagram for the HT-Y2SiO5 at 1450 ºC, as determined in this study, is shown in Fig. 33.
Figure 33. Thermal ellipsoid or thermal expansion diagram for HT-Y2SiO5 at 1450 ºC.
Further analysis will be conducted to understand the expansion of individual bonds in the HT-Y2SiO5 phase, which can lead to an improved understanding of the role of individual atoms in contributing towards the anisotropy in thermal expansion. This work will be presented as an archival publication. Based on the studies conducted in this project, it may be reasonable to state that the HT-Y2SiO5 phase is stable, and does not undergo any phase transformation on cooling, although extended studies subjecting this phase to operational conditions are highly recommended to verify this assertion. If this material system is used as a top coat as an EBC, it will be important to take into consideration the anisotropy exhibited in its thermal expansion to ascertain the extent of interfacial stresses that can be generated. The top coat may have to be engineered in a way so as to minimize the stresses and thus promote the stability of the coating. 5.3.2 CaWO4 Background:
CaWO4 with a scheelite structure is a potential material for use as fiber–matrix interlayer in all-oxide, high temperature, ceramic matrix composites (CMCs).104 It has been shown to be thermodynamically stable with, and to bond weakly to, common structural oxides, is refractory (Tmelt = 1580 ºC), and has low hardness (Moh's hardness 4.5–5). The thermo-mechanical properties of CaWO4, such as thermal expansion, elastic constants, fracture toughness, hardness, and more importantly, the anisotropy of these properties can be important considerations in the design of future CMCs with CaWO4 as a fiber-matrix interlayer.
53

High Temperature Phase Transformations in Oxide Ceramics PI: Waltraud M. Kriven
Oxides of the type ABO4 are of interest due to their many applications in current technology. Binary oxides with the general formula ABO4, in which A and B cations can be multivalent and compositely substituted, have several common structure types. Many ABO4 oxides, for example, silicates, phosphates, arsenates, vanadates and chromates are isostructural with zircon (I41/amd, No.141); several phosphates, arsenates occur as polymorphs of quartz; a few ABO4 oxides, e.g., germanates, molybdates, tungstates and periodates crystallize in the scheelite structure (I41/a, No.88); a large number of molybdates, tungstates and tantalates crystallize with the wolframite structure (P2/c, No.13); relatively few ABO4 oxides exist as M'-fergusonite structures (P21/c, No.14) or M'-fergusonite under normal conditions, but lots of ABO4 oxides transform from zircon or scheelite structures to M'-fergusonite under pressure; the fergusonite structure can be viewed as a distorted scheelite structure.105
The A-, B-, and the O-ions in the zircon and scheelite structures show identical coordination environment, respectively. In these two structures, the A cations are surrounded by eight oxygen atoms with two different distances, the B cations coordinate with four oxygen atoms, and the oxygen anions are connected with two A-ion and one B-ion. However the BO4 tetrahedra in the zircon structure are less distorted than those in the scheelite structure. Moreover, the latter structure is more densely packed than the former. Compared with the zircon structure, the scheelite structure is characterized by a layered stacked cell, and so it can be readily distinguished from the other structures exhibited by ABO4 oxides.105
In view of the structural diversity and the A- and B-ion variety and the various properties and applications, ABO4 oxides are important materials from both theoretical and technological standpoints. As a basic thermophysical property, the thermal expansion behaviors of ABO4 compounds are widely needed.
Due to the appeal of CaWO4 as a material for cryogenic applications, the thermal expansion of this material at low temperatures has been studied by many researchers. Studies have also been conducted on low-temperature thermal expansions, and have found the linear thermal expansion of the material to vary significantly with temperature. At 30 K, the linear expansion was as low as 1.0 x 10⁻⁶/K and 0.2 x 10⁻⁶/ K for parallel and perpendicular to the c axis, respectively. At 270 K, though, these values increased to 15.3 x 10⁻⁶/K and 9.2 x 10⁻⁶/K.106
Many studies have also focused on the high-pressure structure of CaWO4. While no phase changes occur in the material with increase in temperature, pressure-induced phase changes have been observed. At around 10 GPa, a phase change from the tetragonal scheelite structure to a monoclinic structure occurs.107-109
While the expansion of CaWO4 has been studied exhaustedly under high pressure and for low temperatures, few studies have reported the thermal expansion of the material at high temperatures. A study by Achary et al. (2006)110 examined the thermal expansion of CaWO4 by HTXRD. However, this study was limited in examining the thermal expansion up to a temperature of 1000 °C, much lesser than foreseeable range of temperatures for processing of most CMCs and their operational conditions. Previous studies have noted high anisotropy in the thermal expansion of the material.110 In examining the exact way in which a material expands, lattice vibrations and expansion of the lattice are better understood. Through the study of the thermal expansion of CaWO4, the behavior of other materials of ABO4 formula can be better characterized and perhaps provide invaluable insight into identifying potential new materials belonging to the same family which can display useful phase transformational behavior.
The scheelite structure may be regarded as a cubic close-packed array of A2+ and BO42-
units which are ordered. The oxygens are coordinated to two A cations and one B cation in the
54

High Temperature Phase Transformations in Oxide Ceramics PI: Waltraud M. Kriven
scheelite structure. Fig. 34 shows the atom positions in the unit cell of the crystal.111 Four oxygen atoms are arranged around the tungsten in an isolated tetrahedron, which is compressed along the c axis by 7% over a regular tetrahedron. It should be noted that the presence of the isolated WO4
2− tetrahedra is a distinctive feature of the scheelite structure that substantiates the use of a quasimolecular anion complex approximation for the interpretation of the physical properties of the crystal. Each Ca2+ cation shares corners with eight adjacent WO4
2− tetrahedra. The bond between the Ca2+ cation and WO4
2− anion is mainly ionic, whereas inside the WO42- complex the
W-O bonds are primarily covalent.
Figure 34. Unit and primitive cell of CaWO4 scheelite structure.111
In this project, the thermal expansion of CaWO4 was investigated with the objective of understanding the role played by the Ca and the W ions in inducing anisotropy. In this process, the expansion tendency was analyzed from the chemical bond viewpoint. Contributions from all the chemical bonds, such as Ca-O and W-O, and their variation with temperature such as change in length or tilting of polyhedra axis, were considered, in order to develop a better understanding of the origin of the anisotropic expansion behavior in CaWO4 ceramics.
Experimental Procedures: An attempt to synthesize CaWO4 powder was first made using the organic steric entrapment (PVA) method.101-103 Calcium nitrate tetrahydrate (Ca(NaO3)2•4H2O, 99.99%, Aldrich Chemical Inc., WI, USA) and anhydrous ammonium
55

High Temperature Phase Transformations in Oxide Ceramics PI: Waltraud M. Kriven
tungstate ((NH4)10H2(W2O7)6, >99.0%, Aldrich Chemical Inc., WI, USA) were used as a source of Ca2+ and W6+ cations. Stoichiometric proportions of these compounds were first dissolved in distilled deionized water. Subsequently, 5% PVA solution (polyvinyl alcohol, 205S, Celanese Ltd., Dallas, TX, USA) was added to the solution such that, for each mole of CaWO4 to be produced, 2 moles of PVA were present. The mixture was heated on a hot plate while stirring and the resultant powders were calcined at 1000 ºC. XRD analysis of the powders revealed the presence of scheelite phase along with tungsten oxide. As a result, the synthesized powders were not deemed suitable for high temperature investigations using DSC/TGA as well as by HTXRD. After a few failed attempts at changing the experimental parameters to synthesize a pure scheelite CaWO4 phase, it was decided to purchase commercially available powders (CaWO4, Sigma-Aldrich, USA) in order to pursue further studies on this material system. Since there is no known phase transformation in this material system at high temperatures, the preliminary investigations including the TGA/DSC studies and dilatometric evaluation was not performed. The HTXRD studies were conducted on CaWO4 powder samples (mixed with Pt powder) to investigate the thermal expansion behavior. HTXRD Studies:
HTXRD experiments were conducted at beamline 33BM-C at APS using the CIP detector and X-rays with wavelength λ = 0.5899 Å. The powder sample of CaWO4 (mixed with Pt) was mounted in a sapphire capillary which was heated using the QLF. HTXRD patterns were collected in transmission geometry while rotating the sample in order to minimize any effects of texturing. Sample temperature was determined from the expansion of Pt. Several XRD patterns were acquired at each temperature to improve the S/N ratio, and data was acquired from room temperature up to 1450 ºC in air. Only a segment of the acquired 2θ range in the HTXRD patterns is presented in Fig. 35 in order to highlight the changes upon heating only, although XRD patterns were also collected during cooling. The high intensity peak at ~14.2º in Fig. 35 is from the sapphire capillary and has been truncated to avoid any confusion. Overall, the Bragg peaks for CaWO4 moved towards lower 2θ values when the sample was heated, signifying lattice expansion, and moved toward higher 2θ on cooling, signifying lattice contraction. The HTXRD dataset was analyzed by whole pattern fitting methods using JADE software (MDI, Inc., Livermore, CA, USA). Continuous expansion was observed along all crystallographic axes and the unit cell volume (see Fig. 36 and 37). This data was used to calculate the coefficient of thermal expansion (CTE) along the a-, b- and the c-axes, and also for the crystal volume. Fig. 38 shows the variation of the CTEs with temperature and the representative polynomial expressions are included in Table 11. First order polynomials were used as they fit the CTE data best, both in terms of the statistical goodness-of-fit parameter as well as the randomness of residuals.
As can be seen from Fig. 38, the CaWO4 lattice expanded considerably more along the c-axis than along the a- or b-axis. This attribute is better presented as an anisotropy index, which is the ratio of thermal expansion coefficients measured along the c-axis, to that along the a- or b- axes, i.e. αc/αa or αc/αb. Furthermore, the anisotropy factor was not constant with temperature and was found to increase by approximately 37% from 1.42 at 700 ºC to 1.94 at 1450 ºC (see Fig. 39). This type of thermal expansion behavior is very interesting for academic understanding of the expansion of bonds, especially since W is more than four times heavier than Ca. Further analysis on the dataset is underway, and it is expected that very useful insight will be gained into the role of the type of ion and its location in the structure towards inducing anisotropy in the
56

High Temperature Phase Transformations in Oxide Ceramics PI: Waltraud M. Kriven
57
thermal expansion properties. The results of these findings will be presented in a separate peer reviewed article in the near future.
Figure 35. HTXRD patterns for CaWO4 collected from 20 ºC to 1450 ºC, in air using
synchrotron radiation.

High Temperature Phase Transformations in Oxide Ceramics PI: Waltraud M. Kriven
Figure 36. Lattice expansion of CaWO4 along its crystallographic axes.
58
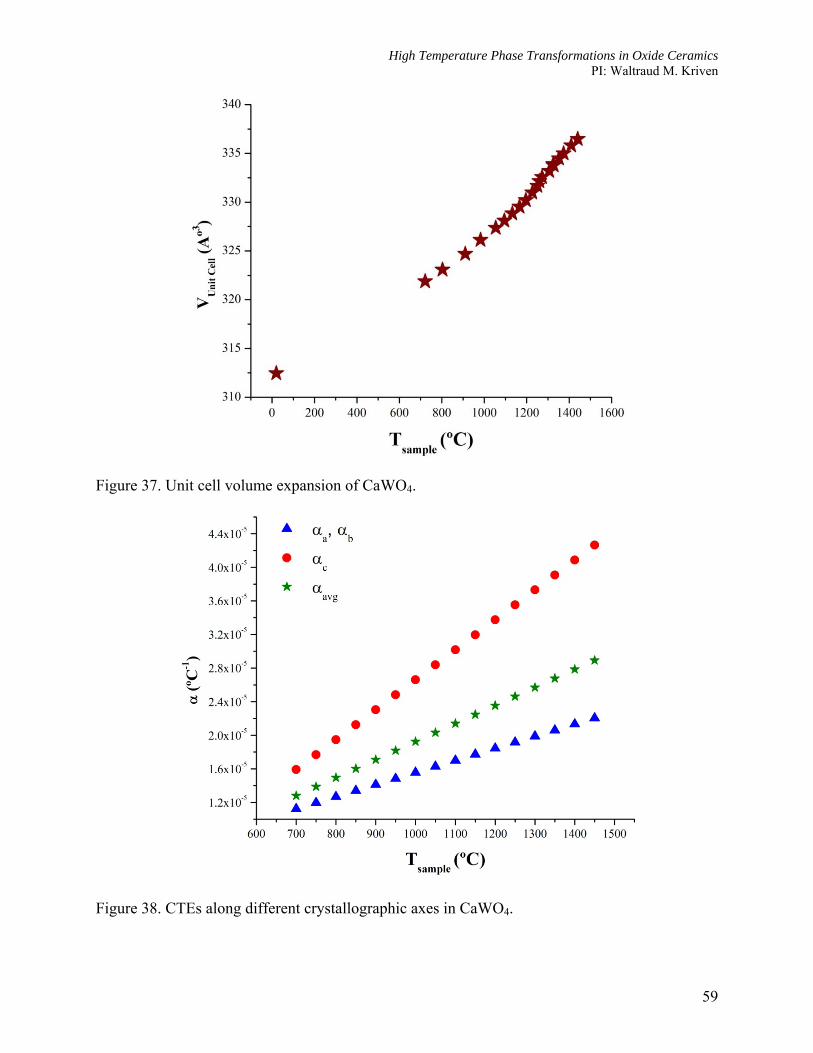
High Temperature Phase Transformations in Oxide Ceramics PI: Waltraud M. Kriven
Figure 37. Unit cell volume expansion of CaWO4.
Figure 38. CTEs along different crystallographic axes in CaWO4.
59

High Temperature Phase Transformations in Oxide Ceramics PI: Waltraud M. Kriven
Table 11. Thermal expansion of CaWO4 as determined from HTXRD studies using synchrotron radiation. Polynomial expressions for CTEs along each of the crystal axis, their Linear Average and for volume expansion are reported for the 700 to 1450 ºC temperature range.
Lattice Parameter Coefficient of Thermal Expansion (ºC-1) Temperature (°C)
a αa = 1.45 x 10⁻⁶ + 1.44 x 10⁻⁸ (T-20) 700 - 1450
b αb = 1.45 x 10⁻⁶ + 1.44 x 10⁻⁸ (T-20) 700 - 1450
c αc = -8.33 x 10⁻⁶ + 3.56 x 10⁻⁸ (T-20) 700 - 1450
Linear Average αavg = -1.81 x 10⁻⁶ + 2.15 x 10⁻⁸ (T-20) 700 - 1450
Volume β = -5.42 x 10⁻⁶ + 6.44 x 10⁻⁹ (T-20) 700 - 1450
Figure 39. Anisotropy in expansion of the CaWO4 crystal.
60

High Temperature Phase Transformations in Oxide Ceramics PI: Waltraud M. Kriven
5.3.3 CePO4 Background:
Despite the fact that the number and diversity of the crystalline phosphates is comparable with the silicates, orthophosphates represent the only phosphate compounds commonly found in nature. Among these compounds, rare-earth (RE) orthophosphates are probably the most refractory and insoluble materials.112 These properties provide the basis for interest in their use in a wide range of applications. Monazite is a monoclinic rare-earth orthophosphate mineral with the composition of RPO4, where R is mostly Ce, with smaller amounts of La, Pr, Nd, Sm, and Th. The melting points of monazites are about 2045 ± 25 ºC or higher in air.113-115 CePO4, and its solid solutions, constitute a long-standing interesting research topic because CePO4 possesses the most stable chemical properties of all minerals116 and is infusible even up to 2223 K.117 Furthermore, CePO4 can form solid solutions with many metal ions and these properties make it of wide application in nuclear waste reduction.118, 119 As one way of increasing the toughness of ceramic materials, CePO4 has been coated on the short fiber of Al2O3 as a crack deflecting source after forming a weak bonding at the interface.120 As a machinable ceramic, reported to have some “ductile” properties, CePO4 was studied by J. B. Davis et al. (1998)121 and W. Lijuan et al. (2003)122 In light of the variety of current and potential future applications of the CePO4, coupled with research interest in their fundamental properties, there is a surprising paucity of high temperature property data for this material system.
The crystal structure of CePO4 has been determined by modern X-ray crystallographic techniques. The unit cell is monoclinic (space group P21/n) with a = 6.7902 Å, b = 7.0203 Å, c = 6.4674 Å, and β = 103.54º. The structure is made up of irregular 9-coordinated cerium atoms linked together by distorted tetrahedral phosphate groups (see Fig. 40).123 In this study, CePO4 was chemically synthesized and high temperature properties were studied using DSC/TGA, dilatometry and in-situ high temperature X-ray diffraction using synchrotron radiation, with the objective of exploring anisotropy in thermal expansion and/or any associated phase transformations at high temperatures in air. Experimental Procedures:
Cerium phosphate powder was synthesized by the organic, steric entrapment method (see Fig. 41).101-103 Cerium (III) nitrate hexahydrate (Ce(NO3)3•6H2O, 99%, Aldrich Chemical Inc., WI, USA) and phosphorous acid (H3PO3, 99%, Aldrich Chemical Inc., WI, USA) were used as Ce+4 and P+5 sources, respectively. Appropriate amounts of chemicals were dissolved in deionized water and mixed for 30 min. 5 wt% PVA (polyvinyl alcohol, 205S, Celanese Ltd., Dallas, TX, USA) solution was added, followed by another 50 min of mixing. The final solution was heated to remove water and NOx gases, and finally yellow cakes were obtained. The resulting cakes were ground using a mortar and pestle and calcined at 900 ºC for 1 h with a ramp rate of 5 ºC/min. The calcined powder was attrition milled for 1 h, dried, and passed through a 100 mesh sieve. Subsequently, the powder was heated to 1200 ºC to yield crystalline monoclinic CePO4 phase, which was verified using XRD (see Fig. 42).
61

High Temperature Phase Transformations in Oxide Ceramics PI: Waltraud M. Kriven
Figure 40. Crystal structure of CePO4 viewed down the b-axis.
Figure 41. Flow chart of synthesis of CePO4.
62

High Temperature Phase Transformations in Oxide Ceramics PI: Waltraud M. Kriven
Figure 42. Room temperature XRD pattern of the synthesized CePO4 phase. Preliminary Investigations:
The TGA/DSC studies (not shown) on the synthesized CePO4 phase did not show any remarkable changes in weight or in the DSC signal, thereby confirming that the phase was stable and did not appear to undergo any phase transformation upon heating. The results of the dilatometry studies are presented in Fig. 43. The dilatometric studies were conducted on a cylindrical specimen which had been sintered at 1600 ºC for 10h. The sample density, as determined using pycnometry was 4.89 g/cm3, and was 3.54 % porous. The sample was heated and cooled at 5ºC/min from 20 ºC to 1550 ºC. The noisy nature of the dilatometry plot should not be misinterpreted as any drastic changes in thermal expansion, and are merely an experimental artifact.
63

High Temperature Phase Transformations in Oxide Ceramics PI: Waltraud M. Kriven
Figure 43. Dialtometric studies on CePO4.
Figure 44. HTXRD patterns collected using powder CePO4 specimen and synchrotron radiation
over a temperature range from 20 ºC to 1575 ºC in air.
64

High Temperature Phase Transformations in Oxide Ceramics PI: Waltraud M. Kriven
65
HTXRD Studies: HTXRD investigations were conducted using the QLF at X14A NSLS beamline at
Brookhaven National Laboratory using X-rays with λ = 0.72978 Å and a 640 channel Si-linear strip detector. The powder sample was mounted in a sapphire capillary which was rotated during data acquisition in transmission geometry. Sample temperature was determined from the expansion of Pt, which was mixed with the sample powder. Only a segment of the collected 2θ range in the HTXRD patterns is presented in Fig. 44 to highlight the structural changes upon heating. Overall, the Bragg peaks for CePO4 moved towards lower 2θ values when the sample was heated, signifying lattice expansion, and moved toward higher 2θ on cooling signifying lattice contraction (not shown). The HTXRD dataset was analyzed by whole pattern fitting methods using JADE software (MDI, Inc., Livermore, CA, USA). Continuous expansion was observed along all crystallographic axes and the unit cell volume (see Fig. 45 and 46). The change in the monoclinic angle β was minimal (< 0.1º) throughout the temperature range. This data was used to calculate the coefficient of thermal expansion (CTE) along the a-, b- and the c-axes (see Fig. 47), and also for the crystal volume (Fig. 48). Fig. 47 shows the linear variation of the CTEs with temperature and the representative polynomial expressions are included in Table 12. First order polynomials were used as they fit the CTE data best, both in terms of the statistical goodness-of-fit parameter as well as the randomness of residuals.
As can be seen from Fig. 47, the expansion of the CePO4 lattice along the c-axis was the largest, while than along the b-axis was the least. The expansion along the a-axis changed most significantly from 20 ºC to 1575 ºC, and was almost similar to that along the c-axis around 1575 ºC. The volume expansion coefficient, shown in Fig 48 was linear with temperature. Although these studies show the stable nature of the CePO4 structure over a wide range of temperature, this type of thermal expansion behavior is very interesting for academic understanding of the expansion of bonds, especially since Ce is more than four times heavier than P. Further analysis on the dataset is underway, and it is expected that very useful insight will be gained into the role of the type of ion and its location in the structure towards inducing anisotropy in the thermal expansion properties. The results of these findings will be presented in a separate peer reviewed article in near future, and will be quite useful in designing advanced composites using CePO4 as a weakly bonding interphase.

High Temperature Phase Transformations in Oxide Ceramics PI: Waltraud M. Kriven
Figure 45. Lattice expansion of CePO4 along different crystallographic axes.
Figure 46. Change in the monoclinic angle and the unit cell volume with temperature in the CePO4 system.
66

High Temperature Phase Transformations in Oxide Ceramics PI: Waltraud M. Kriven
Figure 47. Coefficient of thermal expansion of CePO4 along different crystallographic axes.
Figure 48. Coefficient of volume expansion of CePO4 as determined using HTXRD.
67

High Temperature Phase Transformations in Oxide Ceramics PI: Waltraud M. Kriven
Table 12. Thermal expansion of CePO4 as determined from HTXRD studies using synchrotron radiation. Polynomial expressions for CTEs along each of the crystal axis, their Linear Average and for volume expansion are reported for 20 to 1575 ºC temperature range.
Lattice Parameter Expression for Coefficient of Thermal Expansion Temperature (°C)
a αa = 7.46 x 10⁻⁶ + 4.87 x 10⁻⁹ (T-20) 20 - 1575
b αb = 6.90 x 10⁻⁶ + 2.02 x 10⁻⁹ (T-20) 20 - 1575
c αc = 9.29 x 10⁻⁶ + 3.83 x 10⁻⁹ (T-20) 20 - 1575
Linear Average αavg = 7.88 x 10⁻⁶ + 3.58 x 10⁻⁹ (T-20) 20 - 1575
Volume β = 2.38 x 10⁻⁵ + 1.02 x 10⁻⁸ (T-20) 20 - 1575
5.3.4 YTaO4 Background:
The R2O3–Ta2O5 system (where R is a rare-earth element) has been of interest from the standpoint of the science and technology of high-temperature structural ceramics, such as refractories and coatings, and of functional ceramics, such as lasers, optoelectronics, ferroelectronics, and solid-state ionics.124 Rare-earth tantalates and related solid solutions are used as materials for high- and low-pressure luminescent lamps and coatings of x-ray screens. According to phase equilibrium diagrams of the R2O3–Ta2O5 systems, three compounds, with R2O3:Ta2O5 stoichiometries of 3:1, 1:1, and 1:3, commonly represent stable phases. YTaO4 is the 1:1 composition phase for the Y2O3–Ta2O5 system.
At low temperatures, YTaO4 has a monoclinic structure (Fig. 49), with S.G. P2a, a = 5.292 Å, b = 5.451 Å, c = 5.11 Å, β = 86.74°, Z = 4, and belongs to the fergusonite structure family, which is closely related to the fluorite structure. The fluorite structure, named after the mineral fluorite, CaF2, is cubic and can be thought of as an alternate stacking of full and empty boxes, with anions at every corner and a cation in the middle of each full box. The coordination number of the cation is eight (anions at corner of cube) and that of the anion is four, reflecting the stoichiometry of two anions for each cation. In the fergusonite structure, the cations are in a pseudo-fcc arrangement, forming a stable cation framework with interatomic distances in the range 3.6 to 4.3 Å. Moreover, in the fluorite structure, all of the cations are in eightfold coordination, whereas the fergusonite structure is made up of TaO6 and YO8 polyhedra. Each YO8 polyhedron (distorted cube) shares edges with four neighboring eight-vertex polyhedra so as to form (100) cation slabs. The Y cation slabs are linked by the TaO6 polyhedra. The coordination polyhedron of Ta is regarded as a semidodecahedron (4 + 2), rather than as a distorted octahedron.
68
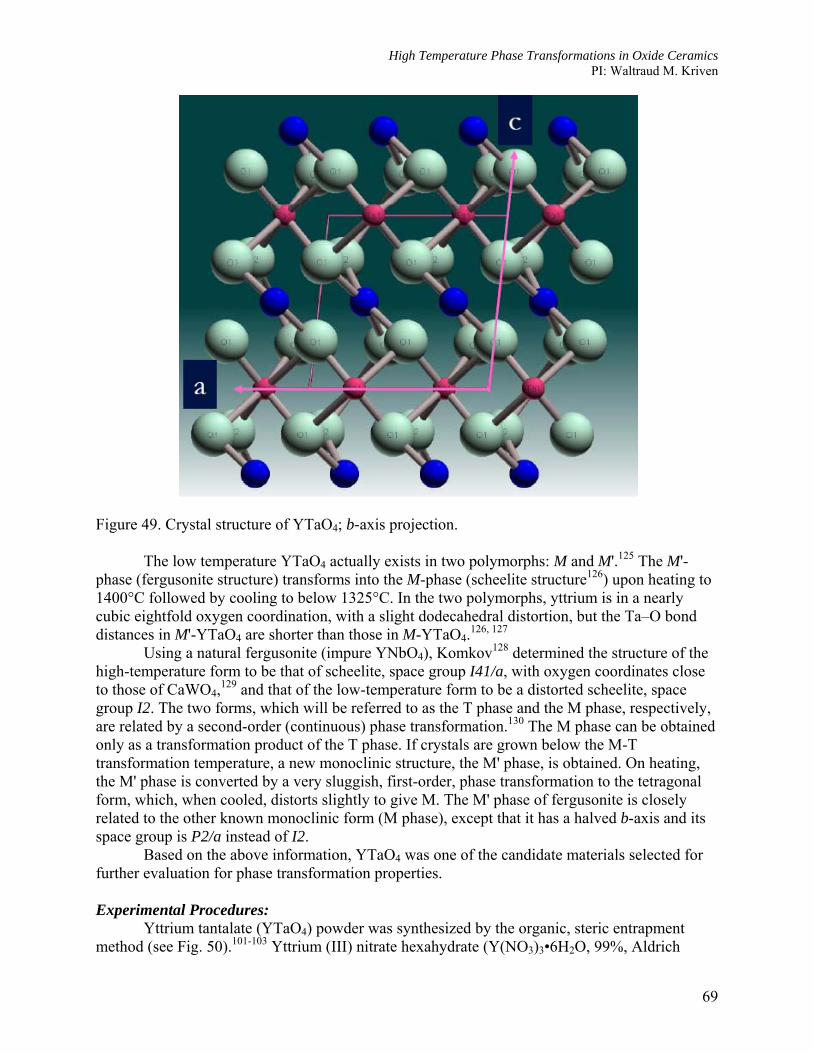
High Temperature Phase Transformations in Oxide Ceramics PI: Waltraud M. Kriven
Figure 49. Crystal structure of YTaO4; b-axis projection.
The low temperature YTaO4 actually exists in two polymorphs: M and M'.125 The M'-phase (fergusonite structure) transforms into the M-phase (scheelite structure126) upon heating to 1400°C followed by cooling to below 1325°C. In the two polymorphs, yttrium is in a nearly cubic eightfold oxygen coordination, with a slight dodecahedral distortion, but the Ta–O bond distances in M'-YTaO4 are shorter than those in M-YTaO4.126, 127
Using a natural fergusonite (impure YNbO4), Komkov128 determined the structure of the high-temperature form to be that of scheelite, space group I41/a, with oxygen coordinates close to those of CaWO4,129 and that of the low-temperature form to be a distorted scheelite, space group I2. The two forms, which will be referred to as the T phase and the M phase, respectively, are related by a second-order (continuous) phase transformation.130 The M phase can be obtained only as a transformation product of the T phase. If crystals are grown below the M-T transformation temperature, a new monoclinic structure, the M' phase, is obtained. On heating, the M' phase is converted by a very sluggish, first-order, phase transformation to the tetragonal form, which, when cooled, distorts slightly to give M. The M' phase of fergusonite is closely related to the other known monoclinic form (M phase), except that it has a halved b-axis and its space group is P2/a instead of I2.
Based on the above information, YTaO4 was one of the candidate materials selected for further evaluation for phase transformation properties. Experimental Procedures:
Yttrium tantalate (YTaO4) powder was synthesized by the organic, steric entrapment method (see Fig. 50).101-103 Yttrium (III) nitrate hexahydrate (Y(NO3)3•6H2O, 99%, Aldrich
69
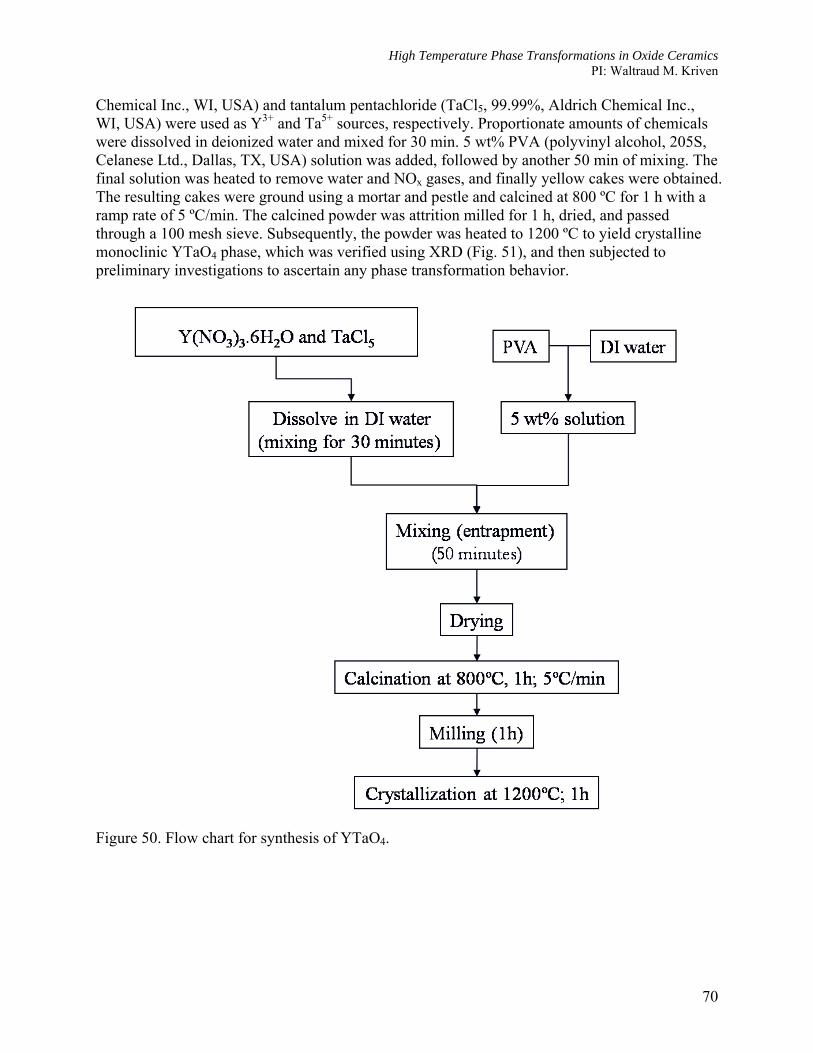
High Temperature Phase Transformations in Oxide Ceramics PI: Waltraud M. Kriven
Chemical Inc., WI, USA) and tantalum pentachloride (TaCl5, 99.99%, Aldrich Chemical Inc., WI, USA) were used as Y3+ and Ta5+ sources, respectively. Proportionate amounts of chemicals were dissolved in deionized water and mixed for 30 min. 5 wt% PVA (polyvinyl alcohol, 205S, Celanese Ltd., Dallas, TX, USA) solution was added, followed by another 50 min of mixing. The final solution was heated to remove water and NOx gases, and finally yellow cakes were obtained. The resulting cakes were ground using a mortar and pestle and calcined at 800 ºC for 1 h with a ramp rate of 5 ºC/min. The calcined powder was attrition milled for 1 h, dried, and passed through a 100 mesh sieve. Subsequently, the powder was heated to 1200 ºC to yield crystalline monoclinic YTaO4 phase, which was verified using XRD (Fig. 51), and then subjected to preliminary investigations to ascertain any phase transformation behavior.
Figure 50. Flow chart for synthesis of YTaO4.
70

High Temperature Phase Transformations in Oxide Ceramics PI: Waltraud M. Kriven
Figure 51. XRD pattern of the synthesized monoclinic YTaO4 phase. Preliminary Investigations:
The results of TGA/DSC and dilatometry studies are presented in Figs. 52 and 53, respectively. In the TGA/DSC studies, a powder sample of YTaO4 was heated/cooled from 30 ºC to 1500 ºC at the rate of 20 ºC/min. No change in mass was observed during the experiment. The DSC measurements suggest possible transformation(s) on cooling from 1500 ºC. The dilatometric studies were conducted on a cylindrical specimen which had been sintered at 1600 ºC for 2h. The sample density, as determined using pycnometry was 6.97 g/cm3, and was 3.15 % porous. The sample was heated and cooled at 3ºC/min from 20 ºC to 1550 ºC. The phase transformation on cooling from 1500 ºC is apparent in the sudden jump in the signal as shown in Fig. 53.
71

High Temperature Phase Transformations in Oxide Ceramics PI: Waltraud M. Kriven
Figure 52. TGA/DSC studies on powder sample of YTaO4 system.
Figure 53. Dilatometry studies of YTaO4 suggest possible transformation on cooling at ~1400 ºC.
The solid line represents strain (dL/L0) while the dotted line is the calculated α, linked to the Y axis on the right hand side.
72

High Temperature Phase Transformations in Oxide Ceramics PI: Waltraud M. Kriven
HTXRD Studies: HTXRD investigations were conducted using the QLF at X14A NSLS beamline at
Brookhaven National Laboratory using X-rays with λ = 0.72978 Å and a 640 channel Si-linear strip detector. A powder sample was mounted in a sapphire capillary which was rotated during data acquisition in transmission geometry. Sample temperature was determined from the expansion of Pt, which was mixed with the sample powder. Only a segment of the collected 2θ range in the HTXRD patterns is presented in Fig. 54 to highlight the structural changes upon cooling which are apparent in the merging and splitting of the Bragg reflections peaks (e.g. at 2θ ≈ 17º). Detailed crystallographic analysis to interpret the transformation and the mechanism are underway, and will be presented in an archival publication in the near future.
Figure 54. HTXRD studies on powder sample of YTaO4 using the QLF and a Si-linear strip
detector. (Note: The temperature labeled in the figure is only Tset and is approximately 200 ºC lower than the actual sample temperature).
73
High Temperature Phase Transformations in Oxide Ceramics PI: Waltraud M. Kriven
6. Summary
This project has laid the necessary foundation for a comprehensive, yet fundamental research effort devoted towards finding new, high temperature oxide ceramic materials with desirable phase transformation properties. The ceramic oxide material systems that were focused on were those of potential application in the aerospace industry, namely, high temperature, chemically stable, oxide ceramics. Based on an exhaustive literature review, candidate oxide systems were short listed for experimental examination, and included (a) Y2SiO5, (b) CaWO4, (c) CePO4 and (d) YTaO4. While CaWO4 and CePO4 are stable at high temperatures, both Y2SiO5 and YTaO4 have been reported to undergo phase transformation upon heating. In this study, the stable HT-Y2SiO5 phase was synthesized and studied to show that it was stable and does not undergo any phase transformation. Detailed crystallographic analysis of the thermal expansion and phase transformation properties (in the case of YTaO4 only) of each of the above systems was undertaken. Although most of the analysis was completed and has been presented in this report, some analysis is still underway and will be presented in archival publications.
Besides developing a thorough understanding of the crystallographic variations in the above material systems when subjected to high temperatures in air, which included thermal expansion as well as phase transformations, other important accomplishments were also realized through this research project. First, unique instrumentation was developed and calibrated to conduct high temperature X-ray diffraction, in air, at very high resolutions in real time. This included state-of-the-art experimental techniques, especially unique, in situ techniques such as: in situ synchrotron studies up to 2000 °C in air using a quadrupole lamp furnace and a curved image plate detector capable of collecting an entire X-ray diffractometry plot within 5 seconds, with an accuracy of ± 5 °C up to 1830 °C, and ± 10 °C thereafter up to 2000 °C, and with a resolution of ± 0.0001 Å in the crystallographic, axial lattice parameters. Secondly, a framework was developed to guide future efforts aimed at examining high temperature phase transformation and thermal expansion properties of oxide ceramics. Thirdly, based on the exhaustive literature search conducted during this project, key limitations were identified which can compromise the progress in science of high temperature materials. A solution to these limitations was proposed and lies in the development of a novel, relational database where various high temperature properties of oxide ceramics, such as thermal expansion coefficients, temperature ranges for phase stability (known), crystallographic parameters, etc, will be stored. The database promises to assimilate years of research on high temperature behavior of ceramic oxide materials in a coherent format, and will be instrumental in guiding selection and development of oxide ceramics for further specific phase transformation properties and high temperature behavior.
74

High Temperature Phase Transformations in Oxide Ceramics PI: Waltraud M. Kriven
7. References 1A. H. Heuer, N. Claussen, W. M. Kriven and M. Rühle, "Stability of Tetragonal ZrO2 Particles in Ceramic Matrices," Journal of the American Ceramic Society, 65[12] 642-650 (1982).
2W. M. Kriven, J. W. Palko, S. Sinogeikin, J. D. Bass, A. Sayir, G. Brunauer, H. Boysen, F. Frey and J. Schneider, "High Temperature Single Crystal Properties of Mullite," Journal of the European Ceramic Society, 19[13-14] 2529-2541 (1999).
3G. Brunauer, H. Boysen, F. Frey, T. Hansen and W. M. Kriven, "High Temperature Crystal Structure of a 3:2 Mullite from Neutron Diffraction Data," Zeitschrift fur Kristallographie, 216 284 (2001).
4W. M. Kriven, Shear Transformations in Inorganic Materials, Vol., Metallurgical Society of AIME, Warrendale, PA, USA, (1982).
5W. M. Kriven, "Displacive Transformation Mechanisms in Zirconia Ceramics and Other Non-metals"; pp. 223-36 in Tailoring Multiphase and Composite Ceramics. Proceedings of the Twenty-First University Conference on Ceramic Science. Plenum, 1986.
6W. M. Kriven, "Possible Alternative Transformation Tougheners to Zirconia: Crystallographic Aspects," Journal of American Ceramic Society, 71[12] 1021-1030 (1988).
7W. M. Kriven, "Martensitic Toughening of Ceramics"; pp. 249-55 in Materials Science Engineering A, Structural Materials Properties Microstructure Processing (Switzerland), Vol. A127. 1990.
8W. M. Kriven, "Displacive Transformations and Their Applications in Structural Ceramics"; pp. 101-10 in J. Phys. IV, Colloq. (France), Vol. 5. Editions de Physique, 1995.
9C. J. Chan, W. M. Kriven and J. F. Young, "Analytical Electron-Microscopic Studies of Doped Dicalcium Silicates," Journal of the American Ceramic Society, 71[9] 713-719 (1988).
10C. J. Chan, W. M. Kriven and J. F. Young, "Physical Stabilization of the Beta - Gamma Transformation in Dicalcium Silicate," Journal of the American Ceramic Society, 75[6] 1621-1627 (1992).
11Y. J. Kim, I. Nettleship and W. M. Kriven, "Phase Transformations in Dicalcium Silicate: II TEM Studies of Crystallography, Microstructure, and Mechanisms," Journal of the American Ceramic Society, 75[9] 2407-2419 (1992).
12W. M. Kriven, C.-J. Chan and E. A. Barinek, "Particle-size Effect of Dicalcium Silicate [C2S] in a Calcium Zirconate [CZ] Matrix," Advanced Ceramics, 24[A] 145-55 (1988).
75
High Temperature Phase Transformations in Oxide Ceramics PI: Waltraud M. Kriven
13I. Nettleship, K. G. Slavick, Y. J. Kim and W. M. Kriven, "Phase Transformations in Dicalcium Silicate: I, Fabrication and Phase Stability of Fine-Grained Beta Phase," Journal of American Ceramic Society, 75[9] 2400-2406 (1992).
14I. Nettleship, K. G. Slavick, Y. J. Kim and W. M. Kriven, "Phase Transformations in Dicalcium Silicate: III effects of barium on the stability of fine-grained Alpha and Beta Phases," Journal of the American Ceramic Society, 76[10] 2628-2634 (1993).
15A. G. Evans, N. Burlingame, M. Drory and W. M. Kriven, "Martensitic Transformations in Zirconia - Particle Size Effects and Toughening," Acta Metallurgica, 29[2] 447-456 (1981).
16Y. Fu, A. G. Evans and W. M. Kriven, "Microcrack Nucleation in Ceramics Subject to a Phase-Transformation," Journal of the American Ceramic Society, 67[9] 626-630 (1984).
17W. M. Kriven, Martensite Theory and Twinning in Composite Zirconia Ceramics. Science and Technology of Zirconia (Proceedings of the 1st International Conference). Vol. 3, American Ceramic Society, Columbus, OH, USA, 1981.
18W. M. Kriven, Transformation Mechanism of Spherical Zirconia Particles in Alumina, Vol. 12, American Ceramic Society, Columbus, OH, USA, (1984).
19W. M. Kriven and E. Bischoff, Anomalous Thermal Expansion in Al2O3-15 vol% (Zr0.5Hf0.5)O2, Vol. 12, American Ceramic Soc Inc, Columbus, OH, USA, (1984).
20M. Rühle and W. M. Kriven, Analysis of Strain Around Tetragonal and Monoclinic Zirconia Inclusions, Vol., Metallurgical Soc of AIME, Warrendale, Pa, USA, (1982).
21M. Rühle and W. M. Kriven, "Stress-induced Transformations in Composite Zirconia Ceramics," Berichte der Bunsengesellschaft/Physical Chemistry Chemical Physics, 87[3] 222-228 (1983).
22P. D. Jero and W. M. Kriven, "High Temperature Transformation Toughening of Magnesia by Terbia," Science and Technology of Zirconia V. Proc. Int. Conf. Melbourne; 16-21 Aug. 1992; Sponsored by Australasian Ceramic Society, (1992).
23Y. J. Kim and W. M. Kriven, "TEM Characterization of Modulated Microstructures in CaO-Dy2O3 Solid Solutions," Proceedings of the Third Conference on Frontiers of Electron Microscopy in Materials Science, 37[1-4] 351-361 (1991).
24Y. J. Kim and W. M. Kriven, "Crystallography and Microstructural Studies of Phase Transformations in the Dy2O3 system," Journal of Materials Research, 13[10] 2920-2931 (1998).
25O. Sudre, K. R. Venkatachari and W. M. Kriven, "Kinetics and Crystallography of The Monoclinic (B) to Cubic (C) Transformation in Dysprosia (Dy2O3)," Sci.Technol.Zirconia V.[Int.Conf.], 5th, 180-189 (1993).
76

High Temperature Phase Transformations in Oxide Ceramics PI: Waltraud M. Kriven
26P. D. Jero and W. M. Kriven, "Formation and Properties of 2Tb2O3.Al2O3," Journal of the American Ceramic Society, 71[11] 454-455 (1988).
27J. L. Shull, W. M. Kriven, W. D. Porter and C. R. Hubbard, "High Temperature Phase Transformation in Y4Al2O9, Gd4Al2O9 and Dy4Al2O9"; pp. 95-100 in Proceedings of an International Conference on Solid-Solid Phase Transformations. Edited by W. C. Johnson, J. M. Howe, D. E. Laughlin and W. A. Soffa, TMS - Minerals Metals & Materials Society, 1994.
28J. Schneider and W. M. Kriven, "Thermal Expansion and Phase Transitions up to 850 ºC of a Celsian-Hexacelsian BaAl2Si2O8 Mixture"; pp. 257-261 in High Temperature Ceramic Matrix Composites, 4th International Conference on High Temperature Ceramic Matrix Composites. Edited by W. Krenkel, R. Naslain and H. Schneider, Wiley-VCH Verlag Gm, 2001.
29Z. Xu, J. L. Shull Jr and W. M. Kriven, "Hot-stage Transmission Electron Microscopy Study of Phase Transformations in Hexacelsian (BaAl2Si2O8)," Journal of Materials Research, 17[6] 1287-1297 (2002).
30J. J. Cooper, O. O. Popoola and W. M. Kriven, "Characterization of Nickel Sulphide Stones in Glass"; pp. 186-191 in Adding the Value, Austceram 92. International Ceramics Conference and Exhibition. CSIRO, Melbourne, Australia, 1992.
31O. O. Popoola, J. J. Cooper and W. M. Kriven, "Microstructural Investigation of Fracture-Initiating Nickel Sulphide Inclusions in Glass"; pp. 284-294 Vol. 14, Ceramic Engineering and Science Proceedings. American Ceramic Society, 1993.
32D. Zhu and W. M. Kriven, "Shear Induced Transformation in Enstatite," Annual Conference on Composites, Advanced Ceramics, Materials, and Structures - A, 20th, Cocoa Beach, FL, Proceedings; USA; 7-11 Jan. 1996, 17[3] 383-390 (1996).
33K. Jurkschat, P. Sarin, L. F. Siah and W. M. Kriven, "In situ High Temperature Phase Transformations in Rare Earth Niobates," Advances in X-Ray Analysis, 47 357-362 (2004).
34W. M. Kriven, P. Sarin and L. F. Siah, Phase Transformations in Rare Earth Niobates. Solid-Solid Phase Transformations in Inorganic Materials 2005, TMS Society, Warrendale, PA, 2005.
35O. O. Popoola and W. M. Kriven, "In-situ Transmission Electron Microscopy Study of Phase Transformations in KNbO3 Perovskite," Philosophical Magazine Letters, 75[1] 1-5 (1997).
36W. M. Kriven, K. Jurkschat and L. F. Siah, High Temperature Phase Transformations in Dysprosium Titanate. Solid-Solid Phase Transformations in Inorganic Materials 2005, TMS Society, 2005.
37P. Sarin, R. P. Haggerty, W. Yoon, M. Knapp, A. Berghaeuser, P. Zschack, E. Karapetrova, N. Yang and W. M. Kriven, "A Curved Image Plate Detector System for High Resolution Synchrotron X-ray Diffraction," Journal of Synchrotron Radiation, 16 273-282 (2009).
77

High Temperature Phase Transformations in Oxide Ceramics PI: Waltraud M. Kriven
38"Science and Technology of Zirconia V. The Proceedings", The Fifth International Conference on the Science and Technology of Zirconia (ZIRCONIA V) in conjunction with AUSTCERAM 92. Edited by S. P. S. Badwal, M. J. Bannister and R. H. J. Hannink, CRC Press, 1993.
39G. K. Bansal and A. H. Heuer, "Martensitic Phase-Transformation in Zirconia (ZrO2).1. Metallographic Evidence," Acta Metallurgica, 20[11] 1281-& (1972).
40G. K. Bansal and A. H. Heuer, "Martensitic Phase-Transformation in Zirconia (ZrO2). 2. Crystallographic Aspects," Acta Metallurgica, 22[4] 409-417 (1974).
41N. Claussen, M. Ruehle and A. H. Heuer, Science and Technology of Zirconia II. Advances in Ceramics, Vol. 12, American Ceramic Society, Columbus, OH, 1984.
42R. C. Garvie, R. H. J. Hannink and R. T. Pascoe, "Ceramic Steel?," Nature, 258[5537] 703-4 (1975).
43D. J. Green, R. H. J. Hannink and M. V. Swain, Transformation Toughening of Ceramics, CRC Press, 1989.
44A. H. Heuer and L. W. Hobbs, Science and Technology of Zirconia I. Advances in Ceramics, Vol. 3, American Ceramic Society, Columbus, OH, 1981.
45S. Somiya, N. Yamamoto and H. Yanagida, Science and Technology of Zirconia III. Advances in Ceramics, Vol. 24, American Ceramic Society, Columbus, OH, 1988.
46W. M. Kriven, W. L. Fraser and S. W. Kennedy, Martensite Crystallography of Tetragonal Zirconia, Vol. 3, America Ceramic Society, Columbus, OH, USA, (1981).
47W. M. Kriven, B. R. Rosczyk, K. Kremeyer, B. Song and W. Chen, "Transformation Toughening of a Calcium Zirconate Matrix by Dicalcium Silicate, Under Ballistic Impact"; pp. 383-388 in Ceramic Engineering and Science Proceedings, Vol. 24, 27th International Conference on Advanced Ceramics and Composites. Edited by W. M. Kriven and H. T. Lin, 2003.
48D. K. Kim, J. L. Bell, W. M. Kriven and V. Kelsey, "Concepts for Energy Absorption and Dissipation in Ceramic Armor"; pp. 57-70 in Ceramic Engineering and Science Proceedings - Advances in Ceramic Armor III, Vol. 28 [5], 31st International Conference on Advanced Ceramics and Composites. Edited by L. P. Franks, 2007.
49W. M. Kriven and S.-J. Lee, "Mullite/Cordierite Laminates with β to α Cristobalite Transformation Weakened Interphases," Proceedings of the 1998 22nd Annual Conference on Composites, Advanced Ceramics, Materials, and Structures: A. Part 1 (of 2), 19[3] 305-316 (1998).
50W. M. Kriven and S. J. Lee, "Toughening of Mullite/Cordierite Laminated Composites by Transformation Weakening of β-Cristobalite Interphases," Journal of the American Ceramic Society, 88[6] 1521-1528 (2005).
78

High Temperature Phase Transformations in Oxide Ceramics PI: Waltraud M. Kriven
51W. E. Lee and A. H. Heuer, "On the Polymorphism of Enstatite," Journal of the American Ceramic Society, 70[5] 349-360 (1987).
52W. M. Kriven and S. J. Lee, "Toughening of Ceramic Composites by Transformation Weakening of Interphases," United States Patent 6361888 (2002).
53K. Aizu, "Possible Species of Ferromagnetic, Ferroelectric, and Ferroelastic Crystals," Physical Review B, 2[3] 754-& (1970).
54K. Aizu, "Determination of State Parameters and Formulation of Spontaneous Strain for Ferroelastics," Journal of the Physical Society of Japan, 28[3] 706 (1970).
55K. Aizu, "Phenomenological Lattice-Dynamical Theory of Ferroelasticity," Journal of Physics and Chemistry of Solids, 32[8] 1959-& (1971).
56K. Aizu, "Concepts Prototype and Prototypic Phase - Their Difference and Others," Journal of the Physical Society of Japan, 44[2] 683-683 (1978).
57A. Buluo, M. Rousseay and J. Nouet, "Ferroelastic Phase Transformations and Related Phenomena," Key Engineering Materials, 68 133-186 (1992).
58C. J. Chan, F. F. Lange, M. Ruhle, J. F. Jue and A. V. Virkar, "Ferroelastic Domain Switching in Tetragonal Zirconia Single-Crystals Microstructural Aspects," Journal of the American Ceramic Society, 74[4] 807-813 (1991).
59W. M. Kriven, "Twinning in Structural Ceramics"; pp. 435-448, Twinning in Advanced Materials; ; 18-20 Oct. 1993. Edited by M. H. Yoo and M. Wutting, The Minerals Metals and Materials Society, Warrendale, PA, USA, 1993.
60P. Müllner and W. M. Kriven, "On the Role of Deformation Twinning in Domain Reorganization and Grain Reorientation in Ferroelastic Crystals," Journal of Materials Research, 12[7] 1771-1776 (1997).
61G. G. Pisarenko, V. M. Chushko and S. P. Kovalev, "Anisotropy of Fracture-Toughness of Piezoelectric Ceramics," Journal of the American Ceramic Society, 68[5] 259-265 (1985).
62A. Putnis, Introduction to Mineral Sciences, Cambridge University Press, New York, 1992.
63E. K. H. Salje, Phase Transitions in Ferroelastic and Co-elastic Crystals : An Introduction for Mineralogists, Material Scientists, and Physicists. Cambridge topics in mineral physics and chemistry 1, Cambridge University Press, New York, 1990.
64S. Shiozaki, A. Sawada, Y. Ishibashi and Y. Takagi, "Hexagonal-Orthorhombic Phase-Transition and Ferroelasticity in K2SO4 and K2SeO4," Journal of the Physical Society of Japan, 43[4] 1314-1319 (1977).
79

High Temperature Phase Transformations in Oxide Ceramics PI: Waltraud M. Kriven
65G. V. Srinivasan, J. F. Jue, S. Y. Kuo and A. V. Virkar, "Ferroelastic Domain Switching in Polydomain Tetragonal Zirconia Single-Crystals," Journal of the American Ceramic Society, 72[11] 2098-2103 (1989).
66A. V. Virkar, F. J. Jan, P. Smith, K. Mehta and K. Prettyman, "The Role of Ferroelasticity in Toughening of Brittle Materials," Phase Transitions, 35[1] 27-46 (1991).
67A. V. Virkar and R. L. K. Matsumoto, "Ferroelastic Domain Switching as a Toughening Mechanism in Tetragonal Zirconia," Journal of the American Ceramic Society, 69[10] C224-C226 (1986).
68V. K. Wadhawan, "Ferroelasticity and Related Properties of Crystals," Phase Transitions, 3[1] (1982).
69Z. Nishiyama, Martensitic Transformation. Materials Science and Technology Series, Academic Press, New York, 1977.
70K. Otsuka and C. M. Wayman, Shape Memory Materials, New York: Cambridge University Press, Cambridge, 1998.
71E. F. Dudnik and G. A. Kiosse, "The Structural Peculiarities of Some Pure Ferroelastics," Ferroelectrics, 48[1-3] 33-48 (1983).
72H. M. Rietveld, "A Profile Refinement Method for Nuclear and Magnetic Structures," Journal of Applied Crystallography, 2 65-71 (1969).
73G. S. Pawley, "Unit-Cell Refinement from Powder Diffraction Scans," Journal of Applied Crystallography, 14[DEC] 357-361 (1981).
74P. Sarin, W. Yoon, K. Jurkschat, P. Zschack and W. M. Kriven, "Quadrupole Lamp Furnace for High Temperature (up to 2050 K) Synchrotron Powder X-Ray Diffraction Studies in Air in Reflection Geometry," Review of Scientific Instruments, 77[9] (2006).
75L. F. Siah, W. M. Kriven and J. Schneider, "In situ, High-Temperature, Synchrotron, Powder Diffraction Studies of Oxide Systems in Air, Using a Thermal-Image Furnace," Meas. Sci. Technol., 16 1-8 (2005).
76P. Aldebert, "Neutron and X-ray Experiments at High Temperature," Revue Phys. Appl., 19[September] 649-662 (1984).
77L. F. Siah, J. Schneider and W. M. Kriven, "In-Situ, In Air, High Temperature Studies of Oxide Systems Using the Thermal-Imaging Technique," Advances in X-Ray Analysis, 46 264 (2003).
78A. N. Fitch, "The High Resolution Powder Diffraction Beam Line at ESRF," Journal of Research National Institute of Standards and Technology, 109[1] 133-142 (2004).
80

High Temperature Phase Transformations in Oxide Ceramics PI: Waltraud M. Kriven
79F. Rizzo, S. Doyle and T. Wroblewski, "A Study of the Formation of Intermetallic Phases in the Fe-Zn System Using an Image Plate Detection System," Nuclear Instruments & Methods in Physics Research Section B-Beam Interactions with Materials and Atoms, 97[1-4] 479-482 (1995).
80A. Gualtieri, P. Norby, J. Hanson and J. Hriljac, "Rietveld Refinement Using Synchrotron X-ray Powder Diffraction Data Collected in Transmission Geometry Using an Imaging-Plate Detector: Application to Standard m-ZrO2," Journal of Applied Crystallography, 29 707-713 (1996).
81M. Thoms, H. Burzlaff, A. Kinne, J. Lange, H. vonSeggern, R. Spengler and A. Winnacker, An Improved X-ray Image Plate Detector for Diffractometry. European Powder Diffraction: EPDIC IV, Parts 1 and 2, Vol. 228, Transtec Publications Ltd, Zurich-Uetikon, 1996.
82A. Fujiwara, K. Ishii, T. Watanuki, H. Suematsu, H. Nakao, K. Ohwada, Y. Fujii, Y. Murakami, T. Mori, H. Kawada, T. Kikegawa, O. Shimomura, T. Matsubara, H. Hanabusa, S. Daicho, S. Kitamura and C. Katayama, "Synchrotron Radiation X-ray Powder Diffractometer with a Cylindrical Imaging Plate," Journal of Applied Crystallography, 33 1241-1245 (2000).
83R. F. Garrett, D. J. Cookson, G. J. Foran, T. M. Sabine, B. J. Kennedy and S. W. Wilkins, "Powder Diffraction Using Imaging Plates at the Australian National Beamline Facility at the Photon Factory," Review of Scientific Instruments, 66[2] 1351-1353 (1995).
84G. Kellermann, R. Neuenschwander, J. Feugeas and A. F. Craievich, "Chamber for In Situ WAXS, SAXS and GISAXS Studies: Application to Plasma Induced Transformations in Steels," Nuclear Instruments & Methods in Physics Research Section A-Accelerators Spectrometers Detectors and Associated Equipment, 467 1097-1100 (2001).
85E. Nishibori, M. Takata, K. Kato, M. Sakata, Y. Kubota, S. Aoyagi, Y. Kuroiwa, M. Yamakata and N. Ikeda, "The Large Debye-Scherrer Camera Installed at SPring-8 BL02B2 for Charge Density Studies," Journal of Physics and Chemistry of Solids, 62[12] 2095-2098 (2001).
86E. Nishibori, M. Takata, K. Kato, M. Sakata, Y. Kubota, S. Aoyagi, Y. Kuroiwa, M. Yamakata and N. Ikeda, "The Large Debye-Scherrer Camera Installed at SPring-8 BL02B2 for Charge Density Studies," Nuclear Instruments & Methods in Physics Research Section a-Accelerators Spectrometers Detectors and Associated Equipment, 467 1045-1048 (2001).
87P. Sarin, R. P. Haggerty, W. Yoon, W. M. Kriven, M. Knapp and P. Zschack, "Rapid, In-Situ, Ultra-High Temperature Investigations of Ceramics Using Synchrotron X-Ray Diffraction"; pp. 313-324 in Ceramic Engineering and Science Proceedings - Mechanical Properties and Performance of Engineering Ceramics and Composites II, Vol. 27 [2], 30th International Conference on Advanced Ceramics and Composites. Edited by A. Wereszczak, E. Lara-Curzio and M. Mizuno, 2006.
88J. Hubert, A. Revcolevschi and R. Collongues, "Application du Chauffage par Concentration de Rayonnement (Four a Image) a la Diffraction des Rayons X a Tres Haute Temperature (3200ºC)," Canadian Metallurgical Quarterly, 13 361 (1974).
81
High Temperature Phase Transformations in Oxide Ceramics PI: Waltraud M. Kriven
89S. Stecura, "Evaluation of Imaging Furnace as Heat Source for X-Ray Diffractometry," Review of Scientific Instruments, 39[5] 760-765 (1968).
90A. Watanabe and M. Shimazu, "High-Temperature X-Ray Diffraction Furnace Using a Thermal-Image Technique," Journal of Applied Crystallography, 9[pt.6] 466-9 (1976).
91D. P. Siddons, S. L. Hulbert and P. W. Stephens, "A Guinier Camera for SR Powder Diffraction: High Resolution and High Throughput," AIP Conference Proceedings, 879[1] 1767-1770 (2007).
92Y. S. Touloukian and C. Y. Ho, Thermal Expansion – Metallic Elements and Alloys. Thermophysical Properties of Matter, Vol. 12, IFI/Plenum Press, New York, 1975.
93Y. S. Touloukian and C. Y. Ho, Thermal Expansion – Nonmetallic Solids. Thermophysical Properties of Matter, Vol. 13, IFI/Plenum Press, New York, 1977.
94J.-C. Tolédano, V. Janovec, V. Kopskỳ, J. F. Scott and P. Boček, Structural Phase Transitions. International Tables for Crystallography - Physical Properties of Crystals, Edited by A. Authier. Vol. D, Kluwer Academic Publishers, London, 2003.
95H. Küppers, Thermal Expansion. International Tables for Crystallography - Physical Properties of Crystals, Edited by A. Authier. Vol. D, Kluwer Academic Publishers, London, 2003.
96J. L. Schlenker, G. V. Gibbs and M. B. Boisen, "Strain-tensor Components Expressed in Terms of Lattice Parameters," Acta Crystallographica Section A, 34[1] 52-54 (1978).
97S. M. Jessen and H. Küppers, "The Precision of Thermal-Expansion Tensors of Triclinic and Monoclinic Crystals," Journal of Applied Crystallography, 24[3] 239-242 (1991).
98K. N. Lee, D. S. Fox and N. P. Bansal, "Rare Earth Silicate Environmental Barrier Coatings for SiC/SiC Composites and Si3N4 Ceramics," Journal of the European Ceramic Society, 25[10] 1705-1715 (2005).
99N. A. Toropov, "Phase Diagram of the Y2O3-SiO2 System," 7th Transactions of the International Ceramics Congress, 438 (1960).
100K. Fukuda and H. Matsubara, "Anisotropic Thermal Expansion in Yttrium Silicate," Journal of Materials Research, 18[7] 1715-1722 (2003).
101M. A. Gülgün, W. M. Kriven and M. H. Nguyen, "Processes for Preparing Mixed Metal Oxide Powders," United States Patent 6482387 (2002).
102M. A. Gülgün and W. M. Kriven, "Simple Solution-Polymerization Route for Oxide Powder Synthesis," Science, Technology, and Commercialization of Powder Synthesis and Shape Forming Processes. Proc.Symp ; Cincinnati; 30 Apr.-3 May 1995; Sponsored by American Ceramic Soc.Inc., 57-66 (1996).
82
High Temperature Phase Transformations in Oxide Ceramics PI: Waltraud M. Kriven
103W. M. Kriven, S. J. Lee, M. A. Gülgün, M. H. Nguyen and D. K. Kim, "Synthesis of Oxide Powders via Polymeric Steric Entrapment," Innovative Processing and Synthesis of Ceramics, Glasses, and Composites III; Indianapolis, Indiana; USA; 25-28 Apr. 1999, 108 99-110 (2000).
104P. Mogilevsky, T. A. Parthasarathy and M. D. Petry, "Anisotropy in Room Temperature Microhardness and Fracture of CaWO4 Scheelite," Acta Materialia, 52[19] 5529-37 (2004).
105H. Li, S. Zhou and S. Zhang, "The Relationship Between the Thermal Expansions and Structures of ABO4 Oxides," Journal of Solid State Chemistry, 180[2] 589-595 (2007).
106B. Yates and A. C. Bailey, "The Low-Temperature Anisotropic Thermal Expansion of Calcium Tungstate," Journal of Low Temperature Physics, 4[1] 117-25 (1971).
107D. Errandonea, F. J. Manjon, M. Somayazulu and D. Hausermann, "Effects of Pressure on the Local Atomic Structure of CaWO4 and YLiF4: Mechanism of the Scheelite-to-Wolframite and Scheelite-to-Fergusonite Transitions," Journal of Solid State Chemistry, 177[4-5] 1087-1097 (2004).
108D. Errandonea, M. Somayazulu and D. Hausermann, "CaWO4: A New High-Pressure and High-Temperature Phase," Physica Status Solidi B, 231[1] 1-3 (2002).
109R. M. Hazen, L. W. Finger and J. W. E. Mariathasan, "High-Pressure Crystal Chemistry of Scheelite-type Tungstates and Molybdates," Journal of the Physics and Chemistry of Solids, 46[2] 253-63 (1985).
110S. N. Achary, S. J. Patwe, M. D. Mathews and A. K. Tyagi, "High Temperature Crystal Chemistry and Thermal Expansion of Synthetic Powellite (CaMoO4): A High Temperature X-ray Diffraction (HT-XRD) Study," Journal of Physics and Chemistry of Solids, 67[4] 774-781 (2006).
111A. Senyshyn, H. Kraus, V. B. Mikhailik and V. Yakovyna, "Lattice Dynamics and Thermal Properties of CaWO4," Physical Review B (Condensed Matter and Materials Physics), 70[21] 214306-1 (2004).
112S. V. Ushakov, K. B. Helean, A. Navrotsky and L. A. Boatner, "Thermochemistry of Rare-Earth Orthophosphates," Journal of Materials Research, 16[9] 2623-2633 (2001).
113Y. Hikichi and T. Nomura, "Melting Temperatures of Monazite and Xenotime," Journal of the American Ceramic Society, 70[10] 252-3 (1987).
114Y. Hikichi, T. Nomura, Y. Tanimura, S. Suzuki and M. Miyamoto, "Sintering and Properties of Monazite-type CePO4," Journal of the American Ceramic Society, 73[12] 3594-6 (1990).
83

High Temperature Phase Transformations in Oxide Ceramics PI: Waltraud M. Kriven
115P. E. D. Morgan, D. B. Marshall and R. M. Housley, "High-Temperature Stability of Monazite-Alumina Composites"; pp. 215-22 in Materials Science Engineering A, Struct. Mater., Prop. Microstruct. Process. (Switzerland), Vol. A195. 1995.
116Leonardo.Oh, "Origin and Provenance of Fossil and Recent Monazite Deposits in Brazil," Economic Geology, 69[7] 1126-1128 (1974).
117K. Wang, J. Zhang, J. Wang, C. Fang, W. Yu, X. Zhao and H. Xu, "Growth Defects and Infrared Spectra Analysis of CePO4 Single Crystals," Journal of Applied Crystallography, 38[4] 675-677 (2005).
118R. G. Herman and J. M. Dominguez, "Radiation and Thermally-Induced Transformations of Crystalline Cerium(IV) Phosphate CeP-E," Materials Research Bulletin, 19[7] 905-914 (1984).
119G. J. McCarthy, W. B. White and D. E. Pfoertsch, "Synthesis of Nuclear Waste Monazites, Ideal Actinide Host for Geological Disposal," 13[11] 1239-1245 (1978).
120B. Li, L. Shen, X. Liu, T. Wang, K. Ishii, Y. Sasaki, Y. Kashiwaya, H. Takahashi and T. Shibayama, "Structure and Morphology Transition of CePO4 Coatings on Alumina Fibers," Journal of Materials Science Letters, 19[4] 343-7 (2000).
121J. B. Davis, D. B. Marshall, R. M. Housley and P. E. D. Morgan, "Machinable Ceramics Containing Rare-Earth Phosphates," Journal of the American Ceramic Society, 81[8] 2169-2175 (1998).
122L. Wang, J. Liu, K. Wang, W. Huo and H. Gao, "Investigation on Ductile Property of CePO4 Ceramic," Journal of Rare Earths, 21[6] 645-647 (2003).
123G. W. Beall, L. A. Boatner, D. F. Mullica and W. O. Milligan, "The Structure of Cerium Orthophosphate, a Synthetic Analogue of Monazite," Journal of Inorganic and Nuclear Chemistry, 43[1] 101-5 (1981).
124Y. Yokogawa and M. Yoshimura, "Formation and Stability Regions of The High-Temperature Fluorite-Related Phase in The R2O3-Ta2O5 System (R = La, Nd, Sm, Ho, Er, and Yb)," Journal of the American Ceramic Society, 80[8] 1965-1974 (1997).
125V. V. Molchanov, M. G. Zuev, L. M. Plyasova and S. V. Bogdanov, "Mechanochemical Synthesis of Yttrium and Lanthanum Tantalates," Inorganic Materials, 40[1] 73-79 (2004).
126J. G. Allpress and H. J. Rossell, "Fluorite-Related Phases Ln3Mo7, Ln= Rare-Earth, Y, or Sc, M = Nb, Sb, or Ta .1. Crystal-Chemistry," Journal of Solid State Chemistry, 27[1] 105-114 (1979).
127G. M. Wolten, "The Structure of The M'-phase of YTaO4, a Third Fergusonite Polymorph," Acta Crystallographica, 23 939-944 (1967).
84

High Temperature Phase Transformations in Oxide Ceramics PI: Waltraud M. Kriven
85
128A. I. Komkov, "The Structure of Natural Fergusonite and of a Polymorphic Modification," Kristallografiya, 4[6] 836-841 (1959).
129M. I. Kay, B. C. Frazer and I. Almodovar, "Neutron Diffraction Refinement of CaWO4," Journal of Chemical Physics, 40[2] 504-505 (1964).
130K. A. Gingerich and H. E. Bair, "Relation Between Ionic Radii and Transformation Temperature in Rare Earth Niobates," Advances in X-Ray Analysis, 7 22-30 (1963).