
In Silico Prediction of Physicochemical Properties of ... et al. Prediction of Physicochemical...
20
Zang et al. Prediction of Physicochemical Properties March 2015 NICEATM SOT 2015 Poster In Silico Prediction of Physicochemical Properties of Environmental Chemicals in Combination of Molecular Fingerprints and Machine Learning Approaches Q Zang 1 , K Mansouri 2 , D Allen 1 , N Kleinstreuer 1 , W Casey 3 , R Judson 2 1 ILS/NICEATM, RTP, NC, USA; 2 EPA/ORD/NCCT, RTP, NC, USA; 3 NIH/NIEHS/DNTP/NICEATM, RTP, NC, USA Abstract Quantitative structure-property relationship (QSPR) models were developed for the prediction of six physicochemical properties of environmental chemicals: octanol–water partition coefficient (log P), water solubility (log S), boiling point (BP), melting point (MP), vapor pressure (VP), and bioconcentration factor (BCF). Models were developed using simple binary molecular fingerprints and four approaches with differing complexity: multiple linear regression, random forest regression, partial least squares regression, and support vector regression (SVR). To obtain reliable and robust regression models with high prediction performance, genetic algorithms (GA) were employed to select the most information-rich subset of fingerprint bits. Predictions from the various models were tested against a validation set, and all four approaches exhibited satisfactory predictive results, with SVR outperforming the others. BP was the best-predicted property, with a correlation coefficient (R 2 ) of 0.95 between the estimated values and experimental data on the validation set while MP was the most poorly predicted property with an R 2 of 0.84. The statistics for other properties were intermediate between MP and BP with R 2 equal to 0.94, 0.93, 0.92 and 0.86 for log S, log P, VP and BCF, respectively. The prediction results for all properties were superior to those from Estimation Program Interface (EPI) Suite (R 2 values ranged from 0.63 to 0.94), a widely used tool for property prediction. This study demonstrates that (1) molecular fingerprints are useful descriptors, (2) GA is an efficient feature selection tool from which selected descriptors can effectively model these properties, and (3) simple methods give comparable results to more complicated methods. Introduction • Current tools for testing the biological activity and toxicity of chemicals are time-consuming and costly. Thus, only a fraction of these chemicals have been fully characterized for their potential hazard and risks to both human health and the environment. • In vitro and in silico approaches are being developed as more efficient tools for chemical hazard characterization and prioritization. One of these approaches is in silico estimation of physicochemical properties. • This study presents novel methods using simple binary molecular fingerprints for the estimation of six physicochemical properties of environmental chemicals: 1
-
Upload
nguyenhanh -
Category
Documents
-
view
225 -
download
4
Transcript of In Silico Prediction of Physicochemical Properties of ... et al. Prediction of Physicochemical...

Zang et al. Prediction of Physicochemical Properties March 2015 NICEATM SOT 2015 Poster
In Silico Prediction of Physicochemical Properties of Environmental Chemicals in Combination of Molecular Fingerprints and Machine Learning Approaches Q Zang1, K Mansouri2, D Allen1, N Kleinstreuer1, W Casey3, R Judson2 1ILS/NICEATM, RTP, NC, USA; 2EPA/ORD/NCCT, RTP, NC, USA;
3NIH/NIEHS/DNTP/NICEATM, RTP, NC, USA
Abstract
Quantitative structure-property relationship (QSPR) models were developed for the prediction of six physicochemical properties of environmental chemicals: octanol–water partition coefficient (log P), water solubility (log S), boiling point (BP), melting point (MP), vapor pressure (VP), and bioconcentration factor (BCF). Models were developed using simple binary molecular fingerprints and four approaches with differing complexity: multiple linear regression, random forest regression, partial least squares regression, and support vector regression (SVR). To obtain reliable and robust regression models with high prediction performance, genetic algorithms (GA) were employed to select the most information-rich subset of fingerprint bits. Predictions from the various models were tested against a validation set, and all four approaches exhibited satisfactory predictive results, with SVR outperforming the others. BP was the best-predicted property, with a correlation coefficient (R2) of 0.95 between the estimated values and experimental data on the validation set while MP was the most poorly predicted property with an R2 of 0.84. The statistics for other properties were intermediate between MP and BP with R2 equal to 0.94, 0.93, 0.92 and 0.86 for log S, log P, VP and BCF, respectively. The prediction results for all properties were superior to those from Estimation Program Interface (EPI) Suite (R2 values ranged from 0.63 to 0.94), a widely used tool for property prediction. This study demonstrates that (1) molecular fingerprints are useful descriptors, (2) GA is an efficient feature selection tool from which selected descriptors can effectively model these properties, and (3) simple methods give comparable results to more complicated methods.
Introduction
• Current tools for testing the biological activity and toxicity of chemicals are time-consuming and costly. Thus, only a fraction of these chemicals have been fully characterized for their potential hazard and risks to both human health and the environment.
• In vitro and in silico approaches are being developed as more efficient tools for chemical hazard characterization and prioritization. One of these approaches is in silico estimation of physicochemical properties.
• This study presents novel methods using simple binary molecular fingerprints for the estimation of six physicochemical properties of environmental chemicals:
1
Zang et al. Prediction of Physicochemical Properties March 2015 NICEATM SOT 2015 Poster
- Octanol–water partition coefficient (log P) - Water solubility (log S) - Boiling point (BP) - Melting point (MP) - Vapor pressure (VP) - Bioconcentration factor (BCF)
The goal of this project is to produce models that can be easily integrated with ToxCast in vitro high-throughput screening assays and that adhere to internationally accepted validation principles defined by the Organization for Economic Co-operation and Development (OECD 2004).
Characteristics of the Chemical Set
• Experimentally measured physicochemical properties of a structurally diverse set of organic environmental chemicals were obtained from EPI Suite (EPA 2012 and EPI Suite Data). These chemicals represent a wide range of use classes, including industrial compounds, pharmaceuticals, pesticides, and food additives.
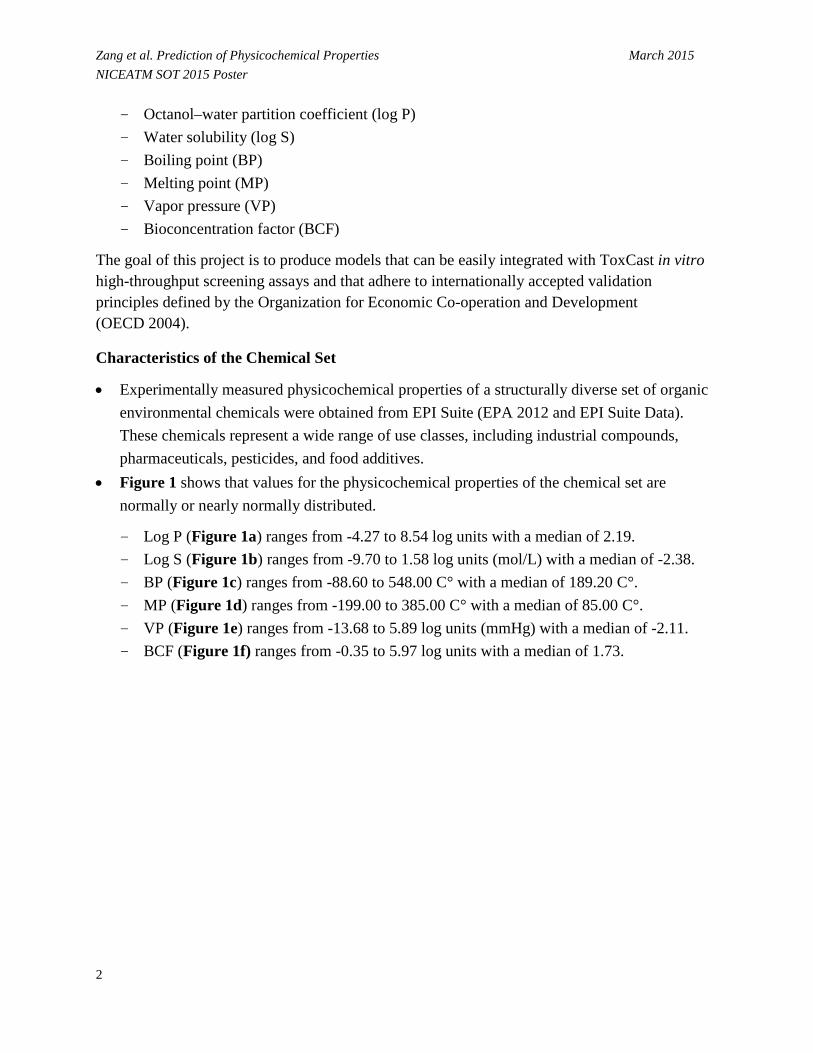
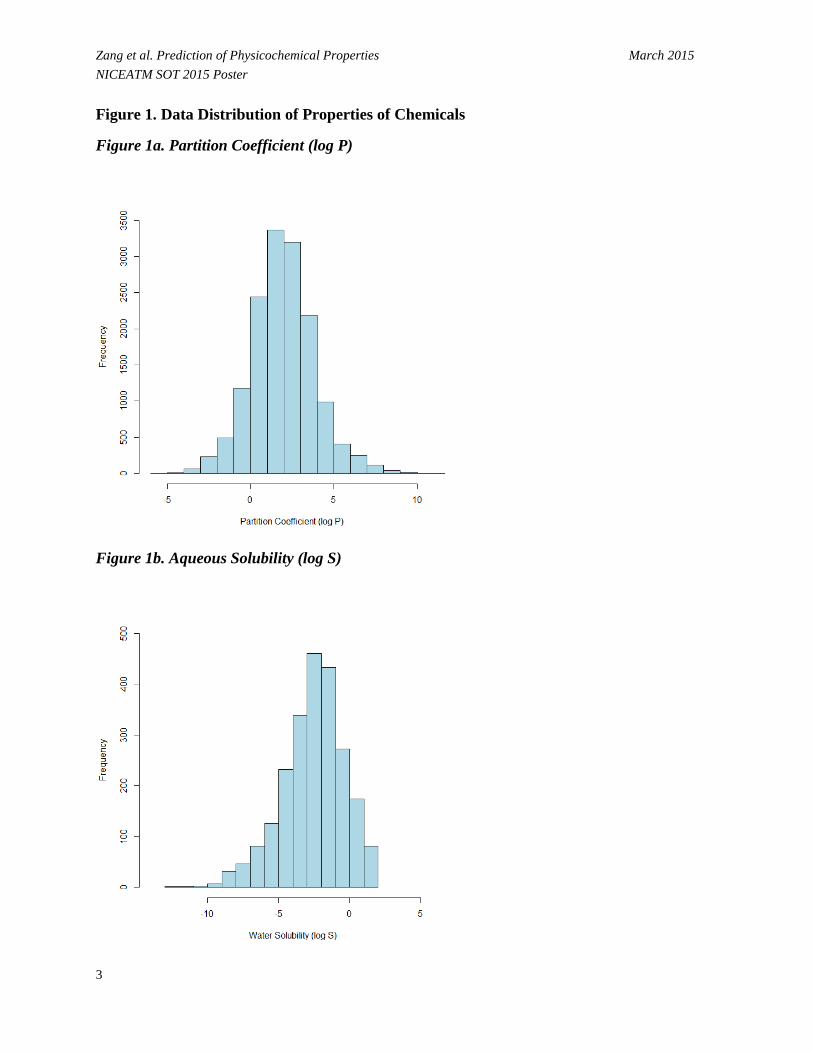
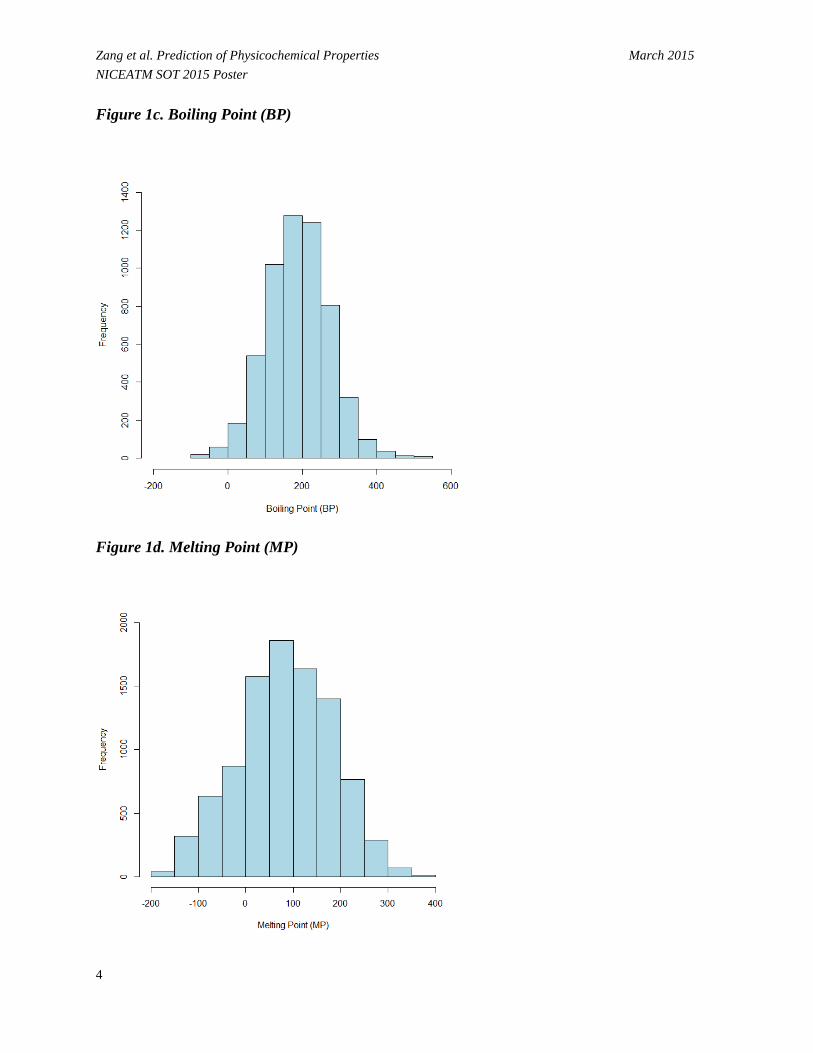
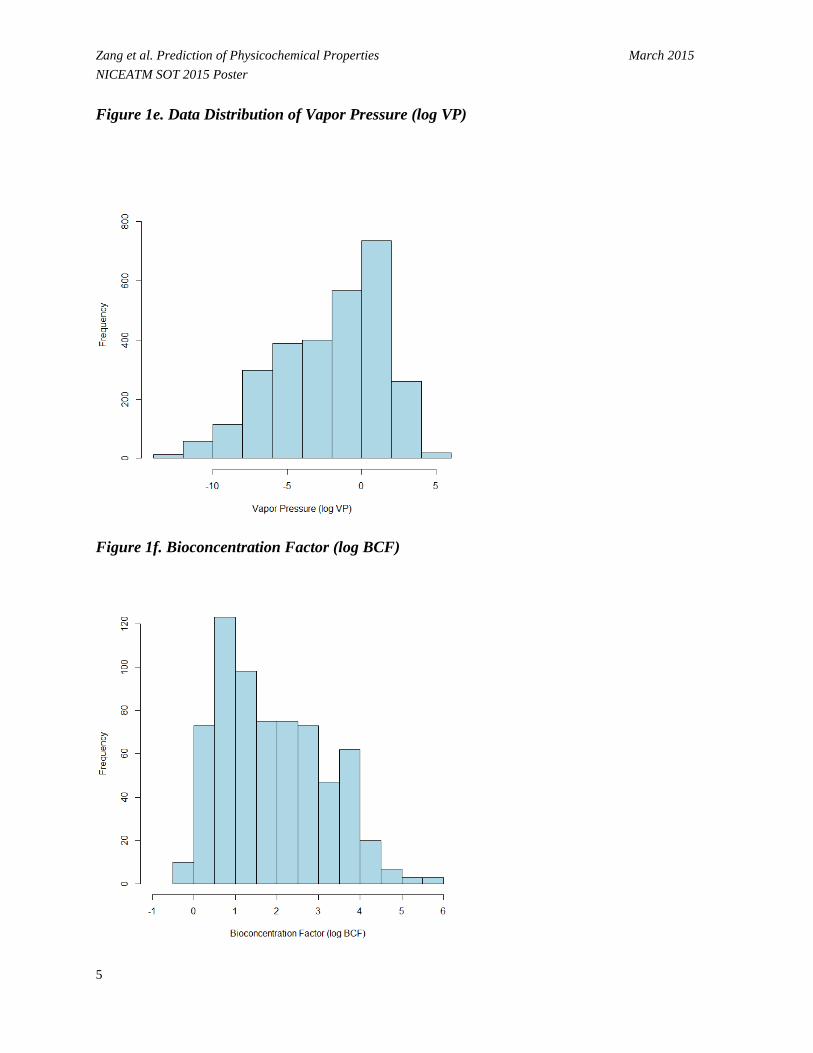
• Figure 1 shows that values for the physicochemical properties of the chemical set are normally or nearly normally distributed.
- Log P (Figure 1a) ranges from -4.27 to 8.54 log units with a median of 2.19. - Log S (Figure 1b) ranges from -9.70 to 1.58 log units (mol/L) with a median of -2.38. - BP (Figure 1c) ranges from -88.60 to 548.00 C° with a median of 189.20 C°. - MP (Figure 1d) ranges from -199.00 to 385.00 C° with a median of 85.00 C°. - VP (Figure 1e) ranges from -13.68 to 5.89 log units (mmHg) with a median of -2.11. - BCF (Figure 1f) ranges from -0.35 to 5.97 log units with a median of 1.73.
2
Zang et al. Prediction of Physicochemical Properties March 2015 NICEATM SOT 2015 Poster Figure 1. Data Distribution of Properties of Chemicals
Figure 1a. Partition Coefficient (log P)
Figure 1b. Aqueous Solubility (log S)
3
Zang et al. Prediction of Physicochemical Properties March 2015 NICEATM SOT 2015 Poster Figure 1c. Boiling Point (BP)
Figure 1d. Melting Point (MP)
4
Zang et al. Prediction of Physicochemical Properties March 2015 NICEATM SOT 2015 Poster Figure 1e. Data Distribution of Vapor Pressure (log VP)
Figure 1f. Bioconcentration Factor (log BCF)
5
Zang et al. Prediction of Physicochemical Properties March 2015 NICEATM SOT 2015 Poster Definition of Training and Test Sets
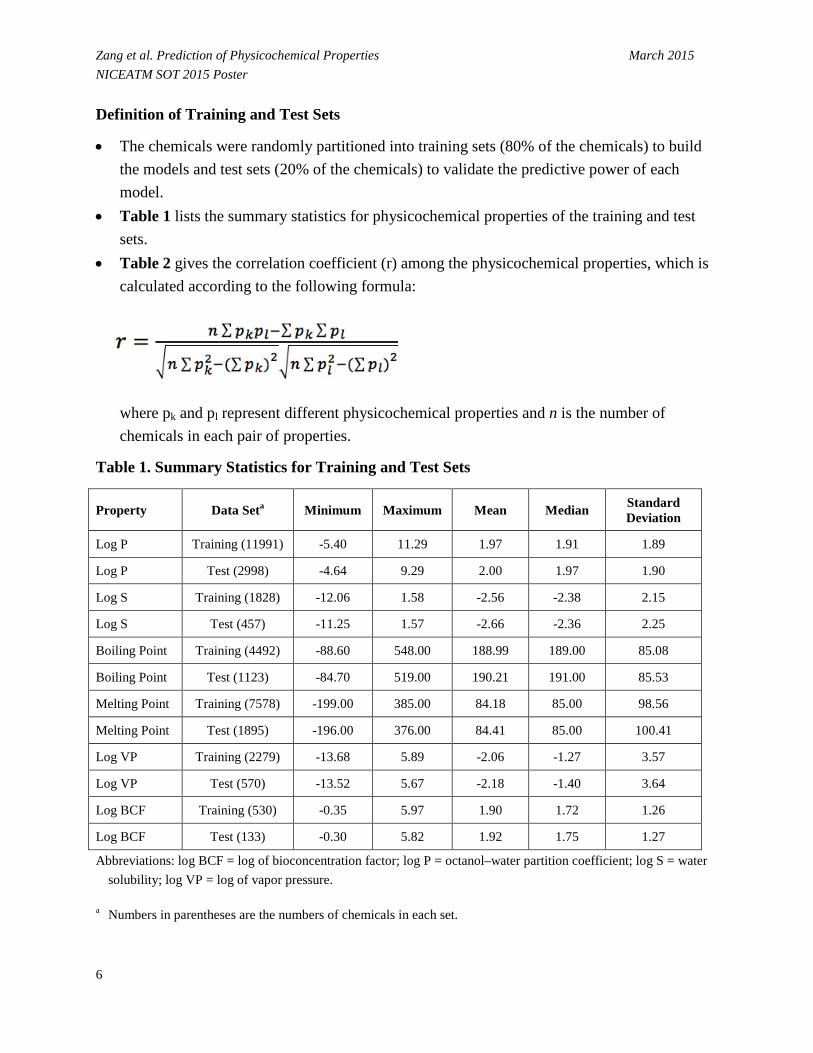
• The chemicals were randomly partitioned into training sets (80% of the chemicals) to build the models and test sets (20% of the chemicals) to validate the predictive power of each model.
• Table 1 lists the summary statistics for physicochemical properties of the training and test sets.
• Table 2 gives the correlation coefficient (r) among the physicochemical properties, which is calculated according to the following formula:
where pk and pl represent different physicochemical properties and n is the number of chemicals in each pair of properties.
Table 1. Summary Statistics for Training and Test Sets
Property Data Seta Minimum Maximum Mean Median Standard Deviation
Log P Training (11991) -5.40 11.29 1.97 1.91 1.89
Log P Test (2998) -4.64 9.29 2.00 1.97 1.90
Log S Training (1828) -12.06 1.58 -2.56 -2.38 2.15
Log S Test (457) -11.25 1.57 -2.66 -2.36 2.25
Boiling Point Training (4492) -88.60 548.00 188.99 189.00 85.08
Boiling Point Test (1123) -84.70 519.00 190.21 191.00 85.53
Melting Point Training (7578) -199.00 385.00 84.18 85.00 98.56
Melting Point Test (1895) -196.00 376.00 84.41 85.00 100.41
Log VP Training (2279) -13.68 5.89 -2.06 -1.27 3.57
Log VP Test (570) -13.52 5.67 -2.18 -1.40 3.64
Log BCF Training (530) -0.35 5.97 1.90 1.72 1.26
Log BCF Test (133) -0.30 5.82 1.92 1.75 1.27
Abbreviations: log BCF = log of bioconcentration factor; log P = octanol–water partition coefficient; log S = water solubility; log VP = log of vapor pressure.
a Numbers in parentheses are the numbers of chemicals in each set.
6
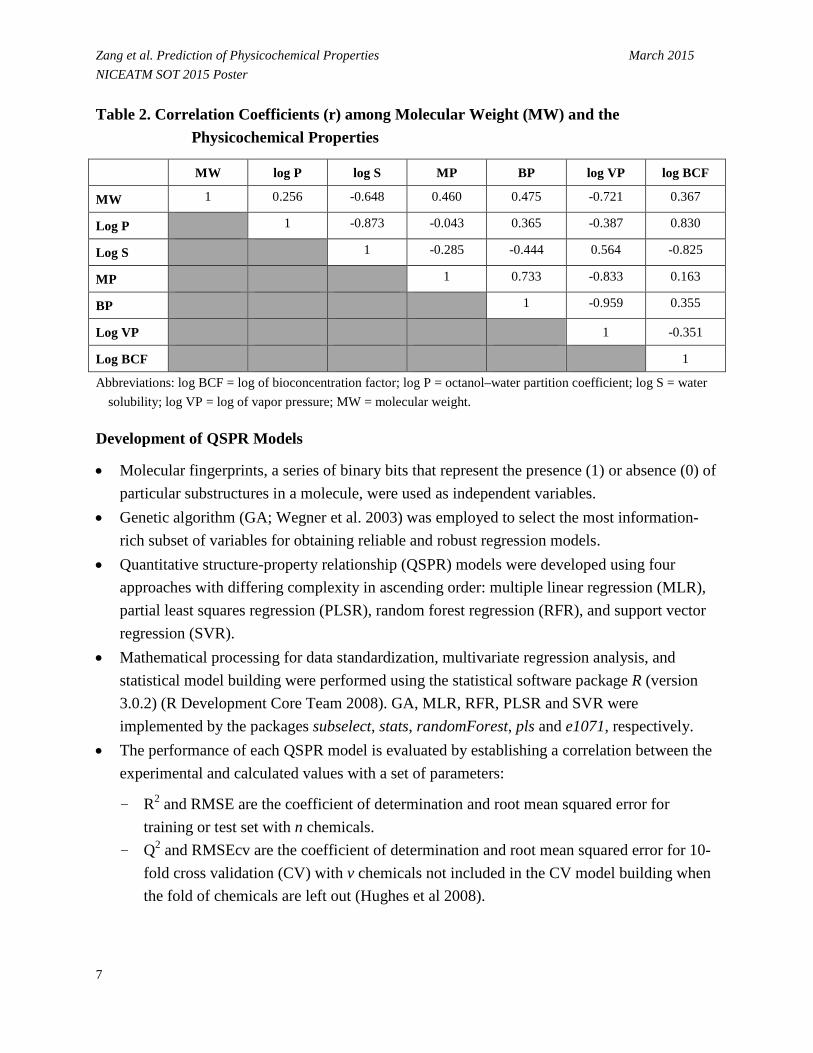
Zang et al. Prediction of Physicochemical Properties March 2015 NICEATM SOT 2015 Poster Table 2. Correlation Coefficients (r) among Molecular Weight (MW) and the
Physicochemical Properties
MW log P log S MP BP log VP log BCF
MW 1 0.256 -0.648 0.460 0.475 -0.721 0.367
Log P 1 -0.873 -0.043 0.365 -0.387 0.830
Log S 1 -0.285 -0.444 0.564 -0.825
MP 1 0.733 -0.833 0.163
BP 1 -0.959 0.355
Log VP 1 -0.351
Log BCF 1
Abbreviations: log BCF = log of bioconcentration factor; log P = octanol–water partition coefficient; log S = water solubility; log VP = log of vapor pressure; MW = molecular weight.
Development of QSPR Models
• Molecular fingerprints, a series of binary bits that represent the presence (1) or absence (0) of particular substructures in a molecule, were used as independent variables.
• Genetic algorithm (GA; Wegner et al. 2003) was employed to select the most information-rich subset of variables for obtaining reliable and robust regression models.
• Quantitative structure-property relationship (QSPR) models were developed using four approaches with differing complexity in ascending order: multiple linear regression (MLR), partial least squares regression (PLSR), random forest regression (RFR), and support vector regression (SVR).
• Mathematical processing for data standardization, multivariate regression analysis, and statistical model building were performed using the statistical software package R (version 3.0.2) (R Development Core Team 2008). GA, MLR, RFR, PLSR and SVR were implemented by the packages subselect, stats, randomForest, pls and e1071, respectively.
• The performance of each QSPR model is evaluated by establishing a correlation between the experimental and calculated values with a set of parameters:
- R2 and RMSE are the coefficient of determination and root mean squared error for training or test set with n chemicals.
- Q2 and RMSEcv are the coefficient of determination and root mean squared error for 10-fold cross validation (CV) with v chemicals not included in the CV model building when the fold of chemicals are left out (Hughes et al 2008).
7
Zang et al. Prediction of Physicochemical Properties March 2015 NICEATM SOT 2015 Poster
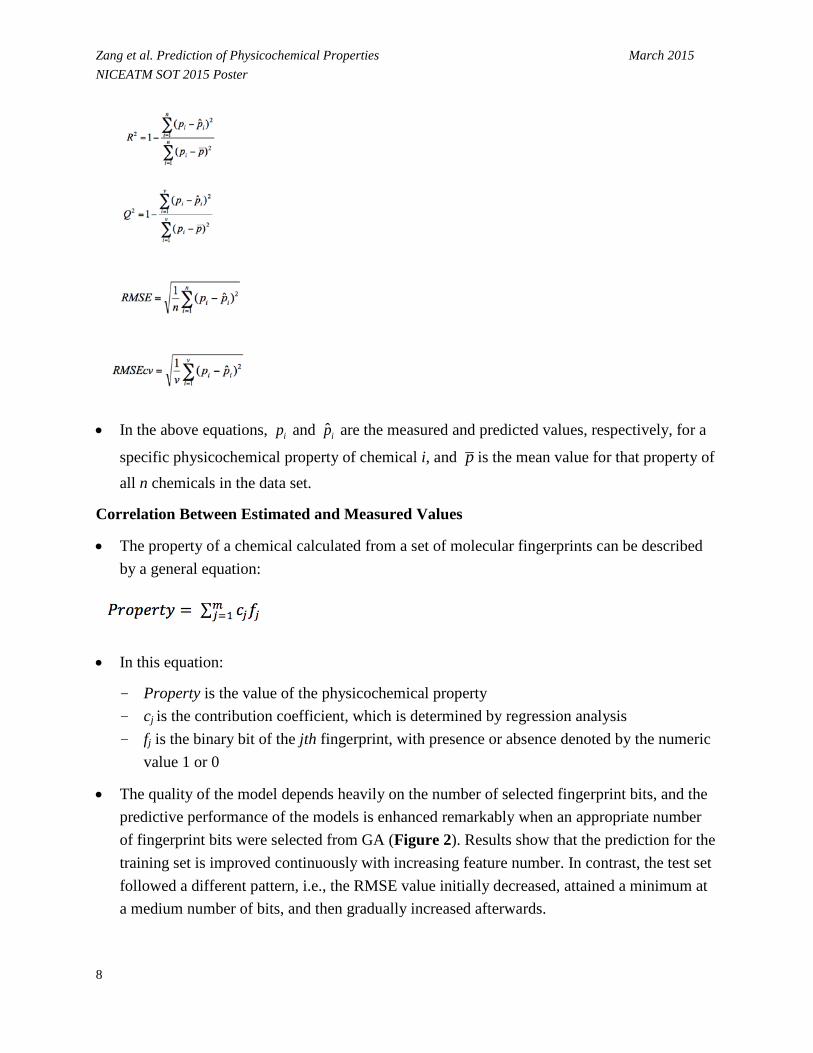
• In the above equations, and are the measured and predicted values, respectively, for a
specific physicochemical property of chemical i, and is the mean value for that property of all n chemicals in the data set.
ip ip̂
p
Correlation Between Estimated and Measured Values
• The property of a chemical calculated from a set of molecular fingerprints can be described by a general equation:
• In this equation:
- Property is the value of the physicochemical property - cj is the contribution coefficient, which is determined by regression analysis - fj is the binary bit of the jth fingerprint, with presence or absence denoted by the numeric
value 1 or 0
• The quality of the model depends heavily on the number of selected fingerprint bits, and the predictive performance of the models is enhanced remarkably when an appropriate number of fingerprint bits were selected from GA (Figure 2). Results show that the prediction for the training set is improved continuously with increasing feature number. In contrast, the test set followed a different pattern, i.e., the RMSE value initially decreased, attained a minimum at a medium number of bits, and then gradually increased afterwards.
8

Zang et al. Prediction of Physicochemical Properties March 2015 NICEATM SOT 2015 Poster
- For log P, the modeling statistics are not sensitive to the bit number, and the model performance does not vary considerably with different subsets of fingerprint bits for the test set (Figure 2a).
- For log S, the lowest prediction errors occurred on the models with moderate complexity around 250 and 300 bits (Figure 2b).
9
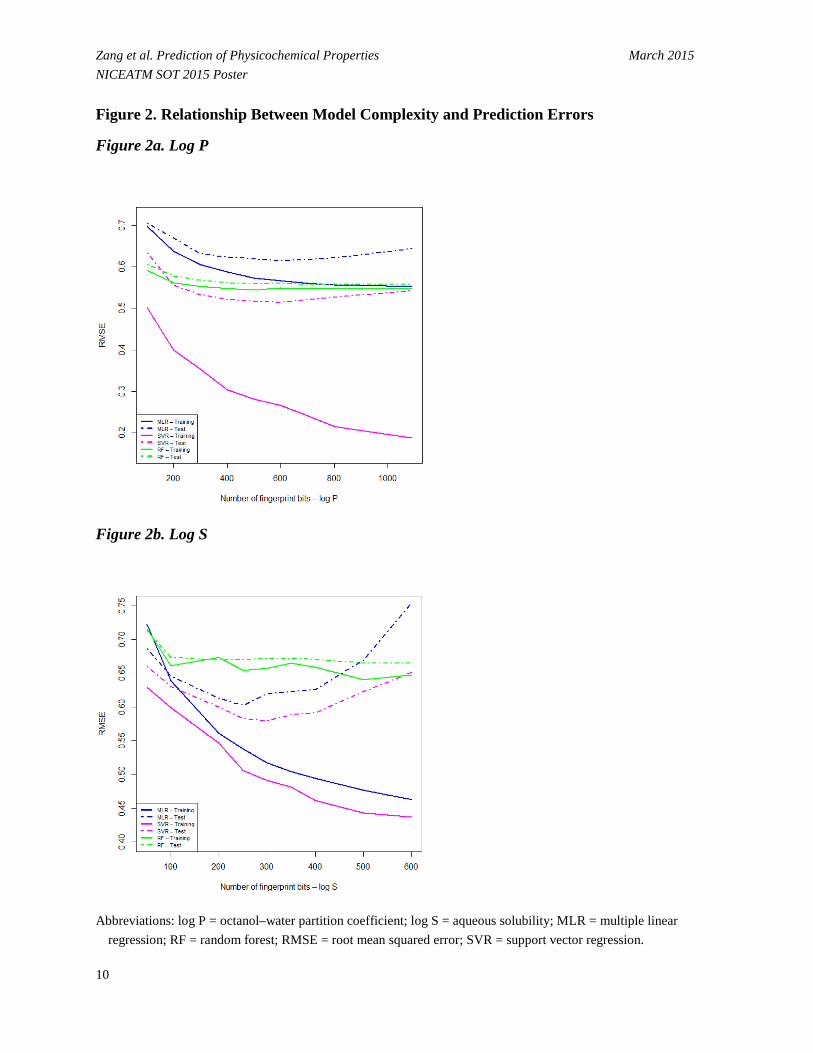
Zang et al. Prediction of Physicochemical Properties March 2015 NICEATM SOT 2015 Poster Figure 2. Relationship Between Model Complexity and Prediction Errors
Figure 2a. Log P
Figure 2b. Log S
Abbreviations: log P = octanol–water partition coefficient; log S = aqueous solubility; MLR = multiple linear
regression; RF = random forest; RMSE = root mean squared error; SVR = support vector regression.
10
Zang et al. Prediction of Physicochemical Properties March 2015 NICEATM SOT 2015 Poster
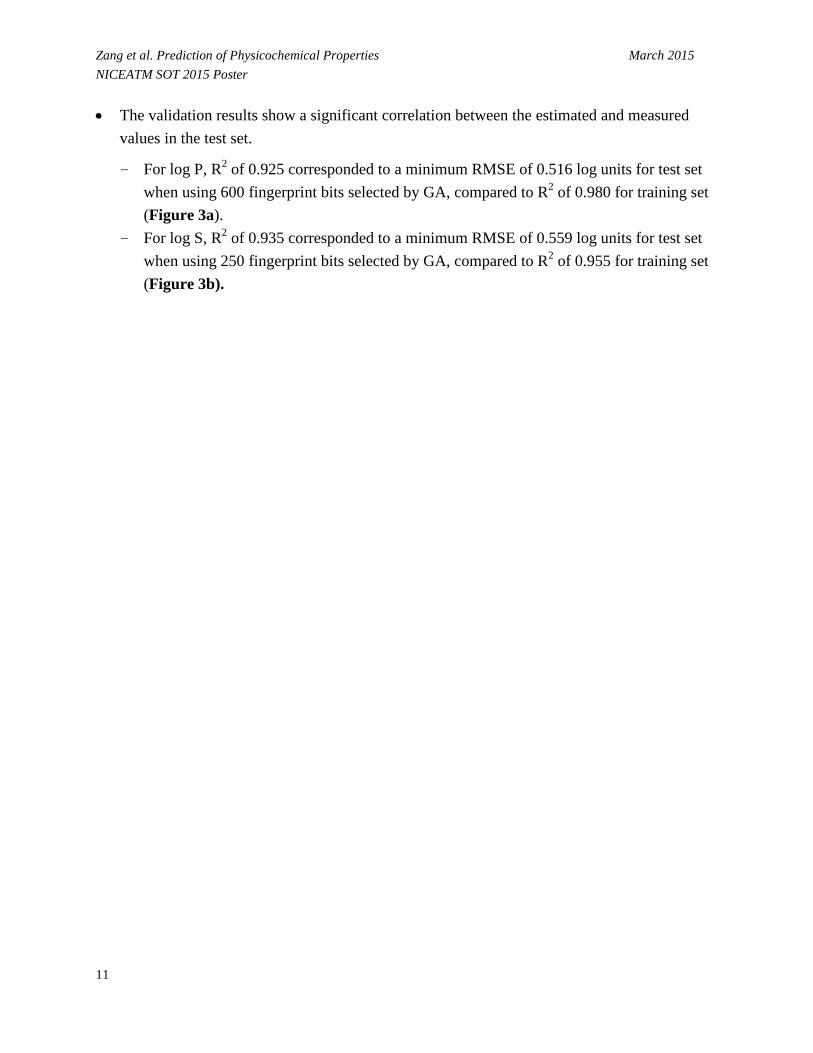
• The validation results show a significant correlation between the estimated and measured values in the test set.
- For log P, R2 of 0.925 corresponded to a minimum RMSE of 0.516 log units for test set when using 600 fingerprint bits selected by GA, compared to R2 of 0.980 for training set (Figure 3a).
- For log S, R2 of 0.935 corresponded to a minimum RMSE of 0.559 log units for test set when using 250 fingerprint bits selected by GA, compared to R2 of 0.955 for training set (Figure 3b).
11
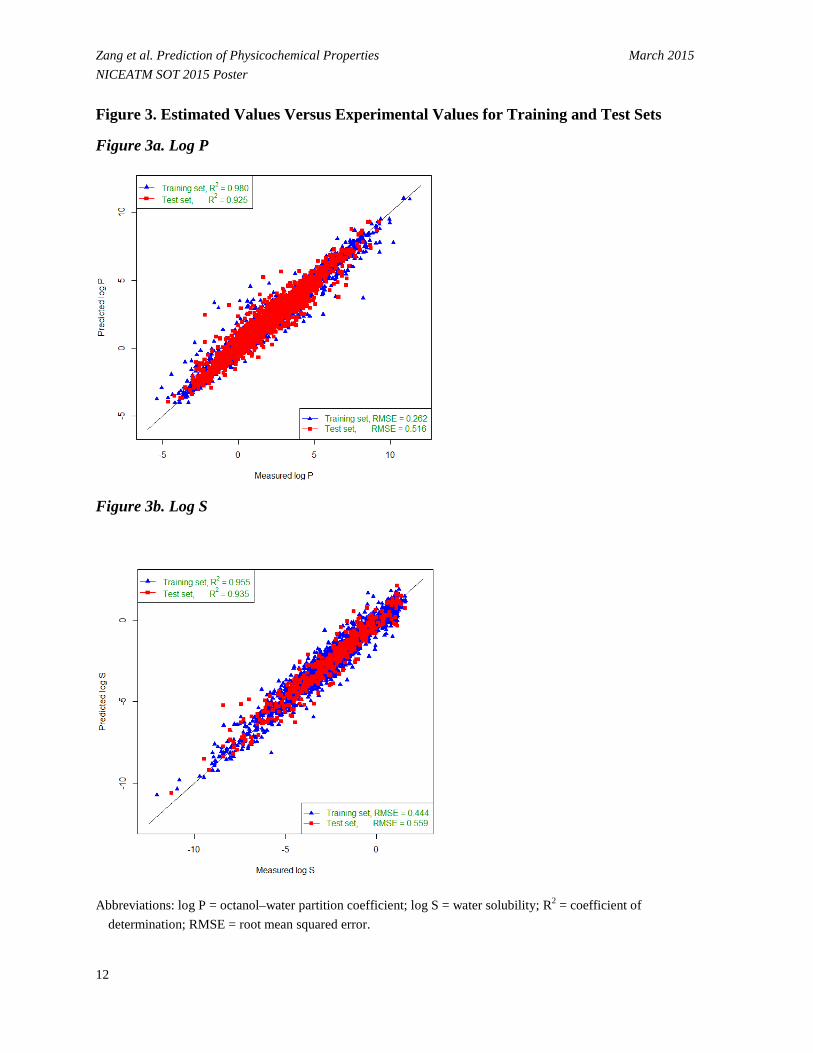
Zang et al. Prediction of Physicochemical Properties March 2015 NICEATM SOT 2015 Poster Figure 3. Estimated Values Versus Experimental Values for Training and Test Sets
Figure 3a. Log P
Figure 3b. Log S
Abbreviations: log P = octanol–water partition coefficient; log S = water solubility; R2 = coefficient of
determination; RMSE = root mean squared error.
12
Zang et al. Prediction of Physicochemical Properties March 2015 NICEATM SOT 2015 Poster Relationship Between Number of Principal Components and Standard Error of Prediction
• The number of significant principal components (PCs) for the PLS algorithm was determined using 10-fold cross-validation (CV) procedure on the training set (Zang et al. 2011). The relation of the standard error of prediction (SEP) versus the number of PCs is displayed in Figure 4.
- The gray lines were produced by repeating this procedure 100 times. The black line represents the lowest SEP value from a single 10-fold CV. The dashed vertical lines represent the optimal number of PCs and the dashed horizontal lines indicate the SEP value for the test set when the optimal PCs are applied.
- For the all-descriptor model, initially SEP decreases with PCs, and then starts to rebound after a certain point when the model begins to simulate the noise as the complexity of the model increases (Figure 4a). For the 600-bit model, the SEP decreases monotonically and gradually approaches a stable value, and the model with 42 PCs gave a minimum RMSE (Figure 4b).
13
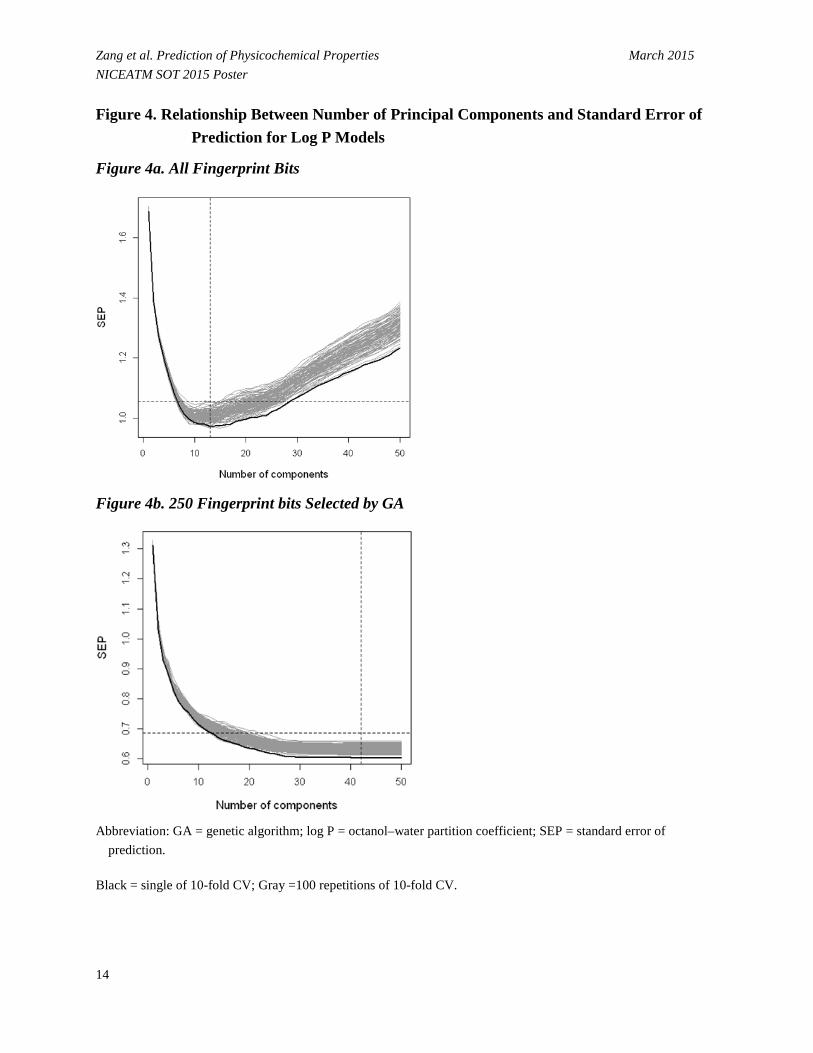
Zang et al. Prediction of Physicochemical Properties March 2015 NICEATM SOT 2015 Poster Figure 4. Relationship Between Number of Principal Components and Standard Error of
Prediction for Log P Models
Figure 4a. All Fingerprint Bits
Figure 4b. 250 Fingerprint bits Selected by GA
Abbreviation: GA = genetic algorithm; log P = octanol–water partition coefficient; SEP = standard error of
prediction.
Black = single of 10-fold CV; Gray =100 repetitions of 10-fold CV.
14
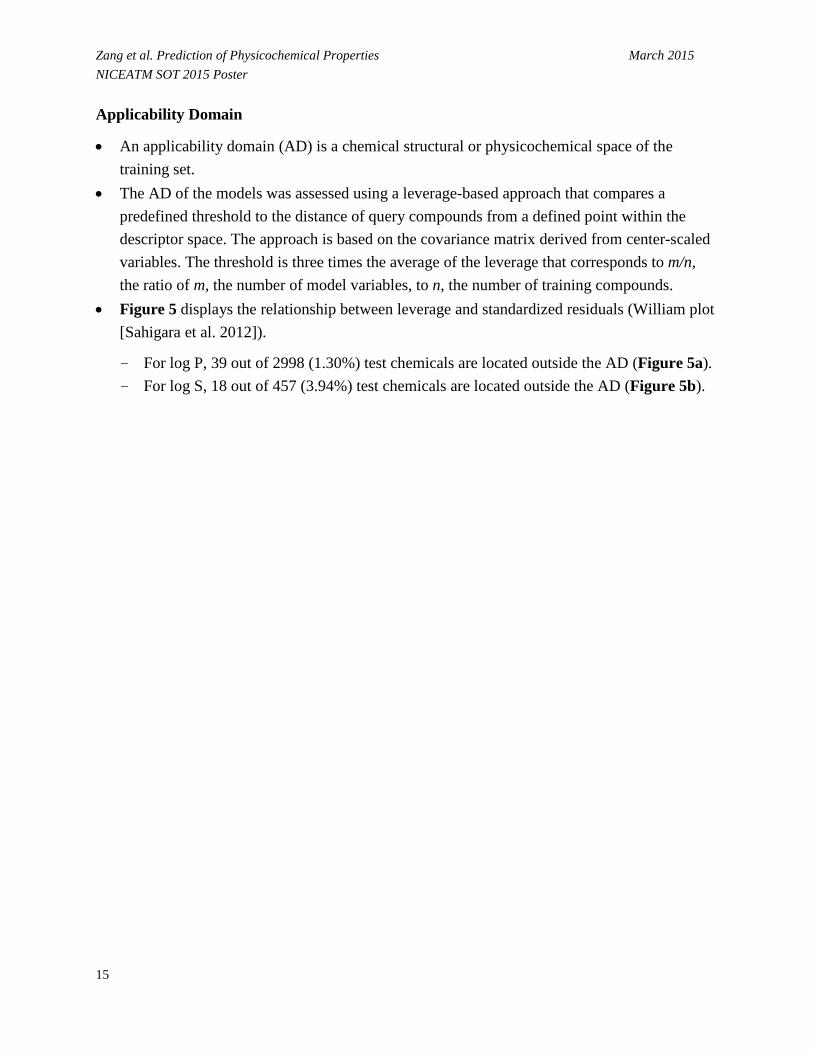
Zang et al. Prediction of Physicochemical Properties March 2015 NICEATM SOT 2015 Poster Applicability Domain
• An applicability domain (AD) is a chemical structural or physicochemical space of the training set.
• The AD of the models was assessed using a leverage-based approach that compares a predefined threshold to the distance of query compounds from a defined point within the descriptor space. The approach is based on the covariance matrix derived from center-scaled variables. The threshold is three times the average of the leverage that corresponds to m/n, the ratio of m, the number of model variables, to n, the number of training compounds.
• Figure 5 displays the relationship between leverage and standardized residuals (William plot [Sahigara et al. 2012]).
- For log P, 39 out of 2998 (1.30%) test chemicals are located outside the AD (Figure 5a). - For log S, 18 out of 457 (3.94%) test chemicals are located outside the AD (Figure 5b).
15
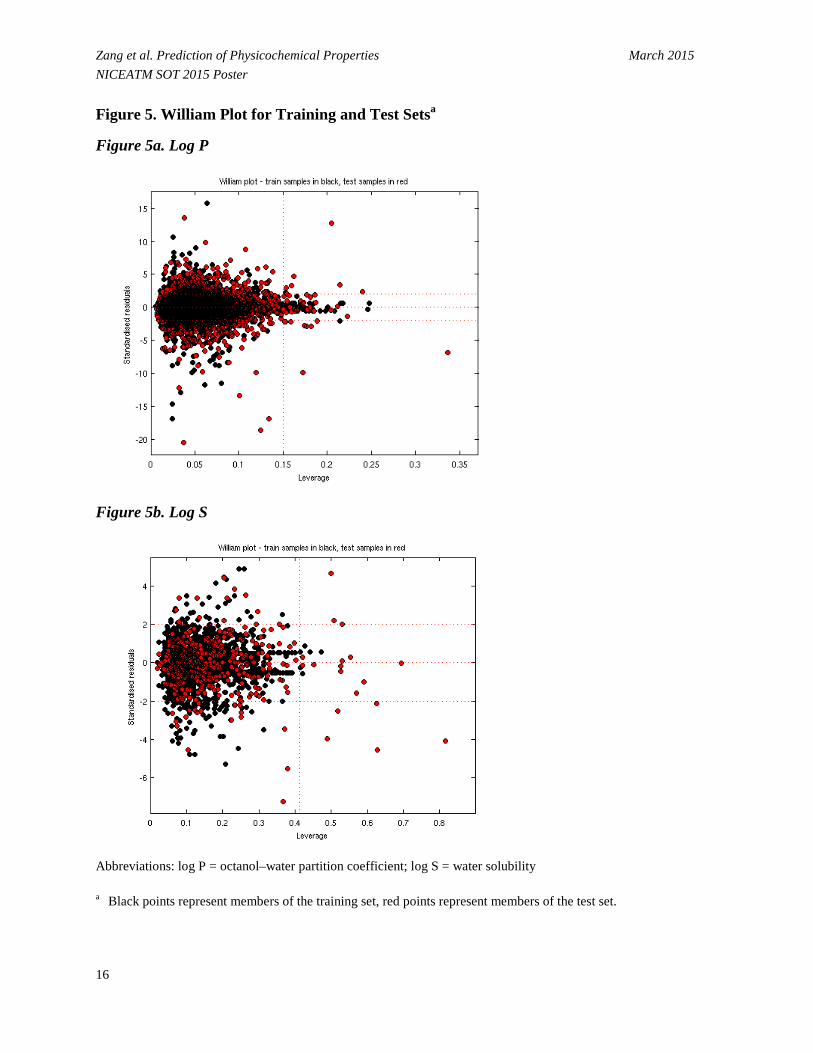
Zang et al. Prediction of Physicochemical Properties March 2015 NICEATM SOT 2015 Poster Figure 5. William Plot for Training and Test Setsa
Figure 5a. Log P
Figure 5b. Log S
Abbreviations: log P = octanol–water partition coefficient; log S = water solubility
a Black points represent members of the training set, red points represent members of the test set.
16

Zang et al. Prediction of Physicochemical Properties March 2015 NICEATM SOT 2015 Poster Comparison of the Models
• SVR substantially outperformed the other three approaches in predicting log P, log BCF, BP and MP with a low error rate (Table 3). However, performance of SVR was similar to the other three approaches for predicting log S and log VP.
• Table 4 lists regression statistics of best performing models for both 10-fold cross validation and test set.
17
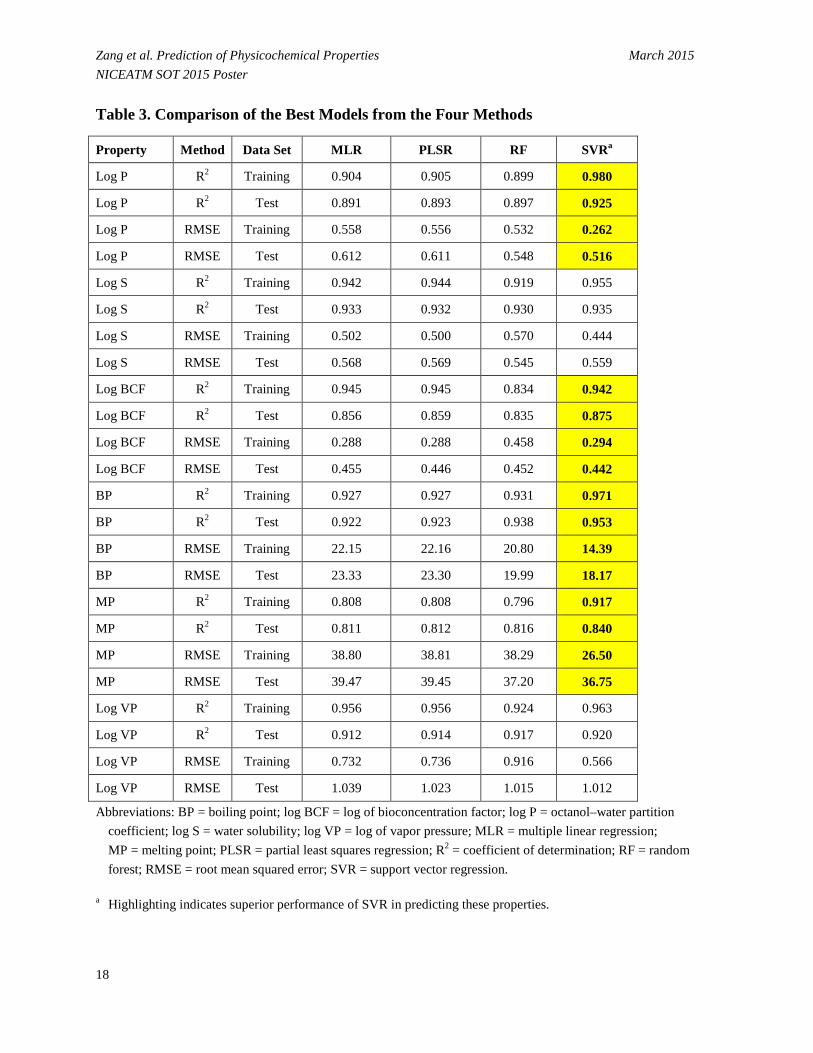
Zang et al. Prediction of Physicochemical Properties March 2015 NICEATM SOT 2015 Poster Table 3. Comparison of the Best Models from the Four Methods
Property Method Data Set MLR PLSR RF SVRa
Log P R2 Training 0.904 0.905 0.899 0.980
Log P R2 Test 0.891 0.893 0.897 0.925
Log P RMSE Training 0.558 0.556 0.532 0.262
Log P RMSE Test 0.612 0.611 0.548 0.516
Log S R2 Training 0.942 0.944 0.919 0.955
Log S R2 Test 0.933 0.932 0.930 0.935
Log S RMSE Training 0.502 0.500 0.570 0.444
Log S RMSE Test 0.568 0.569 0.545 0.559
Log BCF R2 Training 0.945 0.945 0.834 0.942
Log BCF R2 Test 0.856 0.859 0.835 0.875
Log BCF RMSE Training 0.288 0.288 0.458 0.294
Log BCF RMSE Test 0.455 0.446 0.452 0.442
BP R2 Training 0.927 0.927 0.931 0.971
BP R2 Test 0.922 0.923 0.938 0.953
BP RMSE Training 22.15 22.16 20.80 14.39
BP RMSE Test 23.33 23.30 19.99 18.17
MP R2 Training 0.808 0.808 0.796 0.917
MP R2 Test 0.811 0.812 0.816 0.840
MP RMSE Training 38.80 38.81 38.29 26.50
MP RMSE Test 39.47 39.45 37.20 36.75
Log VP R2 Training 0.956 0.956 0.924 0.963
Log VP R2 Test 0.912 0.914 0.917 0.920
Log VP RMSE Training 0.732 0.736 0.916 0.566
Log VP RMSE Test 1.039 1.023 1.015 1.012
Abbreviations: BP = boiling point; log BCF = log of bioconcentration factor; log P = octanol–water partition coefficient; log S = water solubility; log VP = log of vapor pressure; MLR = multiple linear regression; MP = melting point; PLSR = partial least squares regression; R2 = coefficient of determination; RF = random forest; RMSE = root mean squared error; SVR = support vector regression.
a Highlighting indicates superior performance of SVR in predicting these properties.
18
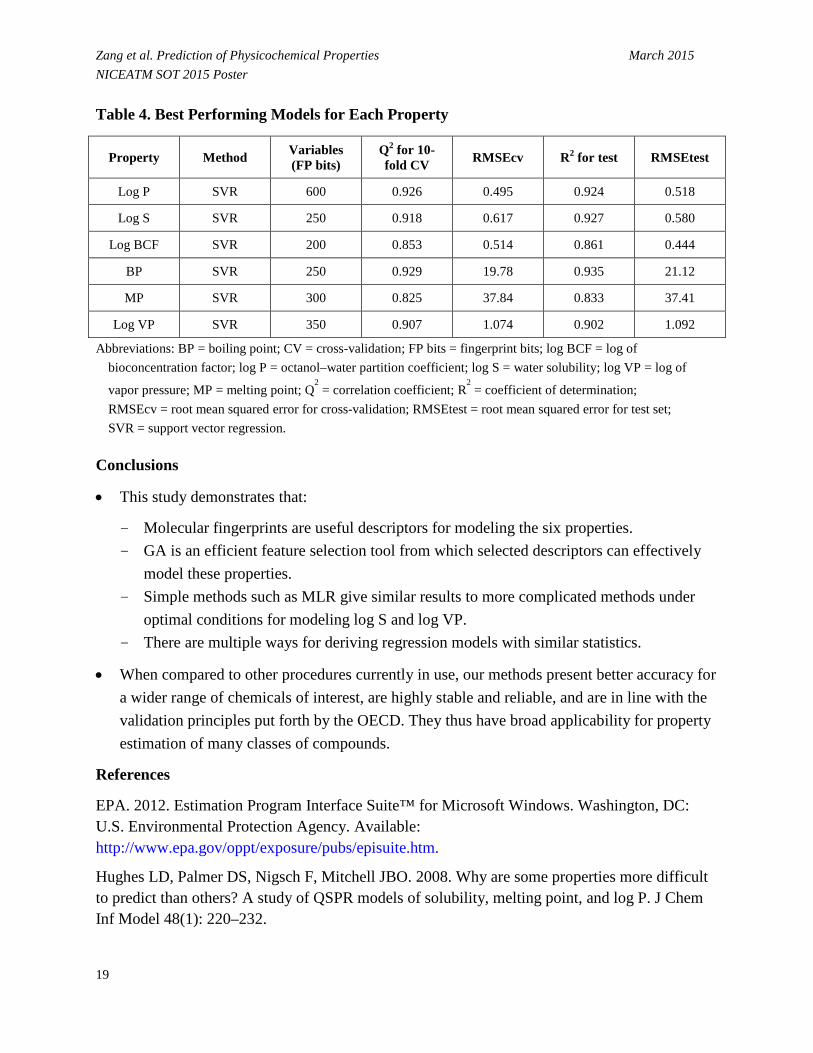
Zang et al. Prediction of Physicochemical Properties March 2015 NICEATM SOT 2015 Poster Table 4. Best Performing Models for Each Property
Property Method Variables (FP bits)
Q2 for 10-fold CV RMSEcv R2 for test RMSEtest
Log P SVR 600 0.926 0.495 0.924 0.518
Log S SVR 250 0.918 0.617 0.927 0.580
Log BCF SVR 200 0.853 0.514 0.861 0.444
BP SVR 250 0.929 19.78 0.935 21.12
MP SVR 300 0.825 37.84 0.833 37.41
Log VP SVR 350 0.907 1.074 0.902 1.092
Abbreviations: BP = boiling point; CV = cross-validation; FP bits = fingerprint bits; log BCF = log of bioconcentration factor; log P = octanol–water partition coefficient; log S = water solubility; log VP = log of
vapor pressure; MP = melting point; Q2 = correlation coefficient; R
2 = coefficient of determination;
RMSEcv = root mean squared error for cross-validation; RMSEtest = root mean squared error for test set; SVR = support vector regression.
Conclusions
• This study demonstrates that:
- Molecular fingerprints are useful descriptors for modeling the six properties. - GA is an efficient feature selection tool from which selected descriptors can effectively
model these properties. - Simple methods such as MLR give similar results to more complicated methods under
optimal conditions for modeling log S and log VP. - There are multiple ways for deriving regression models with similar statistics.
• When compared to other procedures currently in use, our methods present better accuracy for a wider range of chemicals of interest, are highly stable and reliable, and are in line with the validation principles put forth by the OECD. They thus have broad applicability for property estimation of many classes of compounds.
References
EPA. 2012. Estimation Program Interface Suite™ for Microsoft Windows. Washington, DC: U.S. Environmental Protection Agency. Available: http://www.epa.gov/oppt/exposure/pubs/episuite.htm.
Hughes LD, Palmer DS, Nigsch F, Mitchell JBO. 2008. Why are some properties more difficult to predict than others? A study of QSPR models of solubility, melting point, and log P. J Chem Inf Model 48(1): 220–232.
19
Zang et al. Prediction of Physicochemical Properties March 2015 NICEATM SOT 2015 Poster OECD. 2004. OECD Principles for the Validation, for Regulatory Purposes of Quantitative Structure–Activity Relationship Models. Available: http://www.oecd.org/env/ehs/risk-assessment/37849783.pdf.
R Development Core Team. 2008. R: A Language and Environment for Statistical Computing (ISBN 3-900051-07-0). Vienna, Austria:R Foundation for Statistical Computing. Available: http://www.R-project.org.
Sahigara F, Mansouri K, Ballabio D, Mauri A, Consonni V, Todeschini R. 2012. Comparison of Different Approaches to Define the Applicability Domain of QSAR Models. Molecules 17: 4791–4810.
SRC, Inc. EPI Suite Data. Available: http://esc.syrres.com/interkow/EPiSuiteData.htm.
Wegner JK, Zell A. 2003. Prediction of aqueous solubility and partition coefficient optimized by a genetic algorithm based descriptor selection method. J Chem Inf Comput Sci 43(3): 1077–1084.
Zang Q, Keire DA, Wood RD, Buhse LF, Moore CMV, Nasr M, Al-Hakim A, Trehy ML, Welsh WJ. 2011. Determination of galactosamine impurities in heparin samples by multivariate regression analysis of their 1H NMR spectra. Anal Bioanal Chem 399(2): 635–649.
Acknowledgements
The Intramural Research Program of the National Institute of Environmental Health Sciences (NIEHS) supported this poster. Technical support was provided by ILS under NIEHS contract HHSN27320140003C.
The views expressed above do not necessarily represent the policies of EPA or NIH or the official positions of any Federal agency. Since the poster was written as part of the official duties of the authors, it can be freely copied.
A summary of NICEATM activities at the 2015 SOT Annual Meeting is available on the National Toxicology Program website at http://ntp.niehs.nih.gov/go/742110.
20


![In-silico prediction of drug targets, biological ... · eral in silico bioinformatic methods have been developed and applied [2,3]. Drug targets have been predicted by using chemical](https://static.fdocuments.net/doc/165x107/5f9c0849ad8d70158c221792/in-silico-prediction-of-drug-targets-biological-eral-in-silico-bioinformatic.jpg)


