In Search of Proxies for Measuring Fleet Readiness
15
Page | 1 In Search of Proxies for Measuring Fleet Readiness Matthew R. MacLeod and Andrew P. Billyard, Defence Research and Development Canada, Centre for Operational Research and Analysis, Halifax, NS. {Matthew.MacLeod3,Andrew.Billyard}@forces.gc.ca Prepared for the 31 st International Symposium on Military Operational Research (31 ISMOR). © Her Majesty the Queen in Right of Canada (Department of National Defence), 2014. Abstract In an era of frigate modernization, budget pressures, and preparation for the introduction of new classes of ship, Canada’s East Coast Fleet is focused on maintaining a sufficient level of readiness. To determine what is sufficient, one must of course first be able to measure the ever elusive concept of readiness. To be useful, those measures have to be practical to measure routinely across the whole fleet, and preferably exist in the historical record. In particular, the military staff has been interested in determining the quality and complexity of sea days in contributing to crew readiness. The authors present several measures they have evaluated as representative of sea day complexity, including their relative strengths and weaknesses. Initial results based on subject matter expert evaluations of complexity will be discussed. Acknowledgements The authors would like to acknowledge Cdr Rod Druggett and Lt(N) Arron Butler of HMCS Charlottetown, whose work on data collection and preliminary analysis was invaluable, as was their work in providing and tracking down subject matter expertise. Adrienne Turnbull also contributed to the early stages of the data gathering and the main analysis, before temporarily abandoning Halifax Harbour for the more temperate climes of the NATO Centre for Maritime Research and Experimentation in La Spezia, Italy. Michel Couillard contributed at an even earlier stage to the analysis of the fuel data, before embarking on a more extended excursion to La Spezia. Sean Bourdon and an anonymous peer reviewer provided valuable feedback in the final stages of review. Michael Cowhey also deserves appreciation for tracking down copies of several of the references in, as always, rapid fashion. 1. Introduction “When I use a word, it means just what I choose it to mean – neither more nor less.” Humpty Dumpty [1]. Particularly in peace-time, one of the major products of a military force is ‘readiness’ – i.e. the assurance that the force is prepared to be effective if deployed to meet the needs of its Government. The precise definition of readiness can be elusive, having several facets and different meanings in different contexts. As keenly noted in the Military Operations Research journal in 2002 “[t]he number of potential predictors seems limitless…. [US organizations] have identified several hundred possible measures without even proposing any new ones. The dilemma is knowing which potential predictors of readiness are worth the time and effort to measure and collect” [5]. The Canadian Armed Forces (CAF) as a whole is working to express this better at multiple levels as the focus on value for money continues. The Royal Canadian Navy (RCN) has a more specific interest in understanding what factors truly contribute to its readiness as it fine tunes requirements and plans for future ship classes. This paper discusses preliminary analyses done on the RCN’s East Coast Fleet (some
Transcript of In Search of Proxies for Measuring Fleet Readiness

P a g e | 1
In Search of Proxies for Measuring Fleet Readiness Matthew R. MacLeod and Andrew P. Billyard, Defence Research and Development Canada, Centre for Operational Research and Analysis, Halifax, NS. {Matthew.MacLeod3,Andrew.Billyard}@forces.gc.ca Prepared for the 31st International Symposium on Military Operational Research (31 ISMOR). © Her Majesty the Queen in Right of Canada (Department of National Defence), 2014.
Abstract In an era of frigate modernization, budget pressures, and preparation for the introduction of new
classes of ship, Canada’s East Coast Fleet is focused on maintaining a sufficient level of readiness. To determine what is sufficient, one must of course first be able to measure the ever elusive concept of readiness. To be useful, those measures have to be practical to measure routinely across the whole fleet, and preferably exist in the historical record. In particular, the military staff has been interested in determining the quality and complexity of sea days in contributing to crew readiness. The authors present several measures they have evaluated as representative of sea day complexity, including their relative strengths and weaknesses. Initial results based on subject matter expert evaluations of complexity will be discussed.
Acknowledgements The authors would like to acknowledge Cdr Rod Druggett and Lt(N) Arron Butler of HMCS
Charlottetown, whose work on data collection and preliminary analysis was invaluable, as was their work in providing and tracking down subject matter expertise. Adrienne Turnbull also contributed to the early stages of the data gathering and the main analysis, before temporarily abandoning Halifax Harbour for the more temperate climes of the NATO Centre for Maritime Research and Experimentation in La Spezia, Italy. Michel Couillard contributed at an even earlier stage to the analysis of the fuel data, before embarking on a more extended excursion to La Spezia. Sean Bourdon and an anonymous peer reviewer provided valuable feedback in the final stages of review. Michael Cowhey also deserves appreciation for tracking down copies of several of the references in, as always, rapid fashion.
1. Introduction “When I use a word, it means just what I choose it to mean – neither more nor less.” Humpty Dumpty [1].
Particularly in peace-time, one of the major products of a military force is ‘readiness’ – i.e. the assurance that the force is prepared to be effective if deployed to meet the needs of its Government. The precise definition of readiness can be elusive, having several facets and different meanings in different contexts. As keenly noted in the Military Operations Research journal in 2002 “[t]he number of potential predictors seems limitless…. [US organizations] have identified several hundred possible measures without even proposing any new ones. The dilemma is knowing which potential predictors of readiness are worth the time and effort to measure and collect” [5].
The Canadian Armed Forces (CAF) as a whole is working to express this better at multiple levels as the focus on value for money continues. The Royal Canadian Navy (RCN) has a more specific interest in understanding what factors truly contribute to its readiness as it fine tunes requirements and plans for future ship classes. This paper discusses preliminary analyses done on the RCN’s East Coast Fleet (some

P a g e | 2
of which was previously reported at [2]), while looking at the literature and the available data sources for inspiration for future work. In particular, the authors are in search of measures that are practical to track on a ship/fleet level (tactical/operational) without need for a new and continuing data collection or reporting burden.
Before moving on, it is worth being explicit with regards to the RCN’s definitions of readiness in its Tiered Readiness Program. Current doctrine recognizes four discrete levels [3]:
• Extended Readiness – assigned to assets that are removed from operational status for the purposes of undergoing extended maintenance
• Restricted Readiness – applies predominantly to units where deficiencies in personnel, materiel and/or training may severely limit a unit’s employment. It can also be assigned to units restricted due to personnel tempo limitations, or due to preparations for extended maintenance (particularly when in transition from standard to extended).
• Standard Readiness – the normal level of readiness for all maritime operational capability across the RCN. Available for continental and expeditionary missions that do not entail the possibility of high intensity, full spectrum combat.
• High Readiness – capable of conducting the full spectrum of combat operations. Will have undergone additional levels of training based on both the mission and the intensity requirements.
In order for a ship to progress to a higher readiness level, it must conduct prescribed work-ups (WUPS) and exercises, and then be evaluated by Sea Training staff. The Sea Training staff assigns satisfactory or unsatisfactory ratings on a standardized set of Combat Readiness Requirements (CRRs) – all must be achieved satisfactorily before being promoted to the next readiness level [4].
The current system does not provide for the representation of a ship being ‘not quite’ at standard or high readiness, which makes it difficult to discuss – and potentially accept – the risk of deploying a ship that does not quite meet the full standard. The CRRs vary greatly in scope, criticality and duration (from 30 days to 730 days), so simply expressing a percentage of complete CRRs does not adequately convey the situation.
2. Context The RCN is going through an extensive period of fleet renewal, which brings a number of challenges
along with opportunities. In addition to the National Ship Procurement Strategy [5], which will see the introduction of three new types of vessels to the RCN, vessels in the existing frigate fleet are beginning to complete their upgrades under the Halifax Class Modernization / Frigate Life Extension project [6]. There is understandable interest from various levels of the Naval Staff in understanding the effect on readiness of a decade or more of phased ship decommissioning, commissioning, and upgrades.
Before attempting to look too far forward, it is reasonable to first ensure the current situation is well understood. Commander Canadian Fleet Atlantic (COMCANFLTLANT) asked the authors and some of his own ship staff to take an initial look into whether there had been any decrease in the scope and complexity of the East Coast’s fleet over time, the results of which will be discussed further below [2]. Part of the motivation for this work was to examine whether there was any validity in perceptions around the water cooler that in ‘the good old days’ ships spent more time at sea doing more complex operations. Parallel to this, the Commander of Maritime Forces Atlantic (Commander MARLANT) created a position of ‘Readiness Captain,’ to focus more broadly on this issue over the medium term. This paper represents the authors’ early stage efforts to provide operational research input into that work.
Over and above the immediate RCN and MARLANT context, there are a few other factors in the wider environment that are worth mentioning. The Department of National Defence (DND) and CAF

P a g e | 3
went through a Strategic Review in 2010 to “assess programs and initiate changes to ensure that programs are achieving their intended results, are effectively managed, and are appropriately aligned with the priorities of Canadians and with federal responsibilities,” [7] which was followed closely by the implementation of the Government of Canada-wide Deficit Reduction Action Plan with the intent to “rebalance the civilian workforce and Reserve Force to ensure the right people are in the right jobs, in the right places” [8]. In addition to these Government-directed initiatives, DND/CAF is currently undertaking an effort known as Defence Renewal, “to minimize inefficiency, streamline business processes and maximize the operational results we deliver for Canada and Canadians” [9]. An overall effect of these efforts has been to increase the focus of DND/CAF on being able to clearly express how the investment of resources translates into value provided; in the absence of ongoing large-scale operations the ‘value’ of military units often resides in the difficult to express concept of readiness.
Budgetary pressures and an increased focus on value for resources are of course by no means unique to the Canadian context. While researching this paper, the authors found many references to a sometimes controversial – and ultimately abandoned – initiative in the United States Navy (USN) known as ‘optimal manning’ [10]. Although not officially publicly released, a report led by VAdm (Ret’d) Philip Balisle on the issue has been widely quoted, including assertions that “if the surface force stays on the course that it presently on, DDGs will achieve 25-27 years of service life instead of the 30 years planned and 40 years of extended service life desired” [11], [12], citing amongst other things a lack of training and an increased tolerance for non-completion of work as workweeks increased and crew sizes were cut. Amongst other things, a recommendation was reportedly made that surface ships be manned at 110% over their base level to account for an observed effective crew loss rate of eight percent. An official spokesperson for the USN declined to discuss specific manning levels, but did indicate that “the intent is to shift billets from shore to sea… except those being shifted into shore maintenance billets from other shore billets” [12]. The US Government Accountability Office (GAO) highlighted some specific concerns with the approach taken by the USN for optimal manning, including using only at-sea data in their workload analysis, and changing certain standards used to evaluate workloads “but did not always address the elements called for in Navy guidance and best practices” [13]. The USN experience indicates to the authors a need for caution in assuming that the requirements for running a ship can be calculated by adding up individual required operational tasks – understanding the ship as a system is important.
A final issue that may be considered during this work is the RCN’s recent execution of a “Relief in Place” (a crew exchange, or “Sea Swap” in USN terminology) for HMCS Toronto in 2013 during Operation Artemis, following an earlier exchange between two coastal defence vessel crews in 2011 in Canada’s North [14]. It may be valuable to track readiness with greater granularity than the current per-ship RCN metric in these situations. Although the USN initially concluded that sea swaps for surface ships increase their flexibility during surges, and could make their movements less predictable to potential adversaries, the GAO expressed concerns in 2004 and 2008 that the USN had not fully developed an analytical framework to measure the impact of different rotation options nor to compare them [15] [16], and expressed concern about establishing standard procedures for surface ships (already well developed for ballistic missile submarines) as well as assessing the impact on maintenance [17]. The USN backed away from the concept for a few years, but in 2012 the Chief of Naval Operations indicated it should be re-examined [18]– all of which would seem to indicate it is an idea that needs further study for its impact on various facets of readiness.

P a g e | 4
3. Literature Review and Unsuccessful Attempts “If there’s no meaning in it, that saves a world of trouble, you know, as we needn’t try to find any.” – the King of Hearts [19].
This section will cover two of the approaches taken by the authors and their colleagues while preparing for the initial report to Commander CANFLTLANT – a quick literature review, and a review of the readily available data for the East Coast Fleet.
Perhaps unsurprisingly, a large amount of the publicly available literature on Naval fleet readiness in general – and sea days in particular – is from the USN. This is unfortunate as the USN as an organization is essentially sui generis, and an order of magnitude larger than the RCN. Part of the authors’ goal in presenting this work at ISMOR, in fact, is in hopes of getting feedback from countries with more comparable navies. It will likely be difficult to directly port approaches from the USN to the RCN – especially at the fleet rather than ship level – but there is some possibility that if the utility of a method can be proved on the larger sample of the USN, it could be used with some level of confidence on the smaller sample of the RCN, perhaps by filtering to consider only comparable ship classes. From 1986 [20], the Global Status of Resources and Training System (GSORTS or SORTS, depending on the time period and source) was the only common US reporting tool on readiness until the mid-to-late 1990s, when the Chairman’s Readiness System was established to integrate this and other information at a higher level [21]. Since we are primarily concerned with the tactical level with which SORTS is concerned, and again due to the large volume of US-centric publications, much of the literature reviewed for this paper was concerned with the analysis of SORTS data. The intent of the Chairman of the Joint Chiefs of Staff is that “GSORTS provides broad bands of readiness information on selected unit status indicators and includes a commander’s subjective assessment on the unit’s ability to execute the mission(s) for which the unit was organized or designed,” with the understanding that “[i]t is also important to understand that readiness systems are not predictive systems – they cannot project future readiness” [21]. The readiness level ratings are reported as ‘C-ratings’ from C-1 (best) to C-5 (units temporarily removed from the force). Some of the key commentary on SORTS is summarized below.
In a general review of trends in indicators of military readiness from 1980 through 1993, the US Congressional Budget Office (CBO) noted a number of concerns [22]:
“Experience… suggests that mission-capable rates and C-ratings are at best general indicators of readiness levels and should be interpreted with caution. During the early 1980s, DoD [Department of Defense] analysts found that these indicators did not improve as much as senior commanders' subjective judgments about readiness or increases in defense spending might have warranted. Part of the explanation may be the time it takes for increases in funding … to translate into higher levels of readiness. Another factor cited by DoD was the introduction of more modern, capable weapon systems during the 1980s that led to declines in mission-capable rates and C-ratings until crews were fully trained on the new systems and the necessary support base was established. Intangible factors – changes in reporting philosophies for C-ratings and in the emphasis given to having equipment mission capable at all times – can also distort trends in these indicators over time and mask underlying changes in readiness. For example, some Navy officials attribute a sharp downturn in both mission-capable rates and C-ratings in the early 1980s to a policy change that encouraged commanders to report, rather than downplay, their readiness problems.”
These are important cautions for interpreting the SORTS data. Although it appears superficially detailed and complex, at the root it relies on the somewhat subjective input of Commanders; in addition to variations in how an individual may assess the situation, even the policy advice on making those

P a g e | 5
judgements may change from time to time. Another theme mentioned later in the paper is that the time lag between various readiness inputs or outputs may be difficult to know or measure.
The Center for Naval Analyses (CNA) conducted analysis of the effect of different factors on SORTS scores in 1996, and found that while the amount of time at sea (referred to as ‘steaming,’ and defined as days under way per ship per quarter) had a statistically significant effect on some aspects of readiness, the effect was not generally large enough to be particularly meaningful [23]. The effect on equipment failure rate was almost vanishingly small, with a 10% increase in steaming leading to an increase of 0.2% in reports per quarter. There was a slightly larger positive effect on personnel readiness, but the same 10% increase in steaming only increased the time in the highest personnel readiness bracket by about 1%. A 10% increase in steaming was correlated with an approximately 2% increase in time spent in the highest training readiness score, however this was non-linear, and steaming more than 61 days/quarter started to reduce the observed training accomplishment.
A more detailed analysis of similar data using Structural Equation Modelling (SEM) was published by Tatum in Military Operations Research in 2002 [24]. The paper referred to several audits from the CBO and GAO which found SORTS to be “flawed in many ways,” and that “empirical studies to date that have attempted to identify predictors of readiness leave much to be desired” [24]. The same offices have continued to question the use of these metrics. Even if the authors were willing to accept these flaws, Canada has no databank of similar scope to SORTS. In addition to SORTS, Tatum was able to access ship logs from the Naval Historical Center on the results of 26 exercises conducted by 111 naval combatants over a six-year period, for a total of 1534 observations [24] – even if Canada kept records of the same level of detail, one would not be able to approach these sample sizes.
Outside of the analysis of SORTS data, much of the existing literature referring specifically to sea days is focused on crew issues (medical or otherwise), which do not take into account the types of activities per day. Many of the salient points to do with the crew are raised in a CNA report on the evolution of sea pay [25]; a discussion of proper reimbursement for crew naturally must consider the value gained in having the crew at sea.
Moving on to the RCN data sources, one of the first considered by the Maritime Forces Atlantic (MARLANT) N02 Operational Research (N02OR) team was fuel data. Extra fuel is currently allocated to high readiness ships, and so this seemed a natural place to search for correlations. Historical operational schedules (OPSKEDs) were obtained, which contained a record of the ships’ main activities each day. The intended analysis method was to examine the amount of fuel consumed against each of these types of activities and provide statistical fuel costs (e.g., WUPS typically consume x ± Δx m3 of fuel). Given that a ship must conduct a prescribed number of WUPS and exercises in order to achieve a certain readiness level [26], this method would provide a means to evaluate how much energy the ship needs to expend to get there, and potentially allow the relation to be reversed.
The initial roadblock met was that fuel data as archived ashore is reported in monthly increments. The analysts were left with an over-determined system of equations (142 equations from 11 years of monthly fuel totals for 110 unique daily activities). To simplify the problem, the activities were grouped into six higher-level activities (Docked, Training, Transit, Trials, Exercise, Patrol, and Operations), and the equations were solved for the fuel consumption of these six variables in six-month intervals. Unfortunately this brute force method led only to spurious results, with the resulting distributions including negative fuel consumptions. Although the analysis was abandoned for this reason, there are extant daily and/or weekly fuel logs which reside on at least some of the ships, which might provide more useable data to explore this method again since that data and the OPSKED share the same resolution in time.
A second tack taken by N02OR was to examine the duration-at-sea component needed to sustain a given level of readiness. The data at hand was the RCN’s significant incident reports. These reports are to be filled out whenever a person onboard injures themselves. The intent of the analysis was to see if

P a g e | 6
there was a human factors component to readiness that could be measured by seeing if there were correlations between this incident data and duration at sea since the beginning of a readiness level. For instance, a positive correlation might indicate that as the time elapsed since a ship achieved a given readiness level grew, the number of incidents increased. If this were the case, it would provide evidence to support the need for an upper limit to the duration of a readiness level. Conversely, a negative correlation indicating that incidents decline over time, would perhaps imply that not enough training and WUPS was given in the period preceding the given readiness level. The data, however, showed no clear correlation. In reviewing this null result with the client, it was pointed out that the significant incidents data is typically skewed towards serious injuries (broken limbs, open wounds, unconsciousness) because less serious incidents are often not reported, especially if the person in question can continue with their duties with no adverse effects. There therefore may not be enough resolution in the data or frequent enough events to find real correlations.
The third major effort by N02OR will be captured in the following section. Although the results similarly did not show a major change in the indicator over time, in this case the specific client was interested in having a null result be thoroughly documented.
4. Preliminary Results – Per-Day Activity Complexity The results of the following preliminary look at a proxy for fleet readiness were a result of a request
from Commander Canadian Fleet Atlantic (COMCANFLTLANT) for N02OR to collaborate with officers from HMCS Charlottetown on an analysis of the change – if any – on the scope and complexity of the fleet’s operations over time. More concisely, they were asked to assess whether Canadian Fleet Atlantic is conducting the same intensity of effort at sea today compared to historical levels. This material is a slightly condensed and re-worked version of the results delivered by the authors and their collaborators to COMCANFLTLANT [2].
A fundamental issue is that the Royal Canadian Navy (RCN) uses the number of days at sea as the common metric to help quantify a ship’s progression towards a particular level of readiness [4], but counting these “sea days” alone may not relay enough information. For example, one day at sea for a Halifax-class frigate conducting a fisheries patrol (FISHPAT) is not equivalent to a day at sea conducting anti-submarine warfare (ASW) while in theatre; the latter requires more training, has higher inter-ship communication demands and typically involves co-ordination with assets other than the frigate itself (e.g. other ships and maritime helicopters). Thus, part of the analysis was to find ways to measure the intensity of sea days, coined as the sea day’s “complexity” by COMCANFLTLANT. Particularly as the number of ships at sea is being reduced while the Halifax-class ships are going through mid-life refit, there is an interest in validating whether the fleet is still doing the same level of “core RCN” activities at sea as it has in the past.
4.1 Data Generation Due to the relatively quick response requested by COMCANFLTLANT, the HMCS Charlottetown team
and the MARLANT N02OR team assessed the information sources that were readily available and amenable to analysis. The approach taken was to examine the last 10 years of the CANFLTLANT’s OPSKED1, assign each day’s activity to a category, derive a complexity value for that category, and finally analyze how or whether the total number of “complex” sea days has changed over time.
1 Note that only the OPSKEDs for the Halifax-class frigates, Iroquois-class destroyers, and Protecteur-class
auxiliary oiler replenishment ships were used.

P a g e | 7
As a first step, each day’s activity at sea recorded in the CANFLTLANT OPSKED2 (used as a proxy for the whole RCN fleet) was placed into one of nine exercise categories:
• “Joint Warrior”: Any exercise intended to enrich the Navy’s “battle” experience in a multinational task-group setting.
• “TGEX” (Task Group Exercise): An exercise intended to enrich the Navy’s “battle” experience in an RCN task group setting.
• “CJOC” (Canadian Joint Operations Command): Deployed operations of one or more RCN assets in an international theatre of operation. This category’s label stems from the fact that such operations are now under the command of CJOC; however, all similar deployments prior to 2011 under its predecessor organizations were filed under this category.
• “WUPS”: The required work-ups at sea required to bring a ship up to a certain level of readiness. • “NANOOK”: Various domestic operations including OP NANOOK, in which the RCN participates
with other government departments to improve coordination in responding to emergencies within national boundaries, and to exercise and defend Canada’s sovereignty.
• “CARRIBE”: Any days at sea conducting multi-national constabulary operations such as the drug interdiction operation OP CARRIBE.
• “FISHPAT”: Conducting fishery patrols in Canadian waters in support of Fisheries and Oceans Canada.
• “GLD” (Great Lake Deployments): Any days at sea which are part of the RCN’s outreach programme.
• “Other/ISE” (Independent Ship Exercises): The remaining activities at sea in the OPSKED which are attributable to e.g. harbour trials and sea trials.
Once the categories were defined, the HMCS Charlottetown team had four subject matter experts (SMEs) assign a series of complexity scores from 1 to 5 for each of the first eight exercise categories (see Annex A for the meaning of the scores). These scores were assigned for each warfare area (ASW, ASuW, AAW, FP, MIO3), as well as for “air detachment used” (binary assessment, rather than 1 to 5), for general “seamanship” activities, and for “ISE vs multi-ship.” For brevity, we will use activity to encompass the warfare areas along with “air detachment”, “seamanship” and “ISE vs multi-ship”. Sea days attributed to “Other/ISE” were not scored, and so have an effective score of 0.4
4.2 Methods For each exercise category, MARLANT N02OR treated the individual SME scores as an indicative
distribution of expected SME responses. For instance, in evaluating the MIO complexity of the TGEX activity, the four SME assessments were {3, 1, 2, 1}. Thus, 0% of SMEs gave a “0”, “4” or “5” rating, 50% gave a “1” rating, 25% gave a “2” rating and 25% gave a “3”. The distribution of possible totals for each exercise category was then constructed by convolution of these four-point distributions. In this way, it was easy to see the spread in possible totals for each exercise.
2 A consideration for further work is that the activity that was scheduled is not necessarily that which was
executed (i.e. if the ship was called away on an emergency or priority tasking). It was assessed by the team that this would have a relatively small effect on the overall results, and in any case should not introduce a bias to the year-over-year trend.
3 ASuW: anti-surface warfare, AAW: anti-air warfare, FP: force protection, MIO: maritime interdiction operations.
4 This activity covers sea days not included in the other activity categories, and generally represents single ship operations. While “ISE vs. Multi-Ship” was used as a factor within each activity, there are purely ISE days which do not contribute to the generation of warfare skills (although they are necessary for the regeneration of the ship and crew).
P a g e | 8
Using the data thus prepared, the first analysis method was to then create an overall per year “complex sea days” total, using each exercise category’s “complexity” score as a weight when totalling the number of sea days. For example, if 14 days in a given year were spent on “Joint Warrior”-type exercises, and that category had a complexity value of (say) 28, then its contribution to “complex sea days” for the year would be 28 x 14 = 392. A trend analysis was then conducted on these yearly complex sea days over a ten year window.
Because there are known issues with weighted-sum schemes (see e.g. [27]), a second method was employed. The convolution methods were first used to determine the most highly rated exercises on the complexity score, then, once this group was established, a trend analysis was conducted to see how the yearly sea days of just this group fluctuated over the same ten year window.
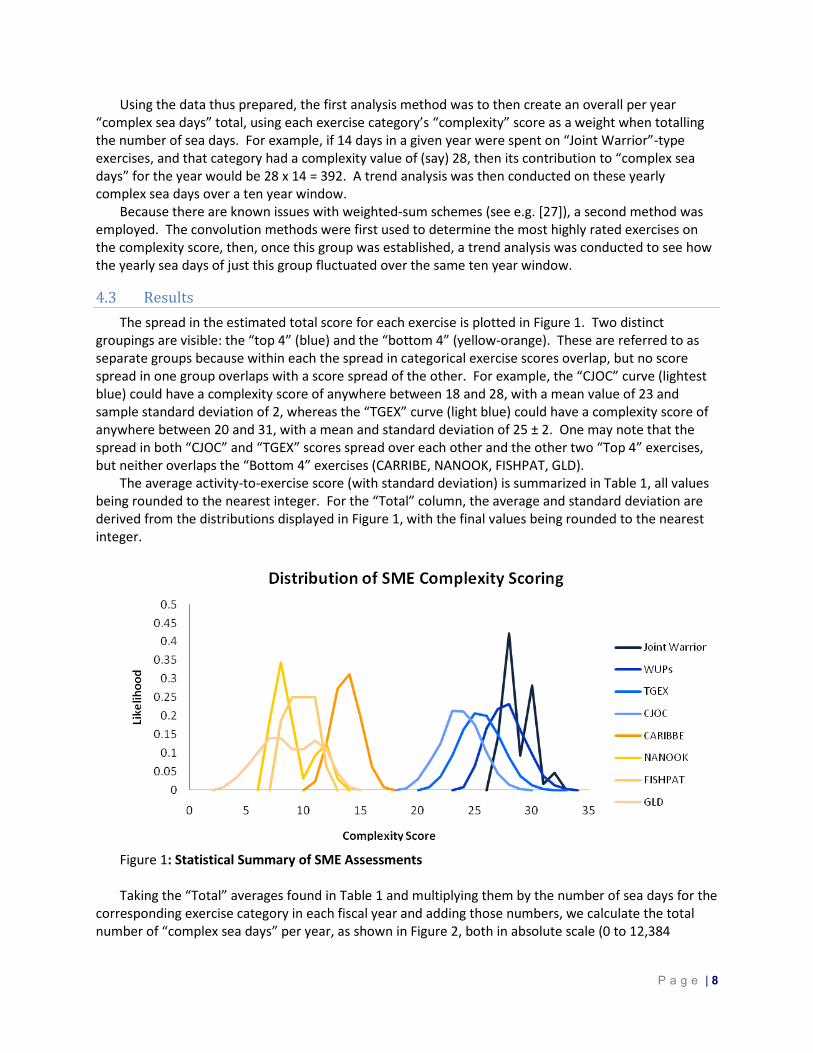
4.3 Results The spread in the estimated total score for each exercise is plotted in Figure 1. Two distinct
groupings are visible: the “top 4” (blue) and the “bottom 4” (yellow-orange). These are referred to as separate groups because within each the spread in categorical exercise scores overlap, but no score spread in one group overlaps with a score spread of the other. For example, the “CJOC” curve (lightest blue) could have a complexity score of anywhere between 18 and 28, with a mean value of 23 and sample standard deviation of 2, whereas the “TGEX” curve (light blue) could have a complexity score of anywhere between 20 and 31, with a mean and standard deviation of 25 ± 2. One may note that the spread in both “CJOC” and “TGEX” scores spread over each other and the other two “Top 4” exercises, but neither overlaps the “Bottom 4” exercises (CARRIBE, NANOOK, FISHPAT, GLD).
The average activity-to-exercise score (with standard deviation) is summarized in Table 1, all values being rounded to the nearest integer. For the “Total” column, the average and standard deviation are derived from the distributions displayed in Figure 1, with the final values being rounded to the nearest integer.
Figure 1: Statistical Summary of SME Assessments Taking the “Total” averages found in Table 1 and multiplying them by the number of sea days for the
corresponding exercise category in each fiscal year and adding those numbers, we calculate the total number of “complex sea days” per year, as shown in Figure 2, both in absolute scale (0 to 12,384

P a g e | 9
complex sea days) and relative to the maximum (FY 08-09 values). The error bars represent the variability carried through using the standard deviations found in Table 1.
Table 1: Mean Scores between SME Assessments (including standard deviation)
ASW ASuW AAW FP MIO Air Det Seaman-ship
ISE / Multi-ship
Total
Joint Warrior 5 ± 0 5 ± 0 5 ± 0 2 ± 1 2 ± 1 1 ± 0 4 ± 1 5 28 ± 1
TGEX 4 ± 1 5 ± 1 4 ± 1 2 ± 1 2 ± 1 1 ± 1 3 ± 1 4 25 ± 2
GLD 1 ± 1 1 ± 1 1 ± 1 3 ± 1 1 ± 1 0 ± 0 3 ± 2 1 9 ± 2
NANOOK 1 ± 0 1 ± 0 1 ± 0 1 ± 1 1 ± 1 0 ± 0 2 ± 2 1 8 ± 2
CARIBBE 1 ± 1 1 ± 0 1 ± 0 3 ± 1 3 ± 1 0 ± 0 2 ± 1 2 13 ± 1
FISHPAT 1 ± 0 1 ± 0 1 ± 0 1 ± 1 3 ± 1 0 ± 0 1 ± 0 1 9 ± 1
CJOC 2 ± 1 3 ± 1 3 ± 1 4 ± 1 5 ± 1 1 ± 0 4 ± 1 2 23 ± 2
WUPS 4 ± 1 4 ± 1 4 ± 1 3 ± 1 3 ± 1 1 ± 0 5 ± 1 4 27 ± 2
Figure 2: Complex Sea Day Trend The alternative method proposed above can then be compared to the first. Breaking the categorical
exercises into the “Top 4” and “Bottom 4” and looking simply at the number of sea days falling into the “Top 4” per year, we arrive at the plot in Figure 3. Here we see an analogous trend line as that found in Figure 2. Because the total number of sea days varies from year to year, much of the trend for the “Top 4” can be explained by the overall yearly variability. To better show this effect, Figure 4 normalizes each fiscal year’s data to that year’s total sea days; as a result, it is easy to see what percentage of each year’s total sea days is consumed by each of the exercise categories. By normalizing to total sea days per year,
67%
80% 78% 76%
90%
100%
92%
45%
77% 77%8325
9862 9705 9428
11116
12384
11336
5569
9541 9588
0
2000
4000
6000
8000
10000
12000
0.0%
10.0%
20.0%
30.0%
40.0%
50.0%
60.0%
70.0%
80.0%
90.0%
100.0%
FY 03-04 FY 04-05 FY 05-06 FY 06-07 FY 07-08 FY 08-09 FY 09-10 FY 10-11 FY 11-12 FY 12-13
Com
plex
Sea
Day
s
Rela
tive
Tren
d of
'Com
plex
Sea
Day
s'

P a g e | 10
one loses the total sea days per year information, and so we include it in Figure 4 as a fraction of the sea days consumed in FY 08-09 (829 days, the maximum over the 10 year span).
Figure 3: Sea Days per Exercise, with "Top 4" Trend
Figure 4: Relative Sea Days per Exercise, with "Top 4" Trend and Relative Sea Day Trend Finally, Figure 5 presents the total sea days, “complex sea days” and “Top 4” sea days, all normalized
to FY 08-09 values in order to compare the trend lines. Note that the “complex sea days” is reproduced from Figure 2, the “Top 4” sea day trend is the one found in Figure 3, whereas the “sea days” trend can be found in Figure 4. The “Top 4” sea day trend and the “complex sea day” trend have nearly the same characteristics.
44%49%
52%
45%
54%57%
59%
34%
47%
53%
0.0%
10.0%
20.0%
30.0%
40.0%
50.0%
60.0%
70.0%
80.0%
90.0%
100.0%
FY 03-04 FY 04-05 FY 05-06 FY 06-07 FY 07-08 FY 08-09 FY 09-10 FY 10-11 FY 11-12 FY 12-13
% o
f Se
a D
ays
ISE
GLD
FishPat
Nanook
Caribbe
CJOC
TGEX
WUPS
JW
Sea days /max

P a g e | 11
Figure 5: Trend comparison between scoring methods
4. 4 Summary of Preliminary Analysis The analysis above provided two closely related methods for making use of a SME-derived rating of
the complexity of “sea days.” While a weighted sum approach was initially proposed to put the final results on a common scale, the authors were able to show that a weight-free approach would lead to similar results, while pre-empting any concerns about manipulation or gaming of constants.
Although the weighted sum approach taken in Figure 2 depicts a measure that is easy to explain, the absolute numbers (e.g., 12,384 complex sea days) do not have any physical meaning, and can change dramatically in magnitude by choosing different SME scales (e.g., 0 to 100). On the other hand, the numbers in Figure 3 are straightforward in their interpretation; the sea days have physical meaning and the colour code clearly separates the categories into bins of “warfighting capability” vs “constabulary and presence.” Although the activities belonging to the second group are important from a Government of Canada point of view, those in the first group are a vital concern to a commander in order to ensure the CANFLTLANT is a trained and ready combat-capable force.
The trends depicted in Figures 2 and 3 indicate that the fleet’s “complex” days at sea are indeed comparable to those found 10 years ago, even though the total number of sea days per year are now fewer than before by about 100 for the fleet. There is a noticeable rise in complex sea days found from 2007-2010 and an interesting dip in 2010-2012, which occurs in a period where there was a decrease in deployed operations assigned by CJOC. However, the last few years have had complex sea days commensurate with that found in 2003-2006 timeframe, when RCN resources were being used intensively used for OP APOLLO.
To further explore the concept of sea day complexity, the authors are pursuing data that may allow the weighting of a sea day based on a measure (or measures) of intensity in terms of objective parameters, as will be discussed further below.
5. Summary and Future Work “If you want to inspire confidence give plenty of statistics – it does not matter that they should be accurate, or even intelligible, so long as there is enough of them.” – C.L. Dodgson [28].
The measures identified by the authors for further investigation can be broadly divided into two categories: those that were discovered during the literature review and showed promise, and those they

P a g e | 12
have conjectured may be practical based on the data actually available in the Canadian fleet and which are appropriate to that context. Looking at the past work in the USN context, Tatum’s SEM model published in 2002 looks to have promise, but it must be acknowledged that the Canadian fleet may simply not be big enough to meet the statistical validity requirements [5]. One brief but intriguing comment is made in the paper about the effect of pulling crew from other ships; a surprising relationship was found between low skill levels on ships and low manning, which Tatum speculated could be a result of getting ships ready for deployment by moving skilled personnel onto ships with the highest manning levels. Anecdotal evidence indicates something similar may happen in the RCN context. Unfortunately when the authors contacted Tatum, he indicated that he performed no further work on this topic.
An older thesis based on two USN readiness models – apparently either older than or parallel to SORTS – found that although many non-significant variables existed in both models, and performance of each model was poor at the ship level, the overall performance was reasonable at the fleet level [29]. This provides some hope that if a sufficient number of indicators are analyzed, there is the possibility that some can be identified that work well – at least in aggregate. Again, the small size of the RCN fleet would be a concern in this context.
Given the amount of discussion on the possible deficiencies of SORTS, it is not surprising that the US is working on a new and potentially more comprehensive tool: the Department of Defense Readiness Reporting System (DRRS) [21]. The DRRS provides assessments of each unit’s ability to accomplish mission essential tasks, coupled with the conditions in which those tasks are expected to be executed. Some concerns have been raised about the subjective judgements on which the mission assessments are based [20] [30], and one author has suggested its indicators need to be tracked to see whether they are leading, lagging or coincident with actual performance when units are called upon [30]. Its potential may not yet be fully realized, with a CBO working paper noting that “DoD’s current plans call for DRRS to be fully implemented by 2014. At present, very little of the improved readiness information contained in DRRS is carried over to the Quarterly Readiness Report to Congress—a report that Congressional oversight committees rely on to assess the readiness of U.S. armed forces” [20]. However, the same CBO paper also notes that the USN’s version of DRRS has been extended to include additional resources – including for shore facilities – and to further break out mission areas, making it a potentially rich source of inspiration.
Finally, we come to those indicators which the authors have conjectured may be of some use, in particular to reduce the reliance on SME judgements of task complexity. When consulted, Defence Research and Development Canada’s (DRDC) Naval human factors experts were able to direct the authors to a hierarchical goals analysis that had been conducted on key staff in the Halifax-class frigate’s operations room [31]. This analysis confirmed the authors’ suspicions that a complete human factors study down to the individual operators would likely be impractical for the intended purpose – it represents a significant amount of work, and only considered twelve operators on one type of ship in a single (albeit composite) scenario. However, it does provide a guide to what is possible given requisite time and funding. Follow-on discussions were had with respect to simpler proxies that would help measure operator workload, which itself is a proxy for complexity. As a result of this discussion, indicators the authors are considering include: the number of operators involved in a given task; the number of interaction links between operators; the number of interaction links per person; and the amount of message traffic in-between ships. Once these are in place, the links between these indicators and the combat readiness requirements can be assessed, with the hopes of expressing a more granular, risk-based notion of naval readiness. This could include a more detailed representation of whether or not a ship is ready for a given mission, depending on its readiness in specific warfare areas.
Given progress in these areas, more ambitious projects could be tackled. What has not been successfully addressed so far as part of this study is determining how long a ship can or should maintain

P a g e | 13
a level of readiness once achieved – the attempt to consider this issue by examining change in significant incident (i.e. injury) rates unfortunately led to spurious results. Given the knock-on effects this would have on scheduling of deployments, it would likely need to involve operational research staff supporting Naval Staff Headquarters as well, not to mention a wider base of SMEs. There may also be further opportunities to collaborate and compare approaches with nations of similar size, as it does not appear that there are as yet clear approaches in at least the publicly available literature.
6. List of symbols and abbreviations AAW Anti-Air Warfare ASuW Anti-Surface Warfare ASW Anti-Submarine Warfare CAF Canadian Armed Forces CBO Congressional Budget Office (US) CJOC Canadian Joint Operations Command CNA Center for Naval Analyses COMCANFLTLANT Commander Canadian Fleet Atlantic CRR Combat Readiness Requirement DND Department of National Defence DoD Department of Defence (US) DRDC Defence Research and Development Canada FISHPAT Fisheries Patrol FP Force Protection GAO Government Accountability Office (US) GLD Great Lakes Deployment GSORTS Global SORTS HMCS Her Majesty’s Canadian Ship ISE Independent Ship Exercises JW Joint Warrior MARLANT Maritime Forces Atlantic MIO Maritime Interdiction Operations N02OR N02 Operational Research (MARLANT) OPSKED Operational Schedule RCN Royal Canadian Navy SEM Structural Equation Modelling SME Subject Matter Expert SORTS Status of Resources and Training System TGEX Task Group Exercise USN United States Navy WUPS Work-ups
Bibliography [1] L. Carroll, Through the Looking-Glass, and What Alice Found There, London: Macmillan,
1871. [2] A. P. Billyard, M. R. MacLeod, A. Turnbull, R. Drugget and A. Butler, "A trend analysis of sea
P a g e | 14
day measures," DRDC-RDDC-2014-L61, Defence Research and Development Canada, Halifax, NS, 2014.
[3] Maritime Forces Atlantic N5, "CFCD 129 - Readiness and Sustainment," Royal Canadian Navy, Halifax, NS, 2009.
[4] ACOS Operational Readiness (N5), "CFCD 102(L) Royal Canadian Navy: Combat Readiness / Training Requirement," Halifax, NS, 2014.
[5] Public Works and Government Services Canada, "National Shipbuilding Procurement Strategy (NSPS)," 6 June 2014. [Online]. Available: http://www.tpsgc-pwgsc.gc.ca/app-acq/sam-mps/snacn-nsps-eng.html. [Accessed 30 June 2014].
[6] National Defence and the Canadian Armed Forces, "Halifax-class Modernization / Frigate Life Extension," 25 July 2013. [Online]. Available: http://www.forces.gc.ca/en/business-equipment/halifax-frigate.page. [Accessed 30 June 2014].
[7] J. M. Flaherty, "Budget 2011: Annex 1: Responsible Spending," 6 June 2011. [Online]. Available: http://www.budget.gc.ca/2011/plan/anx1-eng.html. [Accessed 30 June 2014].
[8] Department of National Defence, "Reports on Plans and Priorities 2013-2014: Section II: Analysis of Programs by Strategic Outcome," 14 March 2014. [Online]. Available: http://www.forces.gc.ca/en/about-reports-pubs-report-plan-priorities/2013-other-section-ii-analysis-programs-strategic-outcome.page. [Accessed 30 June 2014].
[9] National Defence and the Canadian Armed Forces, "Defence Renewal Overview," 7 October 2013. [Online]. Available: http://www.forces.gc.ca/en/about/defence-renewal.page. [Accessed 30 June 2014].
[10] S. Fellman, "VCNO: Optimal manning is over," Navy Times, 11 January 2011. [11] United States Government Accountability Office, "Military Readiness: Navy Needs to
Assess Risks to Its Strategy to Improve Ship Readiness," September 2012. [Online]. Available: http://www.gao.gov/assets/650/648682.pdf. [Accessed 30 June 2014].
[12] P. Ewing, "U.S. Navy's Lean Manning Backlash," DefenseNews, 21 June 2010. [Online]. Available: http://www.defensenews.com/article/20100621/DEFFEAT04/6210307/U-S-Navy-s-Lean-Manning-Backlash. [Accessed 30 June 2014].
[13] United States Government Accountability Office, "Military Readiness; Navy Needs to Reassess Its Metrics and Assumptions for Ship Crewing Requirements and Training," June 2010. [Online]. Available: http://www.gao.gov/assets/310/305282.pdf. [Accessed 30 June 2014].
[14] D. Blakeley, "Rare crew exchange for HMCS Toronto in the Arabian Sea," Crowsnest, 4 November 2013.
[15] R. O'Rourke, "Navy Ship Deployments: New Approaches -- Background and Issues for Congress," Congressional Research Service, Washington, 2005.
[16] United States Government Accountability Office, "Force Structure: Ship Rotational Crewing Initiatives Would Benefit from Top-Level Leadership, Navy-wide Guidance, Comprehensive Analysis, and Improved Lessons-Learned Sharing," May 2008. [Online]. Available: http://www.gao.gov/assets/280/275902.pdf. [Accessed 30 June 2014].
[17] United States Government Accountability Office, "Force Structure: Navy Needs to Fully Evaluate Options and Provide Standard Guidance for Implementing Surface Ship Rotational Crewing," November 2004. [Online]. Available: http://www.gao.gov/assets/250/244711.pdf. [Accessed 30 June 2014].

P a g e | 15
[18] J. Schonberg, "Sea Swap Redux," US Naval Institute Proceedings, vol. 139, no. 1, p. 28, 2013.
[19] L. Carroll, Alice's Adventures in Wonderland, London: Macmillan, 1865. [20] R. D. Trunkey, "Implications of the Department of Defense Readiness Reporting System,"
Working Paper 2013-03, Congressional Budget Office, Washington, DC, 2013. [21] Chairman of the Joint Chiefs of Staff, "CJCS Guide to the Chairman's Readiness System," 10
November 2010. [Online]. Available: http://www.dtic.mil/cjcs_directives/cdata/unlimit/g3401.pdf. [Accessed 24 June 2014].
[22] Congressional Budget Office, "Trends in selected indicators of military readiness, 1980 through 1993," Washington, DC, 1994.
[23] L. J. Junor and J. S. Oi, "A New Approach to Modeling Ship Readiness, CRM 95-239," Center for Naval Analyses, Alexandria, VA, 1996.
[24] C. B. Tatum, "A Structural Equation Modeling Analysis of Naval Readiness," Military Operations Research, vol. 7, no. 3, pp. 5-15, 2002.
[25] H. L. Golding and S. C. McArver, "Navy Sea Pay: History and Recent Initiatives," Center for Naval Analyses, Alexandria, VA, 2001.
[26] Maritime Command, "Sea Training Guide," Sea Training (Pacific), Esquimalt, 2005. [27] B. Kaluzny and R. D. Shaw, "Sensitivity analysis of additive weighted scoring methods: how
to fool your friends (again)," DRDC CORA TR 2009-002, Ottawa, ON, 2009. [28] C. L. Dodgson, Three Years in a Curatorship by One Whom It Has Tried, 1886. [29] B. S. Pennypacker, "A Comparison and Validation of Two Surface Ship Readiness Models,"
Naval Postgraduate School, Monterey, CA, 1994. [30] J. T. Dewey, "Defense Readiness Reporting System: A Better Way to Measure Readiness?,"
U.S. Army War College, Carlisle Barracks, PA, 2007. [31] C. Coates and B. Kobierski, "Human Factors Analyses of Operator Positions in the
Operations Room of the HALIFAX Class Frigate, DRDC Toronto CR 2006-117," CMC Electronics Inc., Ottawa, ON, 2006.