In Re: Netflix, Inc. Securities Litigation 04-CV-2978...
21
EXHIBI T A
Transcript of In Re: Netflix, Inc. Securities Litigation 04-CV-2978...

EXHIBITA

Net Net, Flix By Mail Has Arrive d
e' S EPS tero6orma Dl)uted )
=-FY Eud: Dec EPS P!E2000 (33 99) n .m .
2001 (2 .341 n .m .
2002 (0.04) n. in .2003E 0 .18 88 . '
2004E 0 .50 32 .7
• Business . Netflix sells DVD rental-bv-mailsubscriptions . facilitated by online title selection
and an efficient inventory management system .
• Estimates . We believe Netflix can double itsfree cash flow in 2003 . Our proforma EPSprojection is SO . 18 in FY03 and 50 .50 in FY04 .
- .~ Revenges S ull]_ !
=-F1~ ESnd `Der ev ?Rev MuI2000 35 .9 10 . 1
2001 75 .9 4 . 82002 152 .8 2 . 4
2003E 249 .7 1 4
2004E 337 .9 1 . 1
Price . Date 314/03 S16 .2 552-Week Ranee $4 .85 - $22 .3 3
Norm . 3-Yr . EPS Growth 40%Market Cap (S mil .) 361 . 1
Diluted Shares (mil.) 22 . 2Fl oat (mil .) 18 . 9
~, . .Capttalizadon Dan z
Debt (S mil .) 0 . 0Equity (S mil .) 103 . 6
Debt/Equity 0 .0 %Tantdble Book ValuetShare $4 .0 2
Cash.'Share $4 .6 6Daily Volume (10-day avg) 751 .20 8
S&P 500 874 . 3
V d.r.~~ ~ Cb~•
jaM N0 1Z
fY__ AL Ifx.ooo..oe ss
i3NMY A~t $12
1 Ao0.M0 N
{
SM,ooo N
0 f0
8 A 8 pti ,oM1 p~ ,A C~ 10, h'
.46
• D rivers . Continued growth of DVD hardwaresales and DVD software rentals is the primarydriver, as well as Netflix's ability to offer one-day delivery to a majority of customers .
• Limite rs. Increased competition from Wal-mart .com and Blockbuster, as well as any majorchange in studio revenue-sharing terms, couldslow growth .
• Conclusion . Our valuation discounts five years'adjusted free cash flow at a 20% cost of capitaland a 6x terminal multiple .
We a re initiating coverage with a BUY ratingand a 12-month price target of $20 per share .
Investors should assume that Roth Capital Partners. LLC
("RCP") expects to receive or intends to seek compensation
for investment banking or other business relationships withthe covered companies mentioned in this report in the next
three months.
Rich Ingrassia
949-720-716 1
ringrassia roihcp.com
Please refer to important disclosure information on the last page of this report .

NETFLI X
SUMMARY
We are initiating coverage of Netflix (Nasdaq : NFLX -$16 .25) with a BUY rating and a 12-month price targetof S20 per share .
Netflix re nts DV"Ds, but has no sto re s . Subscriberspay a monthly fee to rent up to three DVDs at a timefor as long as they want, with no late penalties, byselecting titles in their Netflix .com "Rental Queue" .When a customer returns a DVD using Netflix'spostage-paid mailer, the next DVD in the queue isautomatically shipped by first-class mail and arrives assoon as the next day .
Netflix invented this unique home video channeland in 2002 p roved it could be p ro fitable . Thoughthe Company faces potentially strong competition fromWalmart .com and Blockbuster , we believemanagement directs operations well and has the rightstrategy for growth.
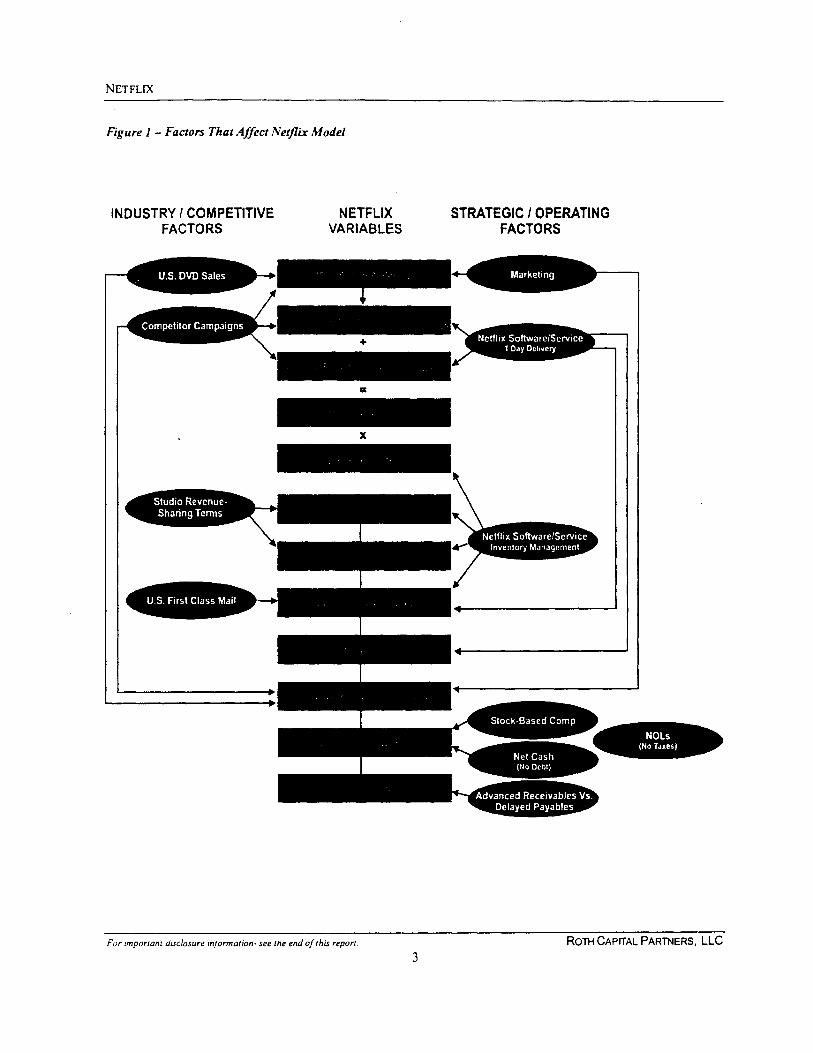
In this report we consider all external factors (Industry& Competitive) and internal factors (Strategy &Operations) that spur and/or limit key drivers inNetflix's business . We summarize them in Figure 1 onpage 3 .
Our research and assumptions on these variablescombine to produce our financial projection for Netflixin 2003 and 2004 . We believe Netflix will generateS0 .18 proforma EPS in FY03 . More significantly, webelieve the Company can more than double free cashflow (FCF) this year and next .
Our price target is based on five years' discounted FCF- adjusted for stock-based compensation - at a 20%required rate of return . The projections summarized in
the table below are generally in line with managementguidance and slightly more optimistic than consensusanalyst estimates .
Figure 2 - Netfix Fundamentals , 2001-2004
FY01 FY02 FY03E FY04 E
Rn enues (SM) 75 .9 152.8 249.7 337.9
Total Subxnbcn (000) 456 857 1 .322 1 .64 2
P,d Sabsaiba Growth (•.) 37% 99% 555. 26•x.
A,g . Monthly Chum (:) .6.8% -6 .9% .6.9'.16 b.8%
Subscriber ACquaouon Cost (S) 40.29 31 .24 34 .11 37 .2 8
Fulfillment Ex pense' . of R e, P1.) 17.7% 12 .75. 12.8%
Othei Opem mg Eap erases (SM) 22. 4 216 29.6 01 .8
Non-Cuh Compensation (Sill) 37 99 13.9 14 0
Adjusted Free Cash Flow ISM) i 11 1, 6.0 13.1 34. 6
D iluted EPS (GAAP) (5) (2 741 it 1') (0 .431 004
Diluted EPS ) Profomsai ' (S) _,4) Mo0-4 0 .18 0 .50
In its sho rt public life, NFLX stock has seen somedramatic swings in value . Five months after a S17-per-share IPO, NFLX dropped to S5 .22, partly due tothe launch of Walmart .com's DVD-by-mail service inSeptember . NFLX shares recovered to the mid-teens by2002 year-end, thanks to the Company's continuedsubscriber growth in spite of the well-capitalized newcompetitor .
We expect NFLX shares to remain volatile . Risks anddownside catalysts include the following :
■ If sell-through DVD pricing drops by more than S Iper year ( from about S17 today) for the next 2-3years, or "disposable" DVDs become popular
• If the major motion picture studios materiallychange their revenue-sharing terms, or decide toalter the video window ' s primacy over PPV andother home ente rt ainment choices
• If Blockbuster significantly reduces the cost of itsFreedom Pass subscription, or decides to betterfund its FilmCaddy .com busines s
■ If Walmart .com cuts prices further in its DVDrental service, or another competitor such asAmazon .com enters the rental marke t
■ If the conversion rate of free-to-paid subscribersdrops to less than 70%
• If Netflix's theft and loss rate (currently 3% ofgross shipments) increases dramaticall y
■ If mail delivery experiences a slowdown, ashappened in late 2001 due to the anthrax scare
■ If non-option related insider selling becomes moresubstantial, especially by CEO Reed Hastings andoperations VP Thomas Dillon, who have soldsmall blocks since Nov . 2002 .
The risks above prompted us to be conservative in ourassumptions . However, we believe Netflix hasconsiderable upside potential as the dominant player inan increasingly profitable business . From currenttrading levels, we point out the following metrics andevents as signs Netflix is on target to meet Wall Streetestimates and upside catalysts for the stock :
• If Company-repo rted chum is less than 7% inQ1 :03 or for two consecutive quarters in FY0 3
• When Netflix announces openings of new regionalshipping center s
• Proforma EPS excludes non-cash conpensatnn and one - tine [ens .
For important disclosure in/ormation- see the end of this report . ROTH CAPITAL PARTNERS, LLC
NETFLIX
Figure 1 - Factors That Affect Netflix Model
INDUSTRY I COMPETITIVEFACTORS
NOLs{ N Tres )
NETFLIX STRATEGIC I OPERATINGVARIABLES FACTORS
For important disclosure information - see the end of this report . ROTH CAPITAL PARTNERS, LLC

NETFLI X
• If Walmart .com scales back its DVD rentalbusines s
• When CEA reports positive growth in DVDhardware sales, typically announced each month
■ When short sellers cover their position, which isnow close to IN the average daily volume .
We are initiating coverage with a BUY rating .
INDUSTRY & COMPETITIO N
The lightweight, inexpensively replicated DVI) is whatmade Netflix's rental -by-mail concept possible . Rapidgrowth of the DVD platform will continue, albeit at adecelerated pace, driving Netflix' s addressablecustomer base ever larger . Competition is expected toheat up in the online DVD rental business , while rentalretailers like Netflix continue to balance their successvs . formidable supplier leverage.
Rapid Growth of DVD Platform Is Levelin gDVD is the fastest-penetrating consumer electronicsproduct in history. Since its 1998 introduction, morethan 43M DVD players have been sold in the U .S .alone, penetrating one-third of all U .S . households in2002-not including DVD-equipped PCs . (See Figure3 . )
Figure 3 - U.S DVD Households (mil)
Obviously, the torrid pace of DVD growth cannotcontinue forever, but it is difficult to find a proxy forthe DVD adoption cu rv e , given the product'sunprecedented popularity with U.S. consumers .However, if one were to use penetration of VCR
players or basic cable as a model, it suggests adoptionwill level off at 6%-7% CAGR when DVDs reach 80%
penetration of TV HH. We expect this to occur in2006 .
Consensus industry estimates from Forrester, KaganWorld Media and others put U .S. DVD HH penetrationat close to 60M by year-end 2003 and 65M by 2004, a32% compound annual growth rate . That compares to a76% CAGR from 2000-2002, suggesting decelerationhas already begun .
DVD Rental : A Bigger S lice of the Home V ideo PieDVD rentals generated S2 .9B in 2002 retail sales, up107% from 2001, as rapid hardware growth drove thecontinued shift to DVD software . Total U.S . videorentals generated S8.2B in 2002 retail sales, down3 .1% from 2001, according to the Video SoftwareDealers Association . That means VHS rentals weredown 25% to S5 .3B, and that DVD went from zero to35% of the total rental market in just four years. Byyear-end 2004, consensus industry research suggestsDVD will account for S5 . 5B in sales or 651/0 of thetotal video market . (See Figure 4 . )
Figure 4 - U.S. Video Software Retail Rentals ($ mil)
199e
1999
2000 r>'.= - a c-.
2001 ra..+.
200
2 2003E
200IE r . . an.
$0 52000 04,000 06 .000 S8.000 010.000
1 O vHs UDVD
Source: CEA, RCP estimates
Though there seems to be no doubt that DVD willeventually be the only significant packaged-goodsvideo media, low DVD sell-through pricing createscompetition for the DVD rental business that did notexist in the VHS platform for 20 years . In recent years,aggressive pricing has driven DVD sell-through to itsstatus as the biggest single source (37%) of all filmedentertainment revenues . (Source : Roth Capital Partnersestimate from Kagan World Media data.) In addition, anumber of other broadcast-based home entertainmentchoices such as pay TV, pay-per-view (PPV) andvideo-on-demand (VOD) now compete with the "rentalchain" model .
For important disclosure information- see the end of this report ROTH CAPITAL PARTNERS, LLC
4
Source : CEA . RCP estimates

NETFLI X
Fortunately for Netflix - and Blockbuster and HBOand many other entertainment retailers - new mediaplatforms historically have NOT led to totalcannibalization of the platform that came before . Thatis, TV did not kill radio, cable TV did not killbroadcast -I1-, and home video did not wipe out thetheatrical release . Instead, the pie just grew bigger .
We think it's likely this trend will continue . DVDrental will always compete with sell-through, but webelieve both will grow rapidly over the next several
years . We anticipate little cannibalization from paychannels and VOD, as has been the case for severalyears, and especially since cable VOD now gravitatesmore toward TV content .
IP-based movie VOD such as Movielink (a JV betweenMGM, Paramount, Sony Pictures, Universal and
Warner Bros .) also poses a threat to the packaged-goods rental model . But we expect the impact from thischannel to be negligible until TV set m anufacturers orhome networkers make streaming practical to the
family room, not just the home office .
Of course, in any assessment of home entertainmentchoices the most important factor to consider is movierevenue "windows," as set by the major studios. Aslong as the top content creators continue to give post-theatrical primacy to home video over PPV, VOD andother release windows, Netflix, Blockbuster and othercompanies that peddle packaged media will berelatively secure . Given their overwhelming relianceon packaged video (and its higher margins) we thinkit's unlikely the studios will force widespread adoptionof new movie sales channels in the near future .
Netflix Still Best of the Online Rental B ree dBecause of their extra features - directorcommentaries, DVD-ROM games and the like - DVDsare uniquely suited to Netflix' s rent-as-long-as-you-want model . However, the main benefit of an onlinerental-by-mail service is in eliminating the time spentgoing to/from video stores . For that reason, we do notbelieve store-based subscription plans such asBlockbuster's Freedom Pass (in its current form)present a significant threat to Netflix .
That being said, the convenience and omnipresence ofvideo rental chains such as Blockbuster and HollywoodVideo present a major challenge for Netflix. Bydefinition, the corner video store offers immediate
"fulfillment," and thanks to revenue sharing, moststores offer a fairly deep selection of titles , especiallypopular new releases .
Netflix subscribers pay $19 .95 per month to rent threeDVDs at a time, plus a use tax of up to 51 .55 per
month, all credit-card billed in advance . Differentservice levels are offered (e .g . two DVDs at a time forS13.95) but the 3-disk program is by far the mostpopular .
Each subscriber goes to Netflix .com to search andselect the titles he/she wishes to rent, often assisted byNetflix's CineMatch rating and recommendationfunction . Desired rentals are prioritized in an individual"Rental Queue." Customers then receive their DVDsby first-class mail ; postage is included in the monthly
fee. The packaging doubles as a postage-paid returnmailer; when a subscriber returns a DVD, the next onein his/her Rental Queue is shipped .
A subscriber can keep a DVD for as long as he/shewants, and no late fee is billed . However, if asubscriber wants to maximize the financial benefit ofthe service vis-a-vis the traditional storefront service,it's obviously in his/her interest to return DVDs
promptly. If a DVD is lost in the mail, subscribersinform the Company via web mail and a replacementDVD (or the next title in the Queue) is shipped .
Walmart . com the Most Se rious Competitive Th reatNetflix owns the web-based DVD rental subscriptionbusiness, with more than 90% market share . However,the competitive landscape became significantly morecomplex in mid-2002 when Wal-Mart .com launched its
online rental -by-mail service .
We tested or took trial subscriptions to Walmart .com
and other rival online rental services, and remainconvinced of the Netflix's edge in ease of use andfunctionality . (See Figure 5 .) Broad one-day fulfillmentcapability is a major competitive advantage for Netflixtoday, none of its peers can provide this level ofservice on as wide a scale . In our opinion, Netflix isalso superior in title selection and search software . Inpublic comments, even Blockbuster CEO John Antiocodubbed Netflix the likely winner vs . Walmart .com.
For important disclosure information - see the end of th is report . ROTH CAPITAL PARTNERS, LLC

NETFLIX
Figure 5 - Product Comparison : Online DVD Rentalresult we believe the Company may occasionally besubjected to a "supplier squeeze . "
Service DYDs I Rates Delive ry Return sTim e
Netflit 3 S1995,month 1-4 days No shrpmg/ Latefees
Wslmart . com 3 S18 .86, month 2-5 days No shippmgilatefees
FilmCaddv . com 4 S19 .95 .!month 2-3 days No s hipping/ Wefees
Qnik Fliks .com 2 to 12 515 .99 to 3 .7 days No shWpmgrlace55799~mon[h fees
DVDovernight.com I $3 - S4 per 2-4 days Within 7 days - noDAD for 7 days return shipping fee
RentMyDVD. com Unlimited $3 .50 per DVD 2-3 days Within 9 days -for 9 days S1 .50 ship pin g fe e
per d is c , $0.50 fo radditional disc .S3 .50'disc late fee
2 to 10 S13 .95 to 3-4 days No ship pmg;lat e549 .95/month fees
Source: Company data and Roth Capital Partners research .
Despite its well-capitalized parentage, Walmart .com'sDVD Rentals service has yet to gain traction, as recentestimates put subscribers at less than 25,000 . In ouropinion, the reason is almost certainly delivery time,which reportedly averages 3 days . (The company justopened a new DVD distribution center in Brisbane, CAto reduce delivery time in the L .A. area.) It is alsogenerally believed Wal-Mart doesn't want tocannibalize its store-based sell-through business, whichthe discounter uses as a loss leader to drive traffic intostores . Nevertheless, Wal-Mart is a formidable foe foranyone's retail operation, and their market entry heremust be considered an ongoing threat .
Studios' Content Leverage Strong As Eve rOn one hand, Netflix's business exists today becausethe Company was able to strike some of the industry'sfirst revenue-sharing deals with the major studios(Disney, Fox, MGM, Universal, Sony and Warner) . Inaddition to a shared stake in growing the onlinesubscriber base, the studios were also given preferredconvertible stock for approximately 6% of theCompany. Netflix obviously knew its Hollywoodhistory that many intelligent and potentially profitablenew media channels have died on the vine withoutvigorous major studio support . (Divx, anyone? )
Yet no matter how vested the content creators are inNetflix's business, one fact remains : These distributorscontrol 70%-80% of U.S . film and TV programmingand therefore possess an extraordinary amount ofleverage in pricing and availability.
DVD acquisition is Netflix 's largest single cost center,and revenue-sharing agreements can have a term of upto 5 years, but many are as short as 12 months . As a
STRATEGY & OPERATIONS
Netflix's headquarters is in Los Gatos . CA_ TheCompany employed 381 people at year-end 2002 . andmorale seems very high at this dot-com survivor .
One-Day Fulfillment Is the Number-One PriorityNetflix has had tremendous success in its home market,the San Francisco Bay Area, where 3 .810 of totalhouseholds are subscribers . That compares to less than1% of households nationwide . Management believesthat their success in the Bay Area is mostly due to thefact that subscribers have enjoyed one-day deliverythere since inception, a service level made possible bythe proximity of Netflix's main distribution center inSan Jose. (Oneday delivery means one day to return aDVD and one day to deliver the next DVD in thequeue, and therefore total turnaround time of twodays . )
Consequently, Netflix opened 12 regional shippingcenters in 2002 in the following markets : Duluth(Atlanta), Worcester ( Boston), Dallas , Denver, Detroit,Houston, Santa Ana (Los Angeles), Minneapolis,Flushing (New York), Stamford, Tacoma ( Seattle) andWashington, D .C. The Company reported that in Dec .2002, 36% of all subscribers were reachable in oneday .
The Comnanv plans to open an additi onal 10-1 5shipping centers in 2003, or about I per month . InFebruary 2003, Netflix opened new hubs in Newark .Philadelphia and Phoenix . At this pace the Companywill have more than 25 regional hubs by year-end and,management says, able to reach 70% of its subscribersin one day .
For important disclosure information- see the end of this report. ROTH CAPITAL PARTNERS, LLC
NETFLI X
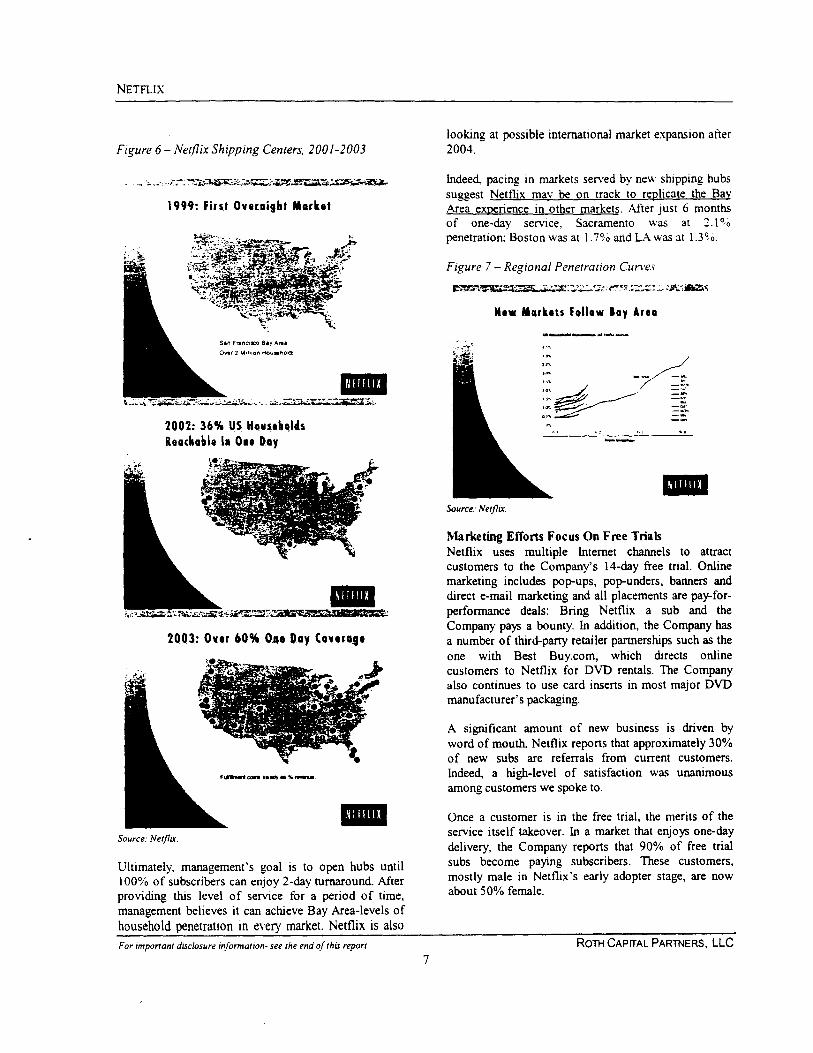
Figure 6 - Netf1ix Shipping Centers, 2001-2003looking at possible international market expansion after2004 .
1999: First Overnight Marke t
San F. Ln 8"Ana
0-I Million nousno ~
Source : Netjlix .
Indeed, pacing in markets serv ed by new shipping hubssuggest Netflix may be on track to replicate the BayArea experience in other markets . After just 6 monthsof one-day se rvice, Sacramento was at 2.1%penetration; Boston was at 1 .7°/o and LA was at 1 .3 ° o .
Figure 7 - Regional Penetration Curves
Kew Markets Follow Bay Are a
Source: Netfliz.
Marketing Efforts Focus On Free Trial sNetflix uses multiple Internet channels to attractcustomers to the Company's 14-day free trial . Onlinemarketing includes pop-ups, pop-unders, banners anddirect e-mail marketing and all placements are pay-for-performance deals: Bring Netflix a sub and theCompany pays a bounty . In addition, the Company hasa number of third-party retailer partnerships such as theone with Best Buy.com, which directs onlinecustomers to Netflix for DVD rentals . The Companyalso continues to use card inserts in most major DVDmanufacturer's packaging.
A significant amount of new business is driven byword of mouth . Netflix reports that approximately 30%of new subs are referrals from current customers .Indeed, a high-level of satisfaction was unanimousamong customers we spoke to .
Once a customer is in the free trial, the merits of theservice itself takeover . In a market that enjoys one-day
delivery, the Company repo rts that 90% of free tria l
Ultimately, m anagement 's goal is to open hubs until subs become paying subscribers . These customers,
100% of subscribers can enjoy 2-day turnaround. After mostly male in Netflix 's early adopter stage , are now
providing this level of se rvice for a period of time , about 50% female.
management believes it can achieve Bay Area-levels ofhousehold penetration in eve ry market . Netflix is also
For import ant disclosure information - see the end of this report . ROTH CAPrrAL PARTNERS, LLC
2002: 36% US. HouseholdsReachable IN 0cc Da y
2003: Over 60% One Day Coverage

NETFLIX
Integrated Systems Tie Demand to Supply ChainNetflix's proprietary search software (CineMatch)allows subscribers to find movies that suit their tastes .The system doubles as an effective inventorymanagement tool by directing customers toward backcatalog titles and away from the newest new releases,for which demand is often highest and wait times mostlikely.
Historically, 70%-80% of a video chain' s rentals are innew releases and 20%-301/o in catalog titles. The
opposite is true at Netflix, thanks to CineMatch . Thisgives the Company a significant financial advantage,
because revenue sharing makes older titles moreprofitable than new releases . (The distributor' s take onthe latter gets booked in the first 12 months of release . )
From the subscriber's perspective , Netflix adds valueto the home video rental experience by making itscatalog of 14,500 DVD titles ( easily 4x-5x more thaneven the biggest video store) readily searchable andmatched to personal viewing preferences .
Most importantly, the title selection softw are tiesdirectly to the inventory and distribution managementsystem. Bar codes scanned at the shipping hubsidentify the location of every DVD in the supply chain .Demand is determined by subscriber Rental Queueselections , and the software automates fulfillment tomove the proper number of DVDs to the regional hubs .
Management Knows Retail, Softwa re ,Entertainment and the Inte rn e tManagement combines a thorough understanding ofthe home video industry with experience in onlinesales and marketing, enabling them to anticipate and
respond successfully to industry dynamics andcompetition.
Particularly impressive is the IT background of TomDillon, operations VP, who oversees the increasinglyefficient integration of Netflix's online customerinterface and the supply chain systems describedabove .
It is also apparent that this team knows exactly howand why their unique business model works. Inconversations with Reed Hastings in early 2000 - priorto an IPO that would later be withdrawn - the CEOidentified net income break-even at what sounded likean arbitrary one million subscribers . (At the time, theCompany had less than 200,000 subscribers.) Threeyears and one massive dot-com meltdown later,
Hastings' words have been vindicated almost to thesub .
Reed Hasting sChief Executive Officer and Cofounder, 1997-present
Reed Hastings founded Pure Software in 1991 afterinventing the company s initial product, Purify . AsCEO, he led Pure Software to a 1995 IPO, completedseveral acquisitions and made it one of the 50 largestpublic software companies in the world. After Purewas sold to Rational Software in 1997, Hastingsfounded NetFlix in the fall of that year .
Barry McCa rth yChief Financial Officer, 1999-presen t
Prior to joining Netflix, Barry was Senior VicePresident and Chief Financial Officer of Music Choice,a music programming service distributed over directbroadcast satellite and cable systems. From 1983 to1990, Barry worked with venture capital-backed andLBO investments at Credit Suisse First Boston .
Tom DillonVice President of Operations, 1999-presen t
Tom Dillon is responsible for fulfillment, customerservice, IT development and IT operations at NetFlix .From 1998 to 1999, Dillon was CIO at CandescentTechnologies Corp., a manufacturer of flat paneldisplays . For nine years prior to that, he was CIO ofSeagate Technology, responsible for IT functions in 30factories worldwide . From 1984 to 1987, Tom servedas Senior Director of Manufacturing for IBMsubsidiary Rolm, and from 1980 to 1984 he was VicePresident of Manufacturing for Memorex .
Leslie KilgoreVice President of Marketing, 2000-presen t
Leslie Kilgore is responsible for br and strategy,customer acquisition, advertising and PR at Netflix .Prior to joining NetFlix, Kilgore was MarketingDirector at Amazon . com. For seven years prior to that,Kilgore was a Brand Manager for Procter & Gamble .
For important disclosure information- see the end oft/Ls report . ROTH CAPITAL PARTNERS, LLC

NETFLIX
FINANCIAL MODE L
Each new Netflix subscriber is profitable. At thecurrent 7% chum rate and subscriber acquisition costof S35-S36, it takes approximately 20K new customersto generate 50 .01 in annual earnings . Since we expectnearly 500K new paid subs in FY03, we estimate a 20-25 cent turnaround in EPS .
The external and internal factors described above, aswell as a number of other drivers, influence elementsof the Netflix financial model, as described below .
New Trial Subsc ription sIn 2002 Netflix more than doubled the number of newtrial subscriptions acquired, to more than 1 .1 M . Weestimate this figure will increase 42% to 1 .6M in 2003and increase 20% to almost 2M in 2004 . The actualresults will depend on the following factors :
• General growth of DVD hardware sale s• Growth of DVD rental as the preferred home
entertainment medium
■ Netflix's marketing expense commitment, and theeffectiveness of the campaigns
■ Competitor efforts to gain market share byunderpricing
Netflix's total addressable subscriber base is driven bythe number of U.S . DVD households, and theCompany aims to offer a 14-day free trial to every oneof them.
From 1998-2000, when most of Netflix's marketingcame in the form of card-in-the-box trials, Netflixsubscriber growth tracked with DVD hardware sales
growth. But Netflix sub growth began to lag the
industry in 2001, before the one-day-delivery-to-allstrategy was employed. Clearly, advertising inserts byDVD manufacturers had become a less effective
marketing tool .
With more than 1 million subscribers, Netflix hasestablished brand recognition in the space and has aformidable first-mover advantage . Nevertheless, theCompany will face continued threats fromWalmart .com, Blockbuster's FilmCaddy .com .
Another point relevant to new trial subscriber growth isthe status of the ackaged home video window itself .As discussed above under Industry & Competition, theprimacy of DVD rental among other home entrainmentchoices is crucial to the continued success of Netflix,Blockbuster or any of their competitors . When (if)packaged DVD rental growth flattens with respect toVOD, it would limit Netflix' s prospects . In such anenvironment, the current rate of subscriber growthcould be sustained by the Company's own "electronic"VOD offering .
Paid Conversion , Paid Retention and Chu rnNetflix reports subscriber churn as a function of newtrial subscribers ; we used the Company's reportedfigures to approximate the rate of free-to-paidconversion and retention rate of paid subscribers,which we feel are more useful metrics .
In 2002, reported subscriber churn was 6.9%, upslightly from 6 .8% in 2001 . By our estimates (seebelow), free to paid conversion was 84% in 2002, up11 points from 73% in 2001 ; and paid subscriberretention was 79%, down from 83% .
We estimate churn will be 6 .9% in 2003, as free-to-paid conversion falls slightly to 83% and paid subretention falls slightly to 78% . In 2004, we estimatethose metrics will be 6 .8%, 82% and 78%,respectively. The actual results will depend on thefollowing factors :
One-day delivery capability of Netflix and itscompetitor sContinued superiority of Netflix selection softwareGeneral economic and employment climate
In 2002, word of mouth became much more significantas a driver of new trials, as the opening of 12 shippinghubs extended one-day delivery to more than one-thirdof all subscribers . As a result, Netflix new trial subgrowth again outpaced DVD sales (88% to 66%,respectively) . We expect that trend to continue, but ourprojections call for that gap to shrink to single digitsthis year and next, a conservative assumption based onincreased competition and management's desire topreserve profitability by controlling marketingexpense .
Management reports that 90% of new trial subscribersbecome paid subscribers , but the Company does notformally provide a free-to-paid conversion rate . Ourproxy for this metric is I - ratio of free subs to newtrial subs acquired during the quarter .
Netflix also does not report paid subscriber retention,but a figure can be extrapolated using reported data andthe conversion proxy above . First, the free-to-paidconversion rate of 83% multiplied by total new trialsduring the quarter establishes the "optimum" numbe r
For important disclosure information - see the end of this report. ROTH CAPITAL PARTNERS, LLC

NETFLI X
of new paid subscribers in the quarter (i .e . at zerochum) . The difference between that number and theactual number of paid subs added during the quarterapproximates the number of paids that quit .
Simply put, that ' s because the benefit of onlineordering fades quickly when subscribers cannot replacethe past weekend 's DVDs with new ones before thecoming Friday.
Subscriber churn, as reported by the Company, tracksthe same dynamic but uses different data to do so . Theconcept is often misinterpreted so we thought it wouldbe useful to define it clearly here . The table belowprovides an example of the Company's calculation .
Figure 8 - Understanding Churn at Nef lixe .g .
Total subs (paid and free) at start of quarter 100Total free trial subs added during the quarter + 90Total subs (paid and free) at end of quarter - 15 0
"Churned" subs 40
Total subs (paid and free) at start of quarter 100Total free trial subs added during the quarter + 90
Total subs "in play " du ring the qua rter 190
Churned subs 40Total subs "in play" during the quarter / 19 0
Quarterly churn 21%
Monthly chum /3 7%
Source : Netflix company reports and Roth Capital Partners analysis.
Churn rate has been stable at close to 7% for the pas tfive quarters and appears "deeply demographic,"according to the Company. As evidence, managementsays chum in the San Francisco Bay Area, its bestmarket, is also close to 7% .
Churn varies seasonally and is generally higher in Q4,when 30% of the year's DVD hardware purchases aremade, and Q I when many holiday-related 14-day trialsexpire . Superficially, Netflix's churn rate appears high,but it is comparable to the early adoption phase ofother entertainment subscription services such as HBOand digital cable . We believe Netflix's efforts to bringone-day service to all of its U .S . subscribers (from 36%today) will reduce chum and drive growth.
Whether we are discussing Company-reported churn orour conversion and retention estimates, the superiorityof the Netflix product, esoecially the Comvanv' sability to provide one -day delivery to 60%-70% of itssubscribers by year-end 2003 , will drive subscribergrowth above all else .
Regarding other driversilimiters of paid conversion andpaid retention : Comparison shopping, as noted above,will likely limit the number of new trials Netflix canattract, but lower pricing at Walmart .com is bound tocost Netflix some paid subscribers as well . However ,we expect the impact to be minimal in all but the fewmarkets where Walmart .com. FilmCaddy. com andothers have established a one-day delivery capability.
Finally, the soft economy will be a non-specific limiterof paid conversions and paid retention, not just forNetflix but for any subscription service . Though home
video remains one of the cheapest forms of
ente rtainment , consumers are more likely to forgo or
cancel discretionary spending during periods of
economic uncertainty .
Total Subsc ri bersIn 2002 Netflix ended the year with 857,000 totalsubscribers , 796,000 paid and 61,000 free . On Feb . 27,2003 the Company announced it had reached I milliontotal subscribers , midpoint of management guidancefor Q1 :03 . We estimate that Netflix will have morethan 1 .3M subs by year-end 2003 and close to 1 .7Msubs at year-end 2004
Despite pacing in markets with new shipping hubs, wethink it's unlikely Netflix will achieve penetration oftotal U .S . households as high as the 3 .8% penetrationof the Company's home Bay Area market, which hassome obvious demographic advantages over othermajor U.S . markets . (Higher penetration of DVDhouseholds, for example .) Netflix's total U .S . HHpenetration is approximately 0 .8% today.
Consequently, we think penetration of U.S . DVDhouseholds is a better reality check for projectedNetflix subscriber growth . (A reasonable assumptionhere is that a DVD home is also an online home .) Inthe Bay Area, we estimate Netflix subs are in nearly8% of DVD HH. In the U.S ., Netflix's DVD HHpenetration is approximately 2 .0%. At year-end 2003,our estimates suggest Netflix will have 2 .1% U.S .DVD HH penetration. With 1 .7M subs in 2004, Netflixwould be at 2 .2% penetration. We believe these arevery conservative benchmarks .
For important disclosure information - see the end of this report . ROTH CAPITAL PARTNERS, LLC
10

NETFLI X
Monthly Subsc ription RateWe estimate that about one-quarter of Netflixsubscribers (including this analyst) are grandfatheredinto a 4-DVD per month plan or another of thedifferent service tiers the Company has tested in thepast 5 years . However, the majority of subs keep 3DVDs at a time and pay S 19 .95 per month - which isalmost exactly what the monthly revenue per averagepaid sub came to in Q4 :02 .
For all of 2002, monthly revenue per paid sub averagedS20.20 . We do not anticipate pricing changes in thenear future, so S20.20 is the figure we used to modelrevenues in 2003 and 2004 . The actual results willdepend on the following factors :
DVD Acquisition (COGS )New content is Netflix's largest cost at approximatelyS58M in 2002, about 75°ro of total COGS and 4300 ofrevenues . We estimate about half of that cost was inshipping and half in revenue- sharing "upfronts" paid todistributors . We believe this figure will nearly doublein 2003 to S 100M then increase to S 132M in 2004 .The actual results will depend on the following factors :
• Netflix's ability, through the CineMatch software .to manage demand for popular new title s
■ Any changes in revenue-sharing contracts withmajor video distributor s
• Competitor efforts to over pay to acceleratecontent acquisition and improve title selectio n
Competitor efforts to gain market share byunderpricingAny effort by Netflix to promote new service tiersAny significant change in broad -market in flation
It is very impo rtant to note here that subscribers paytheir monthly subscriber fees in advance , by credit cardas registered online . Because revenue-share costs aresettled under traditional video industry terms (at thequarter or annual close), Netflix generates significantnegative working capital needs. This cash flow - madepossible by beneficial timing of receivables andpayables - came to $7M in 2001 and $16M in 2002 .We normalized this figure to S 13M in 2003 and 2004,which could prove conse rvative .
RevenuesNetflix has more than doubled revenues in each of thepast two years, to S153M in 2002 from $76M in 2001and S36M in 2000 . Based on subscriber growth andthe monthly subscription rate estimates above, weproject 2003 revenues of S250M, and S338M in 2004 .
Revenues also include a small amount of used DVDsales - about S2M per year - that Netflix realizes inbulk sales to video resellers . The titles and volume ofDVDs sold is based on a periodic review of invento ryvs . anticipated future rental dem and.
Netflix's subscription-based model provides a highlyvisible top line , especially given the Company'srelatively stable churn and free-to-paid conversion rate,plus the fact that the Company controls the reach of itsnew trial offers and new trial hit ratio to new andexisting DVD owners .
To acquire new DVDs, Netflix either purchases thedisks outright or, on 8 out of 10 titles, strikes a"revenue sharing" agreement with the distributor . Inthe typical deal, Netflix pays a small upfront fee perdisk plus a share of revenues for the first 12 monthsafter release . Upfronts are amortized over anaccelerated basis of one year. Some deals require aprepayment of future revenue-share splits, which arerecorded as prepaid expenses on the balance sheet andexpensed as incurred. Other revenue-sharing splits areexpensed as incurred.
After the initial 12 months, Netflix can purchase thetitle or return it. The Company typically reservesenough copies to satisfy future demand then returns therest or sells them in bulk to DVD resellers . The DVDrelease schedule determines seasonality in COGS,which is weighted heaviest in Q2, when the previousyear's holiday movies typically hit the video window,and during the Q4 holiday season .
As described above, Netflix' s title selection softwarealso functions as an inventory management tool . Bydirecting customers to back-catalog titles, matched by
aprevious rental tastes , Netflix is able to tu rnremarkable 95%-97% of its entire DVD inventoryevery month. The system results in higher customersatisfaction and just as importantly, helps controlrevenue- share costs .
The "Big Six" distributors wield incredible power inthe video industry, so there is a risk that less beneficialrevenue-sharing terms could upset Netflix's economicmodel, in spite of the Company's strong supplierrelationships .
However, we believe a dramatic shift in revenue-shareterms is unlikely, for several reasons . First, revenu e
For important disclosure information- see the end of this report. ROTH CAPITAL PARTNERS, LLC

NETFLI X
sharing by definition gives the studios more of a vestedinterest in their retailers' success . Second, by being oneof the first to cut DVD revenue - sharing deals, Netflixwas able to become a leading rental retailer, and theCompany now has some clout of its own (especially asits order volume continues to climb ) . Last and perhapsmost impo rtant , the studios desperately want tointroduce more competition to the fold and moveBlockbuster into more DVD revenue sharing, and theNetflix story provides leverage in this regard .
Library Amortization (COGS )In 2002, amortization of costs on previously acquiredDVDs came to S17M, down 21% from 2001 . In 2003we estimate DVD amortization will increase to $28Mand S40M in 2004 .
Amortization of DVD library costs increases over timebecause in each subsequent quart er , Netflix purchasesmore total titles . In 2001 the prescribed amortizationschedule was accelerated from three years to one year,and the Company recorded a one-time adjustment tocatch up in Q 1 :01 .
Shipping Expense (COGS )Shipping expense to paid subscribers is recorded inCOGS ; shipping to free trial subscribers is recognizedin marketing expenses . Netflix does not break outshipping costs separately , but we estimate they werebetween S25M-$27M in 2002 or about one -third oftotal COGS . We estimate the ratio of shipping to totalCOGS will remain at 33% in 2003 and 2004 .
Netflix only ships by first-class U.S . mail ; its cost per
DVD is S0 .74 ($0.37 each way). The U . S . PostalService occasionally raises rates , but rarely ahead ofinflation. Any change in our cost expectations herewould be identified early.
The more significant risk - because it's harder topredict and quantify - is any threat to the reliabili ty andspeed of the U .S . mail . As the an thrax scare of late2001 made the U . S. painfully aware, large-scaledelivery disruptions should be assumed into anyprojection.
Gross Pro fi tIn addition to DVD acquisition , libra ry amo rtizationand shipping, total COGS includes intangiblesamo rt ization related to the studio equity- for-contentdeal . Total COGS was $78M in 2002 , yielding a grossmargin of 49°%o . In 2001, Netflix ' s gross margin was34%. Given our estimates and assumptions above, we
expect to see gross margins between 47%-18°b , on theconse rvative side of management guid ance .
Fulfillment ExpenseFulfillment expense is related to the operating of theCompany's 16 shipping centers . including the centraldistribution hub in San Jose, CA. In 2002 this expensewas S 19M or about 13% of revenues, down fromalmost 18% of revenues in 2001 when Netflixoperated only the San Jose distribution center) .
We believe there is further leverage in fulfillmentexpenses even as the Company expands to more than25 regional hubs this year; we estimate fulfillmentexpense at $32M in 2003 and $43M in 2004, or about12 .8% of revenues .
The regional hub expansion strategy (described abovein Strategy & Operations) is based on the assumptionthat within 50 miles of a hub, first-class U .S. mail isthe equivalent of overnight mail . Supporting thisassumption, and creating the fulfillment expenseleverage, is the increasing efficiency of Netflix's barcode-based supply chain software . Operations chiefTom Dillon has helped streamline not only theshipping facilities - each is about 5,000 square feet andcosts just $60K to set up - but also the staff required tooperate it . Total fulfillment staff was 267 at year-end2002 .
Subscriber Acquisition Cost (Marketing )Subscriber acquisition cost (SAC) is Netflix's secondlargest cost next to DVD acquisition . In 2002 theCompany spent $36M marketing new trialsubscriptions to old and new DVD owners, usingInternet advertising, third-party promotions and adinserts in DVD boxes . Per subscriber, that amountcomes to an average of $31 in 2002 . This year weexNct total marketing expense to increase to $54M, orapproximately $34 per new trial sub. In 2004 weproject $63M in marketing expense or about $37 pernew trial sub. Actual results will depend on thefollowing :
■ General growth of DVD hardware sale s• Growth of DVD rental as the preferred home
entertainment medium• Netflix's ability to maintain its product edge in
software, service and one-day delivery• Effectiveness and nature of Netflix marketing
campaign s• Competitor efforts to overspend on marketing to
gain share more rapidl y
For important disclosure information- see the end of this report . ROTH CAPITAL PARTNERS, LLC
12

NETFLI X
As DVD hardware penetration rates decelerate, eachmarginal new trial sub will be more difficult (and moreimportant ) to sell, driving up SAC . But Netflix's rapidmove to one -day delivery across most of the U.S . willhelp spur referral subs, which would exe rt a downwar dbias on SAC .
Non-Cash Compensatio nNearly IM options were repriced at S3 .00 in 2001 .Quarter to quarter, the rate of exchange and theexpensable portion is uncertain . In 200i non-cashcompensation came to $10M, and we allow thisexpense to increase to about S 14 .OM in 2003 and 2004 .
Regarding Netflix's decision on which marketingchannels to use (e .g . introducing TV ads) we aregenerally ambivalent, as long as the paid subconversion rate is not decreasing while cost perconverted sub increases, which has not happened inany quarter to date .
However, some pressure could be exerted on thoseratios by the efforts of competitors . Our allow ance forincreased SAC over the next two ye ars presumes agradually increasing competitiveness fromWalmart . com and the likelihood the parent companywill use its ample cash to fund DVD rental as the loss-leader for online sales. Today that cost would be assubstantial as it was for Netflix in 1998 - 1999, withSAC ranging from S 100-$200 .
Of course, one could argue that Netflix should spendthe marketing doll ars now, while its first-moveradvantage is still substantial, but we believe theCompany's emphasis on profitability is the rightpriority at this time .
Technology & Development ExpenseTechnology and development spending consists ofexpenses to update and improve the website , includingthe CineMatch software and systems infrastructure . In2002 that expense was almost $9M or 10% ofrevenues , down from S12M or 23% of revenues in2001 . We use management guid ance here to estimateT&D at $9 .5M this year and $12 .7M in 2004 . Theonly significant risk here would be the cost of softwareengineering, but it's a buyer ' s market for such talent inSilicon Valley. Netflix employed 64 T&D staff at year-end 2002 .
General & Administrative Expens eIn 2002 G&A was $6 .7M and we expect this expenseto remain relatively steady as a percent of revenuesover the next several years. A downward bias isexerted by Netflix's web-based software for customerhelp and supply-chain management. It has allowed theCompany to reduce its customer service staff from 80in 2000 to 50 in 2002 . Total full-time G&A staff atyear-end 2002 was 31, part-time and temporary staffwas 114 .
Being conservative , Netflix chooses to report non-cashcomp as a line item on the income statement, though itis not required to do so . In Q4 :02, twvo-thirds of thisexpense was fixed at S2 .1M (Q4 :02) . The balance wasvariable , based on stock price on the last day of thequarter, which obviously cannot be forecast .
Net Interest IncomeNetflix has zero debt, after taking a S l OM charge fornon-cash interest due to early repayment of notes inQ2 :02 . Going forward, we allow for zero interestexpense and only marginal interest income of about$300K per quarter .
TaxesNetflix pays no income tax because it has yet to postany pre-tax income. The Company carriesapproximately $88M in net losses from previous years,which it can use to shelter future income from federaltax liability through 2012 . NOLs for California incometaxes are $57M and expire between 2002-2012 .
Free Cash FlowGiven the volume of back-catalog rentals at Netflix,the revenue-generating life of each DVD is clearlylonger than one year, so the accelerated 12-monthdepreciation understates EBITDA. We believe thisanomaly, and the cash generated by negative workingcapital needs, makes free cash flow (FCF) a bettergauge for near-term growth than EBITDA .
In 2002 Netflix generated $15 .8M FCF, mostly fromworking capital . Based on the estimates andassumptions in the income statement elements above,we project $27 .4M FCF in 2003 and $48 .5M FCF in2004 , most of it from operations .
Our FCF calculation takes Net Income , adds backD&A and all non-cash items , including stock-basedcomp ; subtracts DVD cost and other capex; then addsnet change in working capital .
Net IncomeNetflix has yet to post positive net income (on GAAPprinciples) but in Q2 :02 the Company broke even onproforma net income for the first time . (Profornia netincome excludes non-cash compensation and one-tim e
For important disclosure information- see the end of this report . ROTH CAPITAL PARTNERS, LLC
13
NETFLIX
items ) . In Q4 :02 Netflix recorded S463K in proformanet income or $0 .02 per share .
If our estimates above are close to actual results,Netflix can deliver positive GAAP net income in atleast one quarter this year, and for the entire Year of2004 .
Share Coun tOutstanding common shares in Q4:02 were 22 .2M .However, Netflix may have significant share dilutionwhen it becomes GAAP profitable. As of year-end2002, investors held 4 . IM outstanding options at anaverage strike price of $3 .42, 1 .3M of which wereexercisable . The Company also has 6 .3M warrantsoutstanding at a weighted average exercise price of$3 .23 .
VALUATION & TRAD ING
We believe adjusted free cash flow (FCF) is the mostreliable gauge of Netflix's growth prospects . Forvaluation purposes , we chose to adjust this figure tomake it even more conservative , by effectivelyexpensing non-cash compensation.
Using our adjusted FCF estimates of $13 .4M in 2003and $34 .6M in 2004 , growth of FCF at 35% from 2005- 2007, adding a terminal value of 6x year-five FCFthen discounting at 20 %, we arrived at a NPV forNetflix cash flows of approximately $340M or about$15 .30 per share . Adding cash per share of approx.S4 .70 yields a $20 price target .
We believe it is premature to value NFLX shares usingan earnings multiple, but for investors who prefer P/E,our S20 target is supported by an enterprise value of30x FY04 diluted EPS.
In our opinion, no suitable public-market comparableexists for Netflix.
NFLX Shares Were Volatile in 2002Netflix conducted an initial public offering at $17 per
share on May 29, 2002 . Since then NFLX stock hasseen some dramatic swings in value. Five months after
the IPO, NFLX dropped to $5 .22, partly due to thelaunch of Walmart .com's DVD-by-mail service inSeptember . NFLX shares recovered to the mid-teens by2002 year-end, thanks to the Company's continuedsubscriber growth in spite of a well-capitalized newcompetitor .
Substantial Sho rt Position In The Stock TodayAs of our initiation date , more than 4M shares hadbeen borrowed and sold against a future decline . Thisshort interest amounts to approximately lOx theaverage daily trading volume . Short covering could bea near-term catalyst for the stock .
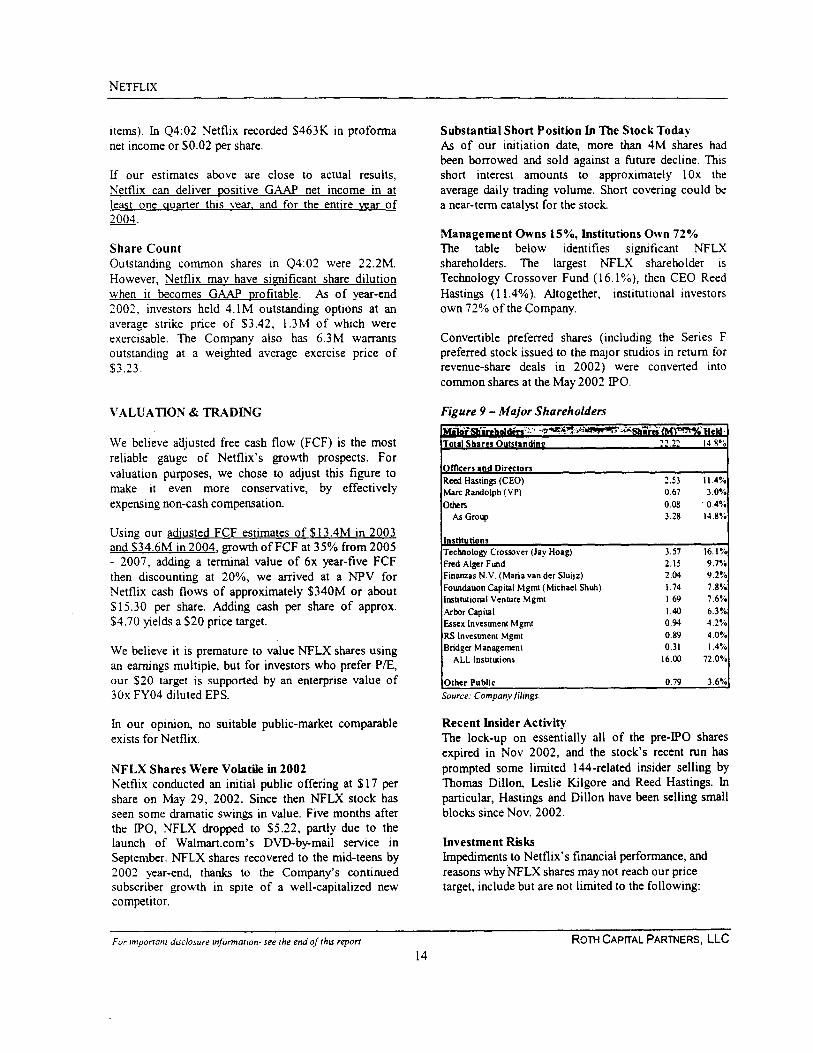
Management Owns 15%, Institutions Own 72 %The table below identifies significant NFLXshareholders . The largest NFLX shareholder isTechnology Crossover Fund (16 .110), then CEO ReedHastings (11 .4%) . Altogether, institutional investorsown 72% of the Company .
Convertible preferred shares ( including the Series Fpreferred stock issued to the major studios in retu rn forrevenue - share deals in 2002 ) were converted intocommon sh ares at the May 2002 IPO .
Figure 9 - Major Shareholders
Total Shares utstandin 22 2' 14 8 0 '
Officers and DirectorsReed Hastings (CEO) 2 .53 11 .4 %Marc Randolph (VP) 0.67 3 .0%
Others 0 .08 0 .44:As Group 3 .28 14 .8%
Institution sTechnology Crossover (Jay Hoag) 3 .57 16 .1 %Fred Alger Fund 2 .15 9 .79 :Finanzas N .V . (Maria van der Sluijz ) 2 .04 9 .2 %
Foundation Capital Mgmt ( Michael Shuh ) 1 .74 7 .8%Institutional Venture Mgmt 1 .69 7 .61/6Arbor Capital 1 .40 6 .3 %Essex Investment Mgmt 0 .94 4 .2%RS Investment Mgmt 0 .89 4 .0 %Bridget Management 0 .31 1 .4 %
ALL Institutions 16 .00 72 .0 %
Other Public 0 .79 3 .6 %
Source: Company filings.
Recent Insider ActivityThe lock-up on essentially all of the pre-IPO sharesexpired in Nov 2002, and the stock's recent run hasprompted some limited 144-related insider selling byThomas Dillon, Leslie Kilgore and Reed Hastings . Inparticular, Hastings and Dillon have been selling smallblocks since Nov . 2002 .
Investment RisksImpediments to Netflix's financial performance, andreasons why NFLX shares may not reach our pricetarget, include but are not limited to the following :
For important disclosure information - see the end of this report. ROTH CAPITAL PARTNERS, LLC
14

NETFLI X
• Increasing competition and price pressure onNetflix subscription se rv ice s
• Netflix' s relationships and contract terms withmovie content owner s
• Consumer acceptance of the DVD video format
■ Consumer acceptance of Netflix products andservice s
■ Netflix's ability to make timely and reliabledelivery of DVDs
• Research and technology development costs in arapidly changing environmen t
■ Uncertain political and economic climate and thedisruptive threat of terrorism .
Investors should also review the Company's 10K for adetailed description of industry and market risks .
For important disclosure information- see the end of this report . ROTH CAPITAL PARTNERS, LLC
15
NLFrt_)X
NEIFLI X
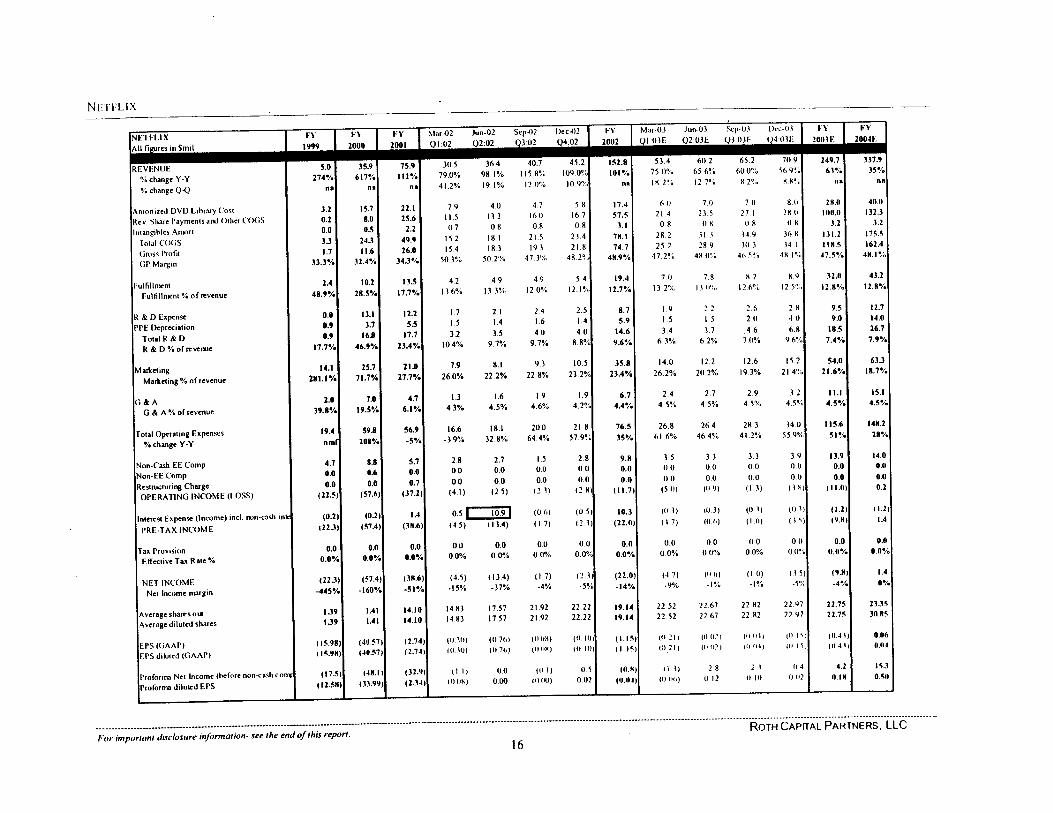
All figures in Smil
FY1999
1`11 '
2000
F Y2001
Mar-0 2
QI :02Jun -0 2
02 :02
Sep-0 23 :02
Dec-0 2
Q4 .02
FY
2002
Mar-03 Jun-0 3
Q1 :03E Q2 :03ESep-0 3
Q3 :03EUre-03
Q4 03E
F'Y
2003E
F' Y2004 E
REVENUE%changeY -Y"'.. change Q.Q
5.0
274•/.no
35 .9
617%
no
75.9
111•/.no
30. 5
79.0 %
41,2%
36 .4
98 .1 %
19.1%
40 .7
1158 %
120"'°
45 .2109 .0%11)9%
152.8
101 %
no
53 . 475 .0 %1 9 2%
60 2
65 .6%
12 .7%
65 .2600%
8 .2°6
70 9569%
8 %
249 .7
63 %
no
337 .9
35'/.
n o
Amortized DVD Library Cost
Rev . Share Payments and Other COG S
Intangibles Amor( .w
Total COG S
Gross Profit
GP Margin
3 .20 .2
0 .0
3 .31 .7
33.3%
15.7
8.0
0. 5
24-3
11 .6
32A%
22 . 125 .6
2 . 249 .926.0
34 .3 .
2 .9
11, 50 7
15 1
15 450.3%
4 0
13 .3
0 8
18. 1
18 3
50.2%
4 .716 .00 .8
21 .519 3
47 .3%
5 .8
16 .7
0 8
23 .4
21 . 8
48 .2 9, (
17 . 457 . 5
3 . 178. 174 .7
48.9%
61 )
21 .4
0 8
28 . 2
25 . 2
47 .2%
7 0
23 . 5
0 8
31 328 .9
48 0%
7 027 . 10 %
34 .910 . 3
46 .5°6
8( 128 0
0 9
36 834 1
4% I".;,
28 .0
100. 0
3 .2
131 .2
118 .5
47 .5%
40.0132 -3
3 .2
175 .5162 .4
48 .1 %
Fulfillment
Fulfillment % ofrevenue
2.448 .9%
10 .2
28 .5%
13 .517 .7•/.
4 .213 .6%
4 .913 .3%
4 .912 .0%
5 . 4
12 .1%
19 .4
12 .7'/.
7 . 013 .2%
7 . 813 .W9i .
% 212 .6%
%12 .5,,
32 .1 1
12 .8 %
43 .212 .8%
R & D ExpensePPE Depreciation
Total R & DR & D % of revenue
0 .00 .90 .9
17.7%
13. 13. 7
16.8
46. 9%
12 .25 3
17 . 723 .4%
1 .71 .53 .2
10.4%
2 . 11 . 4
3 . 59.7%
2 4
1 .6
4 .0
9 .7%
2 .51 .44 .0
8 .8'%,
8. 75. 9
14. 6
9.6%
1 .91 . 5
3 .4
6 3%
2 .21 53 .7
6.2%
2 . 62. 0
1 670%
2 . 8
4 0
6. 896%
9. 59 .0
18 .5
7 .4•/.
12 .714.026. 77 .9 %
MarketingMarketing % of revenue
14. 1281 .1%
25 .771 .7%
21 .027.7%
7 .926 .0%
8 . 1
22 .2%
9 .3
22 .8%
10 . 5
23 . 2%
35 .823 .4 %
14 . 0
26 .2%
12 .2
202%
12 .6193%
15 .2
21 .4%54 .0
21 .6%63 .3
18.7 %
G, & A
G&A%of revenue
2.039 .8%
7 .019 .5%
4 .76 .1%
1 .34 .3°G
1 .64 .5%
1 .94 .6%
1 . 94 .2 %
6 . 74 .4'/.
2 .44 .5°.0
2 . 74 .5°6
2 9
4,5%
3 . 2
45%
11 . 1
4.5%
15 . 1
4.5%
Total Operating Expense s
% change Y-Y
19 .4nm
59. 8208 %
56.9
-5•/.
16.6-3 .9%
18. 132 . 8%
20 064 .4 %
21 .85791%
76. 535•/.
26 .861 .6%
26. 446 .4%
28 . 341 .2%
34 . 05591/1 ,
115 .651%
148 . 228 %
Non-Cash EE Com pNon-EEtCom p
Restructuring Charge
OPERATING INCOME (LOSS)
4. 70. 00 .0
(22 .5)
8 .80 .6
0.0
(57.6)
5 .70 .00 .7
(37 .2)
2 .80 00 .0
(4 .1)
2 .70 .0
0 .0(25 )
1 . 50 .00 .0
( _3)
2 .80 0
0.0(_8
9 .80 .0
0 .0(11 .7)
3 50 . 00. 0(5 . (j )
3 30 .00 .0(09)
3 3
0 .00 .0(13)
3 9(1 0
0 .011%)
13 .90 .0
0 .0111 .111
14. 00 .00 .00 .2
Interest Expense (Income) incl . no n-cash i n
PRE-TAX INCOME
(0 .2 )122_11
(11.2 )
(57 .4)
1 .4(38.6 )
0.5 10.9
(45) (13 .4 )
(06 )
11 .7)
(0.5 )
12_3)
10. 3(22 .0)
(0 .3 )
(4 7)
(03 )
(111)
(0 .3 )( I (1)
to 3 )(15)
(1 .2 )(9.X)
11 .2 )
1 .4
Tax ProvisionEffective TaxRare %
0. 00 .0%
0 .00 .0%
0 .00.0%
0 .00 .0%
0 .00 .0%
0,0
00%
0 .00 .0%
0. 00.0%
0 .00 .0%
0. 00 (1%
0 .0
00%
0 .000°)
0. 00 . 0%
0. 00 .0 %
NET INCOM ENet Incomenurgin
(22_1 1
-445•/.
(57. 4 )
-160 %
(3 11.6 )
-51%
(4 .5)-15%
( 13 .4 )-37%
(17 )4%
(22 3 )-5%
(22 .0 )
, -14%
(4 7 )-9%
(1) 6 )-1%
( 1 0 )-I, ;
(15 )
-51,G'
(9 .111 (-4%
1 .40%
Average shams o urAverage diluted shares
1 .3 91 .3 9
1 .4 11 .41
14 . 1 014. 10
14 .8 314 .83
17 .5 7
1757
21 .9 22192
22 . 2 222 .22
19 .1 419 .14
22 5 222 .52
22 .6 722 .67
22 8 222 .%2
22 .9 72297
22 .7 522 .75
233530 .8 5
EPS (GAAP )
FPS diluted (GAAP)
( 15.9 8
( 15.98
) (41) .57
) 4411 .57
) (2.7 4
) 12.74
) (1) .30 1
) 11.30)
(11 .76 )10]6)
(00% )
(0 )1%)
(I)II )It II)
(1 .1 5
I 11.15
) 11121 )) 10 21)
(0 (1 ' 1(u 0?)
(1 1) 1 )Io (14)
(II I slU 15
) (11.43 )1 111 .41
0.11 6
1 0114
Profonna Net Income (before non-cash con?
Profornn diluted EPS
(17 5
1(2 .5X
) (48.1
) (33.99
1 ( 32 .9
) (234
) (I I )) 100%)
0 .0
000
111 1 )(111%1)
0 . 5
0 .02(0 . 8
111.114
) 41 3 )) (I) )ill
2 8
0 12
2 11) 10
4"1 :,
2
4 .2
1,18
15 3
0.511
----------------------------------------------------------------------------------------------------- -----------' ._--------------------------
ROTH CAPITAL PARTNERS, LLC
For important disclosure information - see the end of this report .
16

NETFLIX
NETFUX
BALANCE SHEET
All figures in $ mil
ASSETSCurrent assets :
% o f
FY FY FY Total
2000 2001 2002W-Iw~dq
-wig SERF-
F NTT rT"11r!
-," tM
Cash an cas equiva ents 14. 9
a eta a secur ities 0 . 0
rrepaio expenses
Prepaid revenue- sharing expensesOther current assets
Total curare nt assets
Property and equipment, net
DVD library ( net of depreciation)
Intangible asset s
Deposits
Other assets
TOTAL ASSET S
LIABILITIES AND STOCKHOLDERS' EQUITY
Current liabil it ies :Accounts payable
Accrued expenses
Deferred revenues, net
Current porti on of capital leases
Notes payabl e
Total cu rrent liabilities
Capital lease obligations
Defe rred rent
Commitments and contingencies :
Redeemable convertible pref. stock
Stockholders' equity :
Preferred stock, $ .001 par, 8 .5M shares authorized ; none
Common stoc k
Additional paid- in capitalAccumulated deficit
Deferred stock-based compensation
Accumulated other comprehensive income (loss)
Total stoddwlders ' equity
TOTAL LIABILITIES AND EQUITY
2.7
0 .6
0.0
18.3
10 .0
16. 9
5 .6
0.6
1 . 1
52.5
16.1 59.8 46 %
0 .0 43.8 34 %
1 .0 2.8 2 %
0 .7 0.3 0%
1 .7 0.4 0 %
19 .6 107.1 82%
8.2 5.6 4 %
3.6 10.0 8%
7 .9 6.1 5 %
1 .7 1 .7 1 %
0 .6 0.1 0 %
41 .6 130. 5 100 %
7 .7 13 .7 20 .4 49 %
5 .9 4 .5 9.1 22%
2.8 4 .9 9 .7 24%
1 .3 1 .3 1 .2 3%
2 .3 1 .7 0 .0 0%
20 .0 26 .2 40 .4 98 %
2 .0 1 .1 0 .5 1 %
0 .1 02 0 .3 1 %
1 .8 2.8 0 .0 0%23 .9 30 . 3 41 .2 100 %
101.8 101.8 0. 0
0 .0 0.0 0 . 0
0.0 0.0 0. 0
34 .6 52 .5 259. 2(98.6) (137 .3) (159. 2
(9 .3) (5 .7) (11 .4
0 .0 0 .0 0. 8
(73 .3) (90 .5) 89.4
52 .5 41 .6 130 .5
For important disclosure information - see the end of this report . ROTH CAPITAL PARTNERS, LL C
17
NETFLIX
NETFUX
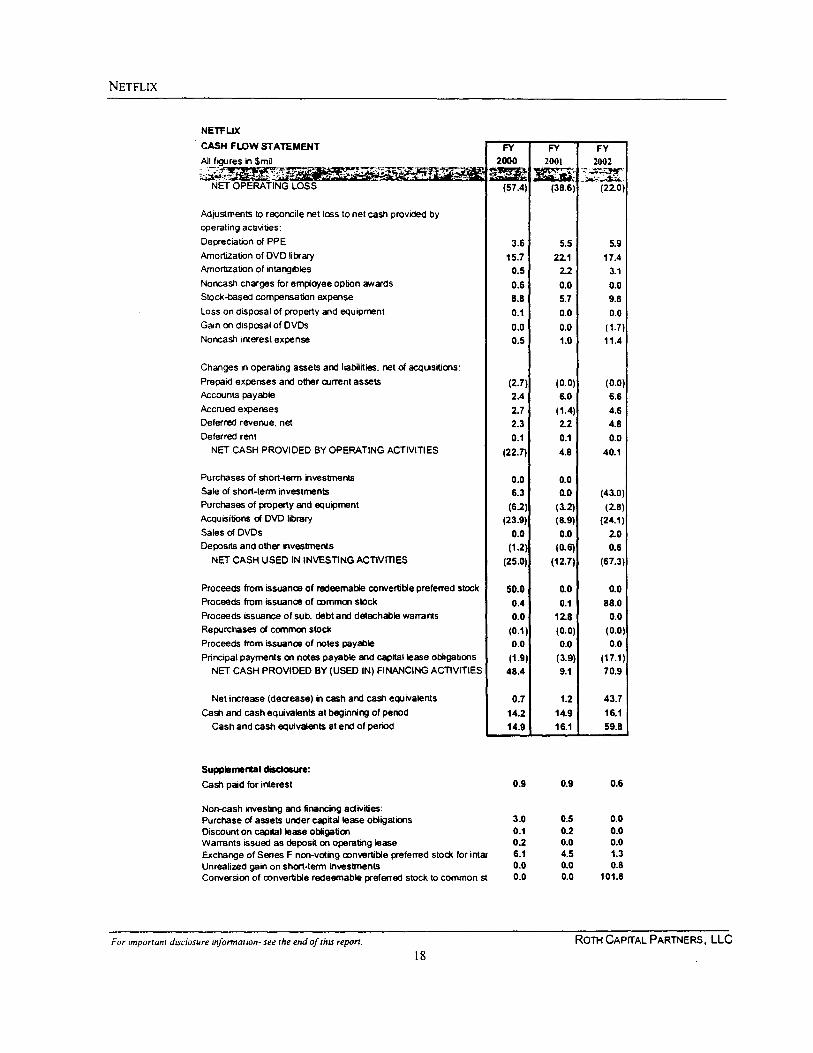
CASH FLOW STATEMENT FY FY FYAll figures in $mil 2000 2001 2002
Pd._
NET OPERATING LOSS (57 .4) (38.6) (22.0 )
Adjustments to reconcile net loss to net cash provided byoperating activities :
Depreciation of PPE 3 .6 5.5 5 .9Amortization of DVD li brary 15.7 22.1 17 .4Amortization of intangibles 0.5 2.2 3 . 1Noncash charges for employee option awards 0 .6 0.0 0 .0Stock-based compensation expense 8.8 5.7 9 .8Loss on disposal of property and equipment 0 .1 0.0 0 .0Gain on disposal of DVDs 0 .0 0.0 (1 .7 )Norxash interest expense 0 .5 1 .0 11 .4
Changes in operating assets and liab il ities . net of acquisitions :
Prepaid expenses and other current assets (2 .7) (0.0) (0 .0 )Accounts payable 2 .4 6.0 6 .6Accrued expenses 2.7 (1 .4) 4 .6Deferred revenue, net 2.3 2. 2 4 .8Deferred rent 0 .1 0.1 0 .0
NET CASH PROVIDED BY OPERATING ACTIVITIES ( 22.7) 4.8 40. 1
Purchases of short-term investments 0 .0 0. 0Sale of short-terra investments 6.3 0.0 (43.0)Purchases of property and equipment (6.2) (3.2) ( 2. 8)Acquisitions of DVD library (23 .9) (8.9) (24.1 )Sales of DVDs 0 .0 0.0 2 .0Deposits and other investments (1 .2) (0.6) 0.6
NET CASH USED IN INVESTING ACTIVITIES (25 .0) (12.7) (67 .3 )
Proceeds from issuance of redeemable conver ti ble preferred stock 50.0 0.0 0.0Proceeds from issuance of common stock 0 .4 0.1 88 .0Proceeds issuance of sub. debt and detachable warrants 0 .0 12.8 0. 0Repurchases of common stock ( 0 .1) (0.0) (0.0 )Proceeds fro m issuance of notes payable 0 .0 0.0 0. 0Principal payments on notes payable and capital lease obliga ti ons ( 1 .9) (3.9 ) (17 . 1
NET CASH PROVIDED BY (USED IN) FINANCING ACTIVITIES 48 .4 9.1 70.9
Net increase (decrease) in cash and cash equ ivalents 0 .7 1 .2 43. 7
Cash and cash equivalents at beginning of period 14.2 14 .9 16. 1Cash and cash equivalents at end of period 14.9 16.1 59. 8
Supplemental disdastue:
Cash paid for interest 0 .9 0.9 0.6
Non-cash investing and financing a ctivities :Purchase of assets under capital lease obligations 3 .0 0.5 0.0Discount on capital lease obli gation 0 .1 0.2 0.0Warrants issued as deposit on operating lease 0 .2 0.0 0.0Exchange of Series F non-voting convertible preferred stock for intar 6 .1 4.5 1. 3Unrealized gain on short- term investments 0 .0 0.0 0. 8Conversion of convertible redeemable preferred stock to common st 0 .0 0 .0 101. 8
For important disclosure information- see the end of this report . ROTH CAPITAL PARTNERS, LLC
18

NETFLI X
Other Public Companies Listed in This Report :
Wal-Mart Stores Inc . (WMT- $49 .55 - NR)
Blockbuster Inc . (BBI - $16 .90 - NR)
Hollywood Entertainment (1-ILYW - $15 .32 - NR )
For important disclosure information- see the end of this report . ROTH CAPITAL PARTNERS, LL C
19
NETFLIX
Disclosures :Investo rs should assume that Roth Capital Pa rt ners, LLC ("RCP"J expects to receive or intends to seek compensation for investment banking or other
business relationships with the covered companies mentioned in this report in the new three months.
Specific Disclosures:(al Within the last thirty-six months, RCP has managed or co-managed a banking transaction for this company . This research contains forward-looking
statements made pursuant to the safe harbor prof ision of the Private Securities Litigation Act of 1995 .
(b) RCP makes a market in this security.(c) RCP and'or its employees, officers, directors and owners own options, rights or warrants to purchase this securav.
(d) An employee of RCP serves on the company's Board of Directors (other than the Research Analyst) .ie) A Research Analyst andior a member of the Analysts household has a financial interest in the securities of the subject company (if applicable . specific
type of financial interest owned will be disclosed) .(f) The Research Analyst serves on the company's Board of Directors.(g) This security is not eligible for sale in one or more states .
(h) This stock is subject to the Securities and Exchange Commission's Penny Stock Rules, which set forth sales practice requirements !or certain loir-priced securities .
(it Within the last twelve months, RCP has managed or co-managed a banking transaction for this company.(i ) Within the last twelve months, RCP has received compensation for investment banking servicesfrom this company.
(k) RCP or its affiliates beneficially owns 1% or more of an equity security of this company.
Ratings Dist ribution: Strong Buy / Buy Neutral/NR Sell
R Ingrassia - Rich Media IT & Entertainment Coverage l000, 0°'. 0°' o
R Ingrassia - Rich Media IT & Entertainment Coverage - Investment banking relationships' 00,0 0°-„ O° OGlobal Coverage '~o 0 23° 00"'.Global Coverage- Investment banking relationships' 170 9°.o On .
Within the last twelve months, Roth Capital Partners has received compensation for investment banking services from this company.
Ratings S ystem Definitions - RCP employs a rating system based on the following
Strong Buy : A secwxy, which at the titre the rating is instituted and or reiterated indicates an e xpectation of a total return ofat least 40% over the next 12monthsBuy : A security, which at the tine the rating is instituted. indicates an expec tatio n of a total re turn between 10% and 40% over the ne xt 12 months.
Neutra l : A security, which at the tire the rating isinstituted , indicates an expec tation of a total return between negative 10% and 10% over the next 12
months .
Sell : A security, which at the time the rating is instituted. indicates an expectation that the price wig deprecate by more than 10% over the next 12 months.
Our rating system attempts to incorporate industry, company and/or overall market risk and volatility . Consequently, at any given point in time, our
investment rating on a stock and its implied price movement may not correspond to the stated 12-month price target .
a ..~nvra, ~m „, x
.mow, r r .... . ..... . .,.
C rrM~ . .~ rte. .
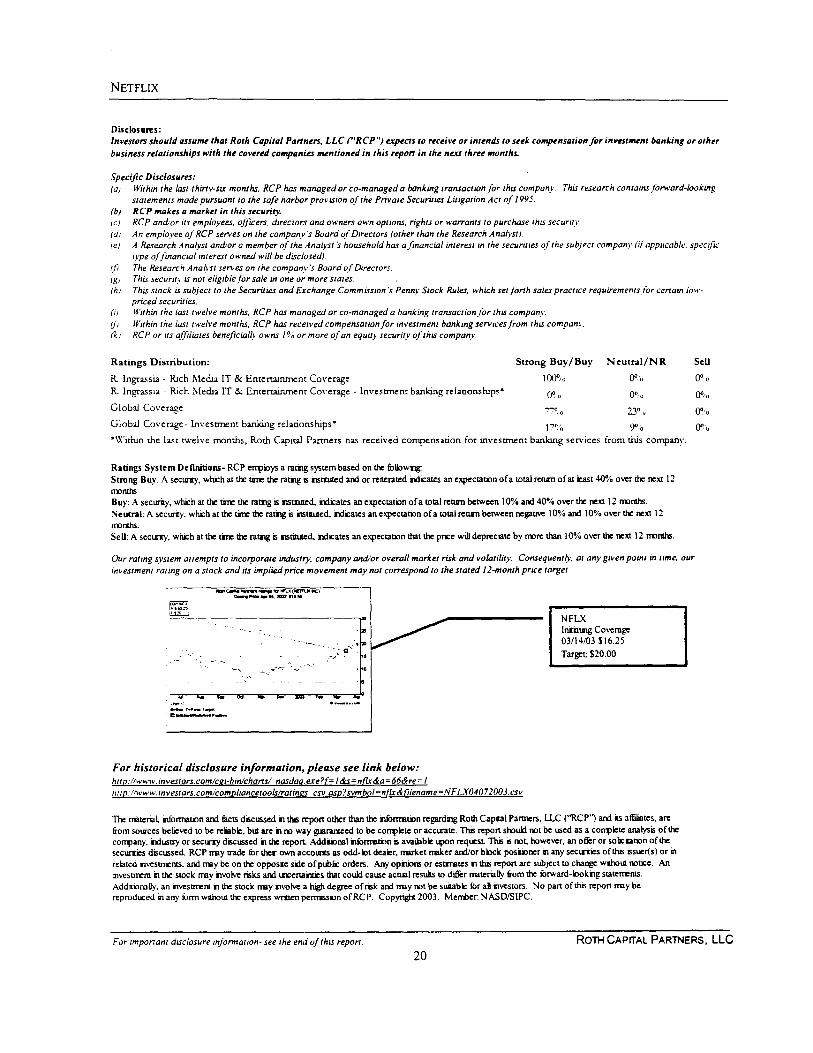
For historical disclosure information , please see link below:
httn :/ww w .investors. com/cei-hin/cha rts/ nasdag. exe?f=1&s=nllr&a=66&re=1http :/www' . investars. comicomnliancetools'ratinrs csv .asp?symbol = nllx&filename =NFLXO4072003 .csv
NFLXInitiating Coverage03/14/03 $16 .25Tar get: $20.00
The material information and facts discussed in the repo rt other than the information regarding Roth Cap ital Partners, LLC ('RCP') and its affiliates, are
from sources believed to be reliab le, but are in no way guaranteed to be comp le te or accurate. This repo rt should not be used as a comple te analys is of the
company, industry or security d iscussed in the report. Additional information is available upon request. This is not, however , an offer or solicitation of the
securities discussed. RCP may trade for her own accounts as odd - lot dealer, market maker and/or b lock posuoner in any securities of this issuer(s) or in
related investments, and may be on the opposite site of public orders . Any opinions or estimates in the re port are subject to change w ithout notice . An
investment in the stock may involve risks and uncertainties that could cause actual resu lts to differ materially fr om the forward- looking statements .
Additionally, an investment in the stock may involve a high degree of risk and troy not be suitab le for all investo rs . No part of this repo rt may be
reproduced in any form without the express written permission ofRCP . Copyright 2003 . Member: NASD/SIPC .
For important disclosure information- see the end of this report. ROTH CAPITAL PARTNERS, LLC
20