
IN NUMBERS: INCARCERATION-RECIDIVISM-EDUCATION THE NEED FOR BETTER COMMUNICATION BEHIND BAR...
22
IN NUMBERS: INCARCERATION-RECIDIVISM- EDUCATION THE NEED FOR BETTER COMMUNICATION BEHIND BAR COMMUNICATION BEHIND BARS TDCJ REHABILITATION PROGRAMS DIVISION AUGUST 2011
-
Upload
lawrence-garrison -
Category
Documents
-
view
219 -
download
1
Transcript of IN NUMBERS: INCARCERATION-RECIDIVISM-EDUCATION THE NEED FOR BETTER COMMUNICATION BEHIND BAR...

IN NUMBERS:INCARCERATION-RECIDIVISM-
EDUCATION
THE NEED FOR BETTER COMMUNICATION BEHIND BAR
COMMUNICATION BEHIND BARSTDCJ REHABILITATION PROGRAMS DIVISION
AUGUST 2011

COMMUNICATION BEHIND BARSTDCJ REHABILITATION PROGRAMS DIVISION
AUGUST 2011
OVERVIEW
The Texas Department of Criminal Justice (TDCJ) operates the nation’s third largest prison system (along with California and the Federal Bureau of Prisons).
In 2011 there were 154,795 inmates on hand in TDCJ-run correctional facilities.
90% of inmates(139,316 persons) PRISON
7.8% of in-mates(12,133
persons)STATE JAILS
2.2% of inmates (3,346 persons)
SAFP
Graph 1: distribution of inmates on hand among different types of TDCJ facilities source: Statistical Report Fiscal Year 2010 of the Texas Department of Criminal Justice
link: http://www.tdcj.state.tx.us/publications/executive/FY2010StatisticalReportFiscalYear2010.pdf

INMATES: GENDER
RATIO
From the 154,795 inmates in Texas prisons, state jails, and substance abuse felony program (SAFP) facilities:
92.23% are male and 7.77% are female
the largest share of female inmates is in the SAFP: 23.55%
the largest share of male inmates is in prisons: 93.8%
source: Statistical Report Fiscal Year 2010 of the Texas Department of Criminal Justicelink: http://www.tdcj.state.tx.us/publications/executive/FY2010StatisticalReportFiscalYear2010.pdf
PRISON STATE JAIL SAFP TOTAL ON HAND
number % number % number % number %
TOTAL 139,316 100% 12,133 100% 3,346 100% 154,795 100%
GENDERFEMALE 8,639 6.20% 2,598 21.41% 788 23.55% 12,025 7.77%
MALE 130,677 93.80% 9,535 78.59% 2,588 77.35% 142,77 92.23%
COMMUNICATION BEHIND BARSTDCJ REHABILITATION PROGRAMS DIVISION
AUGUST 2011

INMATES: RACE & ETHNICITY
RATIO
From the 154,795 inmates in Texas prisons, state jails, and substance abuse felony program (SAFP) facilities:
36.21% are African American, 32.26% are white, and 31.03% are Hispanic
PRISON STATE JAIL SAFP TOTAL ON HAND
number % number % number % number %
TOTAL 139,316 100% 12,133 100% 3,346 100% 154,795 100%
RACE ETHNICITY
AFRICAN AMERICAN 50,811 36.47% 4,408 36.33% 839 25.07% 56,058 36.21%
HISPANIC 42,19 30.28% 4,21 34.70% 1,626 48.60% 48,026 31.03%
WHITE 45,607 32.74% 3,461 28.53% 868 25.94% 49,936 32.26%
OTHER 708 0.51% 54 0.45% 13 0.39% 775 0.50%
source: Statistical Report Fiscal Year 2010 of the Texas Department of Criminal Justicelink: http://www.tdcj.state.tx.us/publications/executive/FY2010StatisticalReportFiscalYear2010.pdf
COMMUNICATION BEHIND BARSTDCJ REHABILITATION PROGRAMS DIVISION
AUGUST 2011

INMATES: OFFENSE OF INITIAL
SENTENCING
From the 154,795 inmates in Texas prisons, state jails, and substance abuse felony program (SAFP) facilities:
51.20% were initially sentenced for violent offenses 17.83% were initially sentenced for drugs-related offenses 16.58% were initially sentenced for property offenses 14.39% were initially sentenced for other types of offenses
PRISON STATE JAIL SAFP TOTAL ON HAND
number % number % number % number %
TOTAL 139,316 100% 12,133 100% 3,346 100% 154,795 100%
OFFENSE OF INITIAL
SENTENCING
VIOLENT 78,368 56.25% 172 1.42% 711 21.25% 79,251 51.20%
PROPERTY 18,943 13.60% 5,946 49.01% 779 23.28% 25,671 16.58%
DRUGS 22,142 15.89% 484 3.99% 1,226 36.64% 27,602 17.83%
OTHER 19,863 14.26% 1,778 14.65% 630 18.83% 22,271 14.39%
source: Statistical Report Fiscal Year 2010 of the Texas Department of Criminal Justicelink: http://www.tdcj.state.tx.us/publications/executive/FY2010StatisticalReportFiscalYear2010.pdf
COMMUNICATION BEHIND BARSTDCJ REHABILITATION PROGRAMS DIVISION
AUGUST 2011
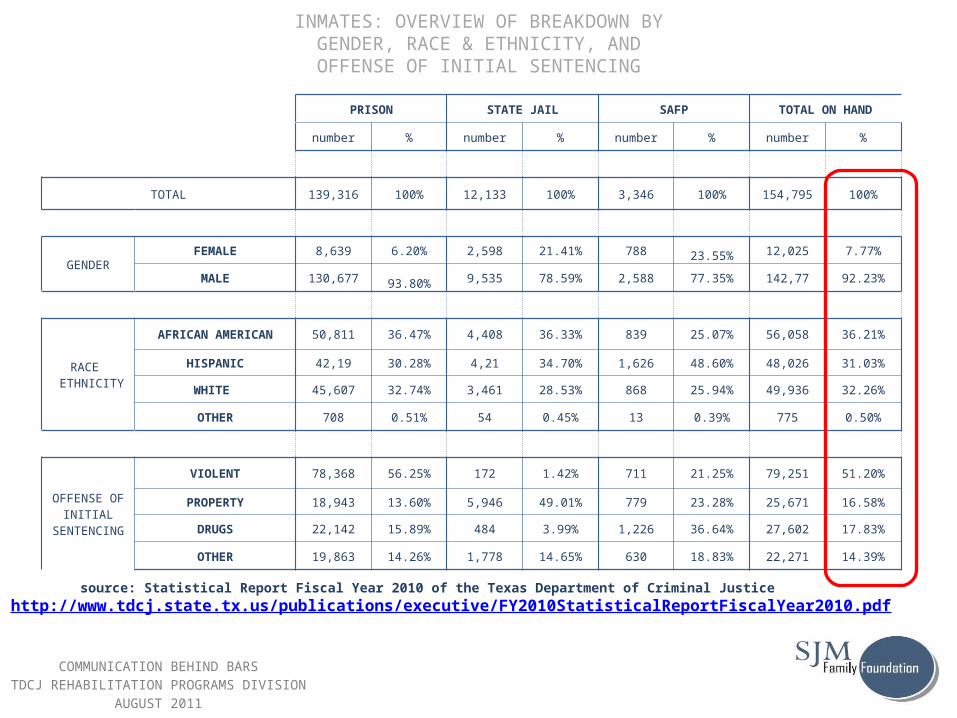
INMATES: OVERVIEW OF BREAKDOWN BY GENDER, RACE & ETHNICITY, AND
OFFENSE OF INITIAL SENTENCING
PRISON STATE JAIL SAFP TOTAL ON HAND
number % number % number % number %
TOTAL 139,316 100% 12,133 100% 3,346 100% 154,795 100%
GENDERFEMALE 8,639 6.20% 2,598 21.41% 788 23.55% 12,025 7.77%
MALE 130,677 93.80% 9,535 78.59% 2,588 77.35% 142,77 92.23%
RACE ETHNICITY
AFRICAN AMERICAN 50,811 36.47% 4,408 36.33% 839 25.07% 56,058 36.21%
HISPANIC 42,19 30.28% 4,21 34.70% 1,626 48.60% 48,026 31.03%
WHITE 45,607 32.74% 3,461 28.53% 868 25.94% 49,936 32.26%
OTHER 708 0.51% 54 0.45% 13 0.39% 775 0.50%
OFFENSE OF INITIAL
SENTENCING
VIOLENT 78,368 56.25% 172 1.42% 711 21.25% 79,251 51.20%
PROPERTY 18,943 13.60% 5,946 49.01% 779 23.28% 25,671 16.58%
DRUGS 22,142 15.89% 484 3.99% 1,226 36.64% 27,602 17.83%
OTHER 19,863 14.26% 1,778 14.65% 630 18.83% 22,271 14.39%
source: Statistical Report Fiscal Year 2010 of the Texas Department of Criminal Justicelink: http://www.tdcj.state.tx.us/publications/executive/FY2010StatisticalReportFiscalYear2010.pdf
COMMUNICATION BEHIND BARSTDCJ REHABILITATION PROGRAMS DIVISION
AUGUST 2011
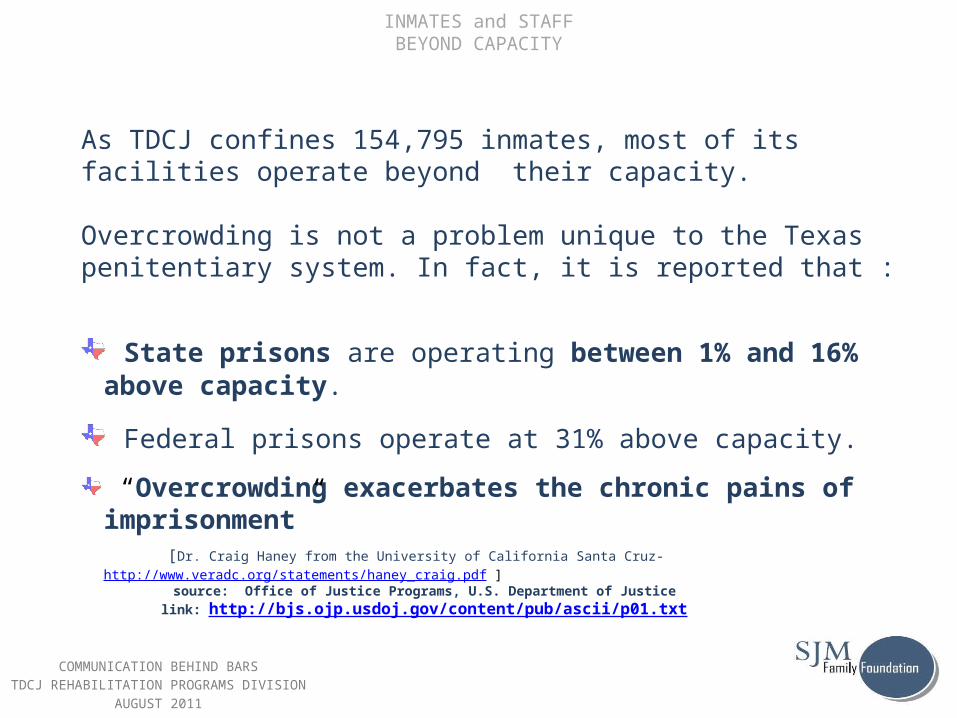
INMATES and STAFFBEYOND CAPACITY
As TDCJ confines 154,795 inmates, most of its facilities operate beyond their capacity.
Overcrowding is not a problem unique to the Texas penitentiary system. In fact, it is reported that :
State prisons are operating between 1% and 16% above capacity.
Federal prisons operate at 31% above capacity.
“Overcrowding exacerbates the chronic pains of imprisonment”
[Dr. Craig Haney from the University of California Santa Cruz- http://www.veradc.org/statements/haney_craig.pdf ]
source: Office of Justice Programs, U.S. Department of Justicelink: http://bjs.ojp.usdoj.gov/content/pub/ascii/p01.txt
COMMUNICATION BEHIND BARSTDCJ REHABILITATION PROGRAMS DIVISION
AUGUST 2011

INMATES and STAFFPROBLEMS
The staffing levels in TDCJ facilities do not match the increasing influx of inmates. Here are some figures:
35 inmates : 1 staff member
For the 154,795 inmates in TDCJ correctional facilities there is a staff of approximately 4,000 guards.
This means that for every 100,000 inmates there are ca. 2,600 TDCJ correctional facility employees
There are over 35 inmates per 1 TDCJ correctional facility employee
source: NuPhysicia’s Analysis and Recommendations for California Prison Health Care SystemUniversity of California Santa Cruz
March 2010
COMMUNICATION BEHIND BARSTDCJ REHABILITATION PROGRAMS DIVISION
AUGUST 2011

INMATES v. INMATESASSAULT
Overcrowded facilities and high inmates to staff ratio exacerbate the issue of prison violence.
State and Federal correctional facilities report a 27% increase in inmate-on-inmate assaults
Many correctional facilities in Texas do not count the number of inmate-on-inmate assaults.
The average annual number of inmate-on-inmate assault is estimated as ca. 82 assaults per county.
Texas has the highest reported number of inmate-on-inmate sexual violence cases: 4 times higher (3.95 per 1,000) than the U.S. average (1.05 per 1,000).
Source: Texas Commission on Jail Standards , 2004 House Bill 1660 Report to the Texas Legislation,link: http://www.tcjs.state.tx.us/docs/hb%201660%20report.pdf
COMMUNICATION BEHIND BARSTDCJ REHABILITATION PROGRAMS DIVISION
AUGUST 2011

INMATES v. STAFFASSAULT
Inmate violence increasingly targets correctional facility staff:
State and Federal correctional facilities report a 32% rise in inmate-on-staff attacks.
33.5% of all assaults in prisons and jails are committed by inmates against staff.
Correctional Officers (COs) have the second highest mortality rate of any occupation
The average annual number of inmate-on-staff assault is estimated as ca. 17 assaults per county.
Source: Texas Commission on Jail Standards , 2004 House Bill 1660 Report to the Texas Legislation,link: http://www.tcjs.state.tx.us/docs/hb%201660%20report.pdf
COMMUNICATION BEHIND BARSTDCJ REHABILITATION PROGRAMS DIVISION
AUGUST 2011
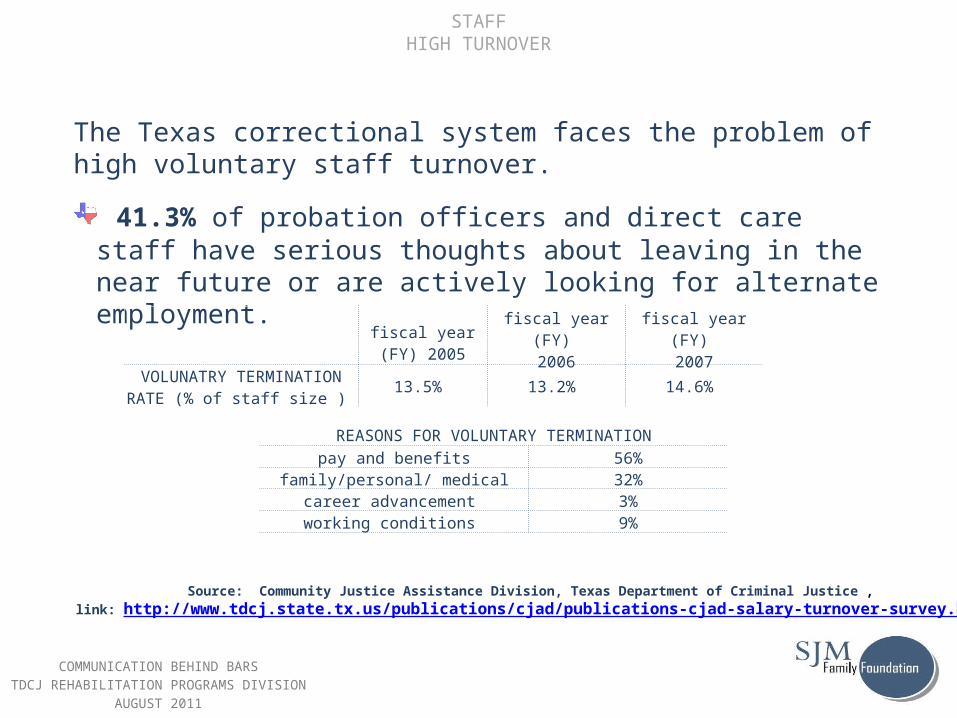
STAFFHIGH TURNOVER
The Texas correctional system faces the problem of high voluntary staff turnover.
41.3% of probation officers and direct care staff have serious thoughts about leaving in the near future or are actively looking for alternate employment.
Source: Community Justice Assistance Division, Texas Department of Criminal Justice ,link: http://www.tdcj.state.tx.us/publications/cjad/publications-cjad-salary-turnover-survey.htm
COMMUNICATION BEHIND BARSTDCJ REHABILITATION PROGRAMS DIVISION
AUGUST 2011
fiscal year (FY)
2005fiscal year (FY)
2006fiscal year (FY)
2007VOLUNATRY TERMINATION
RATE (% of staff size ) 13.5% 13.2% 14.6%
REASONS FOR VOLUNTARY TERMINATIONpay and benefits 56%
family/personal/ medical 32%career advancement 3%working conditions 9%

STAFFHIGH TURNOVER
The high voluntary turnover contributes to:
Unstable caseload sizes
Inexperienced staff
Training issues
Decreased quality of supervision
Lower staff morale
Source: Community Justice Assistance Division, Texas Department of Criminal Justice ,link: http://www.tdcj.state.tx.us/publications/cjad/publications-cjad-salary-turnover-survey.htm
COMMUNICATION BEHIND BARSTDCJ REHABILITATION PROGRAMS DIVISION
AUGUST 2011

RECIDIVISM
Source: The Pew Charitable Trust (2011). State of recidivism: the revolving door of American prisonslink: http://www.pewcenteronthestates.org/uploadedFiles/Pew_State_of_Recidivism.pdf
Recidivism is the return to criminal activity after release from a correctional facility.
Recidivism has far-reaching and expensive consequences.
The annual correctional costs in the United States equal $52 billion.
By decreasing recidivism rates by 10% Texas can save $33.6 million a year
High recidivism rates carry devastating individual cost for the offenders and high social costs for their families and the community.
COMMUNICATION BEHIND BARSTDCJ REHABILITATION PROGRAMS DIVISION
AUGUST 2011
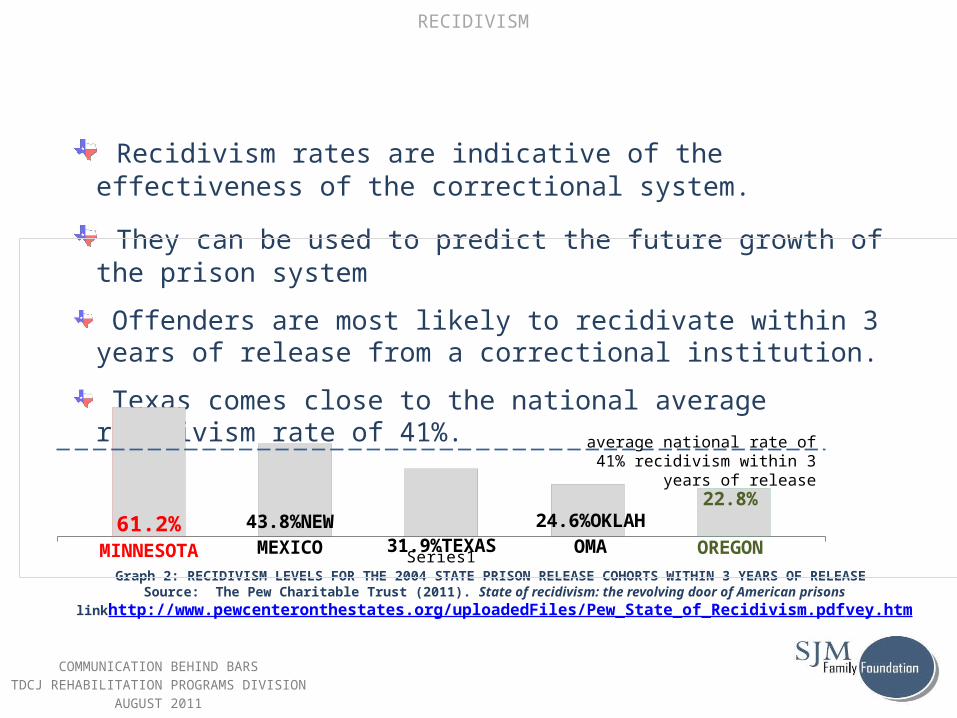
RECIDIVISM
Graph 2: RECIDIVISM LEVELS FOR THE 2004 STATE PRISON RELEASE COHORTS WITHIN 3 YEARS OF RELEASE Source: The Pew Charitable Trust (2011). State of recidivism: the revolving door of American prisons
linkhttp://www.pewcenteronthestates.org/uploadedFiles/Pew_State_of_Recidivism.pdfvey.htm
Recidivism rates are indicative of the effectiveness of the correctional system.
They can be used to predict the future growth of the prison system
Offenders are most likely to recidivate within 3 years of release from a correctional institution.
Texas comes close to the national average recidivism rate of 41%.
Series1
61.2%MIN-NE-
SOTA43.8%NE
W MEXICO31.9%TEX
AS24.6%OKL
AHOMA
22.8%
OREGON
average national rate of 41% recidivism within 3 years of
release
COMMUNICATION BEHIND BARSTDCJ REHABILITATION PROGRAMS DIVISION
AUGUST 2011

RECIDIVISMBY OFFENDER CHARACTERISCTIS
Source: Texas Legislative Budget Board (2011). Statewide Criminal Justice Recidivism and Revocation Rate link: http://www.lbb.state.tx.us/PubSafety_CrimJustice/3_Reports/Recidivism_Report_2011.pdf
The latest data on the recidivism of Texas correctional facilities release cohorts is available for the following fiscal year (FY) cohorts:
COMMUNICATION BEHIND BARSTDCJ REHABILITATION PROGRAMS DIVISION
AUGUST 2011
FY 2005 FY 2006 FY 2007
3-YEAR RE-ARREST RATE
76.4%
73.6%
***
TIME FROM RELEASE TO RE-ARREST
13 months
13 months
***
3-YEAR RE-INCARCERATION RATE
***
41.2%
35.7%
TIME FROM RELEASE TO RE-INCARCERATION
***
15 months
14 months

RECIDIVISMBY CORRECTIONAL FACILITY
Source: Texas Legislative Budget Board (2011). Statewide Criminal Justice Recidivism and Revocation Rate link: http://www.lbb.state.tx.us/PubSafety_CrimJustice/3_Reports/Recidivism_Report_2011.pdf
Not all offenders are equally likely to recidivate.
Recidivism rates vary by gender, race/ ethnicity, type of offense of initial sentencing, and correctional facility
COMMUNICATION BEHIND BARSTDCJ REHABILITATION PROGRAMS DIVISION
AUGUST 2011
FY 2006 RELEASE COHORT FY 2007 RELEASE COHORT
TYPE OF CORRECTIONAL FACILITY
RELEASED
OF THEM RE-INCARCERATED WITHIN
3 YEARS
RELEASED
OF THEM RE-INCARCERATED
WITHIN 3 YEARS
# % # % SUBSTANCE ABUSE
FELONY PUNISHMENT FACILITIES
5,329 2,111 39.61%
5,464 2,201 40.48%
IN-PRISON THERAPEUTIC COMMUNITIES
924 223 24.13% 794 196 24.69%
STATE JAILS 24,218 7,879 32.53% 24,213 7,717 31.87%
STATE PRISONS 40,438 1,052 26.01% 41,051 9,972 24.29%
INTERMEDIATE SANCTION FACILITIES
10,549 4,550 43.13% 10,221 4,101 40.12%

FY 2006 RELEASE COHORT FY 2007 RELEASE COHORT
TYPE OF CORRECTIONAL FACILITY
GENDER
% of RELEASED COHORT
% OF COHORT GENDER GROUP RE-
INCARCERATED WITHIN 3 YEARS
% OF RELEASED COHORT
% OF COHORT GENDER GROUP
RE-INCARCERATED WITHIN 3 YEARS
SUBSTANCE ABUSE FELONY PUNISHMENT
FACILITIES
MALE 79.3% 40.3% 80.5% 42.4%
FEMALE 20.7% 36.8% 19.5% 31.4%
IN-PRISON THERAPEUTIC COMMUNITIES
MALE 67.2% 26.9% 78.5% 25.7%
FEMALE 32.8% 18.5% 21.5% 21.1%
STATE JAILSMALE 76.6% 33.9% 77.6% 33.4%
FEMALE 23.4% 28.1% 22.4% 26.7%
STATE PRISONS MALE 90.1% 26.8% 90.0% 25.0%
FEMALE 9.9% 18.6% 10.0% 17.9%
INTERMEDIATE SANCTION FACILITIES
MALE 90.3% 43.9% 90.6% 40.9%
Female 9.7% 34.6% 9.4% 32.3%
RECIDIVISMBY GENDER
Source: Texas Legislative Budget Board (2011). Statewide Criminal Justice Recidivism and Revocation Rate link: http://www.lbb.state.tx.us/PubSafety_CrimJustice/3_Reports/Recidivism_Report_2011.pdf
COMMUNICATION BEHIND BARSTDCJ REHABILITATION PROGRAMS DIVISION
AUGUST 2011
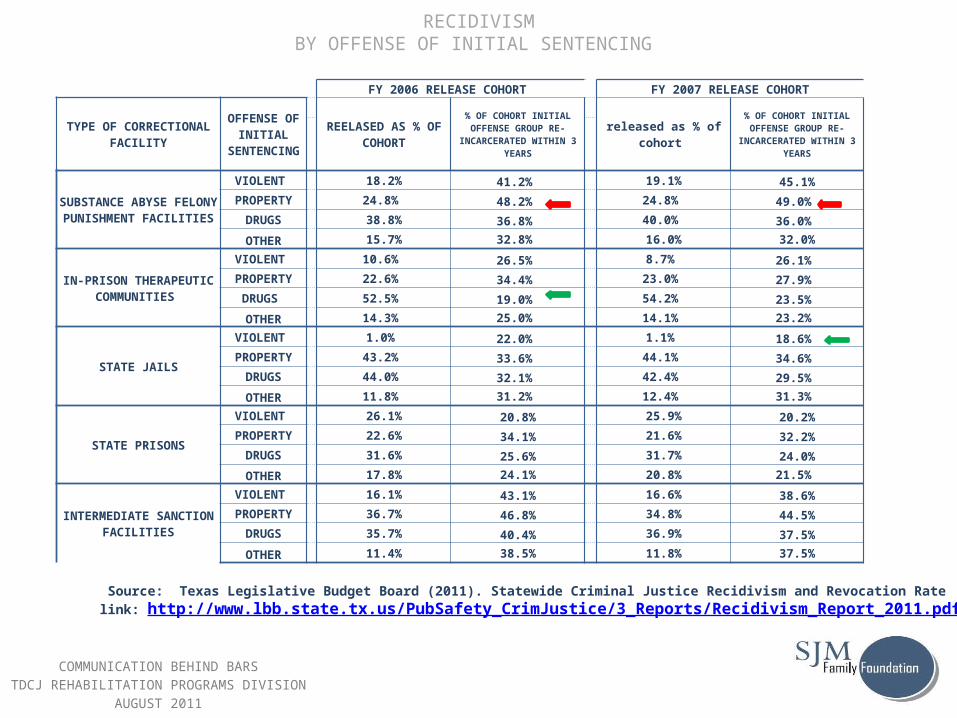
RECIDIVISMBY OFFENSE OF INITIAL SENTENCING
Source: Texas Legislative Budget Board (2011). Statewide Criminal Justice Recidivism and Revocation Rate link: http://www.lbb.state.tx.us/PubSafety_CrimJustice/3_Reports/Recidivism_Report_2011.pdf
COMMUNICATION BEHIND BARSTDCJ REHABILITATION PROGRAMS DIVISION
AUGUST 2011
FY 2006 RELEASE COHORT FY 2007 RELEASE COHORT
TYPE OF CORRECTIONAL
FACILITY
OFFENSE OF INITIAL
SENTENCING
REELASED AS % OF COHORT
% OF COHORT INITIAL OFFENSE GROUP RE-
INCARCERATED WITHIN 3 YEARS
released as % of cohort
% OF COHORT INITIAL OFFENSE GROUP RE-
INCARCERATED WITHIN 3 YEARS
SUBSTANCE ABYSE FELONY PUNISHMENT
FACILITIES
VIOLENT 18.2% 41.2% 19.1% 45.1%PROPERTY 24.8% 48.2% 24.8% 49.0%
DRUGS 38.8% 36.8% 40.0% 36.0%
OTHER 15.7% 32.8% 16.0% 32.0%
IN-PRISON THERAPEUTIC COMMUNITIES
VIOLENT 10.6% 26.5% 8.7% 26.1% PROPERTY 22.6% 34.4% 23.0% 27.9%
DRUGS 52.5% 19.0% 54.2% 23.5%
OTHER 14.3% 25.0% 14.1% 23.2%
STATE JAILS
VIOLENT 1.0% 22.0% 1.1% 18.6% PROPERTY 43.2% 33.6% 44.1% 34.6%
DRUGS 44.0% 32.1% 42.4% 29.5%
OTHER 11.8% 31.2% 12.4% 31.3%
STATE PRISONS
VIOLENT 26.1% 20.8% 25.9% 20.2%PROPERTY 22.6% 34.1% 21.6% 32.2%
DRUGS 31.6% 25.6% 31.7% 24.0%
OTHER 17.8% 24.1% 20.8% 21.5%
INTERMEDIATE SANCTION FACILITIES
VIOLENT 16.1% 43.1% 16.6% 38.6%PROPERTY 36.7% 46.8% 34.8% 44.5%
DRUGS 35.7% 40.4% 36.9% 37.5%
OTHER 11.4% 38.5% 11.8% 37.5%

EDUCATIONTHE UNMET NEED
Source: Gaes, G. G. (2008). The impact of prison-education programs on post-release outcomes. Re-entry roundtable on education
Wolf Harlow. C. (2003). Education and Correctional Population. Bureau of Justice Statistics.
One cost-efficient and successful way to reduce violence in correctional facilities and decrease recidivism levels is through education.
It is important to keep in mind that people who make up the incarcerated population are, in fact, those who have had the least opportunity to succeed prior to imprisonment.
Prisoners are under-educated in comparison to the community and have lower literacy skills to handle everyday tasks that they confront. (Bureau of Justice Statistics)
About 75% of state prison inmates, almost 59% of Federal inmates, and 69% of state jail inmates did not have not completed high school. In comparison, only about 18% of the general population have not graduated from high-school.
COMMUNICATION BEHIND BARSTDCJ REHABILITATION PROGRAMS DIVISION
AUGUST 2011

EDUCATION
1 in 6 jail inmates dropped out of school because they were convicted of a crime, sent to a correctional facility, or otherwise involved in illegal activities.
Ca. 50% of state prison inmates reported they have participated in an educational program since their most recent admission to prison.
Ca. 25% state prison and jail inmates have taken basic education or high school level course and about one third have taken vocational courses.
About 35% of State inmates, 33% of Federal inmates, 22% of jail inmates, and 11% of probationers had successfully passed the GED while incarcerated.
COMMUNICATION BEHIND BARSTDCJ REHABILITATION PROGRAMS DIVISION
AUGUST 2011
Source: Gaes, G. G. (2008). The impact of prison-education programs on post-release outcomes. Re-entry roundtable on education
Wolf Harlow. C. (2003). Education and Correctional Population. Bureau of Justice Statistics.

EDUCATIONTHE BENEFITS
Educational programs and vocational training for incarcerated offenders:
COMMUNICATION BEHIND BARSTDCJ REHABILITATION PROGRAMS DIVISION
AUGUST 2011
Source: Gaes, G. G. (2008). The impact of prison-education programs on post-release outcomes. Re-entry roundtable on education
Wolf Harlow. C. (2003). Education and Correctional Population. Bureau of Justice Statistics.
Help incarcerated establish positive communication and relations with others
Increases the offenders’ success in securing employment upon release
Reduce the financial, social, and individual costs of incarceration
Contribute to the reduction of recidivism
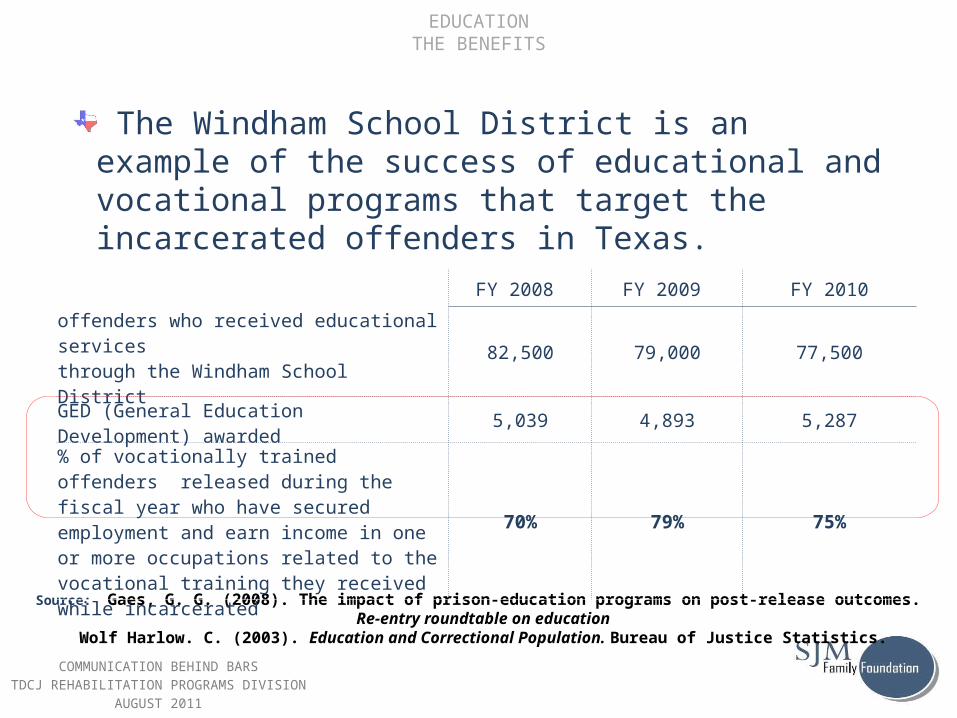
EDUCATIONTHE BENEFITS
The Windham School District is an example of the success of educational and vocational programs that target the incarcerated offenders in Texas.
COMMUNICATION BEHIND BARSTDCJ REHABILITATION PROGRAMS DIVISION
AUGUST 2011
Source: Gaes, G. G. (2008). The impact of prison-education programs on post-release outcomes. Re-entry roundtable on education
Wolf Harlow. C. (2003). Education and Correctional Population. Bureau of Justice Statistics.
FY 2008 FY 2009 FY 2010
offenders who received educational services through the Windham School District
82,500 79,000 77,500
GED (General Education Development) awarded
5,039 4,893 5,287
% of vocationally trained offenders released during the fiscal year who have secured employment and earn income in one or more occupations related to the vocational training they received while incarcerated
70% 79% 75%


