
In-Network Management Rolf Stadler KTH Royal Institute of
41
In-Network Management Rolf Stadler KTH Royal Institute of Technology KTH Royal Institute of Technology Stockholm, Sweden 19th International Conference on Computer Communication and Networks (ICCCN 2010) August 2–5, 2010, Zurich, Switzerland
Transcript of In-Network Management Rolf Stadler KTH Royal Institute of

To help protect your privacy, PowerPoint prevented this external picture from being automatically downloaded. To download and display this picture, click Options in the Message Bar, and then click Enable external content.
In-Network Management
Rolf StadlerKTH Royal Institute of TechnologyKTH Royal Institute of Technology
Stockholm, Sweden
19th International Conference on Computer Communication and Networks (ICCCN 2010) August 2–5, 2010, Zurich, Switzerland
Outline
N t k M t• Network Management
• In-Network ManagementIn Network Management
• Case Study: Real-time Monitoring
• Will it happen?
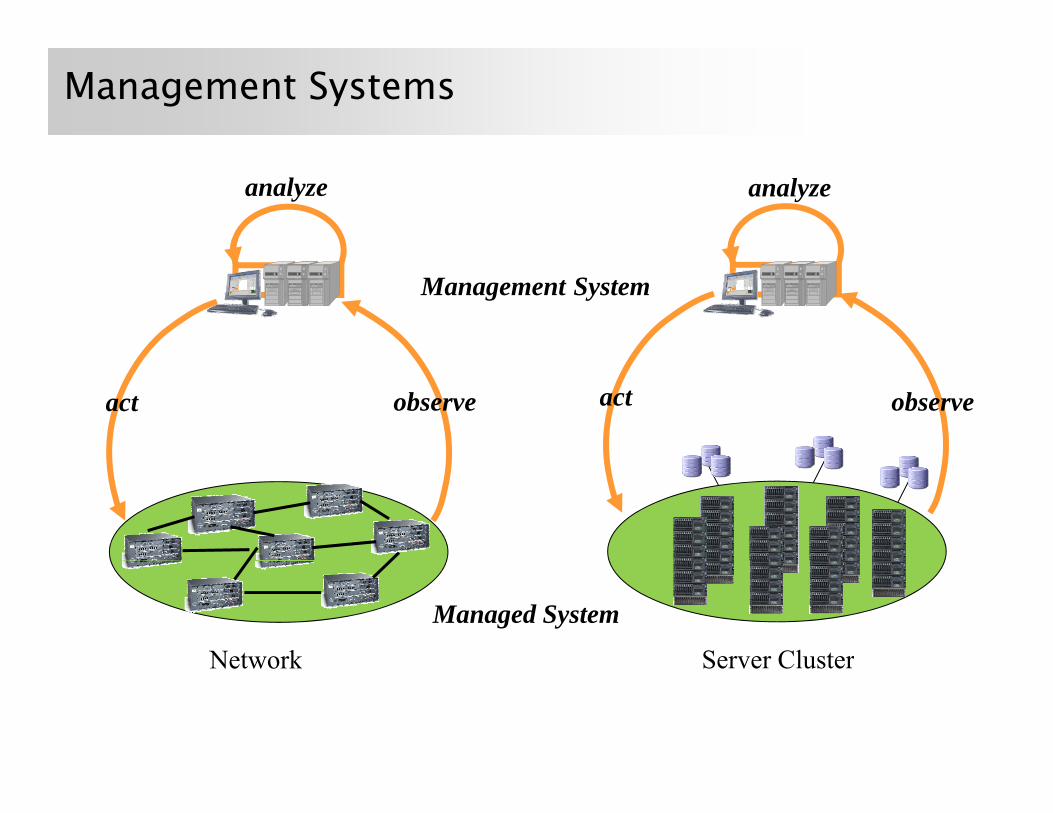
Management Systems
analyzeanalyze
Management System
act observe act observe
Network Server Cluster
Managed System
Network Server Cluster
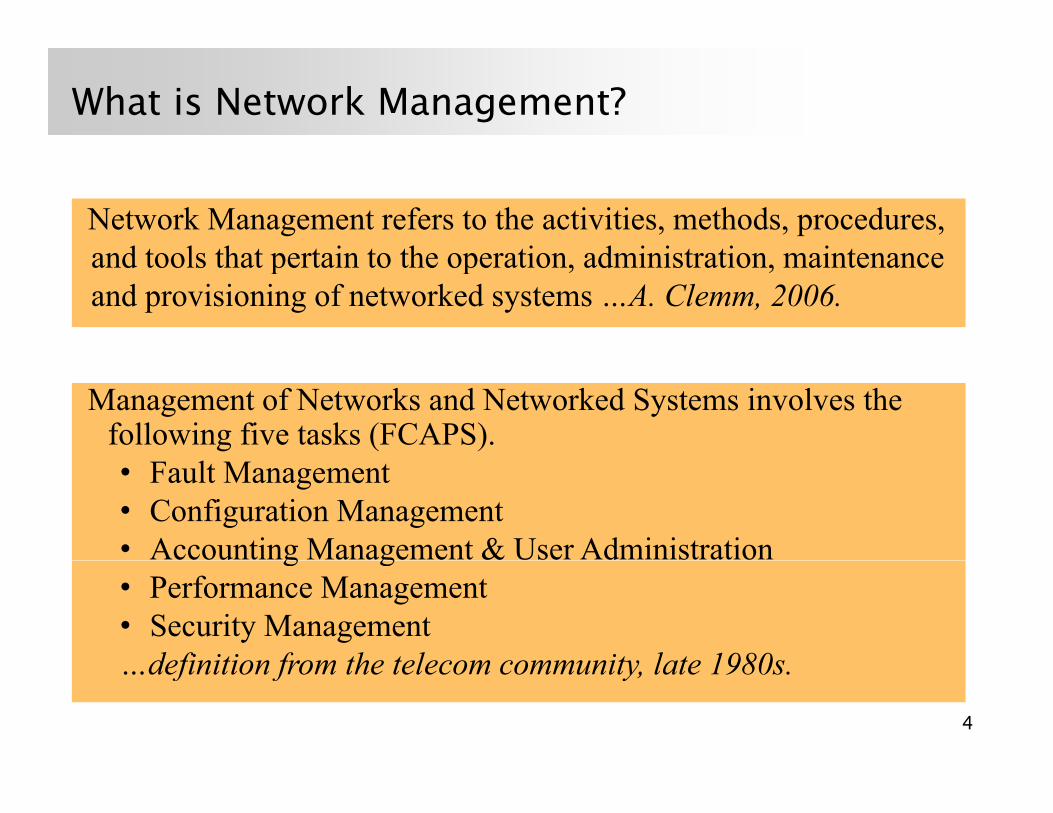
What is Network Management?
Network Management refers to the activities, methods, procedures,and tools that pertain to the operation administration maintenanceand tools that pertain to the operation, administration, maintenance and provisioning of networked systems …A. Clemm, 2006.
Management of Networks and Networked Systems involves the following five tasks (FCAPS).• Fault Management• Configuration Management• Accounting Management & User Administrationg g• Performance Management • Security Management
definition from the telecom community late 1980s
4
…definition from the telecom community, late 1980s.
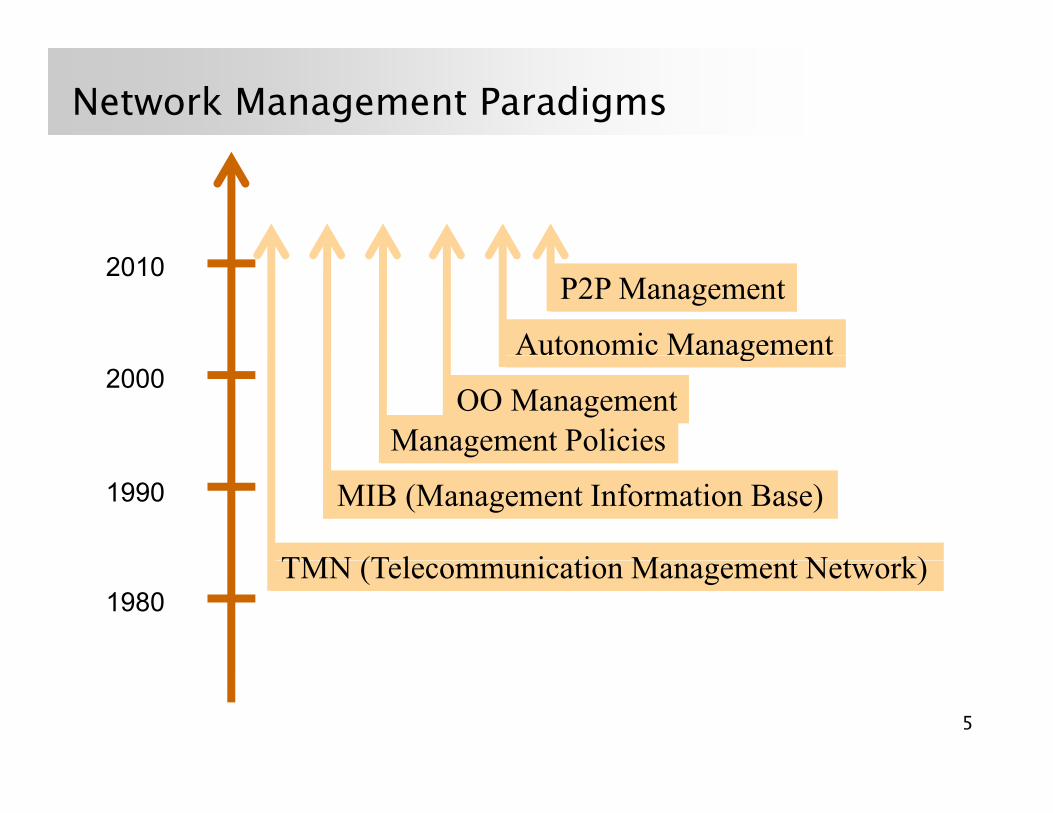
Network Management Paradigms
2010
Autonomic Management
P2P Management
2000
Management PoliciesOO Management
g
1990
TMN (T l i ti M t N t k)
MIB (Management Information Base)
1980TMN (Telecommunication Management Network)
5
Network Management Conferences
Yearly conference in spring:
• IEEE/IFIP IM (International Symposium on Integrated ( y p gNetwork Management)
• IEEE/IFIP NOMS (Network Operations and ManagementIEEE/IFIP NOMS (Network Operations and Management Symposium)
Single track event in fall:Single-track event in fall:
• IEEE DSOM (Distributed Systems Operation and M t)Management)
• IEEE CNSM (Conference on Network and Service Management)

Network Management Journals
• IEEE Transactions on Network and Service Management (TNSM)since 2007
• Journal of Network and Service Management (JNSM)since 1993, published by Springer
• IEEE Communications MagazineSeries on Network and Service Management twice a year

N t k M t• Network Management
• In-Network ManagementIn Network Management
• Case Study: Real-time Monitoring
• Will it happen?
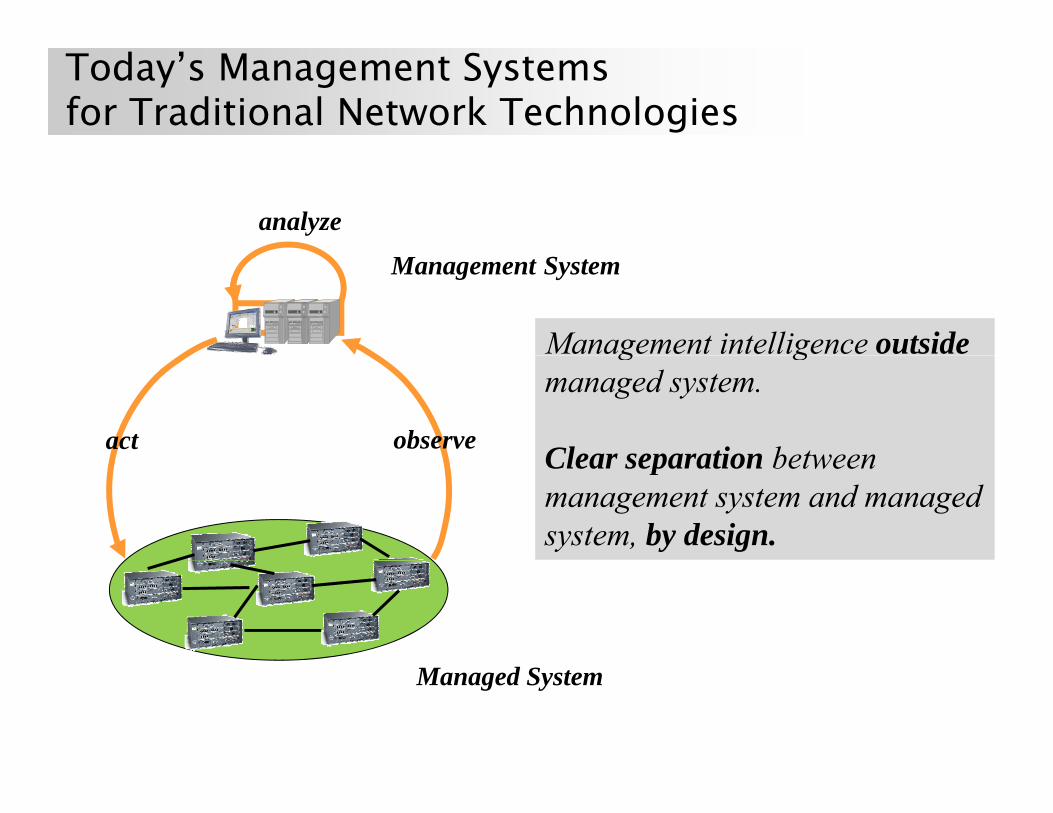
Today’s Management Systemsfor Traditional Network Technologies
analyze
Management System
Management intelligence outside
act observe
g gmanaged system.
Clear separation betweenClear separation between management system and managed system, by design.
Managed System
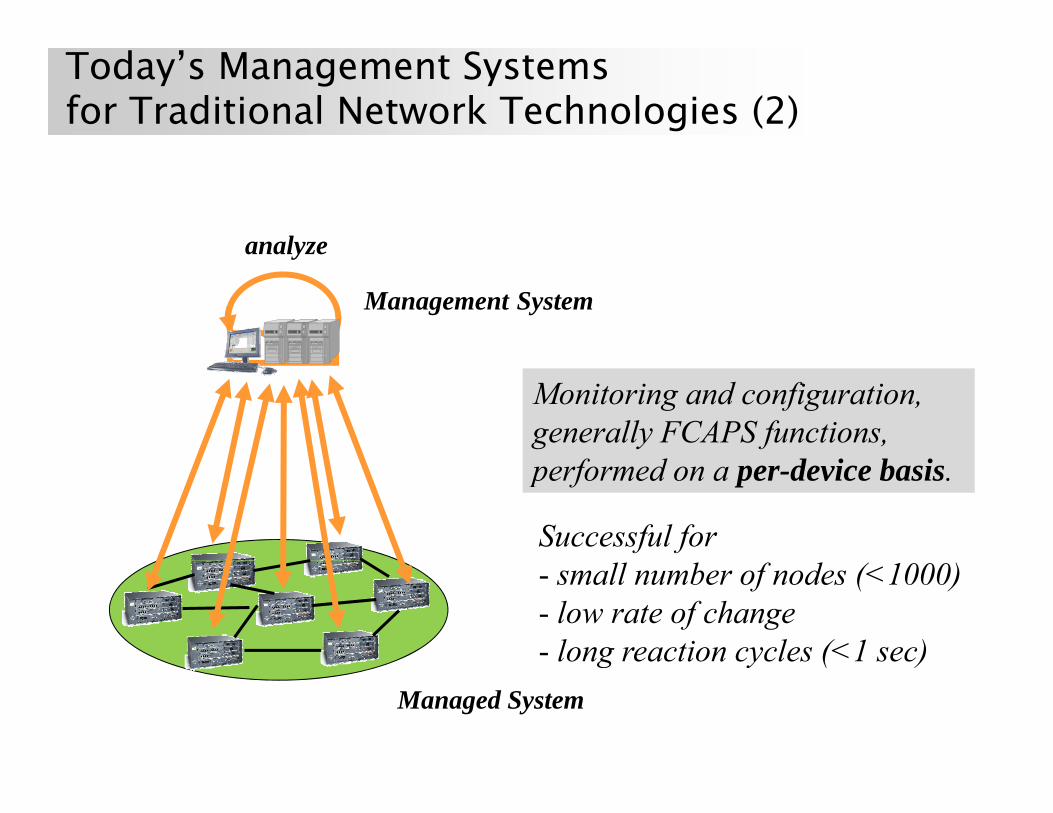
Today’s Management Systemsfor Traditional Network Technologies (2)
analyzeanalyze
Management System
Monitoring and configuration,generally FCAPS functions, performed on a per-device basis.
Successful for- small number of nodes (<1000)- low rate of change- long reaction cycles (<1 sec)
Managed System
g y ( )
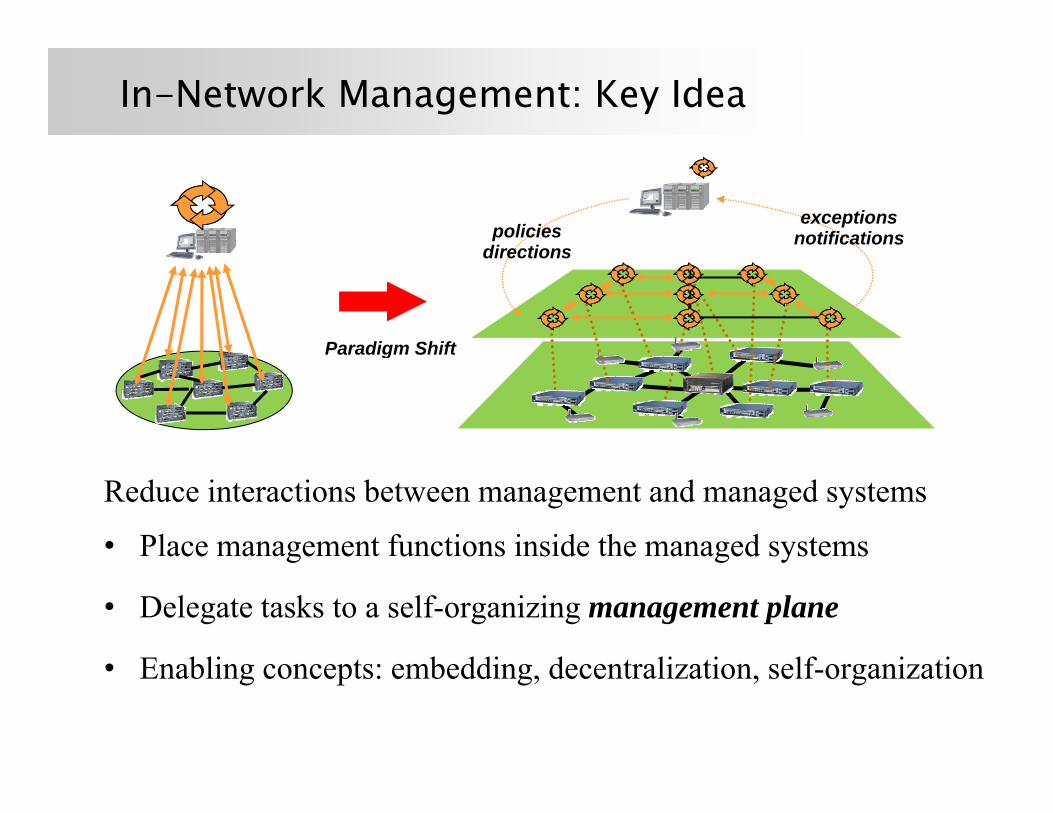
In-Network Management: Key Idea
exceptionsnotificationspolicies
directions
Paradigm Shift
directions
g
Reduce interactions between management and managed systems
• Place management functions inside the managed systemsg g y
• Delegate tasks to a self-organizing management plane
E bli t b ddi d t li ti lf i ti• Enabling concepts: embedding, decentralization, self-organization
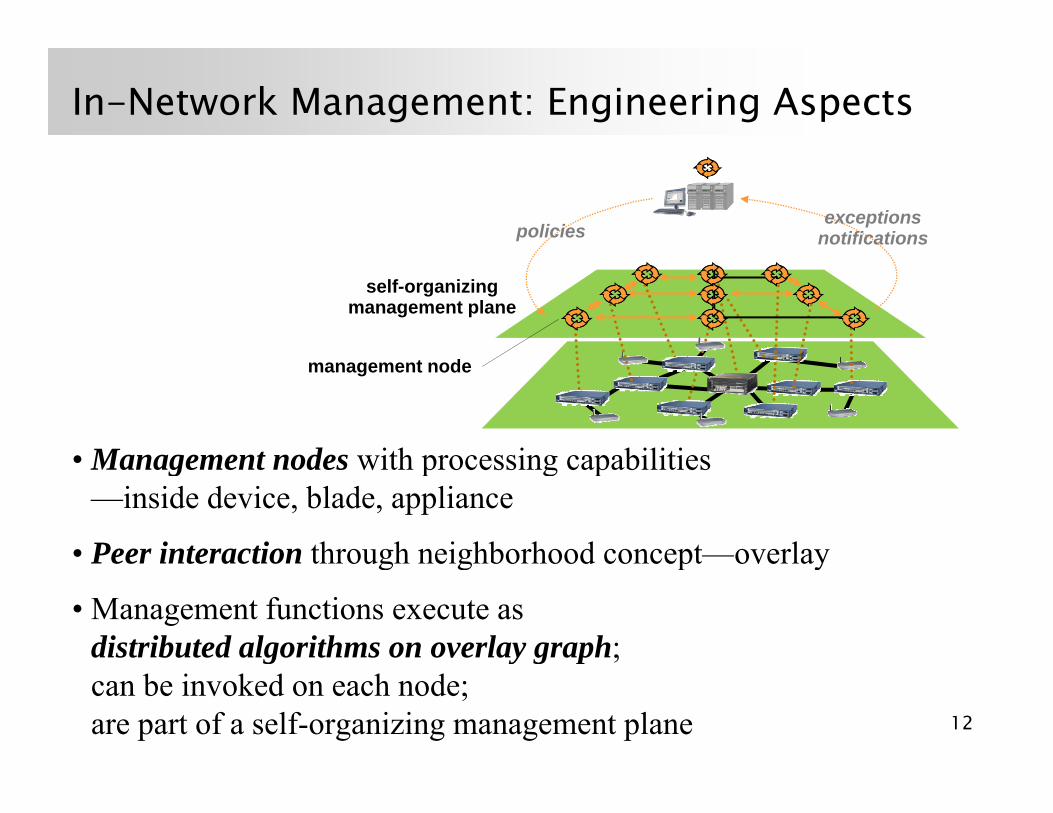
In-Network Management: Engineering Aspects
exceptionsnotificationspolicies
self-organizingmanagement plane
• Management nodes with processing capabilities
management node
• Management nodes with processing capabilities—inside device, blade, appliance
• Peer interaction through neighborhood concept—overlayPeer interaction through neighborhood concept overlay
• Management functions execute as distributed algorithms on overlay graph; g y g pcan be invoked on each node;are part of a self-organizing management plane 12
The Drivers for In-Network Management
• Lack of management infrastructureenergy-constraint environment
---sensor networks, MANETs, vehicular networks
• Avoiding bottlenecks in large-scale systems---access networks, data centers, managed end-devices
• Shorten reaction time-dynamic environments-mission-critical networks
• State can be estimated and acted upon inside the network- Fault managementR ti ll ti- Routing, resource allocation
13
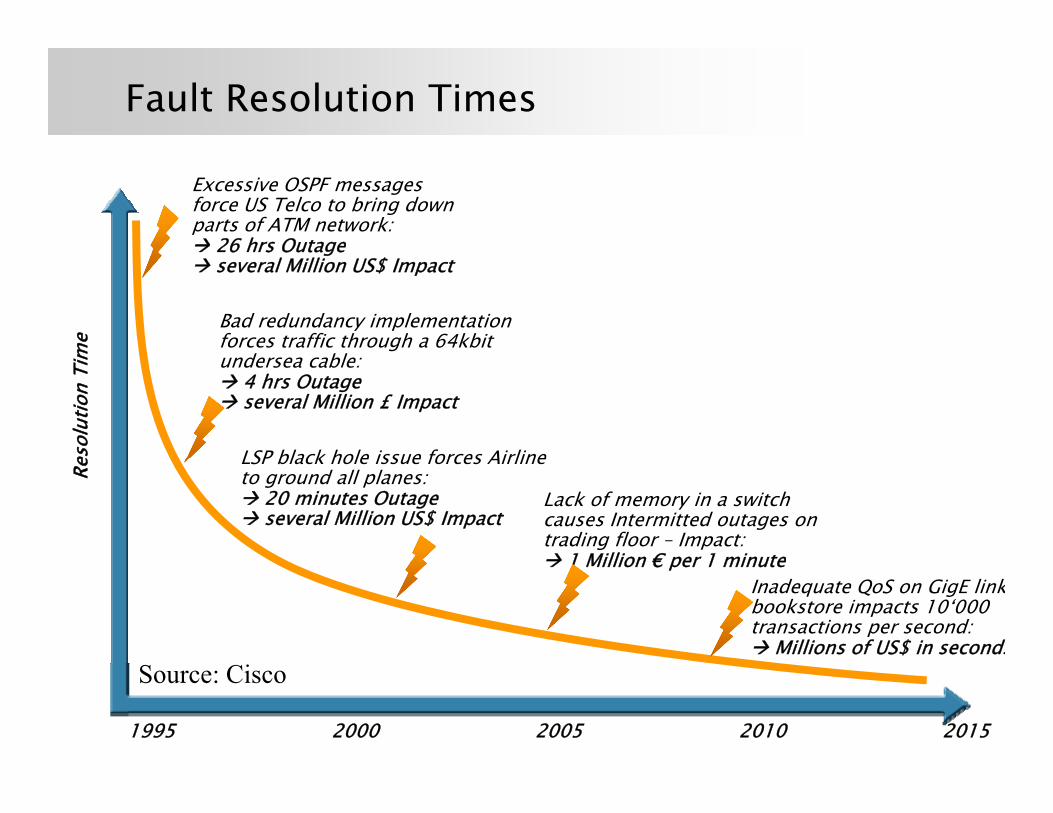
Fault Resolution Times
Excessive OSPF messages force US Telco to bring down parts of ATM network:
26 hrs Outage
me
gseveral Million US$ Impact
Bad redundancy implementation forces traffic through a 64kbit
d bl
esol
utio
n Ti
m undersea cable:4 hrs Outageseveral Million £ Impact
LSP black hole issue forces Airline
Re
Lack of memory in a switch causes Intermitted outages on trading floor – Impact:
1 Million € per 1 minute
LSP black hole issue forces Airline to ground all planes:
20 minutes Outageseveral Million US$ Impact
1 Million € per 1 minuteInadequate QoS on GigE linkbookstore impacts 10‘000 transactions per second:
Millions of US$ in seconds
1995 2000 2005 2010 2015
Source: Cisco
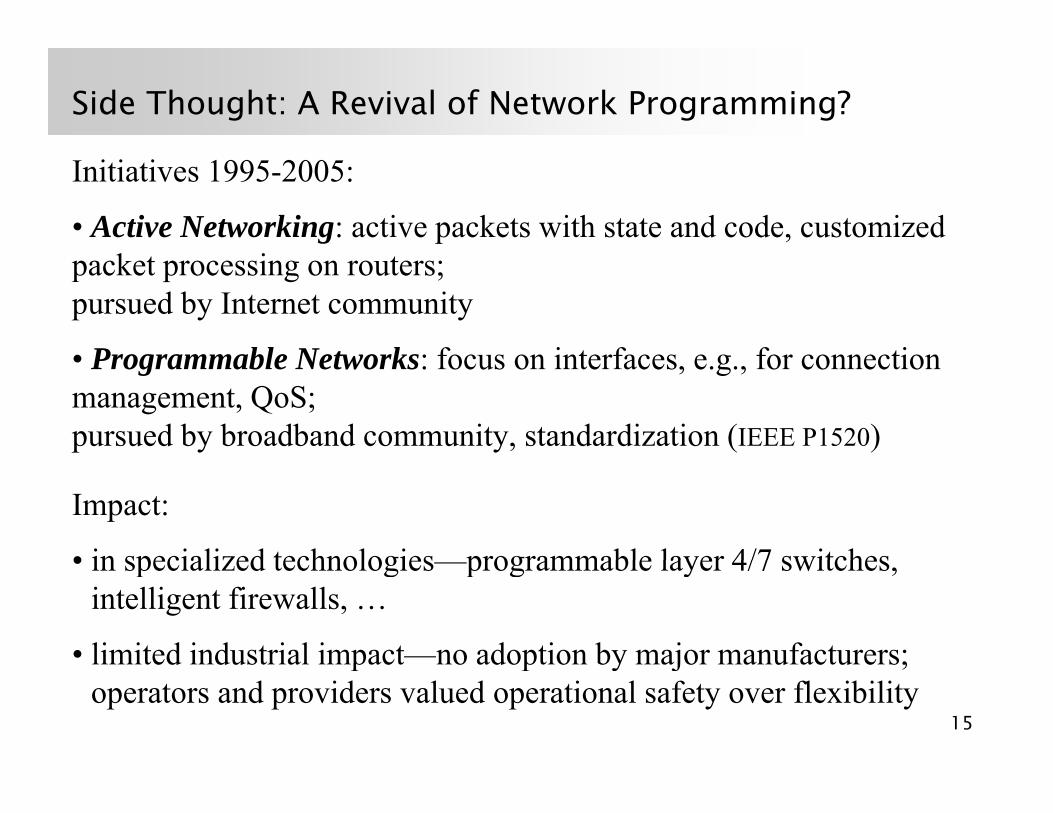
Side Thought: A Revival of Network Programming?
Initiatives 1995-2005:
• Active Networking: active packets with state and code, customized packet processing on routers; pursued by Internet community
• Programmable Networks: focus on interfaces e g for connection• Programmable Networks: focus on interfaces, e.g., for connection management, QoS; pursued by broadband community, standardization (IEEE P1520)
Impact:
• in specialized technologies programmable layer 4/7 switches• in specialized technologies—programmable layer 4/7 switches, intelligent firewalls, …
• limited industrial impact—no adoption by major manufacturers;limited industrial impact no adoption by major manufacturers; operators and providers valued operational safety over flexibility
15
N t k M t• Network Managements
• In-Network ManagementIn Network Management
• Case Study: Real-time Monitoring
• Will it happen?
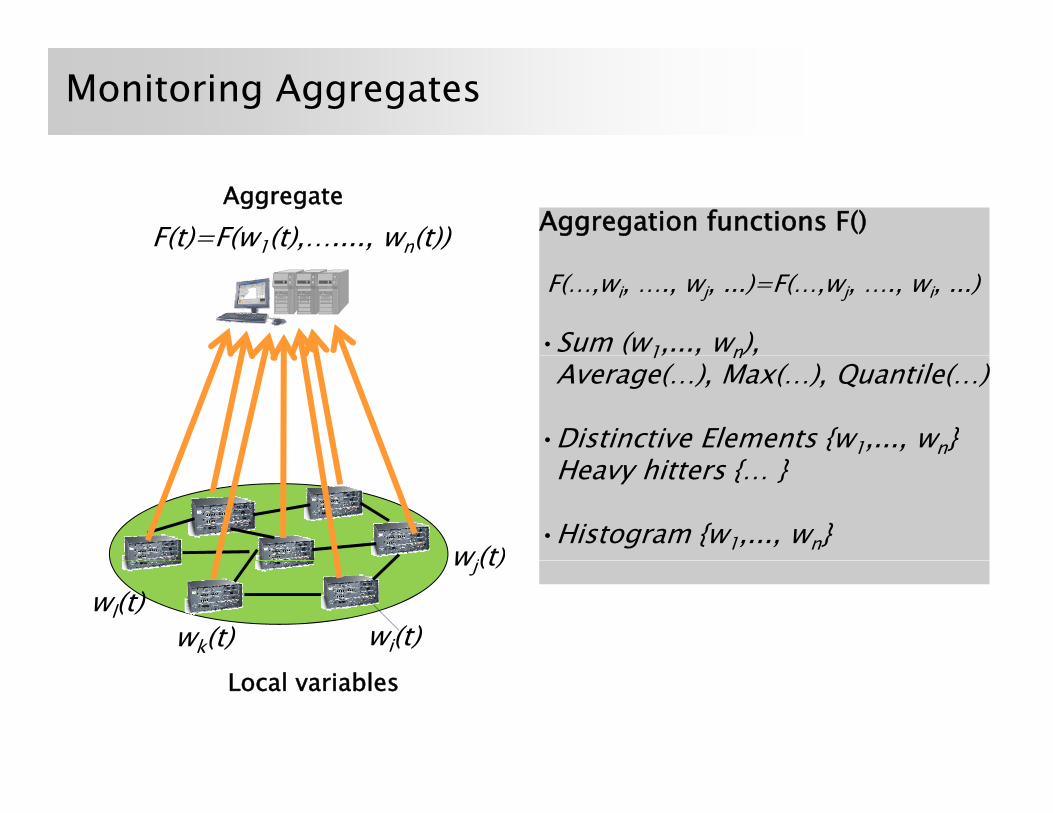
Monitoring Aggregates
F(t)=F(w1(t),…...., wn(t))Aggregation functions F()
Aggregate
F(…,wi, …., wj, ...)=F(…,wj, …., wi, ...)
•Sum (w1,..., wn), 1, , n ,Average(…), Max(…), Quantile(…)
•Distinctive Elements {w1,..., wn}
wj(t)
Heavy hitters {… }
•Histogram {w1,..., wn}
wk(t)
wj(t)
wi(t)wl(t)
Local variables
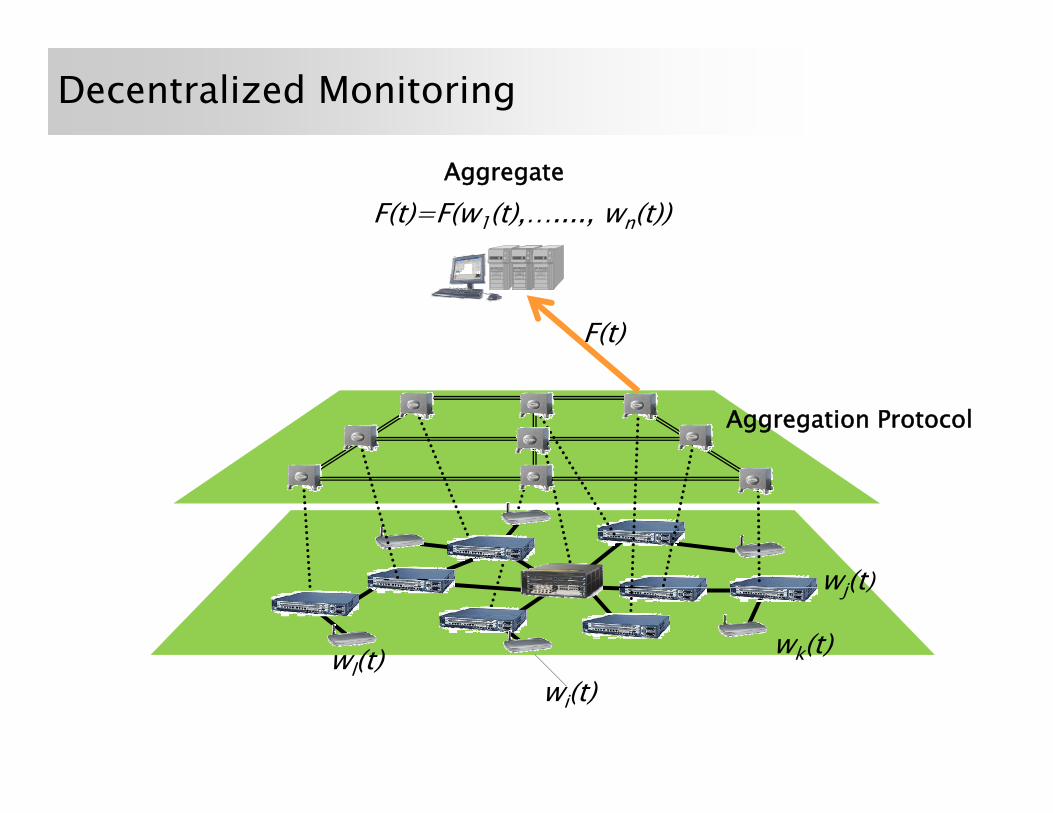
Decentralized Monitoring
F(t)=F(w1(t),…...., wn(t))Aggregate
F(t)
Aggregation Protocol
wl(t)wk(t)
wj(t)
wi(t) wl(t)
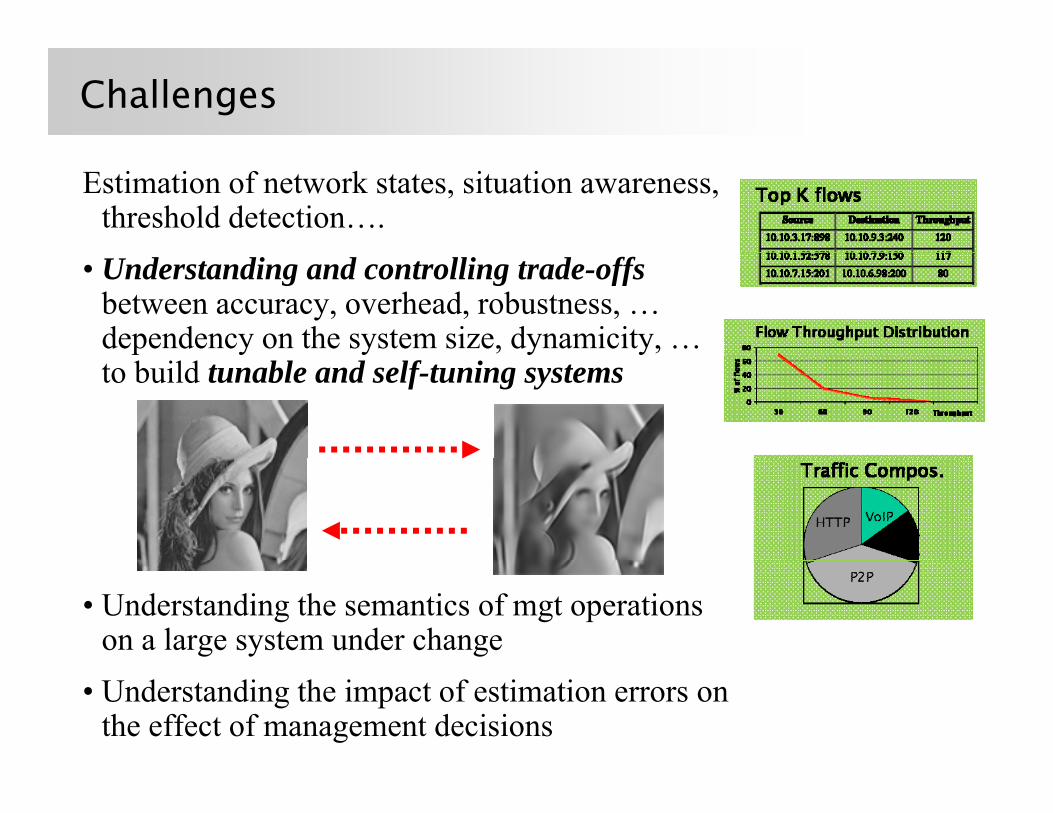
Challenges
Estimation of network states, situation awareness, threshold detection….
• Understanding and controlling trade-offsbetween accuracy, overhead, robustness, …dependency on the system size, dynamicity, …to build tunable and self-tuning systems
• Understanding the semantics of mgt operationson a large system under change
• Understanding the impact of estimation errors onthe effect of management decisions
A-GAP: Protocol design goals
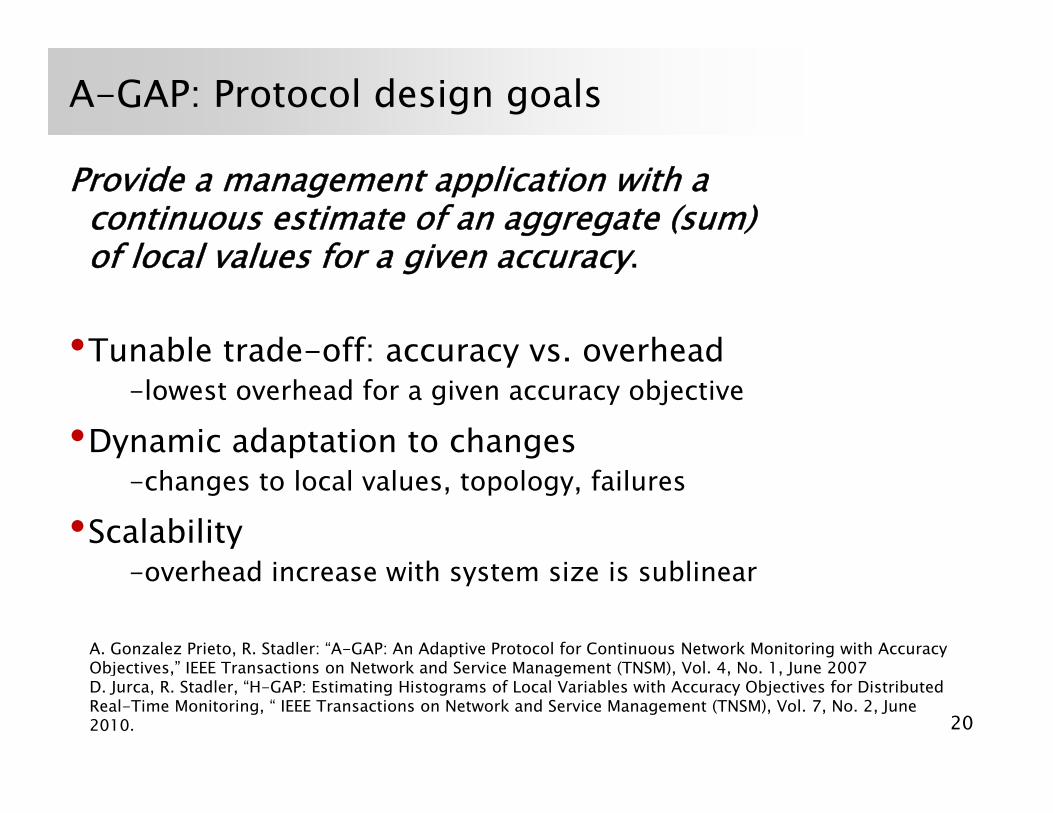
Provide a management application with a continuous estimate of an aggregate (sum) of local values for a given accuracyof local values for a given accuracy.
•Tunable trade-off: accuracy vs overheadTunable trade off: accuracy vs. overhead-lowest overhead for a given accuracy objective
•Dynamic adaptation to changesy p g-changes to local values, topology, failures
•Scalability-overhead increase with system size is sublinear
A. Gonzalez Prieto, R. Stadler: “A-GAP: An Adaptive Protocol for Continuous Network Monitoring with Accuracy Obj i ” IEEE T i N k d S i M (TNSM) V l 4 N 1 J 2007
20
Objectives,” IEEE Transactions on Network and Service Management (TNSM), Vol. 4, No. 1, June 2007D. Jurca, R. Stadler, “H-GAP: Estimating Histograms of Local Variables with Accuracy Objectives for Distributed Real-Time Monitoring, “ IEEE Transactions on Network and Service Management (TNSM), Vol. 7, No. 2, June 2010.
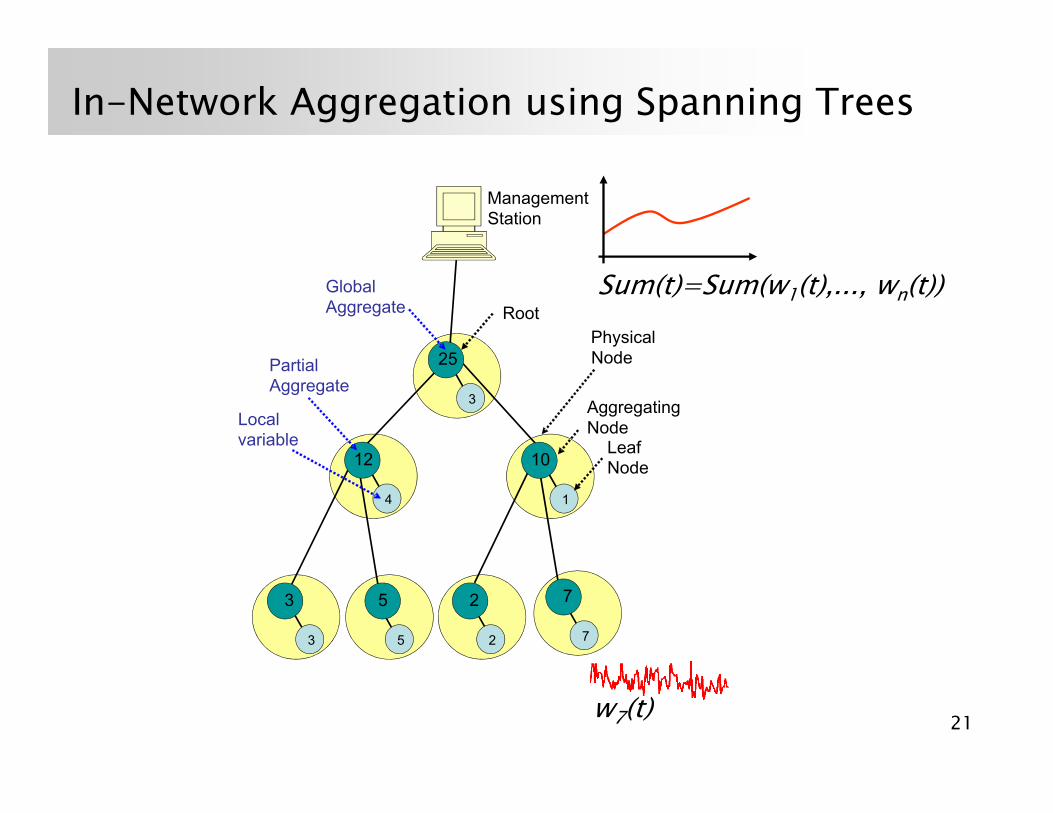
In-Network Aggregation using Spanning Trees
Management Station
Global Aggregate Root
PhysicalNode25
Sum(t)=Sum(w1(t),..., wn(t))
AggregatingNode
Leaf
PartialAggregate
Localvariable
Node
12 10
3
25
Node
4
12
1
10
3
3
5 2
2
7
75
21w7(t)
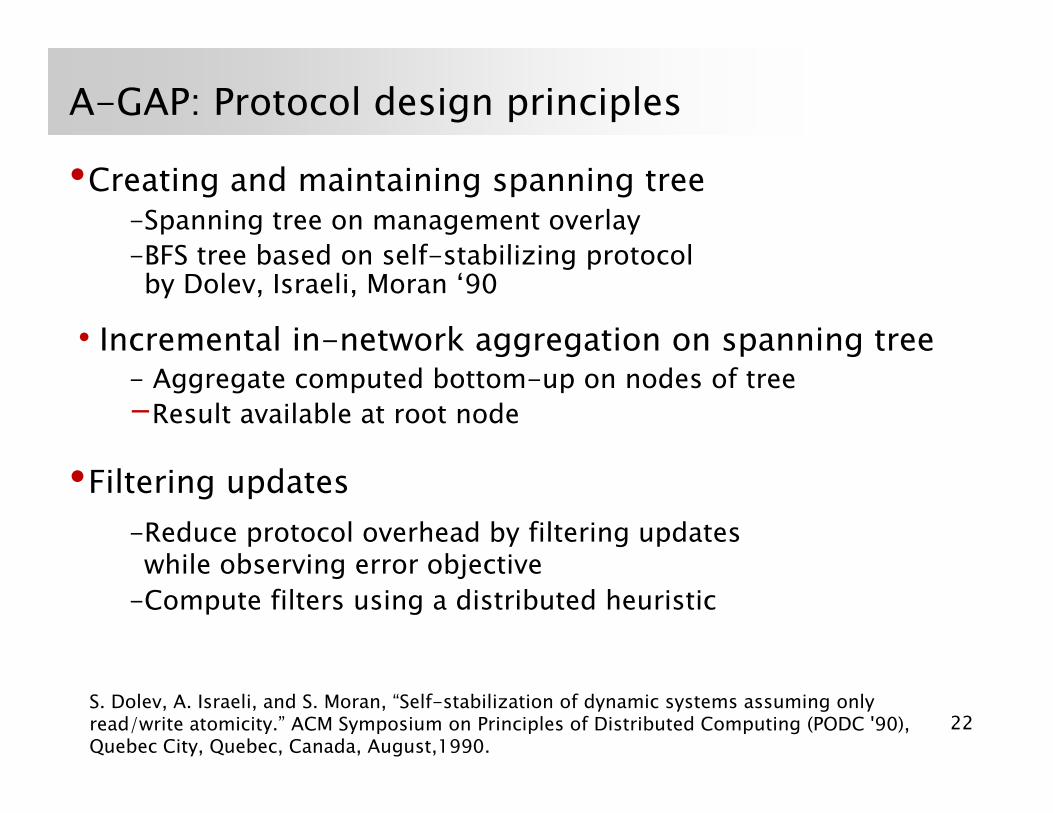
A-GAP: Protocol design principles
•Creating and maintaining spanning tree-Spanning tree on management overlayBFS tree based on self stabilizing protocol-BFS tree based on self-stabilizing protocol by Dolev, Israeli, Moran ‘90
•Incremental in-network aggregation on spanning treegg g p g- Aggregate computed bottom-up on nodes of tree-Result available at root node
•Filtering updates-Reduce protocol overhead by filtering updateswhile observing error objectivewhile observing error objective
-Compute filters using a distributed heuristic
22S. Dolev, A. Israeli, and S. Moran, “Self-stabilization of dynamic systems assuming only read/write atomicity.” ACM Symposium on Principles of Distributed Computing (PODC '90), Quebec City, Quebec, Canada, August,1990.
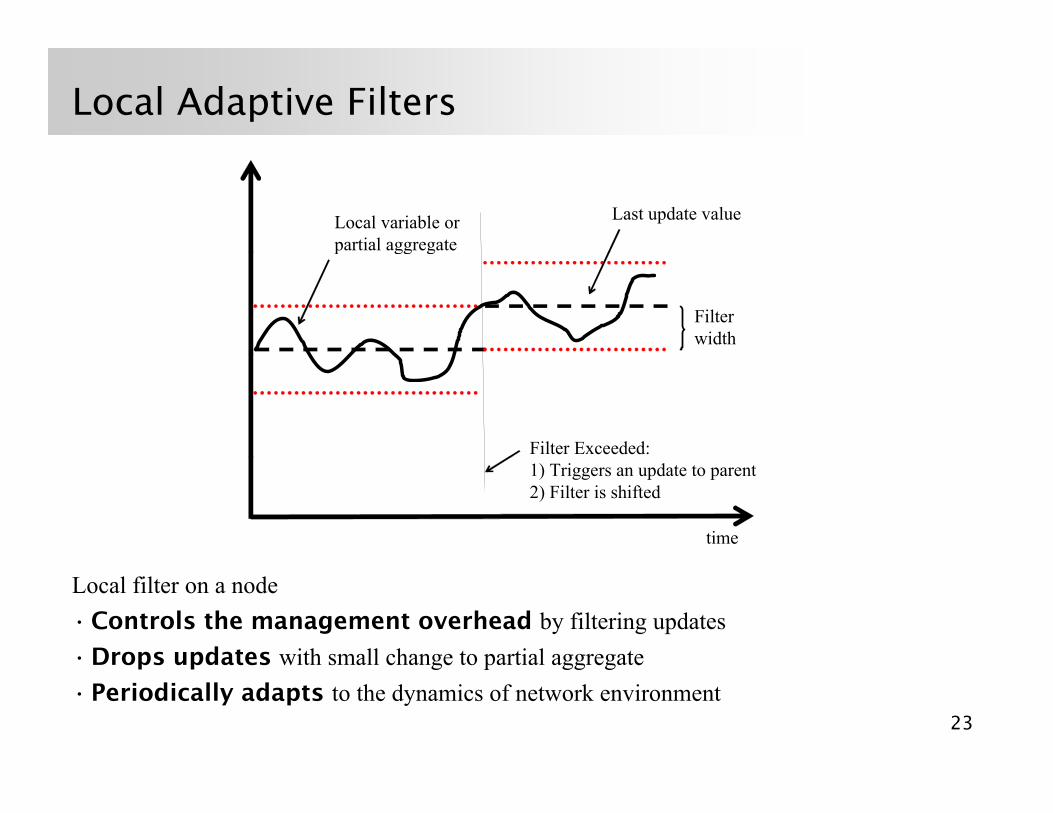
Local Adaptive Filters
Local variable or partial aggregate
Last update value
p gg g
Filter width
Filter Exceeded:
time
1) Triggers an update to parent2) Filter is shifted
Local filter on a node•Controls the management overhead by filtering updates•Drops updates with small change to partial aggregate
23
Drops updates with small change to partial aggregate•Periodically adapts to the dynamics of network environment
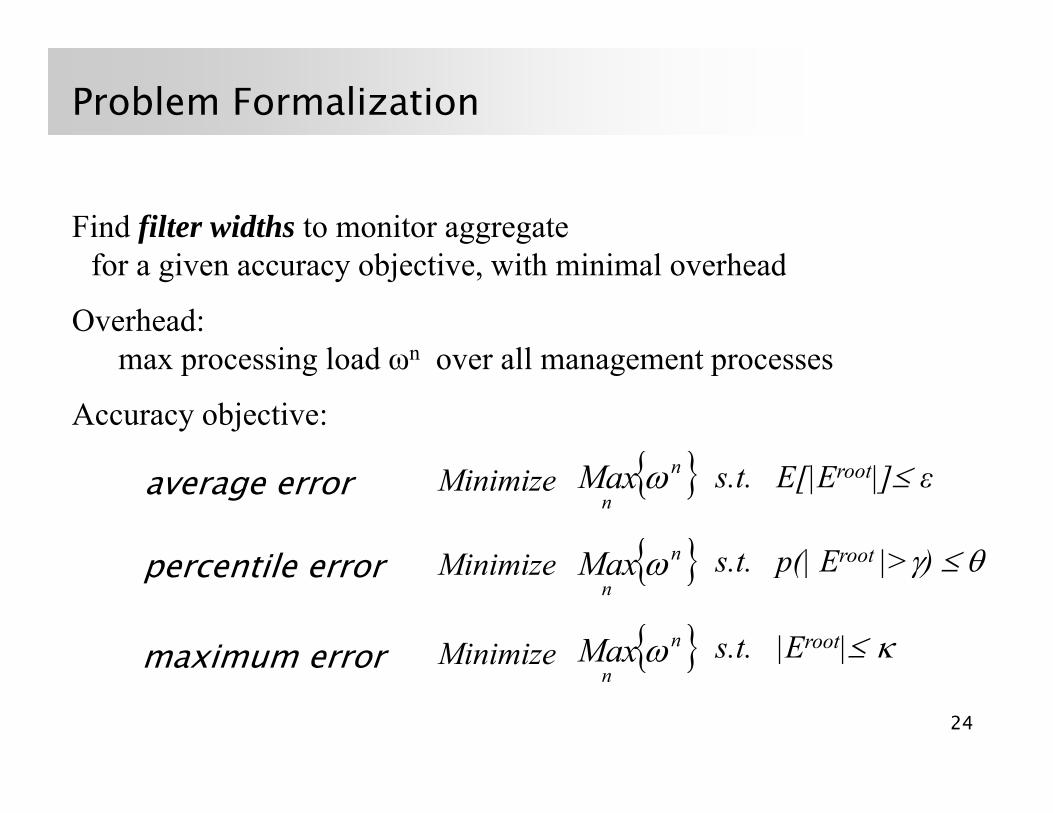
Problem Formalization
Find filter widths to monitor aggregatefor a given accuracy objective, with minimal overhead
Overhead: max processing load ωn over all management processesmax processing load ωn over all management processes
Accuracy objective:
{ }{ }n
nMax ω s.t. E[|Eroot|]≤ εMinimize
{ }nMax ω s t p(| Eroot |>γ) ≤ θMi i i
average error
percentile error { }n
Max ω s.t. p(| Eroot |>γ) ≤ θMinimize
{ }nMax ω s.t. |Eroot|≤ κMinimize
percentile error
maximum error
24
{ }n
| |Minimizemaximum error
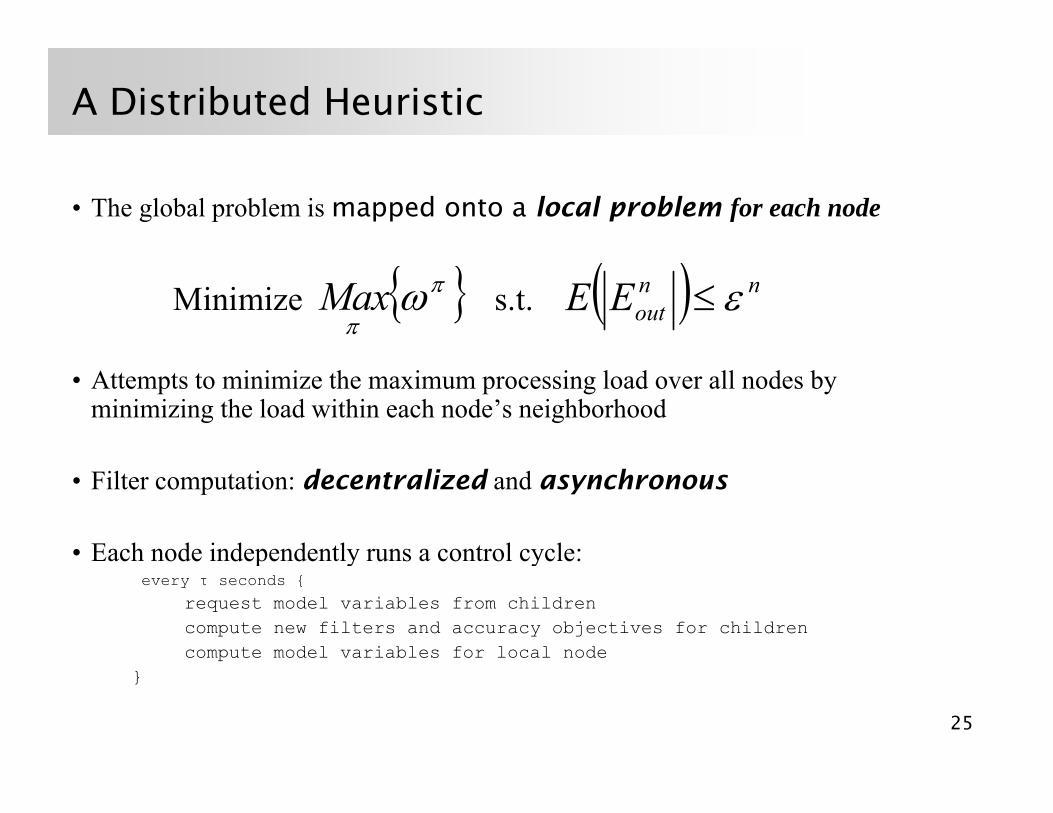
A Distributed Heuristic
• The global problem is mapped onto a local problem for each node
Minimize { }ππ
ωMax s.t. ( ) nnoutEE ε≤
• Attempts to minimize the maximum processing load over all nodes by minimizing the load within each node’s neighborhood
• Filter computation: decentralized and asynchronous
• Each node independently runs a control cycle:Each node independently runs a control cycle:every τ seconds {
request model variables from childrencompute new filters and accuracy objectives for childrencompute model variables for local node
25
}
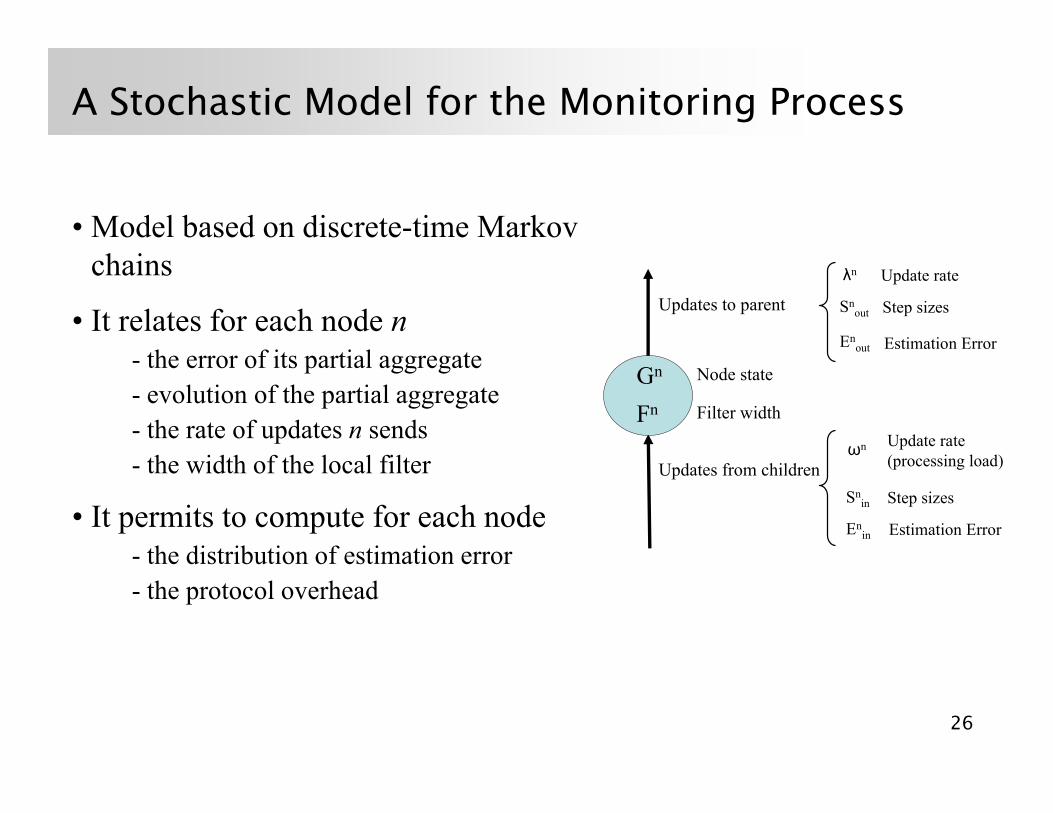
A Stochastic Model for the Monitoring Process
• Model based on discrete-time Markov
Snout
Enout
λn
Updates to parent
Update rate
Step sizes
Estimation Error
chains
• It relates for each node nth f it ti l t Gn
Fn
ωn Update rate( i l d)
Node state
Filter width
- the error of its partial aggregate- evolution of the partial aggregate- the rate of updates n sends
th idth f th l l filtSn
in
Enin
Updates from children (processing load)
Step sizes
Estimation Error
- the width of the local filter
• It permits to compute for each node- the distribution of estimation errorthe distribution of estimation error - the protocol overhead
26

Stochastic Model: leaf node
⎩⎨⎧ ≤+≤−+
=0 otherwise
FXiFXij
nnnnnnn
Estimating step size (MLE)
Evolution of local variable
nX
Transition Matrix
⎩ .0 otherwise
⎩⎨⎧
=≠≤
−−<<−+−=−=
=0
0,)()(
)(n
nnn
nnnnnnn
nnnnij j
jFjiFXiFPiXP
ijXPt
⎩
⎪⎪⎪⎧
>−==∑+
+
−=
)()( FszsGPzXPn n
n
n
F Fd
Fs
Fsz
nnn
Step Size
⎪⎪⎪
⎩
⎪⎨ =−==== ∑ ∑
−=
+
−=
0
0)()()(
otherwise
szdGPzXPsSPn n
F
Fd
Fd
Fdz
nnnout
Estimation Error
Management O erhead
⎪⎩ .0 otherwise
))0(1( nn SPλ
nnout GE =
27
Management Overhead ))0(1( =−= nout
n SPλ
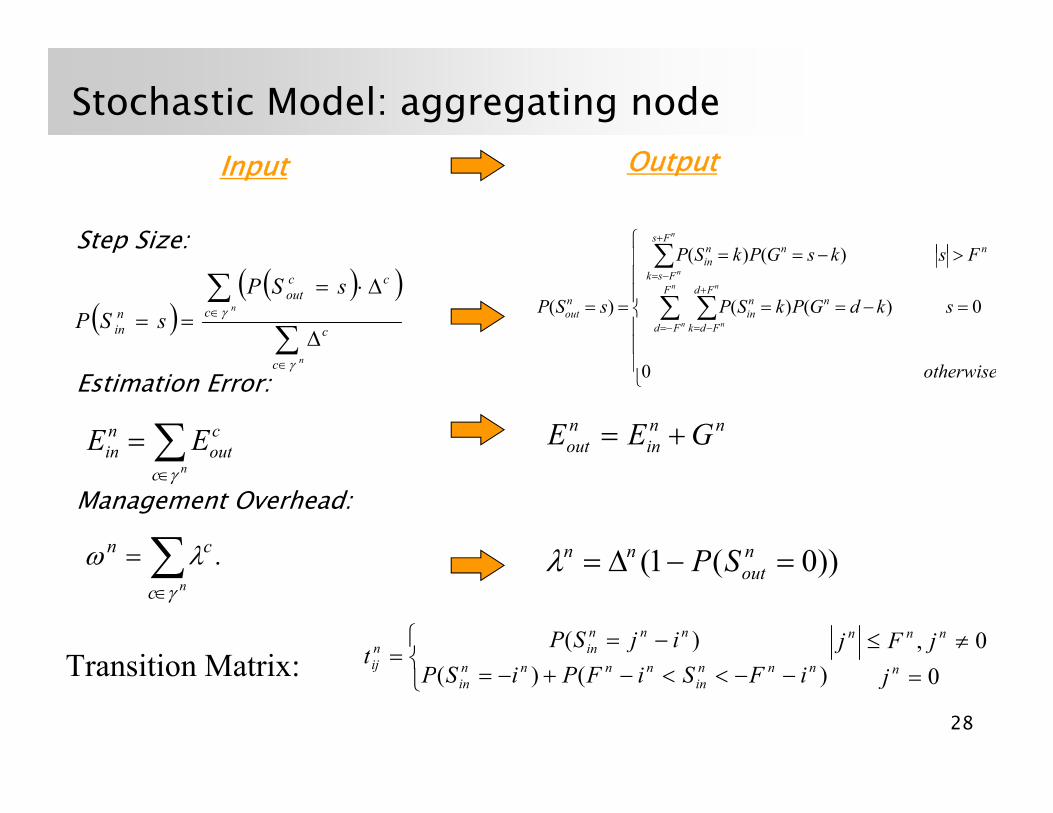
Stochastic Model: aggregating node
Step Size:⎪⎧
>∑+
FsksGPkSPnFs
nnn )()(
Input Output
( )( )( )
∑
∑∈
Δ
Δ⋅=
==n
cc
ccout
nin
sSPsSP γ
⎪⎪⎪
⎪⎪⎪
⎨ =−==
>−==
== ∑ ∑
∑
−=
+
−=
−=
skdGPkSP
FsksGPkSP
sSPn
n
n
n
n
F
Fd
Fd
Fdk
nnin
Fskin
nout 0)()(
)()(
)(
Estimation Error:
∑= cout
nin EE nn
innout GEE +=
∈ nc γ ⎪⎩ otherwise0
∑= cn λω
Management Overhead:
∑∈ nc γ
))0(1( =Δ= nnn SPλ.∑∈
=nc γ
λω ))0(1( =−Δ= outSPλ
Transition Matrix: ⎨⎧ ≠≤−=
=0,)( nnnnnn
innij
jFjijSPt
28
Transition Matrix: ⎩⎨
=−−<<−+−= 0)()( nnnnin
nnnnin
ij jiFSiFPiSPt
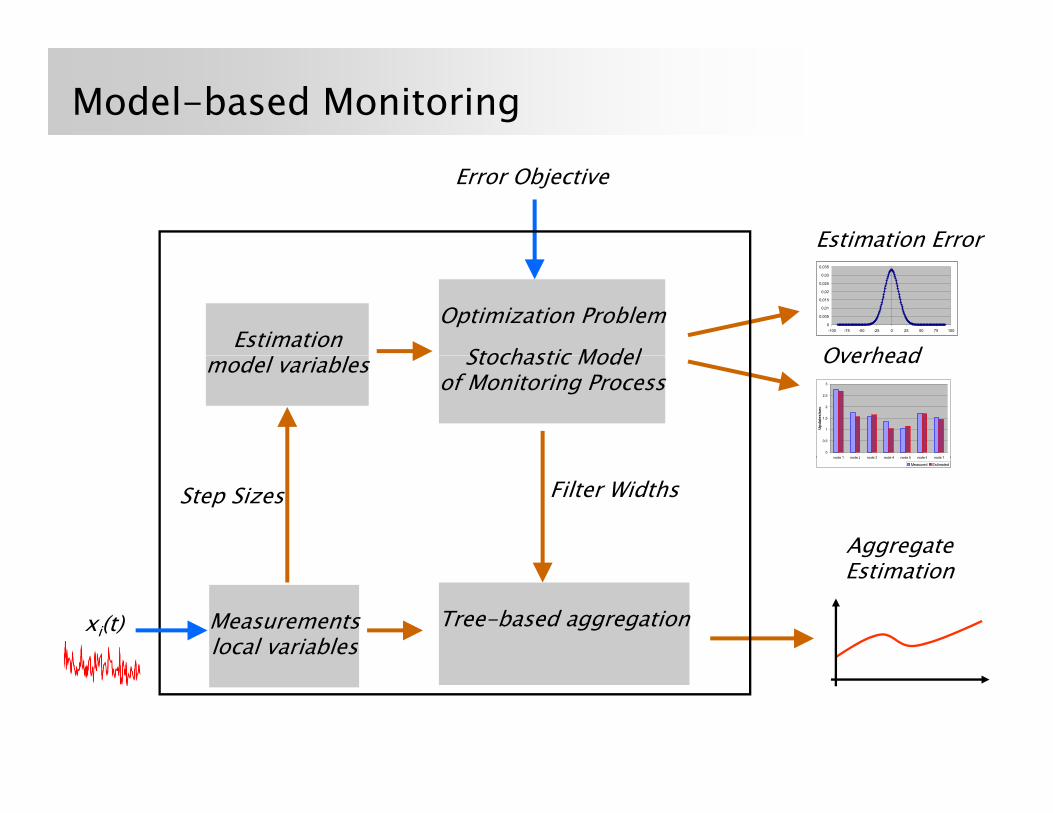
Model-based Monitoring
Error Objective
Estimation Error
0
0,005
0,01
0,015
0,02
0,025
0,03
0,035
-100 -75 -50 -25 0 25 50 75 100Estimation Optimization Problem
Stochastic Model Overheadmodel variables Stochastic Modelof Monitoring Process
Overhead
0
0,5
1
1,5
2
2,5
3
node 1 node 2 node 3 node 4 node 5 node 6 node 7
Upd
ates
/sec
Filter Widths
Aggregate
node 1 node 2 node 3 node 4 node 5 node 6 node 7
Measured Estimated
Step Sizes
Measurementslocal variables
Tree-based aggregation
Estimation
xi(t)
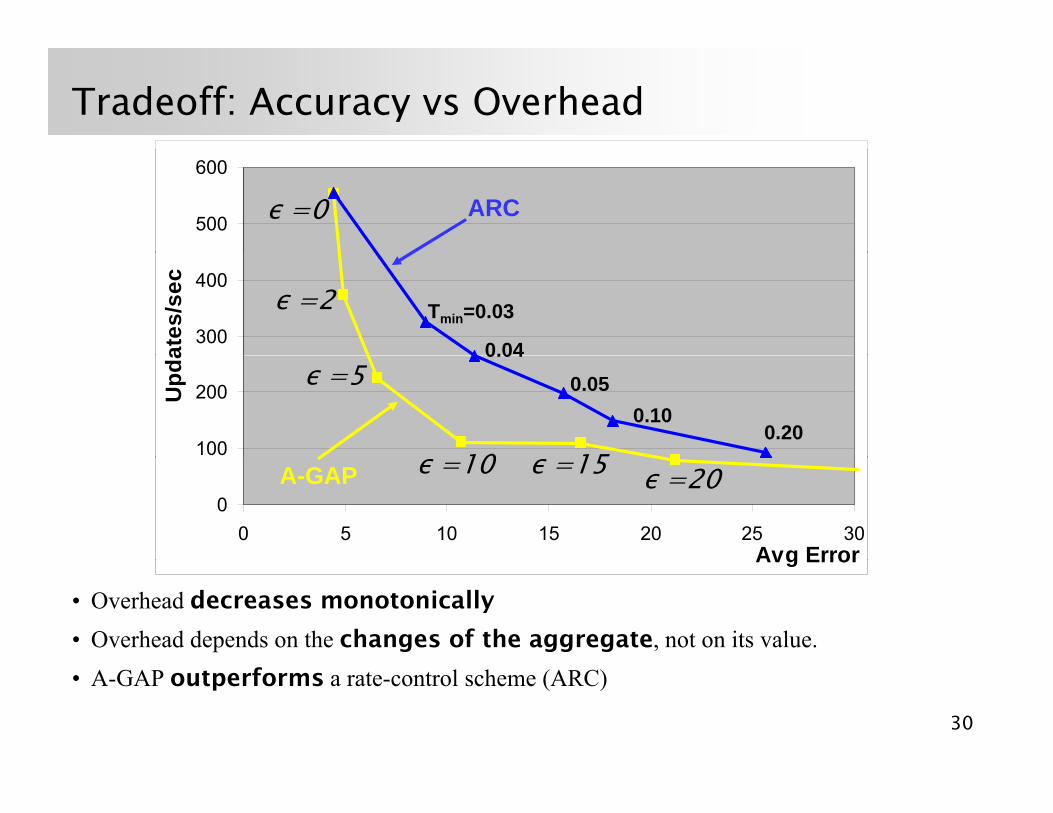
Tradeoff: Accuracy vs Overhead
500
600
ARCε =0
300
400
ates
/sec
Tmin=0.03
0.04
ε =2
100
200Upd
a
0.100.05
0.04
0.20
ε =5
10 150
0 5 10 15 20 25 30Avg Error
A-GAP ε =10 ε =15 ε =20
• Overhead decreases monotonically
• Overhead depends on the changes of the aggregate, not on its value.
Avg Error
30
• A-GAP outperforms a rate-control scheme (ARC)
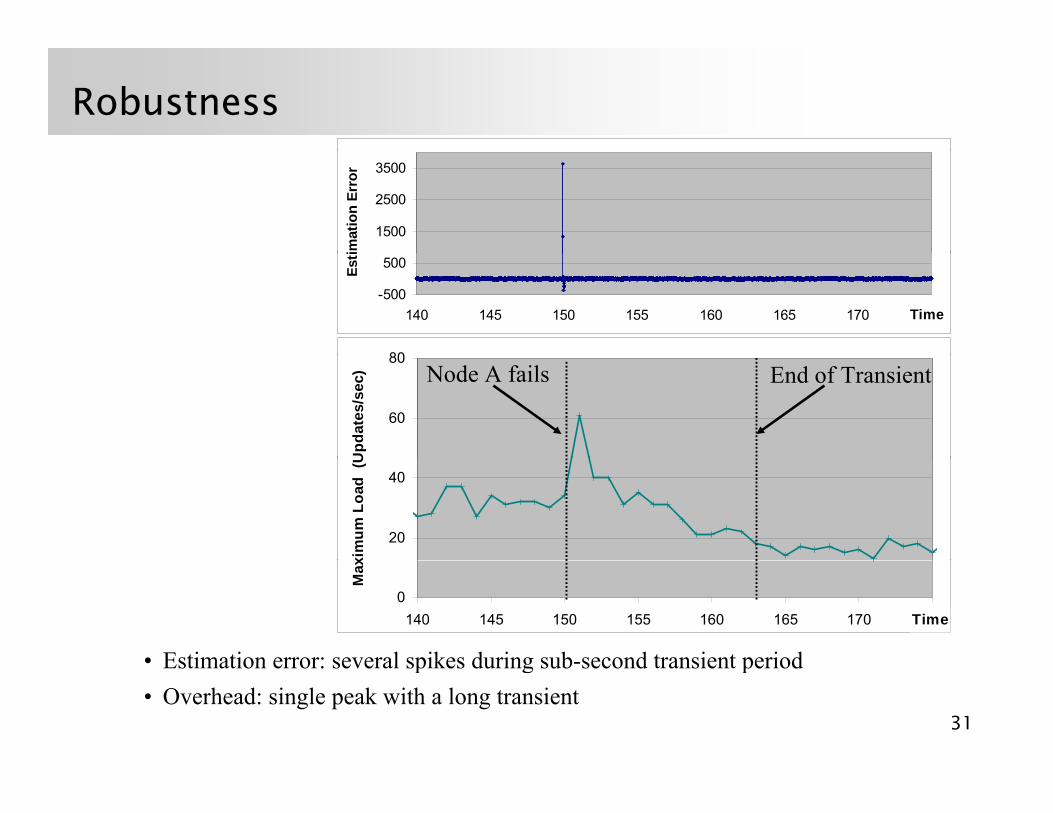
Robustness
1500
2500
3500
imat
ion
Erro
r80
-500
500
140 145 150 155 160 165 170 175Time
Esti
60
80U
pdat
es/s
ec) Node A fails End of Transient
20
40
xim
um L
oad
(U
• Estimation error: several spikes during sub-second transient period
0140 145 150 155 160 165 170 175Time
Max
31
• Estimation error: several spikes during sub-second transient period • Overhead: single peak with a long transient
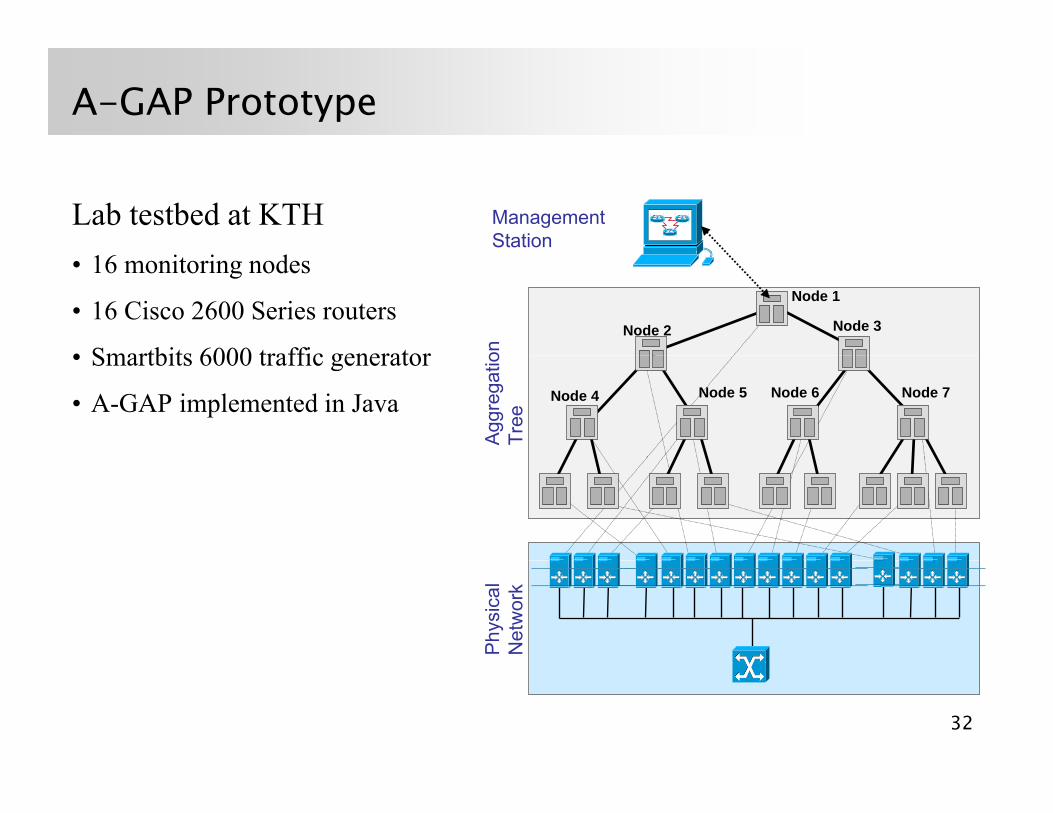
A-GAP Prototype
Management Station
Lab testbed at KTH
on
Node 1
Node 2 Node 3
• 16 monitoring nodes
• 16 Cisco 2600 Series routers
• Smartbits 6000 traffic generator
Aggr
egat
ioTr
ee
Node 4 Node 5 Node 6 Node 7
• Smartbits 6000 traffic generator
• A-GAP implemented in Java
Phy
sica
lN
etw
ork
32
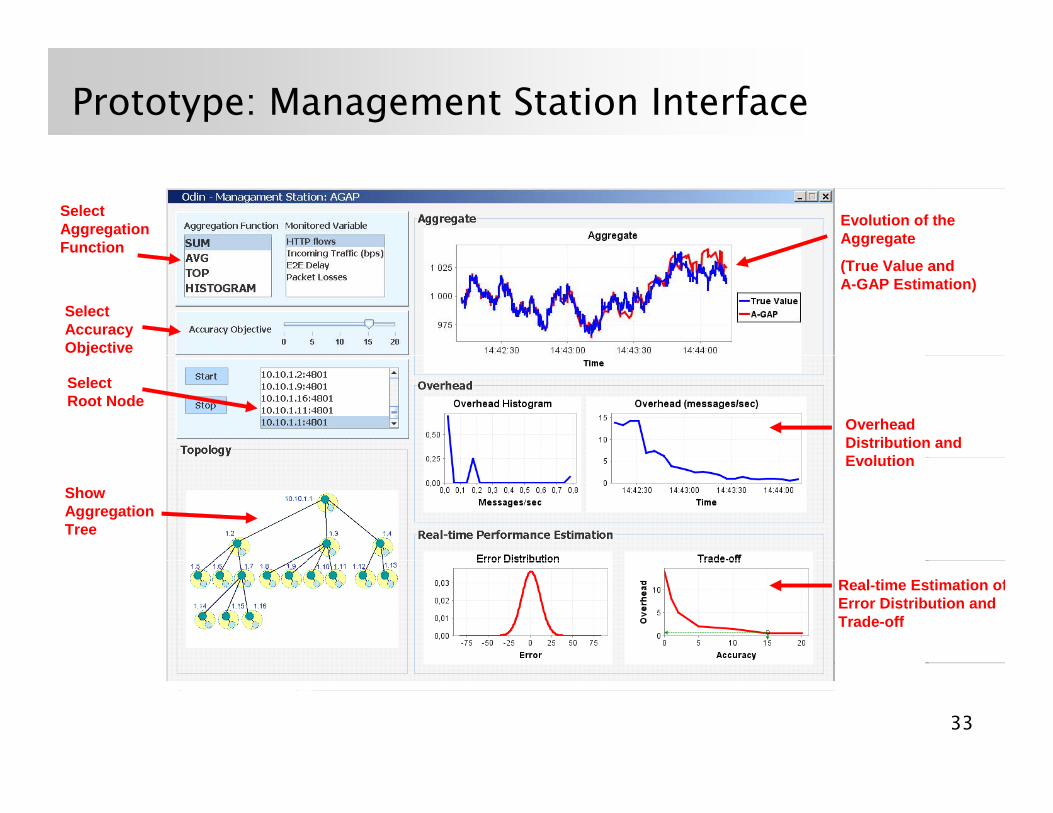
Prototype: Management Station Interface
SelectAggregation Function
Evolution of the Aggregate
SelectAccuracyObjective
(True Value and A-GAP Estimation)
j
Overhead Distribution and E ol tion
SelectRoot Node
Show Aggregation Tree
Evolution
Real-time Estimation ofError Distribution and Trade-off
33
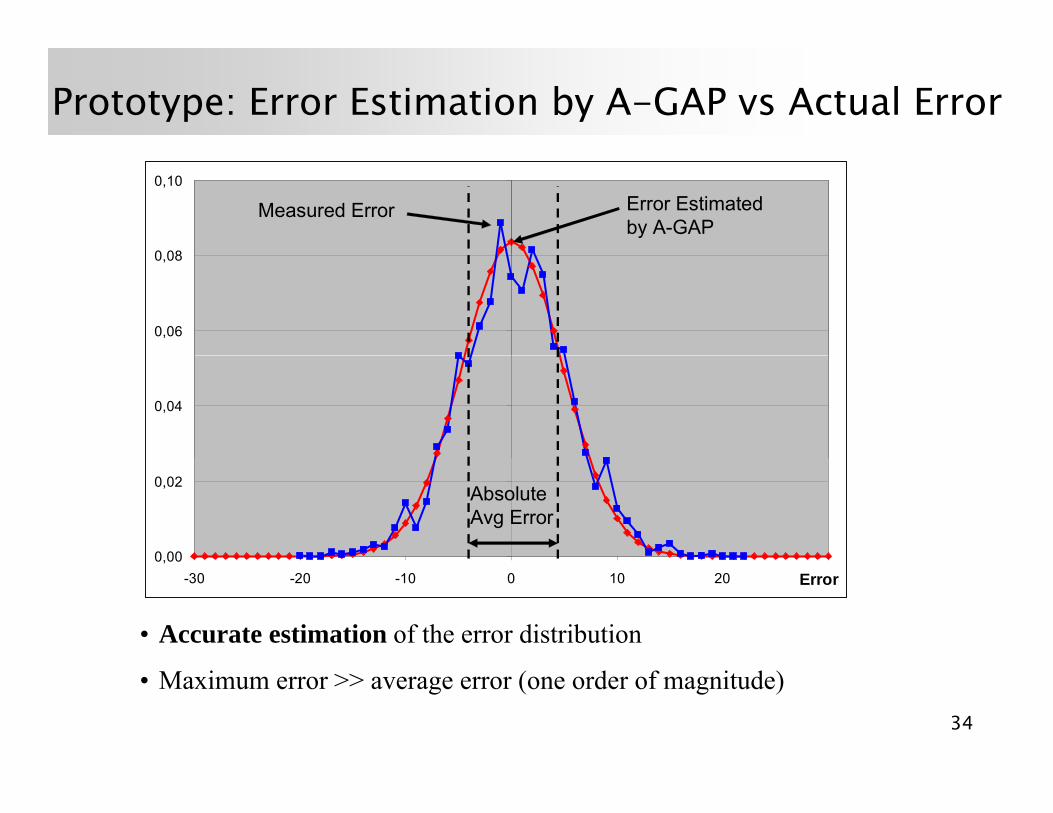
Prototype: Error Estimation by A-GAP vs Actual Error
0 08
0,10
Measured Error Error Estimatedby A-GAP
0,06
0,08
0,04
0,00
0,02Absolute Avg Error
• Accurate estimation of the error distribution
0,00-30 -20 -10 0 10 20 30Error
34
• Maximum error >> average error (one order of magnitude)
Gossip vs. Tree-based Aggregation
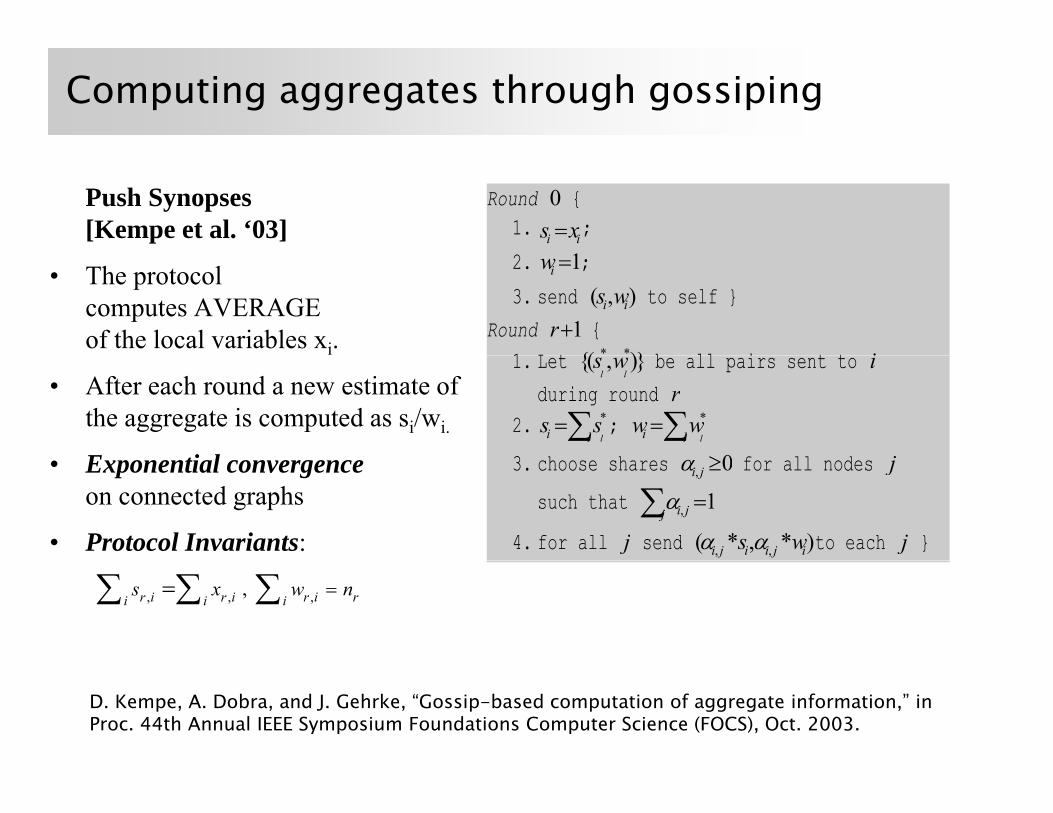
Computing aggregates through gossiping
Push Synopses [Kempe et al. ‘03]
Round 0 { 1. ii xs = ;
• The protocolcomputes AVERAGE of the local variables xi.
2. 1=iw ;
3. send ),( ii ws to self } Round 1+r {
1 L t * *{( )} b ll i t t i• After each round a new estimate of
the aggregate is computed as si/wi.
E ti l
1. Let {( , )}l l
s w be all pairs sent to iduring round r
2. *li l
s s=∑ ; *li l
w w=∑
3 h h 0≥ f ll d j• Exponential convergenceon connected graphs
• Protocol Invariants:
3. choose shares 0, ≥jiα for all nodes j
such that ∑ =j ji 1,α
4. for all j send )*,*( ,, ijiiji ws αα to each j }
, ,r i r ii is x=∑ ∑ , ,r i ri
w n=∑
D. Kempe, A. Dobra, and J. Gehrke, “Gossip-based computation of aggregate information,” in Proc. 44th Annual IEEE Symposium Foundations Computer Science (FOCS), Oct. 2003.
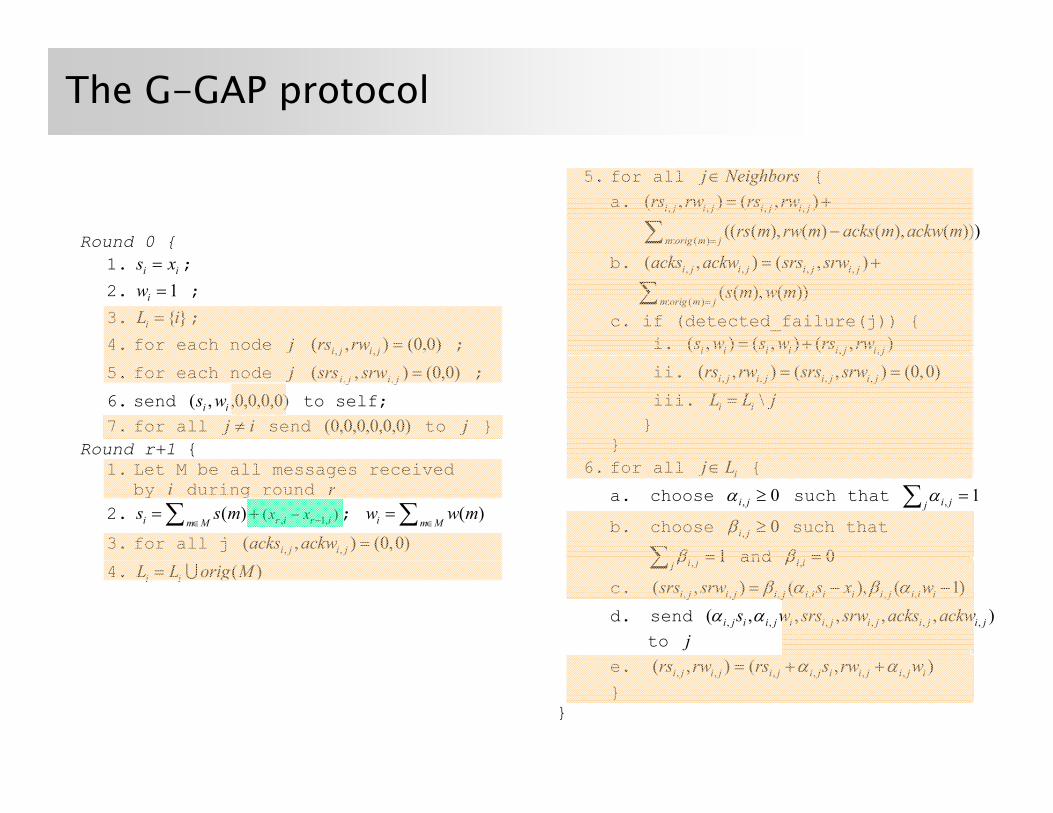
The G-GAP protocol
5. for all j Neighbors∈ { a. , , , ,( , ) ( , )i j i j i j i jrs rw rs rw= +
: ( )
(( ( ), ( ) ( ), ( )))m orig m j
rs m rw m acks m ackw m=
−∑ Round 0 { b. , , , ,( , ) ( , )i j i j i j i jacks ackw srs srw= +
: ( )
( ( ), ( ))m orig m j
s m w m=∑
c. if (detected_failure(j)) { i. , ,( , ) ( , ) ( , )i i i i i j i js w s w rs rw= +
1. ii xs = ;
2. 1=iw ;
3. { }iL i= ;
4. for each node j )0,0(),( ,, =jiji rwrs ; j j
ii. , , , ,( , ) ( , ) (0,0)i j i j i j i jrs rw srs srw= =
iii. \i iL L j= } }
,, jj
5. for each node j )0,0(),( ,, =jiji srwsrs ;
6. send )0,0,0,0,,( ii ws to self; 7. for all ij ≠ send )0,0,0,0,0,0( to j }
Round r+1 { 6. for all ij L∈ {
a. choose 0, ≥jiα such that 1, =∑ j jiα
b. choose 0, ≥jiβ such that
∑ =ji 1β and 0=iiβ
1. Let M be all messages received by i during round r
2. , 1,( )( )i r i r im Mx xs s m −∈
−= +∑ ; ( )i m Mw w m
∈=∑
3. for all j , ,( , ) (0,0)i j i jacks ackw = ∑ j ji 1,β and 0,iiβ
c. , , , , , ,( , ) ( ), ( 1)i j i j i j i i i i i j i i isrs srw s x wβ α β α= − −
d. send , , , , , ,( , , , , , )i j i i j i i j i j i j i js w srs srw acks ackwα α to j
)()( ++
4. ( )i iL L orig M= ∪
e. ),(),( ,,,,,, ijijiijijijiji wrwsrsrwrs αα ++=}
}
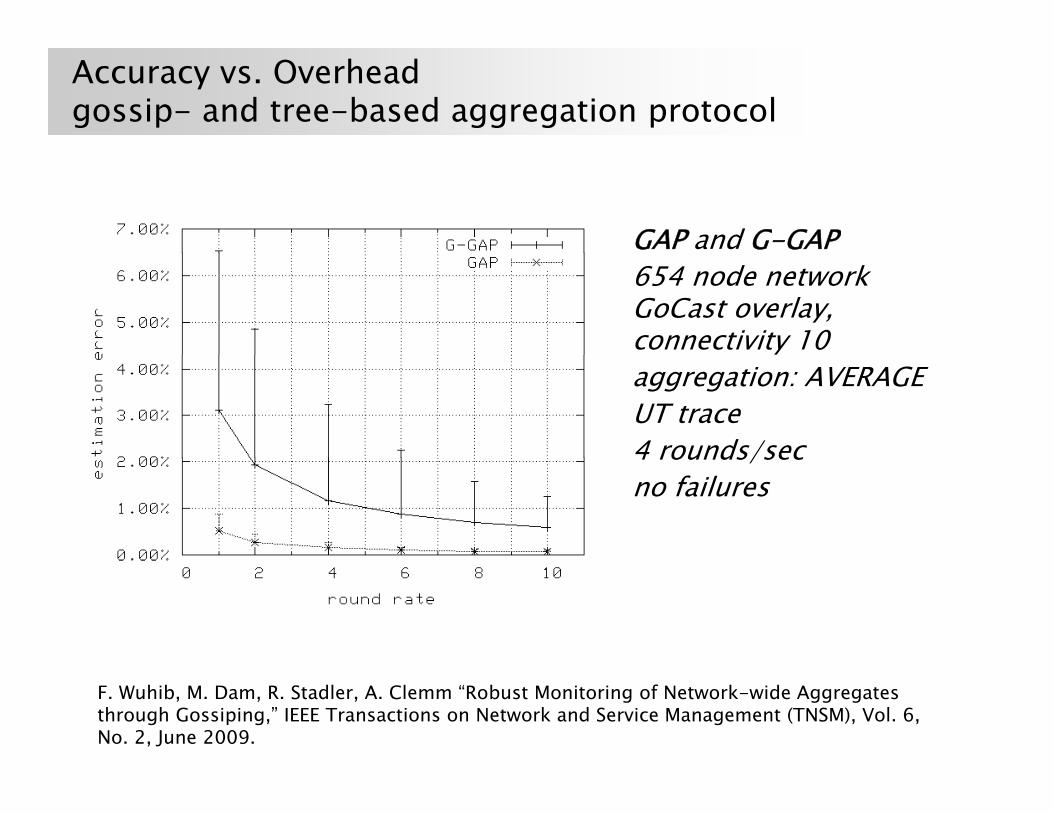
Accuracy vs. Overheadgossip- and tree-based aggregation protocol
GAP and G-GAP654 node networkGoCast overlay, connectivity 10 aggregation: AVERAGEUT trace4 rounds/sec4 rounds/secno failures
F. Wuhib, M. Dam, R. Stadler, A. Clemm “Robust Monitoring of Network-wide Aggregates through Gossiping,” IEEE Transactions on Network and Service Management (TNSM), Vol. 6, No. 2, June 2009.
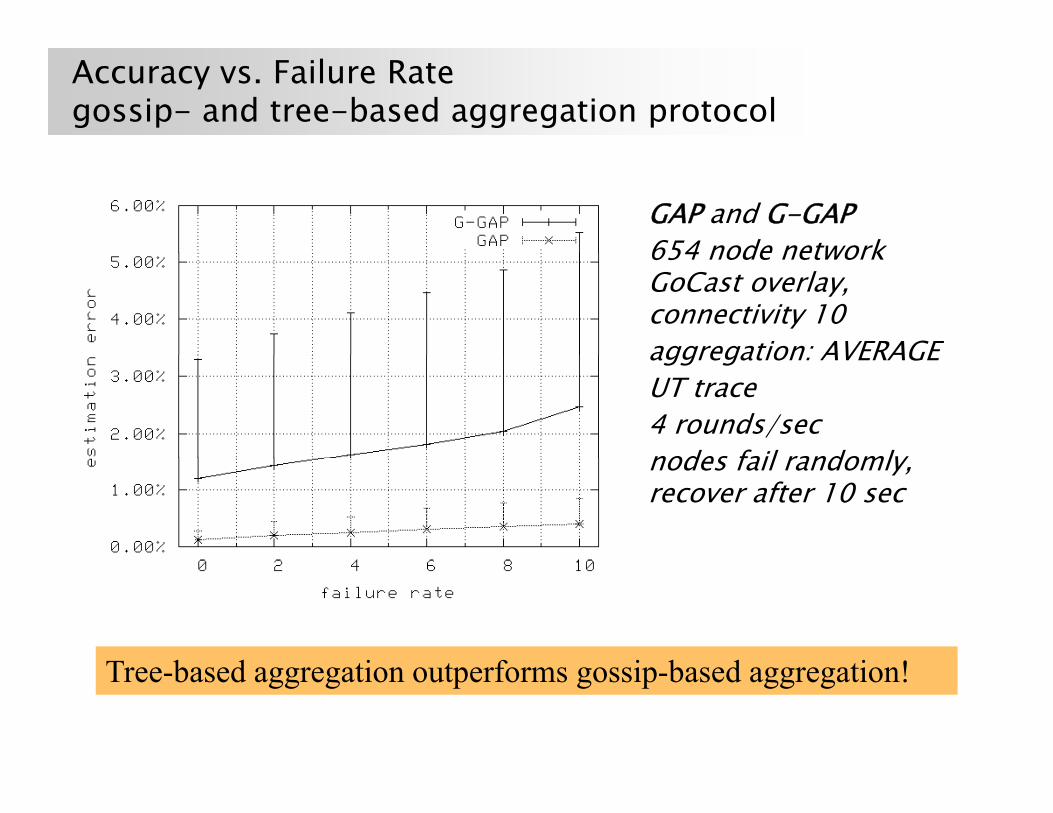
Accuracy vs. Failure Rategossip- and tree-based aggregation protocol
GAP and G-GAP654 node network654 node networkGoCast overlay, connectivity 10 aggregation: AVERAGEaggregation: AVERAGEUT trace4 rounds/secnodes fail randomlynodes fail randomly, recover after 10 sec
T b d ti t f i b d ti !Tree-based aggregation outperforms gossip-based aggregation!

N t k M t• Network Managements
• In-Network ManagementIn Network Management
• Case Study: Real-time Monitoring
• Will it happen?
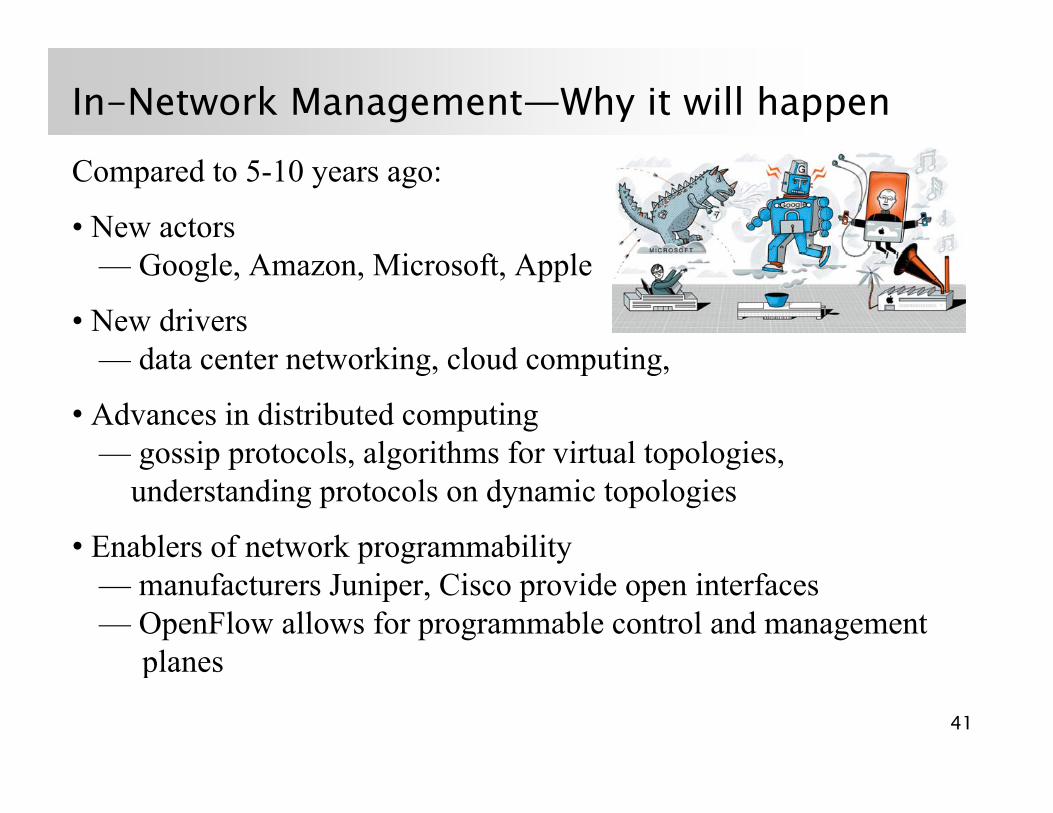
In-Network Management—Why it will happenCompared to 5-10 years ago:
• New actors— Google, Amazon, Microsoft, Apple
• New driversdata center networking cloud computing— data center networking, cloud computing,
• Advances in distributed computing— gossip protocols algorithms for virtual topologiesgossip protocols, algorithms for virtual topologies,
understanding protocols on dynamic topologies
• Enablers of network programmabilityp g y— manufacturers Juniper, Cisco provide open interfaces— OpenFlow allows for programmable control and management
planesplanes
41