In-hospital ICU Mortality Prediction Model€¦ · In-hospital Intensive Care Unit Mortality...
39
In-hospital Intensive Care Unit Mortality Prediction Model COMPUTING FOR DATA SCIENCES GROUP 6: MANASWI VELIGATLA (24), NEETI POKHARNA (27), ROBIN SINGH (36), SAURABH RAWAL (42)
Transcript of In-hospital ICU Mortality Prediction Model€¦ · In-hospital Intensive Care Unit Mortality...
In-hospital Intensive Care Unit Mortality Prediction ModelCOMPUTING FOR DATA SCIENCES
GROUP 6:
MANASWI VELIGATLA (24), NEETI POKHARNA (27),
ROBIN SINGH (36), SAURABH RAWAL (42)

Contents
Impact
Problem Statement
Methodology
Challenges and Steps to overcome
Implementation
Program structure
Results
Improvement steps
References

Impact
Problem Statement
Methodology
Challenges and Steps to overcome
Implementation
Program structure
Results
Improvement steps
References
CONCEPT
Using Artificial intelligence and predictive analytics in hospitals
Huge amount of data generated in hospitals
Concerns
High Reliability is required
Highly domain knowledge centric field - reflected in methodology also
IMPACTSaves LIFE
Focus resources on and only-on patients who need
Data backed decision making for Doctors
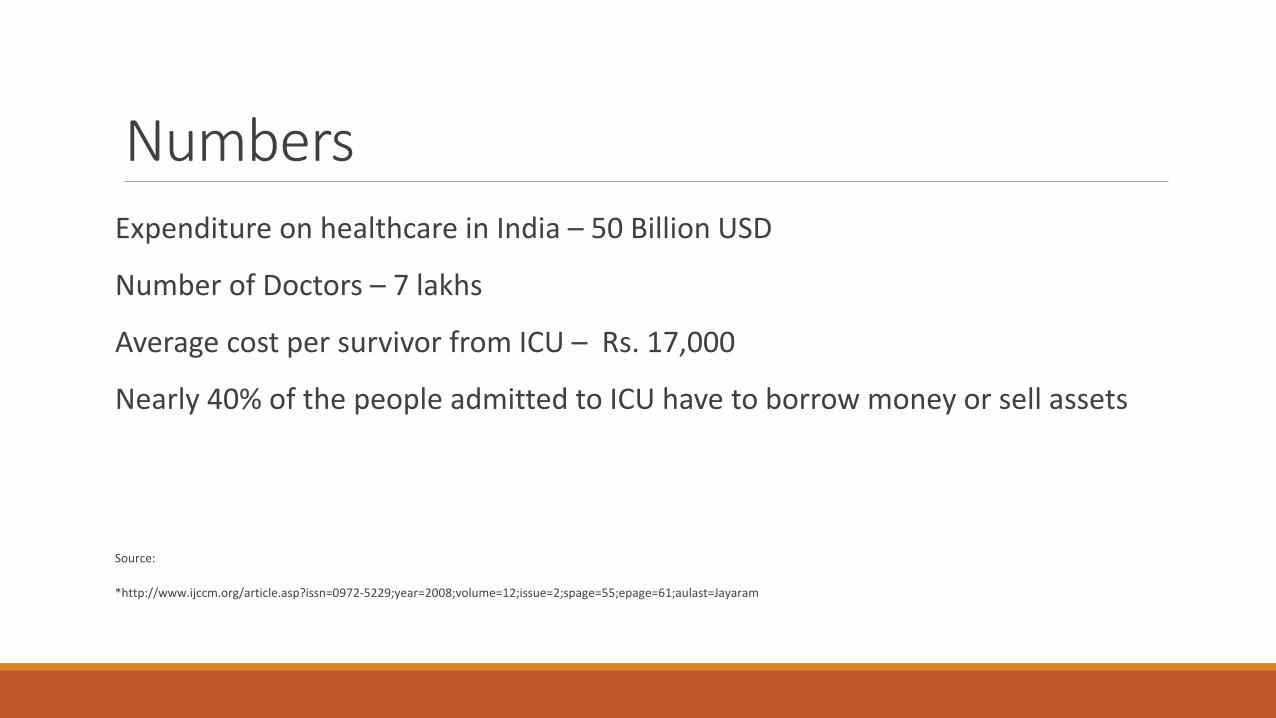
NumbersExpenditure on healthcare in India – 50 Billion USD
Number of Doctors – 7 lakhs
Average cost per survivor from ICU – Rs. 17,000
Nearly 40% of the people admitted to ICU have to borrow money or sell assets
Source:
*http://www.ijccm.org/article.asp?issn=0972-5229;year=2008;volume=12;issue=2;spage=55;epage=61;aulast=Jayaram

Impact
Problem Statement
Methodology
Challenges and Steps to overcome
Implementation
Program structure
Results
Improvement steps
References
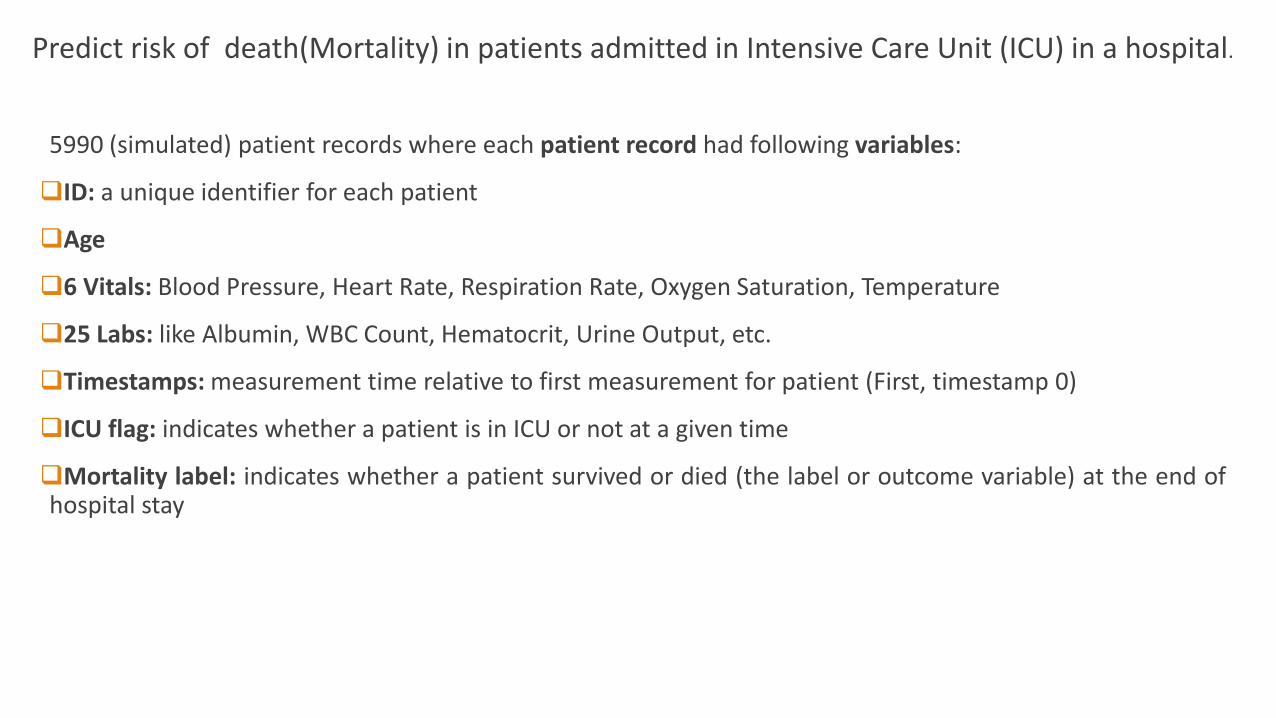
Predict risk of death(Mortality) in patients admitted in Intensive Care Unit (ICU) in a hospital.
5990 (simulated) patient records where each patient record had following variables:
ID: a unique identifier for each patient
Age
6 Vitals: Blood Pressure, Heart Rate, Respiration Rate, Oxygen Saturation, Temperature
25 Labs: like Albumin, WBC Count, Hematocrit, Urine Output, etc.
Timestamps: measurement time relative to first measurement for patient (First, timestamp 0)
ICU flag: indicates whether a patient is in ICU or not at a given time
Mortality label: indicates whether a patient survived or died (the label or outcome variable) at the end ofhospital stay
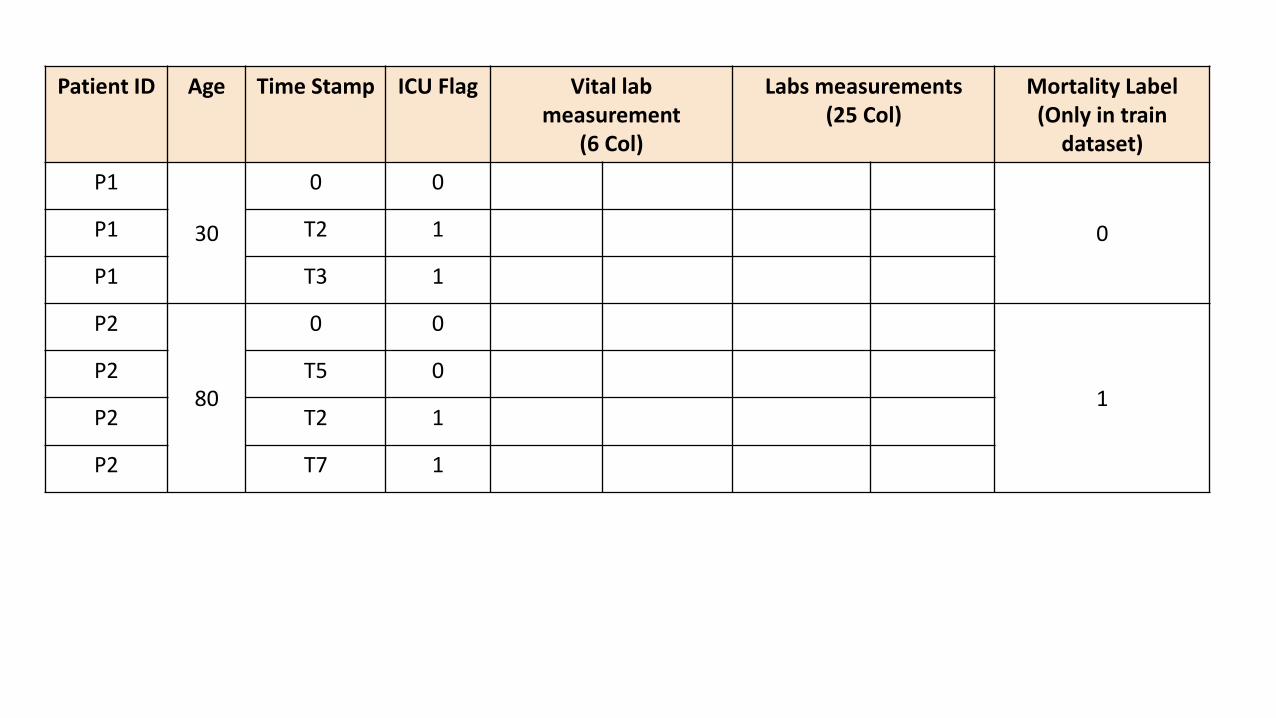
Patient ID Age Time Stamp ICU Flag Vital labmeasurement
(6 Col)
Labs measurements (25 Col)
Mortality Label(Only in train
dataset)
P1
30
0 0
0P1 T2 1
P1 T3 1
P2
80
0 0
1P2 T5 0
P2 T2 1
P2 T7 1
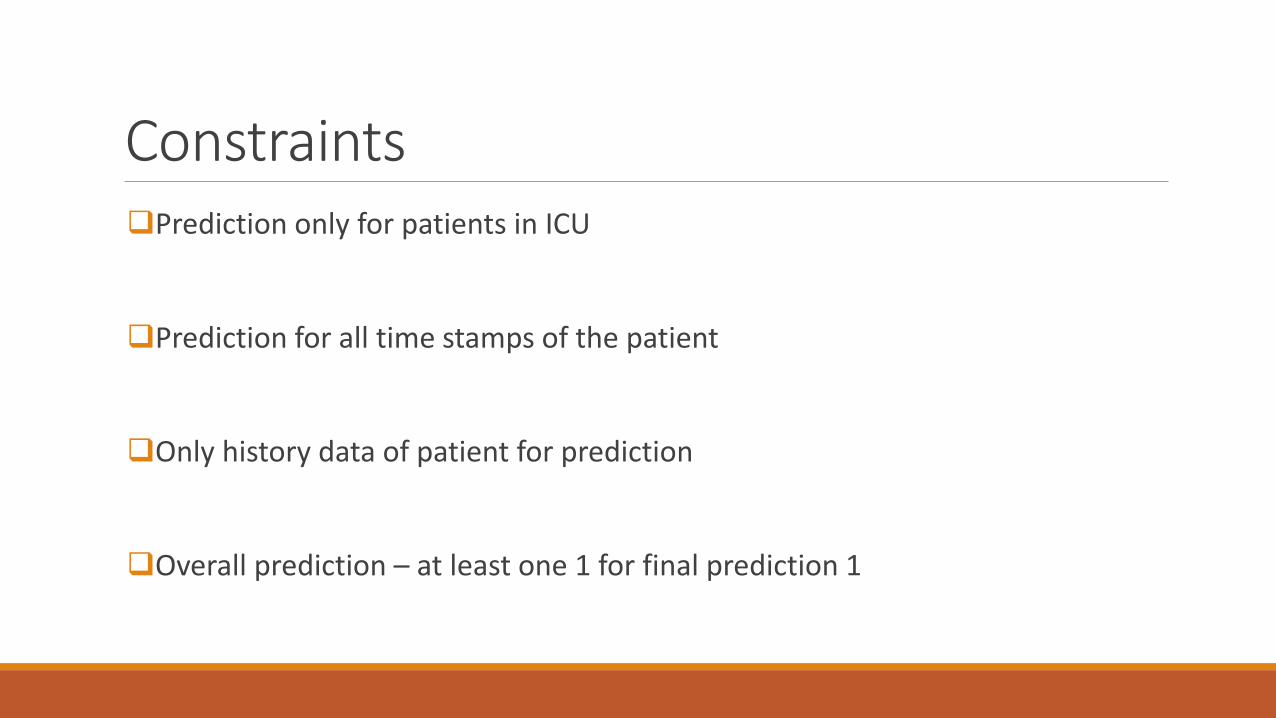
ConstraintsPrediction only for patients in ICU
Prediction for all time stamps of the patient
Only history data of patient for prediction
Overall prediction – at least one 1 for final prediction 1
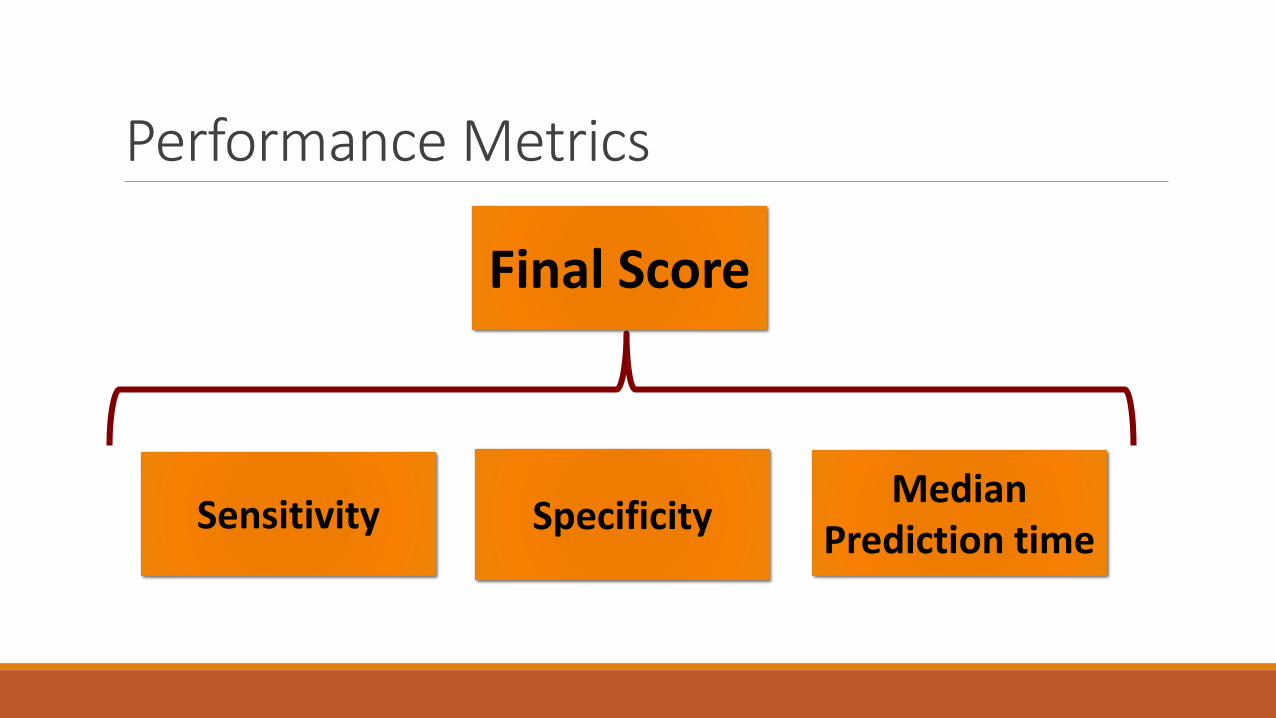
Performance Metrics
Final Score
Sensitivity SpecificityMedian
Prediction time
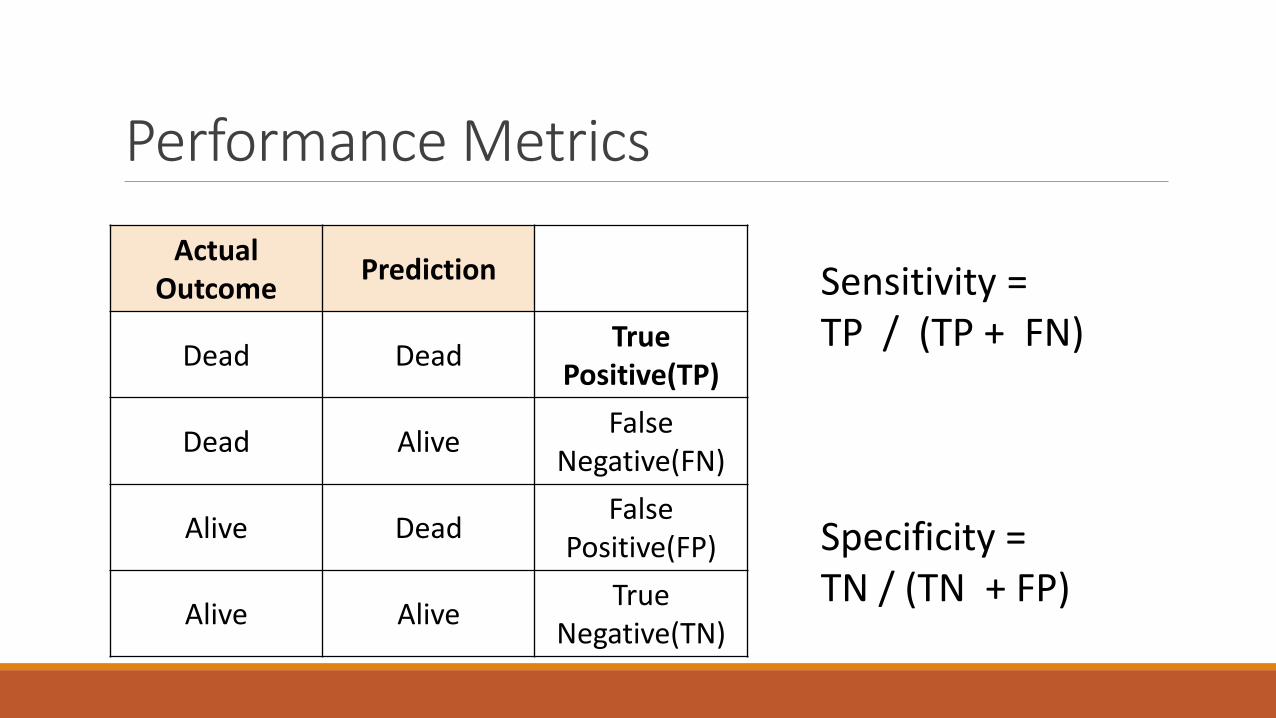
Performance Metrics
ActualOutcome
Prediction
Dead DeadTrue
Positive(TP)
Dead AliveFalse
Negative(FN)
Alive DeadFalse
Positive(FP)
Alive AliveTrue
Negative(TN)
Sensitivity = TP / (TP + FN)
Specificity = TN / (TN + FP)
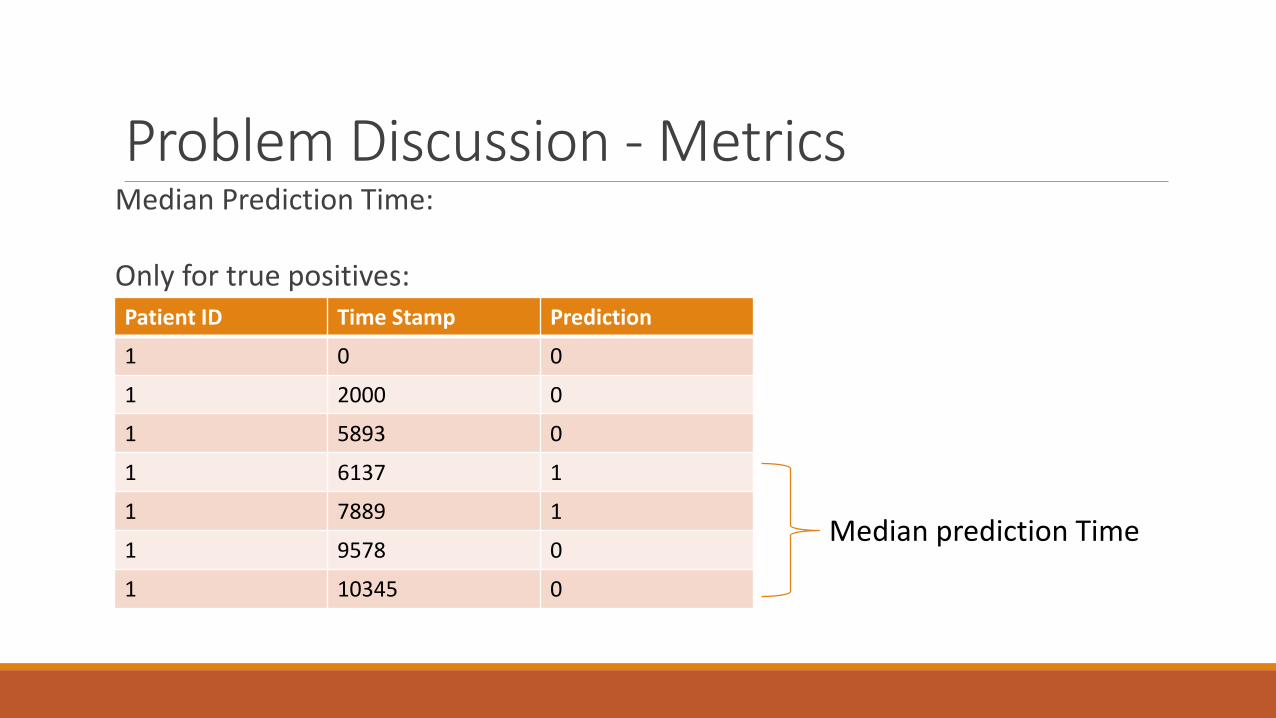
Problem Discussion - MetricsMedian Prediction Time:
Only for true positives:Patient ID Time Stamp Prediction
1 0 0
1 2000 0
1 5893 0
1 6137 1
1 7889 1
1 9578 0
1 10345 0
Median prediction Time
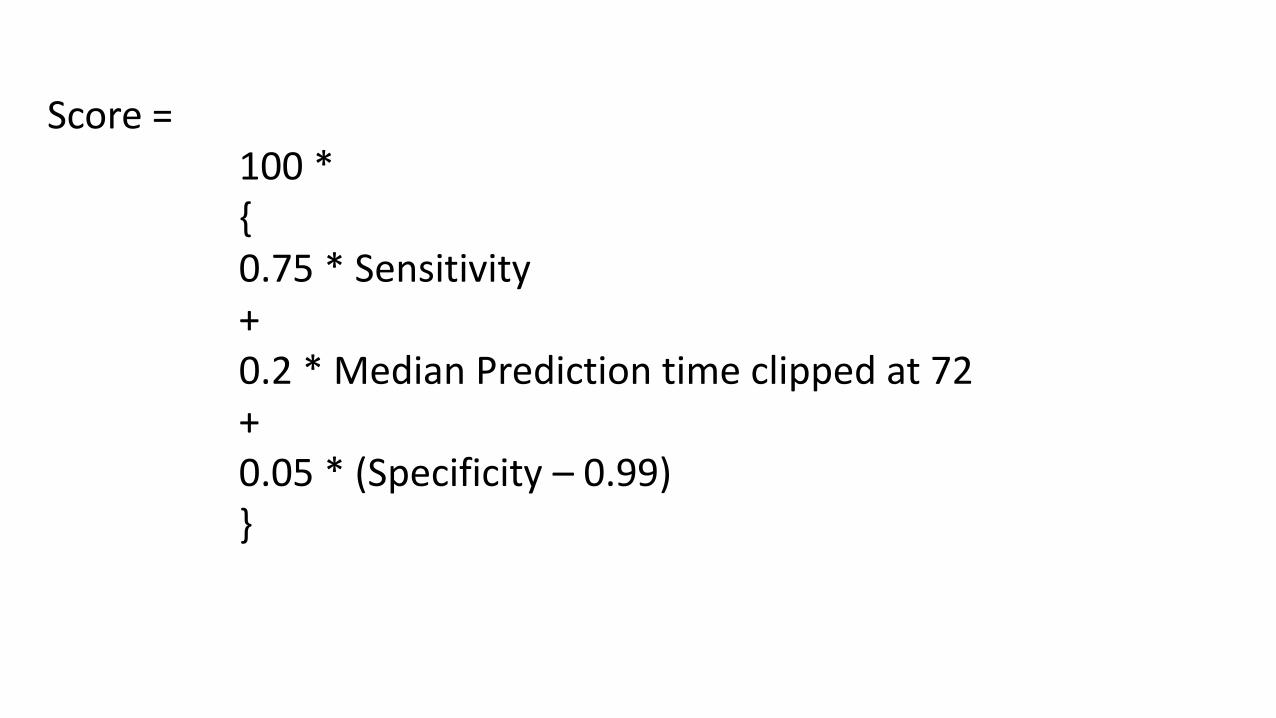
Score = 100 *{0.75 * Sensitivity +0.2 * Median Prediction time clipped at 72+0.05 * (Specificity – 0.99) }

Impact
Problem Statement
Methodology
Challenges and Steps to overcome
Implementation
Program structure
Results
Improvement steps
References
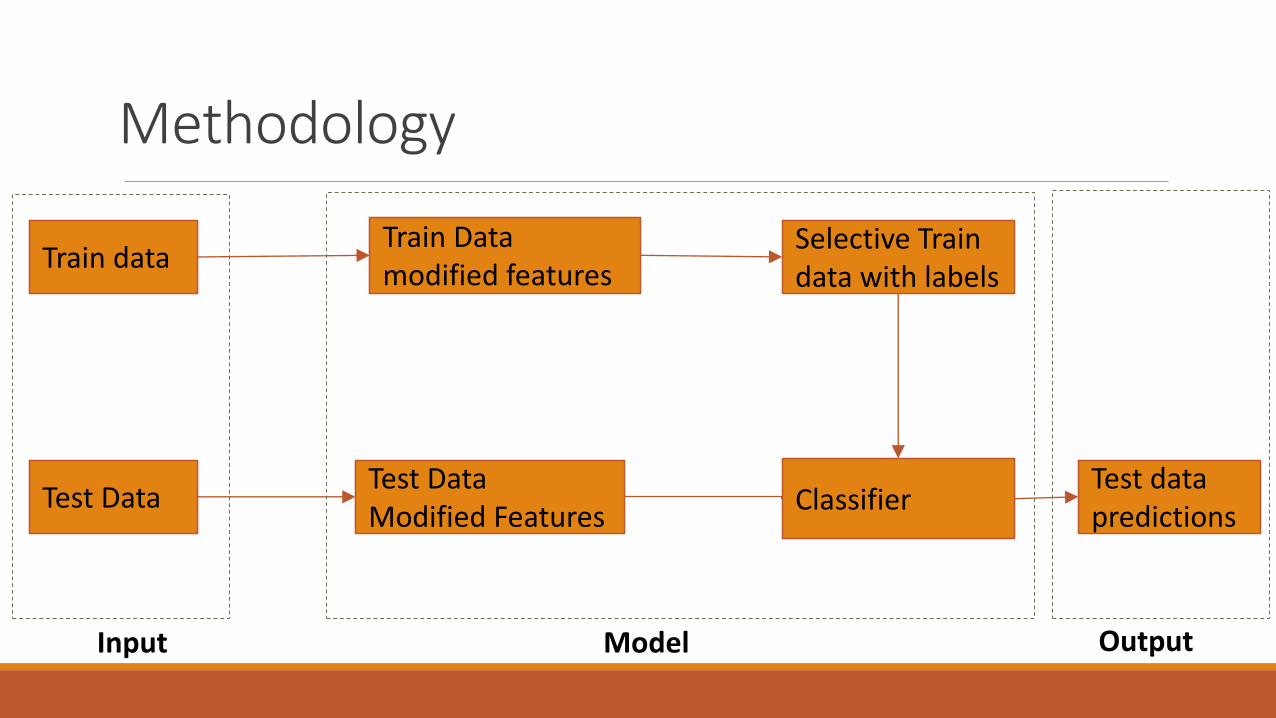
Methodology
Train data
Test Data
Train Data modified features
Selective Train data with labels
Test Data Modified Features
ClassifierTest data predictions
Input Model Output
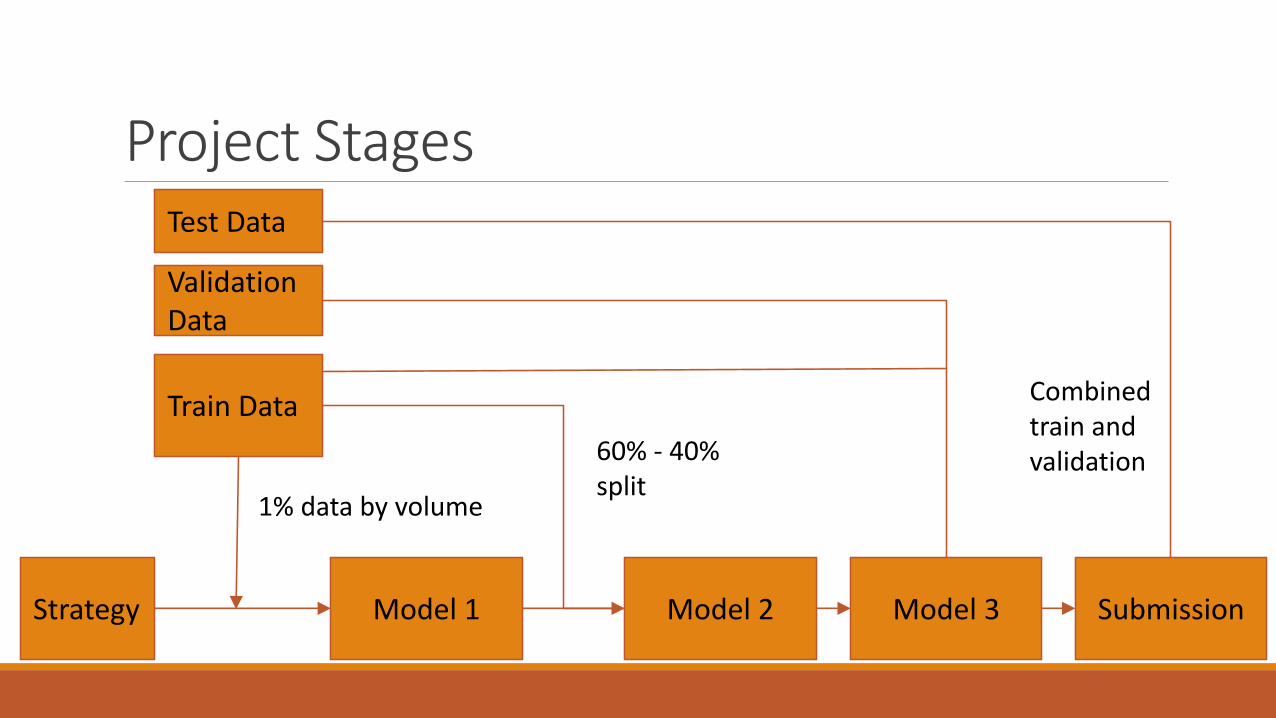
Project StagesTest Data
Validation Data
Train Data
Strategy Model 1 Model 3 Submission
60% - 40% split
Combined train and validation
1% data by volume
Model 2

Impact
Problem Statement
Methodology
Challenges and Steps to overcome
Implementation
Program structure
Results
Improvement steps
References
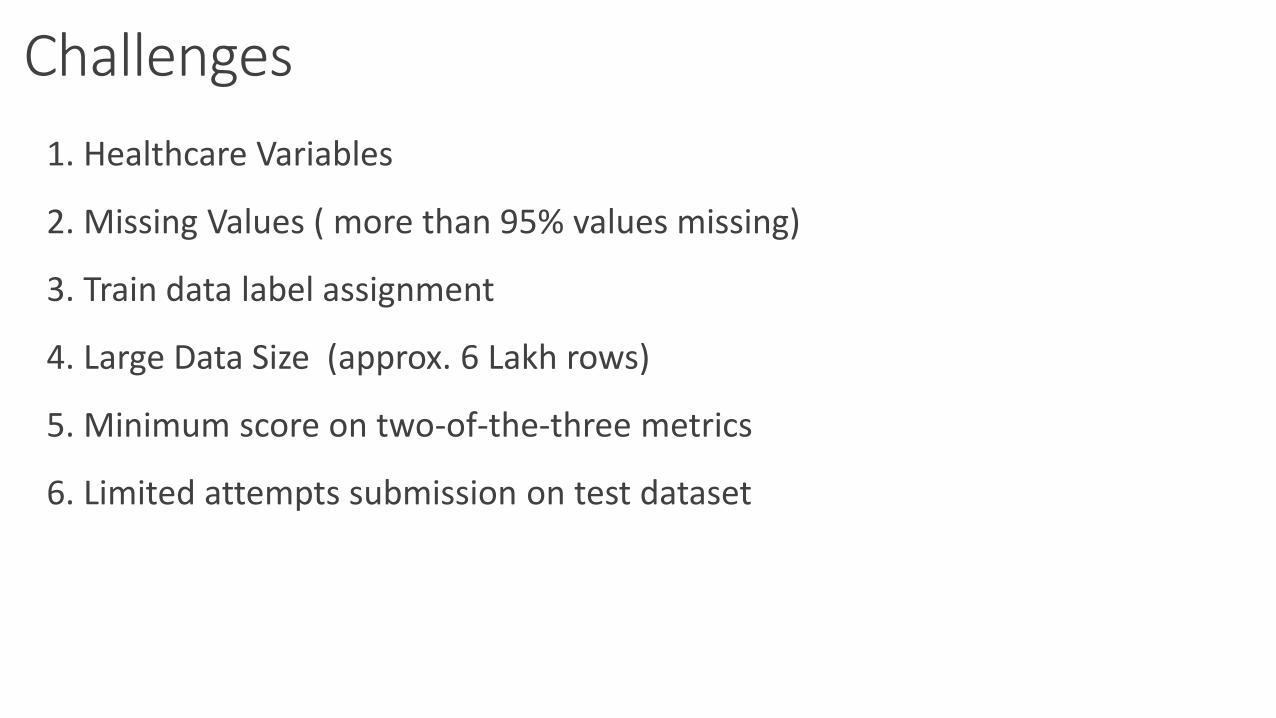
Challenges
1. Healthcare Variables
2. Missing Values ( more than 95% values missing)
3. Train data label assignment
4. Large Data Size (approx. 6 Lakh rows)
5. Minimum score on two-of-the-three metrics
6. Limited attempts submission on test dataset
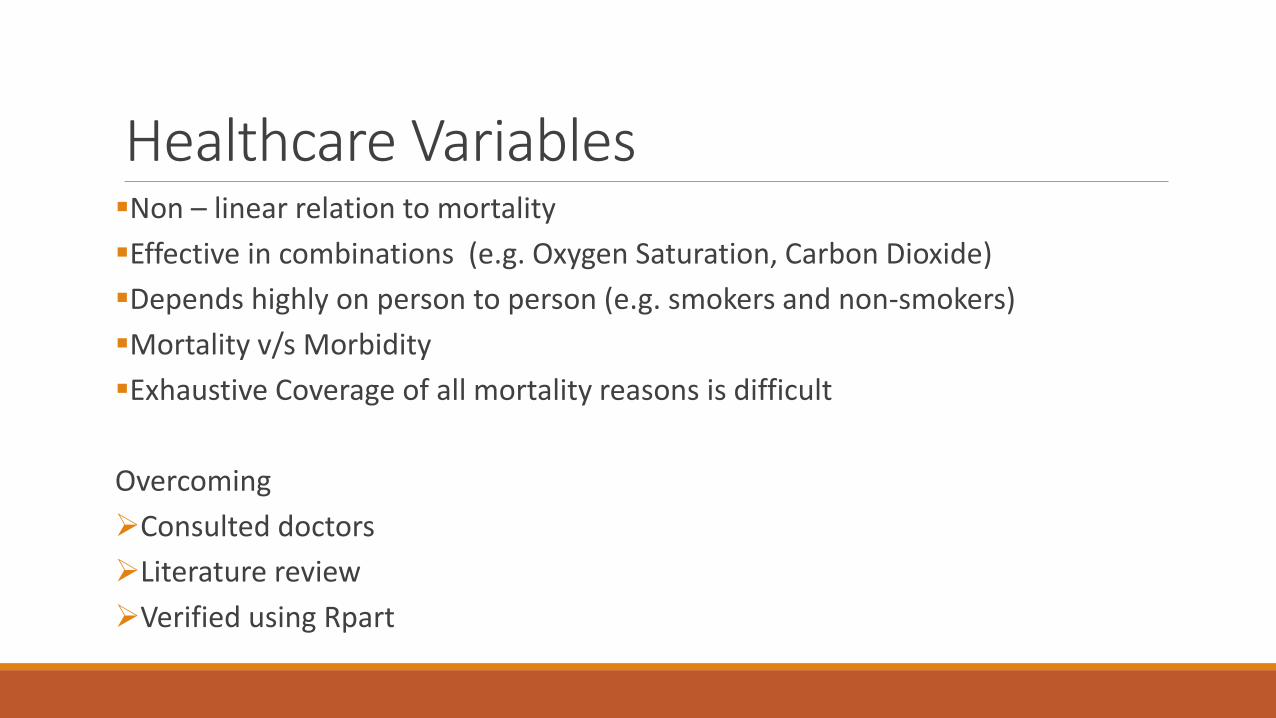
Healthcare VariablesNon – linear relation to mortality
Effective in combinations (e.g. Oxygen Saturation, Carbon Dioxide)
Depends highly on person to person (e.g. smokers and non-smokers)
Mortality v/s Morbidity
Exhaustive Coverage of all mortality reasons is difficult
Overcoming
Consulted doctors
Literature review
Verified using Rpart

Missing ValuesMore than 95% data missing
Data missing for different time stamps for the same patient
For every patient-timestamp{
for every feature{if current value is missing{
fill with worst value in last 24 hourselse : fill with worst value since ICU entryelse : fill with worst value since hospital entryelse : fill with the normal value for the feature}
} }
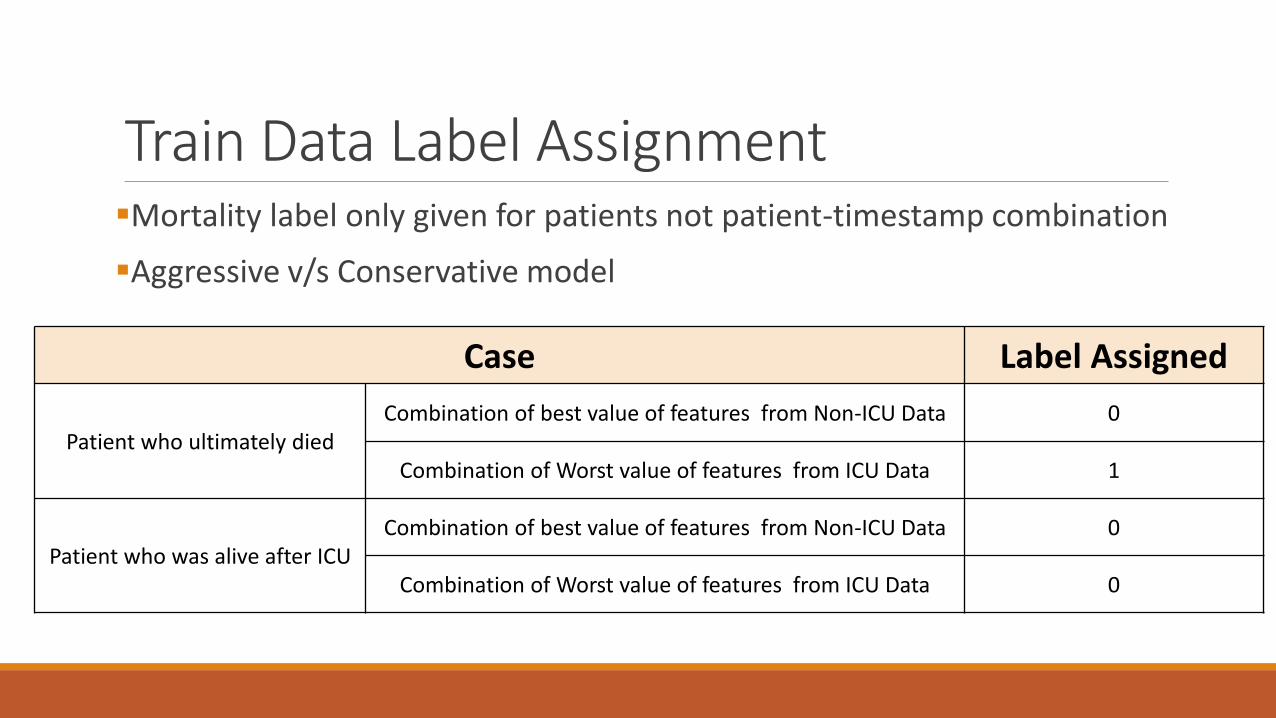
Train Data Label AssignmentMortality label only given for patients not patient-timestamp combination
Aggressive v/s Conservative model
Case Label Assigned
Patient who ultimately diedCombination of best value of features from Non-ICU Data 0
Combination of Worst value of features from ICU Data 1
Patient who was alive after ICUCombination of best value of features from Non-ICU Data 0
Combination of Worst value of features from ICU Data 0
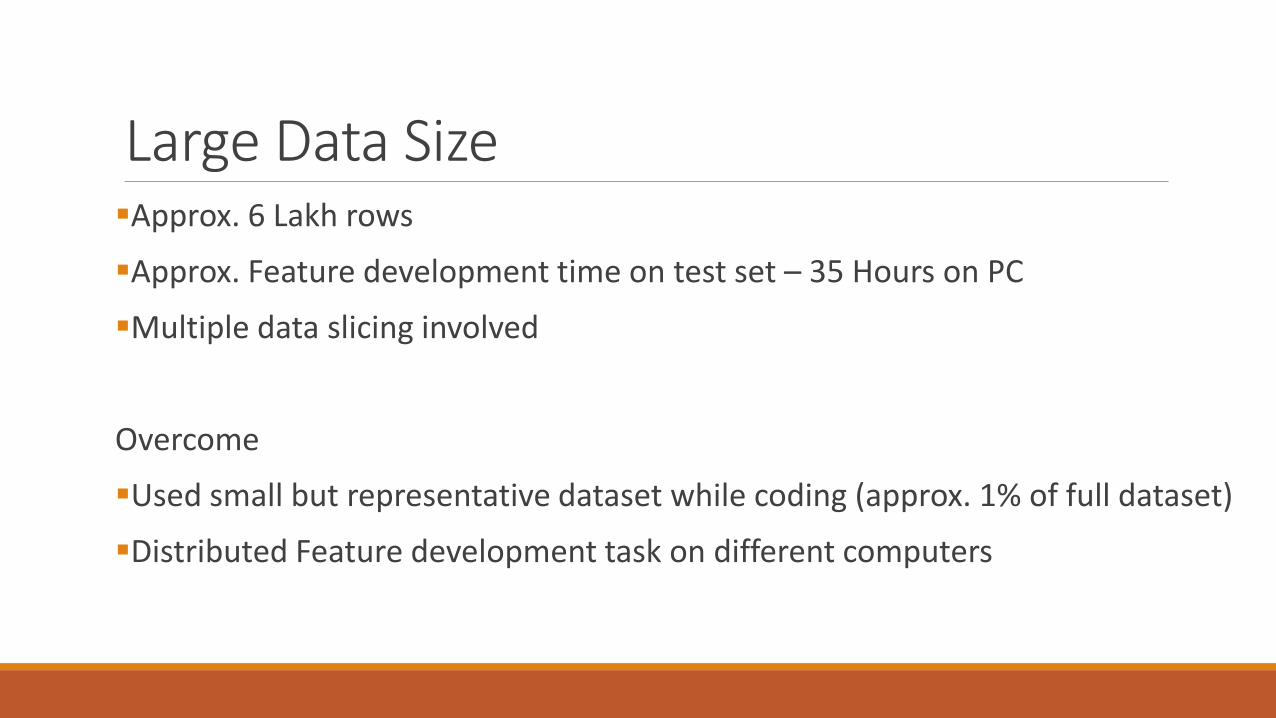
Large Data SizeApprox. 6 Lakh rows
Approx. Feature development time on test set – 35 Hours on PC
Multiple data slicing involved
Overcome
Used small but representative dataset while coding (approx. 1% of full dataset)
Distributed Feature development task on different computers
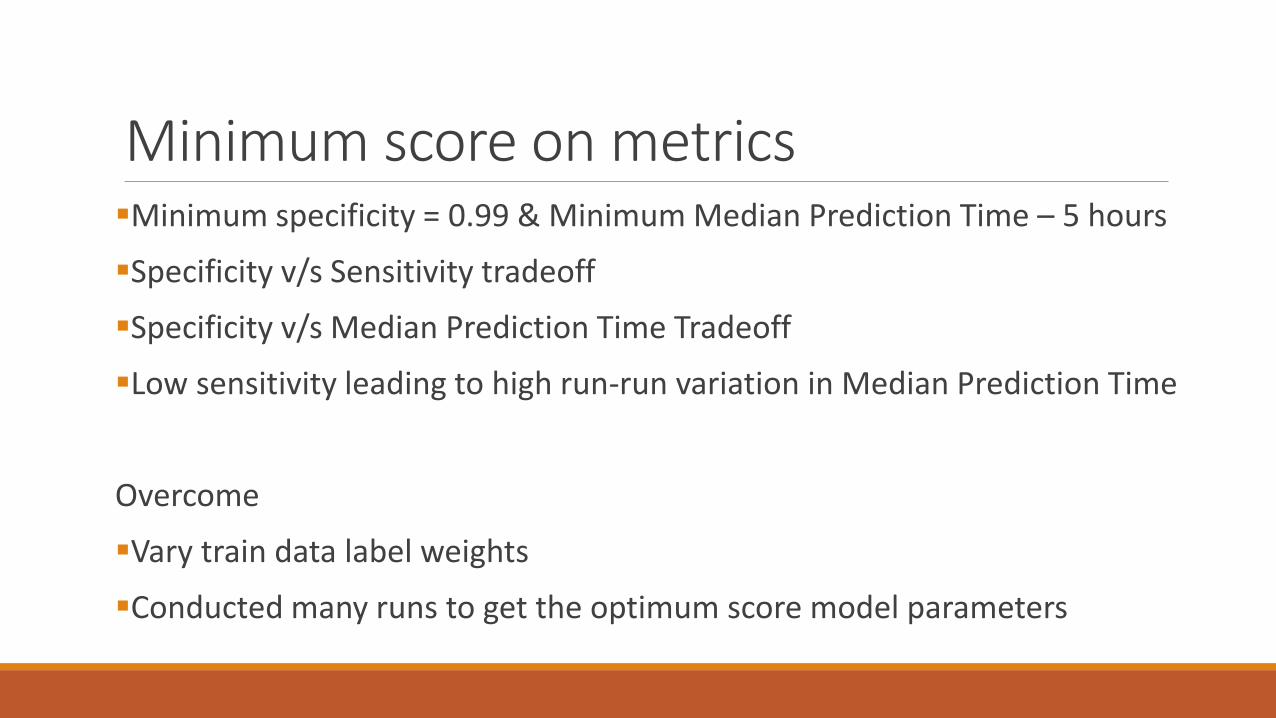
Minimum score on metricsMinimum specificity = 0.99 & Minimum Median Prediction Time – 5 hours
Specificity v/s Sensitivity tradeoff
Specificity v/s Median Prediction Time Tradeoff
Low sensitivity leading to high run-run variation in Median Prediction Time
Overcome
Vary train data label weights
Conducted many runs to get the optimum score model parameters
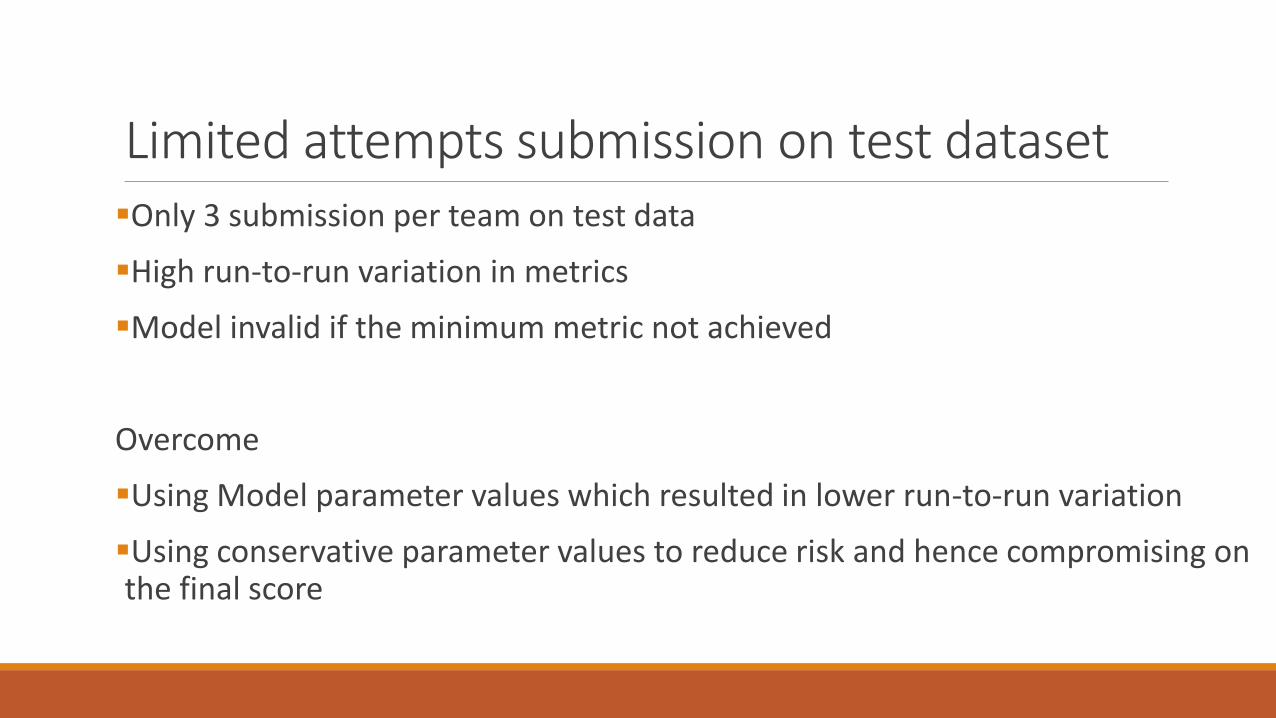
Limited attempts submission on test datasetOnly 3 submission per team on test data
High run-to-run variation in metrics
Model invalid if the minimum metric not achieved
Overcome
Using Model parameter values which resulted in lower run-to-run variation
Using conservative parameter values to reduce risk and hence compromising on the final score

Impact
Problem Statement
Methodology
Challenges and Steps to overcome
Implementation
Program structure
Results
Improvement steps
References
ImplementationLanguage – Python, R
Packages - numpy, pandas, Scikit-learn, os, csv, rpart, e1071
Some important functions - merge, subset, rpart, crossValidation, RandomForestClassifier, KNeighborsClassifier, svm

Impact
Problem Statement
Methodology
Challenges and Steps to overcome
Implementation
Program structure
Results
Improvement steps
References
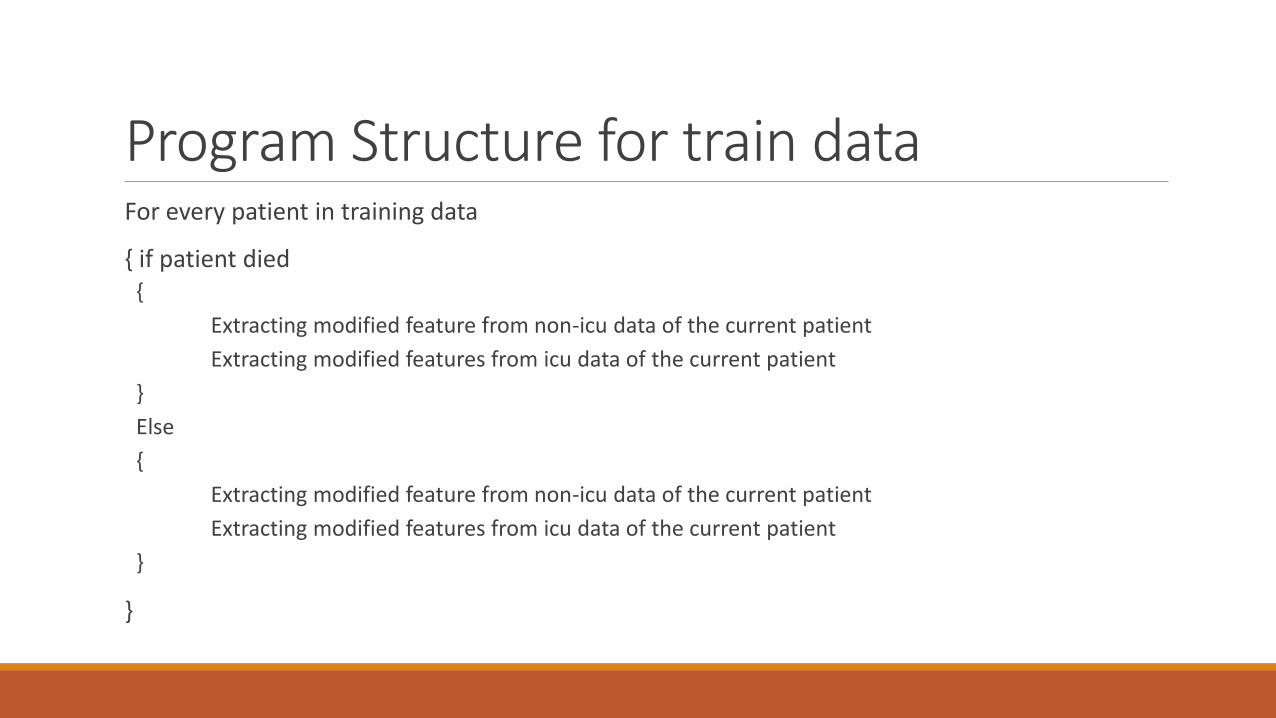
Program Structure for train dataFor every patient in training data
{ if patient died {
Extracting modified feature from non-icu data of the current patient
Extracting modified features from icu data of the current patient
}
Else
{
Extracting modified feature from non-icu data of the current patient
Extracting modified features from icu data of the current patient
}
}
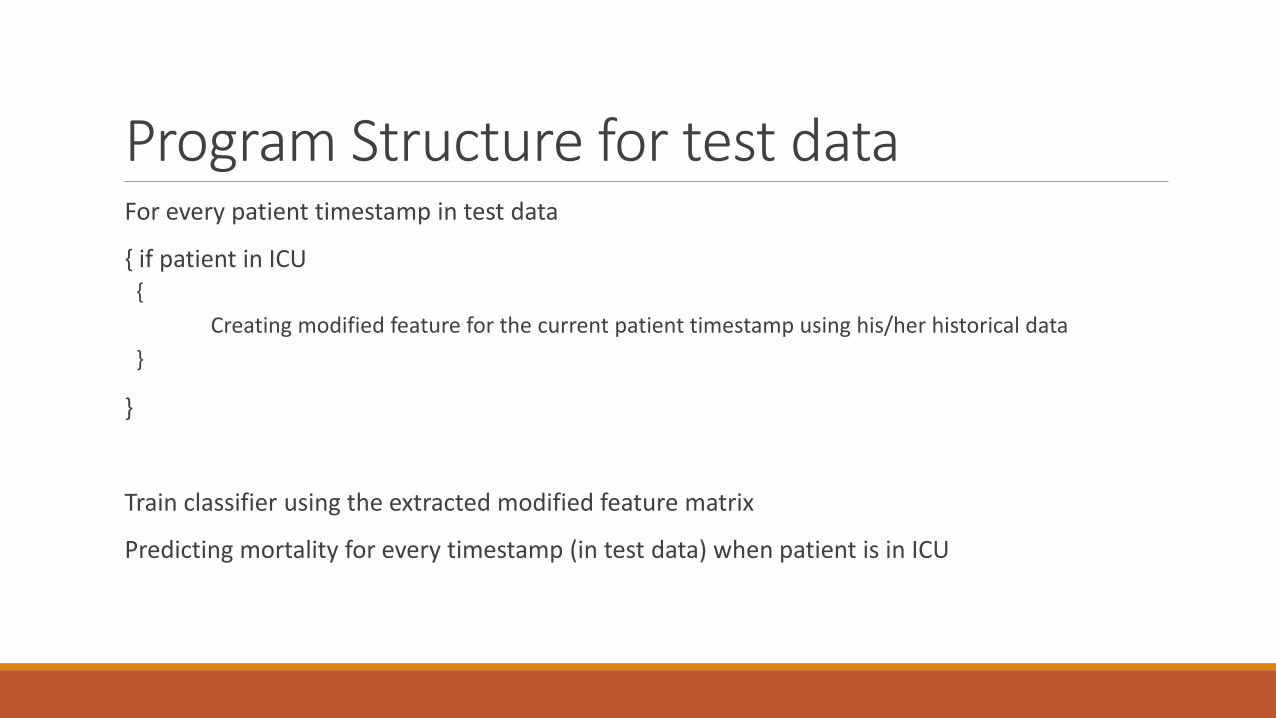
Program Structure for test data For every patient timestamp in test data
{ if patient in ICU{
Creating modified feature for the current patient timestamp using his/her historical data
}
}
Train classifier using the extracted modified feature matrix
Predicting mortality for every timestamp (in test data) when patient is in ICU
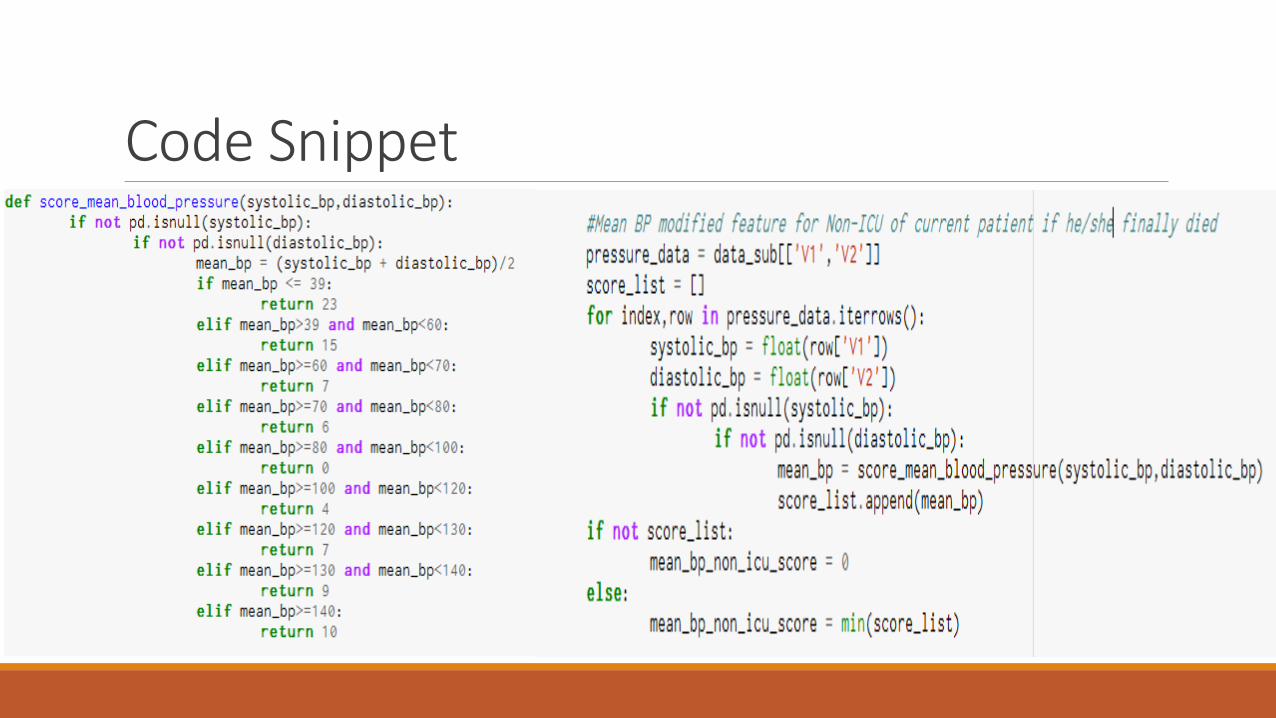
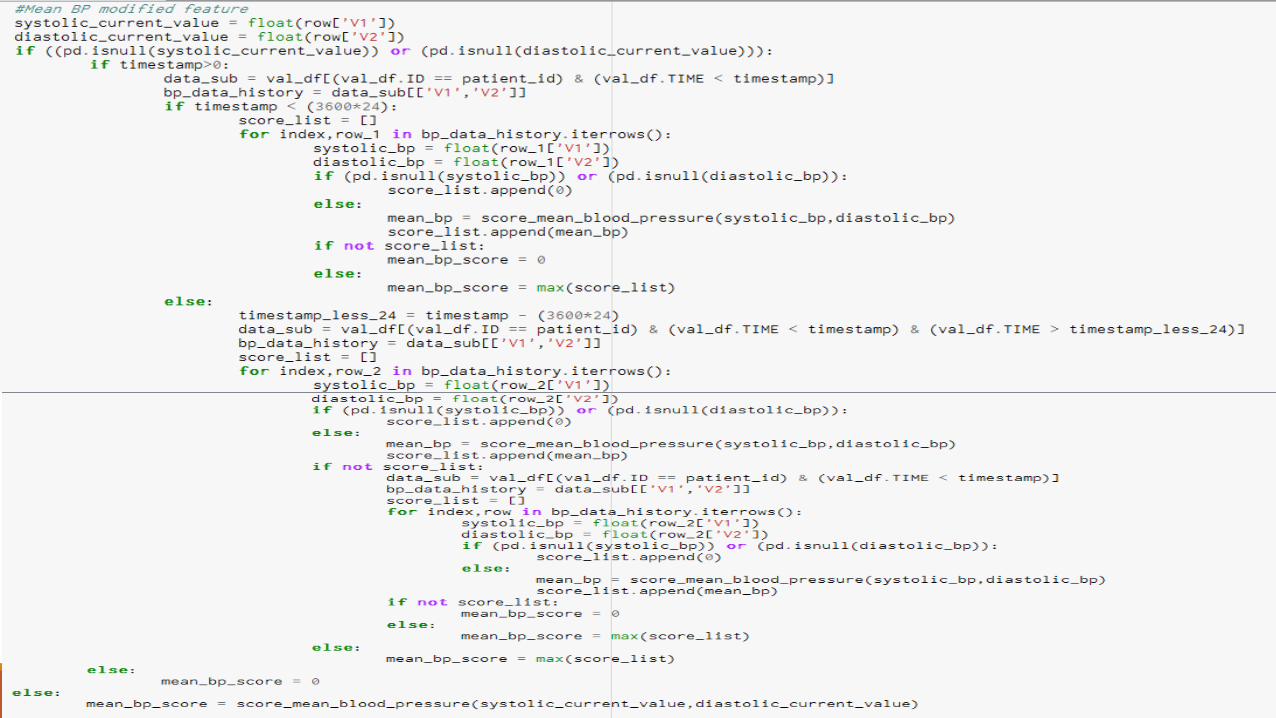
Code Snippet

Impact
Problem Statement
Methodology
Challenges and Steps to overcome
Implementation
Program structure
Results
Improvement steps
References

Results
• Better results with Random Forest Classifier than KNN and SVM

Impact
Problem Statement
Methodology
Challenges and Steps to overcome
Implementation
Program structure
Results
Improvement steps
References
Improvement StepsDifferent classifiers; tweaking depth and sample weight
KNN - lower run to run variance Vs Random forest - higher median prediction
time
Added train and validation data as training data for prediction on test data

Impact
Problem Statement
Methodology
Challenges and Steps to overcome
Implementation
Program structure
Results
Improvement steps
References
ReferencesLiterature• Published approaches from Physionet challenge 2012• National Centre for Biotechnology Information (NCBI)• Journal of intensive care
Doctors consulted• Dr. Priyanka Singh• Dr. Tejaswi• Dr. Ram Kiran
www.stackoverflow.com
Hackerrank Discussion forum
Discussions with classmates (Pradeep Mooda, Avinash Kumar)
Lord Google

Questions?